Embed Size (px)
Citation preview

8/14/2019 ELLIS COUNTY - Maypearl ISD - 2004 Texas School Survey of Drug and Alcohol Use
http://slidepdf.com/reader/full/ellis-county-maypearl-isd-2004-texas-school-survey-of-drug-and-alcohol 1/90

8/14/2019 ELLIS COUNTY - Maypearl ISD - 2004 Texas School Survey of Drug and Alcohol Use
http://slidepdf.com/reader/full/ellis-county-maypearl-isd-2004-texas-school-survey-of-drug-and-alcohol 2/90
MaypearlSpring 2004
________________________________________________________________________________
Table T-1: How recently, if ever, have you used ..
Past School Ever NeverMonth Year Used Used
________________________________________________________________________________Any tobacco product All 14.7% 18.2% 36.6% 63.4%
Grades 7-8 4.7% 7.2% 22.9% 77.1%Grades 9-12 19.9% 23.9% 43.7% 56.3%
________________________________________________________________________________Cigarettes All 14.0% 17.8% 35.1% 64.9%
Grades 7-8 3.3% 5.9% 21.8% 78.2%Grades 9-12 19.4% 23.9% 41.9% 58.1%
________________________________________________________________________________Smokeless tobacco All 3.2% 3.2% 10.3% 89.7%
Grades 7-8 2.4% 5.6% 7.2% 92.8%Grades 9-12 3.6% 9.2% 19.0% 81.0%
________________________________________________________________________________
Table T-2: How often do you normally use ..
Any tobacco product?
Several Several About About Less ThanNever Every Times Times Once a Once a Once aUsed Day a Week a Month Month Year Year
All 68.1% 5.1% 2.1% 3.8% 6.6% 5.3% 9.1%Grades 7-8 85.3% * % 0.9% 2.4% 2.5% 4.1% 4.8%Grades 9-12 59.2% 7.7% 2.7% 4.5% 8.7% 5.9% 11.3%
Cigarettes?
Several Several About About Less ThanNever Every Times Times Once a Once a Once a
Used Day a Week a Month Month Year Year
All 70.5% 5.1% 1.8% 3.9% 6.1% 4.4% 8.3%Grades 7-8 86.7% * % 0.9% 2.5% 1.8% 4.1% 4.1%Grades 9-12 62.2% 7.7% 2.3% 4.6% 8.3% 4.5% 10.4%
Smokeless tobacco?
Several Several About About Less ThanNever Every Times Times Once a Once a Once aUsed Day a Week a Month Month Year Year
All 90.8% * % 0.6% * % 0.9% 2.2% 5.5%Grades 7-8 96.5% * % 0.9% * % 0.8% * % 1.7%Grades 9-12 88.0% * % 0.5% * % 0.9% 3.2% 7.3%

8/14/2019 ELLIS COUNTY - Maypearl ISD - 2004 Texas School Survey of Drug and Alcohol Use
http://slidepdf.com/reader/full/ellis-county-maypearl-isd-2004-texas-school-survey-of-drug-and-alcohol 3/90
MaypearlSpring 2004
________________________________________________________________________________
Table T-3: In the past 30 days, how many cigarettes have you smoked?
>1 But >10 But >1 Pack<1 Per <10 Per <1 Pack But <2 >2 Packs
None Day Day Per Day Packs/Day Per Day
All 83.7% 9.3% 4.6% 1.5% 0.9% * %Grades 7-8 94.3% 4.0% 1.6% * % * % * %Grades 9-12 78.4% 11.9% 6.2% 2.2% 1.3% * %
________________________________________________________________________________
Table T-4: Average age of first use of:
Grades 7-8 Grades 9-12
Tobacco 11.2 12.9
________________________________________________________________________________
Table T-5: If you wanted some, how difficult would it be to get...
Cigarettes?
Never Very Somewhat Somewhat VeryHeard Of Impossible Difficult Difficult Easy Easy
All 7.9% 17.5% 6.4% 9.5% 16.7% 42.0%Grades 7-8 9.2% 37.4% 11.2% 9.5% 13.1% 19.6%Grades 9-12 7.2% 7.7% 4.1% 9.5% 18.5% 53.0%
Smokeless Tobacco?
Never Very Somewhat Somewhat VeryHeard Of Impossible Difficult Difficult Easy Easy
All 19.0% 18.6% 8.0% 9.2% 12.9% 32.4%Grades 7-8 25.5% 35.3% 14.7% 4.4% 5.4% 14.5%Grades 9-12 15.7% 10.2% 4.6% 11.6% 16.6% 41.2%
________________________________________________________________________________
Table T-6: About how many of your close friends...
Use any tobacco product?
Never heardNone A Few Some Most All
All 40.5% 32.1 % 15.1% 9.7% 2.6%Grades 7-8 67.8% 19.3 % 4.9% 7.2% 0.8%Grades 9-12 26.5% 38.7 % 20.4% 11.0% 3.5%

8/14/2019 ELLIS COUNTY - Maypearl ISD - 2004 Texas School Survey of Drug and Alcohol Use
http://slidepdf.com/reader/full/ellis-county-maypearl-isd-2004-texas-school-survey-of-drug-and-alcohol 4/90
MaypearlSpring 2004
________________________________________________________________________________
Smoke cigarettes?
Never heardNone A Few Some Most All
All 40.2% 32.8 % 15.0% 9.7% 2.4%Grades 7-8 68.7% 18.6 % 5.1% 6.7% 0.9%Grades 9-12 26.1% 39.8 % 19.8% 11.1% 3.1%
Use a smokeless tobacco product?
Never heardNone A Few Some Most All
All 75.4% 17.0 % 5.5% 0.9% 1.2%Grades 7-8 89.6% 7.8 % * % 1.7% 0.9%Grades 9-12 68.6% 21.5 % 8.2% 0.5% 1.3%
________________________________________________________________________________
Table T-7: How do your parents feel about kids your age smoking cigarettes?
Strongly Mildly Mildly Strongly Don'tDisapprove Disapprove Neither Approve Approve Know
All 74.8% 9.7% 6.9% 1.6% 1.2% 5.8%Grades 7-8 79.0% 6.3% 7.5% * % 0.9% 6.3%Grades 9-12 72.8% 11.2% 6.6% 2.3% 1.4% 5.6%
________________________________________________________________________________
Table T-8: How dangerous do you think it is for kids your age to use tobacco?
Very Somewhat Not Very Not at All Do NotDangerous Dangerous Dangerous Dangerous Know
All 49.0% 30.8% 13.4% 2.8% 4.0%Grades 7-8 75.4% 15.8% 7.1% * % 1.7%Grades 9-12 36.2% 38.0% 16.5% 4.1% 5.1%

8/14/2019 ELLIS COUNTY - Maypearl ISD - 2004 Texas School Survey of Drug and Alcohol Use
http://slidepdf.com/reader/full/ellis-county-maypearl-isd-2004-texas-school-survey-of-drug-and-alcohol 5/90

8/14/2019 ELLIS COUNTY - Maypearl ISD - 2004 Texas School Survey of Drug and Alcohol Use
http://slidepdf.com/reader/full/ellis-county-maypearl-isd-2004-texas-school-survey-of-drug-and-alcohol 6/90
MaypearlSpring 2004
________________________________________________________________________________
Table A-1: How recently, if ever, have you used...
Past School Ever NeverMonth Year Used Used
________________________________________________________________________________Any alcohol product All 25.3% 34.4% 61.8% 38.2%
Grades 7-8 15.3% 20.1% 53.4% 46.6%Grades 9-12 30.4% 41.7% 66.0% 34.0%
________________________________________________________________________________Beer All 18.1% 23.4% 47.7% 52.3%
Grades 7-8 8.1% 10.6% 38.4% 61.6%Grades 9-12 23.2% 29.8% 52.4% 47.6%
________________________________________________________________________________Wine coolers All 13.7% 23.0% 44.8% 55.2%
Grades 7-8 10.8% 16.7% 31.7% 68.3%Grades 9-12 15.1% 26.1% 51.3% 48.7%
________________________________________________________________________________Wine All 11.1% 19.3% 40.8% 59.2%
Grades 7-8 7.5% 10.0% 28.7% 71.3%Grades 9-12 12.9% 24.0% 46.8% 53.2%________________________________________________________________________________Liquor All 17.0% 24.6% 43.0% 57.0%
Grades 7-8 7.4% 9.0% 25.3% 74.7%Grades 9-12 21.8% 32.4% 51.9% 48.1%
________________________________________________________________________________
Table A-2: How often do you normally use...
Any alcohol product?
Several Several About About Less ThanNever Every Times Times Once a Once a Once aUsed Day a Week a Month Month Year Year
All 46.7% * % 4.9% 10.5% 11.5% 12.7% 13.7%Grades 7-8 63.3% * % 4.1% 1.7% 6.8% 10.9% 13.2%Grades 9-12 38.3% * % 5.4% 14.9% 13.9% 13.6% 14.0%
Beer?
Several Several About About Less ThanNever Every Times Times Once a Once a Once aUsed Day a Week a Month Month Year Year
All 55.5% * % 2.4% 9.3% 9.5% 8.8% 14.5%Grades 7-8 69.2% * % 1.7% 0.8% 7.3% 7.0% 14.0%Grades 9-12 48.8% * % 2.8% 13.4% 10.6% 9.7% 14.7%
Wine coolers?
Several Several About About Less Than
Never Every Times Times Once a Once a Once aUsed Day a Week a Month Month Year Year
All 60.2% * % 2.1% 4.3% 9.1% 12.1% 12.2%Grades 7-8 76.2% * % 0.9% 0.8% 4.5% 13.2% 4.4%Grades 9-12 52.3% * % 2.7% 6.0% 11.4% 11.5% 16.0%

8/14/2019 ELLIS COUNTY - Maypearl ISD - 2004 Texas School Survey of Drug and Alcohol Use
http://slidepdf.com/reader/full/ellis-county-maypearl-isd-2004-texas-school-survey-of-drug-and-alcohol 7/90
MaypearlSpring 2004
________________________________________________________________________________
Wine?
Several Several About About Less ThanNever Every Times Times Once a Once a Once aUsed Day a Week a Month Month Year Year
All 60.4% * % 0.9% 2.5% 10.1% 11.2% 14.9%Grades 7-8 76.4% * % * % * % 5.3% 10.6% 7.7%Grades 9-12 52.4% * % 1.3% 3.7% 12.5% 11.5% 18.5%
Liquor?
Several Several About About Less ThanNever Every Times Times Once a Once a Once aUsed Day a Week a Month Month Year Year
All 59.8% * % 2.1% 9.3% 9.9% 8.7% 10.2%Grades 7-8 82.3% * % 1.8% 2.6% 3.6% 4.4% 5.3%
Grades 9-12 48.7% * % 2.3% 12.6% 13.0% 10.8% 12.6%
________________________________________________________________________________
Table A-3: When you drink the following alcoholic beverages, how many drinks doyou usually have at one time, on average?
Beer
Never Ever 5 or More 1 to 4 Less Than 1
All 53.9% 46.1% 12.0% 19.0% 15.1%Grades 7-8 66.4% 33.6% 0.9% 16.1% 16.6%Grades 9-12 47.7% 52.3% 17.6% 20.4% 14.4%
Wine Coolers
Never Ever 5 or More 1 to 4 Less Than 1
All 56.2% 43.8% 10.9% 21.0% 11.9%Grades 7-8 69.8% 30.2% 6.2% 14.3% 9.6%Grades 9-12 49.5% 50.5% 13.2% 24.3% 12.9%
Wine
Never Ever 5 or More 1 to 4 Less Than 1
All 60.4% 39.6% 2.8% 20.2% 16.7%Grades 7-8 74.0% 26.0% 0.9% 9.9% 15.2%Grades 9-12 54.0% 46.0% 3.7% 25.0% 17.4%
Liquor
Never Ever 5 or More 1 to 4 Less Than 1
All 57.7% 42.3% 11.4% 21.0% 9.9%Grades 7-8 79.5% 20.5% 2.7% 7.1% 10.7%Grades 9-12 47.4% 52.6% 15.5% 27.6% 9.6%

8/14/2019 ELLIS COUNTY - Maypearl ISD - 2004 Texas School Survey of Drug and Alcohol Use
http://slidepdf.com/reader/full/ellis-county-maypearl-isd-2004-texas-school-survey-of-drug-and-alcohol 8/90
MaypearlSpring 2004
________________________________________________________________________________
Table A-4: During the past twelve months, how often have you had five or more
drinks at one time?
BeerSeveral Several Less Than
Never Ever Times/Week Times/Month Once/Month
All 68.2% 31.8% 1.8% 13.8% 16.2%Grades 7-8 78.7% 21.3% * % 5.7% 15.5%Grades 9-12 62.9% 37.1% 2.8% 17.9% 16.5%
Wine CoolersSeveral Several Less Than
Never Ever Times/Week Times/Month Once/Month
All 72.1% 27.9% 1.8% 8.4% 17.7%Grades 7-8 80.4% 19.6% 1.8% 5.3% 12.6%Grades 9-12 68.1% 31.9% 1.8% 10.0% 20.1%
WineSeveral Several Less Than
Never Ever Times/Week Times/Month Once/Month
All 74.0% 26.0% 0.6% 5.8% 19.6%Grades 7-8 83.8% 16.2% * % 4.4% 11.8%Grades 9-12 69.3% 30.7% 0.9% 6.4% 23.3%
LiquorSeveral Several Less Than
Never Ever Times/Week Times/Month Once/Month
All 69.1% 30.9% 0.9% 14.8% 15.2%Grades 7-8 86.2% 13.8% * % 6.3% 7.6%Grades 9-12 61.1% 38.9% 1.4% 18.7% 18.8%
________________________________________________________________________________
Table A-5: Average age of first use of:
Grades 7-8 Grades 9-12
Alcohol 11.1 12.9Beer 11.2 12.9Wine Coolers 11.4 13.2Wine 11.2 13.2Liquor 11.8 14.0
________________________________________________________________________________
Table A-6: If you wanted some, how difficult would it be to get...
Beer?
Never Very Somewhat Somewhat VeryHeard Of Impossible Difficult Difficult Easy Easy
All 6.3% 13.2% 5.9% 15.6% 20.1% 38.9%Grades 7-8 7.8% 27.0% 12.2% 11.7% 9.5% 31.8%Grades 9-12 5.5% 6.5% 2.8% 17.5% 25.3% 42.4%
8/14/2019 ELLIS COUNTY - Maypearl ISD - 2004 Texas School Survey of Drug and Alcohol Use
http://slidepdf.com/reader/full/ellis-county-maypearl-isd-2004-texas-school-survey-of-drug-and-alcohol 9/90
MaypearlSpring 2004
________________________________________________________________________________
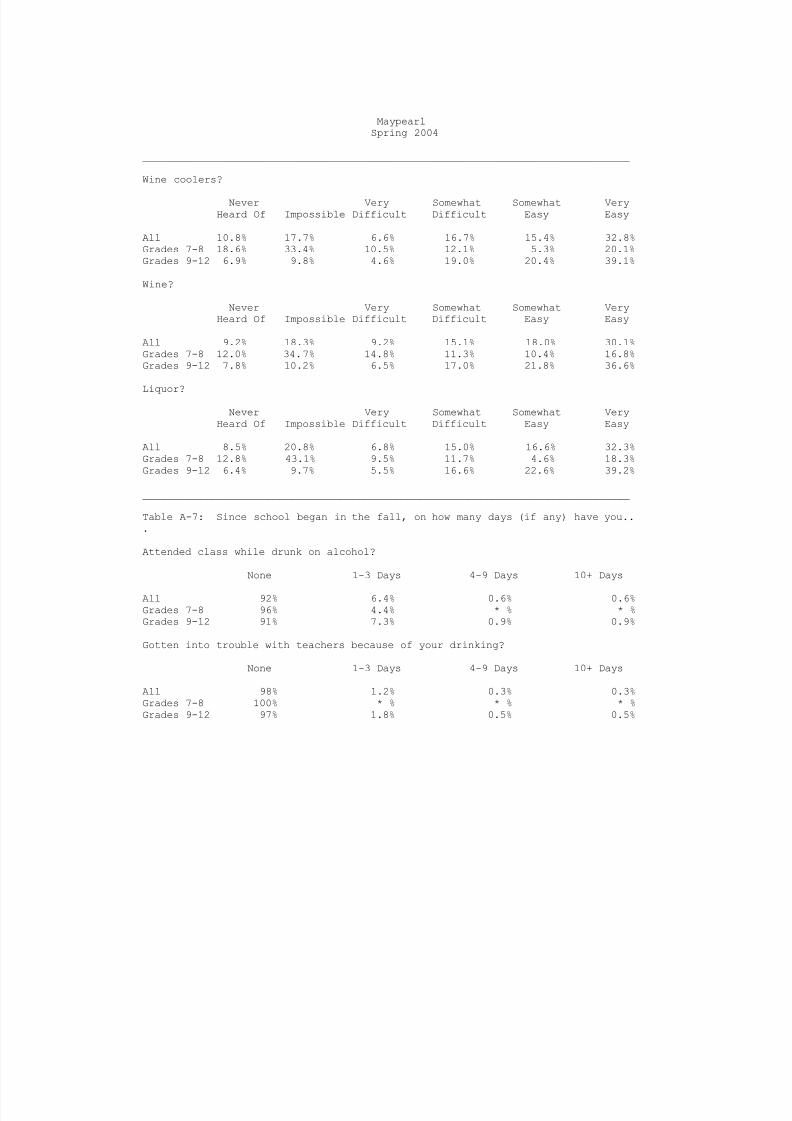
Wine coolers?
Never Very Somewhat Somewhat VeryHeard Of Impossible Difficult Difficult Easy Easy
All 10.8% 17.7% 6.6% 16.7% 15.4% 32.8%Grades 7-8 18.6% 33.4% 10.5% 12.1% 5.3% 20.1%Grades 9-12 6.9% 9.8% 4.6% 19.0% 20.4% 39.1%
Wine?
Never Very Somewhat Somewhat VeryHeard Of Impossible Difficult Difficult Easy Easy
All 9.2% 18.3% 9.2% 15.1% 18.0% 30.1%Grades 7-8 12.0% 34.7% 14.8% 11.3% 10.4% 16.8%Grades 9-12 7.8% 10.2% 6.5% 17.0% 21.8% 36.6%
Liquor?
Never Very Somewhat Somewhat VeryHeard Of Impossible Difficult Difficult Easy Easy
All 8.5% 20.8% 6.8% 15.0% 16.6% 32.3%Grades 7-8 12.8% 43.1% 9.5% 11.7% 4.6% 18.3%Grades 9-12 6.4% 9.7% 5.5% 16.6% 22.6% 39.2%
________________________________________________________________________________
Table A-7: Since school began in the fall, on how many days (if any) have you...
Attended class while drunk on alcohol?
None 1-3 Days 4-9 Days 10+ Days
All 92% 6.4% 0.6% 0.6%Grades 7-8 96% 4.4% * % * %Grades 9-12 91% 7.3% 0.9% 0.9%
Gotten into trouble with teachers because of your drinking?
None 1-3 Days 4-9 Days 10+ Days
All 98% 1.2% 0.3% 0.3%Grades 7-8 100% * % * % * %Grades 9-12 97% 1.8% 0.5% 0.5%

8/14/2019 ELLIS COUNTY - Maypearl ISD - 2004 Texas School Survey of Drug and Alcohol Use
http://slidepdf.com/reader/full/ellis-county-maypearl-isd-2004-texas-school-survey-of-drug-and-alcohol 10/90
MaypearlSpring 2004
________________________________________________________________________________
Table A-8: School year use of alcohol by absences and conduct problems:
Average days absent due to illness or other reasons:
Alcohol Users: 4.4 days per studentAlcohol Non-users: 3.4 days per student
Average days conduct problems reported:
Alcohol Users: 2.9 days per studentAlcohol Non-users: 0.6 days per student
________________________________________________________________________________
Table A-9: During the past twelve months, how many times have you...
Driven a car when you've had a good bit to drink?
None 1-3 Times 4-9 Times 10+ Times
All 88.5% 6.9% 2.3% 2.3%Grades 9-12 88.5% 6.9% 2.3% 2.3%
Gotten into trouble with the police because of drinking?
None 1-3 Times 4-9 Times 10+ Times
All 96.1% 2.6% 0.3% 1.0%Grades 7-8 99.0% * % 1.0% * %Grades 9-12 94.8% 3.8% * % 1.4%
________________________________________________________________________________
Table A-10: About how many of your close friends use...
Any alcohol product?
Never heardNone A Few Some Most All
All 29.2% 28.5 % 18.1% 18.0% 6.1%Grades 7-8 48.8% 29.7 % 5.7% 13.2% 2.6%Grades 9-12 19.5% 28.0 % 24.3% 20.4% 7.9%
Beer?
Never heardNone A Few Some Most All
All 32.1% 29.2 % 19.8% 13.2% 5.7%Grades 7-8 55.6% 28.2 % 7.7% 6.8% 1.8%Grades 9-12 20.4% 29.7 % 25.8% 16.4% 7.7%
8/14/2019 ELLIS COUNTY - Maypearl ISD - 2004 Texas School Survey of Drug and Alcohol Use
http://slidepdf.com/reader/full/ellis-county-maypearl-isd-2004-texas-school-survey-of-drug-and-alcohol 11/90
MaypearlSpring 2004
________________________________________________________________________________
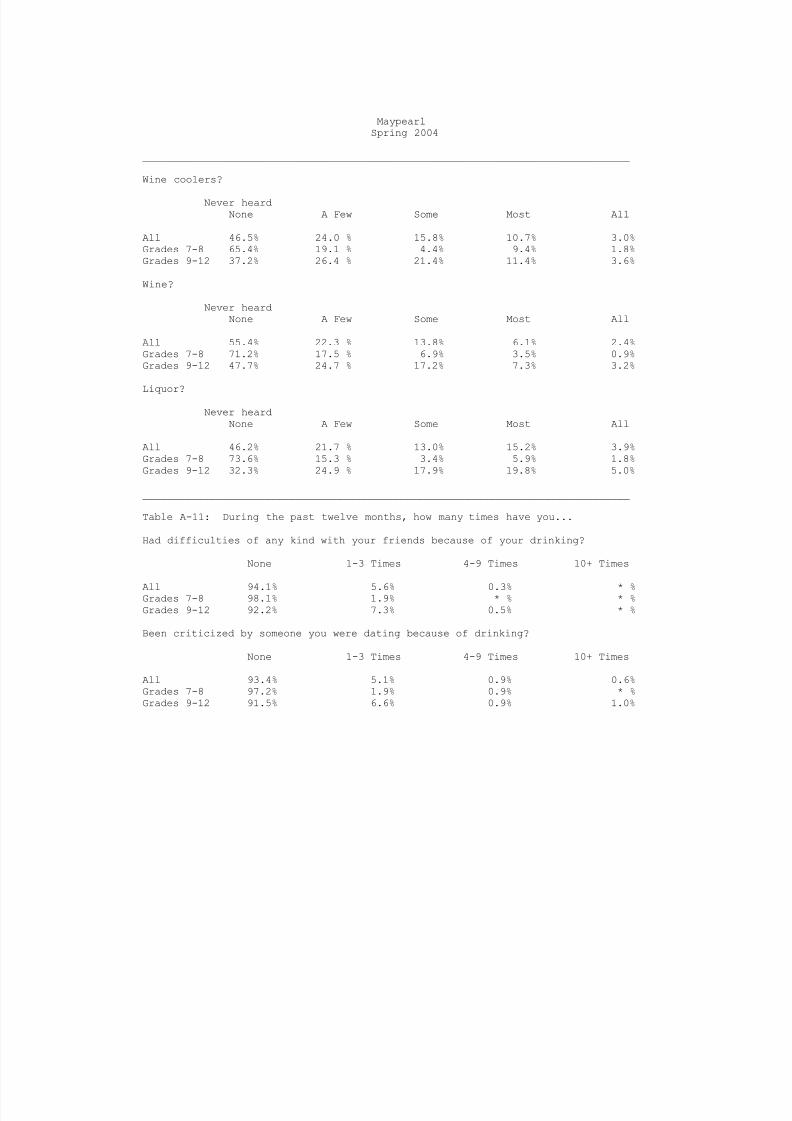
Wine coolers?
Never heardNone A Few Some Most All
All 46.5% 24.0 % 15.8% 10.7% 3.0%Grades 7-8 65.4% 19.1 % 4.4% 9.4% 1.8%Grades 9-12 37.2% 26.4 % 21.4% 11.4% 3.6%
Wine?
Never heardNone A Few Some Most All
All 55.4% 22.3 % 13.8% 6.1% 2.4%Grades 7-8 71.2% 17.5 % 6.9% 3.5% 0.9%Grades 9-12 47.7% 24.7 % 17.2% 7.3% 3.2%
Liquor?
Never heardNone A Few Some Most All
All 46.2% 21.7 % 13.0% 15.2% 3.9%Grades 7-8 73.6% 15.3 % 3.4% 5.9% 1.8%Grades 9-12 32.3% 24.9 % 17.9% 19.8% 5.0%
________________________________________________________________________________
Table A-11: During the past twelve months, how many times have you...
Had difficulties of any kind with your friends because of your drinking?
None 1-3 Times 4-9 Times 10+ Times
All 94.1% 5.6% 0.3% * %Grades 7-8 98.1% 1.9% * % * %Grades 9-12 92.2% 7.3% 0.5% * %
Been criticized by someone you were dating because of drinking?
None 1-3 Times 4-9 Times 10+ Times
All 93.4% 5.1% 0.9% 0.6%Grades 7-8 97.2% 1.9% 0.9% * %Grades 9-12 91.5% 6.6% 0.9% 1.0%
8/14/2019 ELLIS COUNTY - Maypearl ISD - 2004 Texas School Survey of Drug and Alcohol Use
http://slidepdf.com/reader/full/ellis-county-maypearl-isd-2004-texas-school-survey-of-drug-and-alcohol 12/90
MaypearlSpring 2004
________________________________________________________________________________
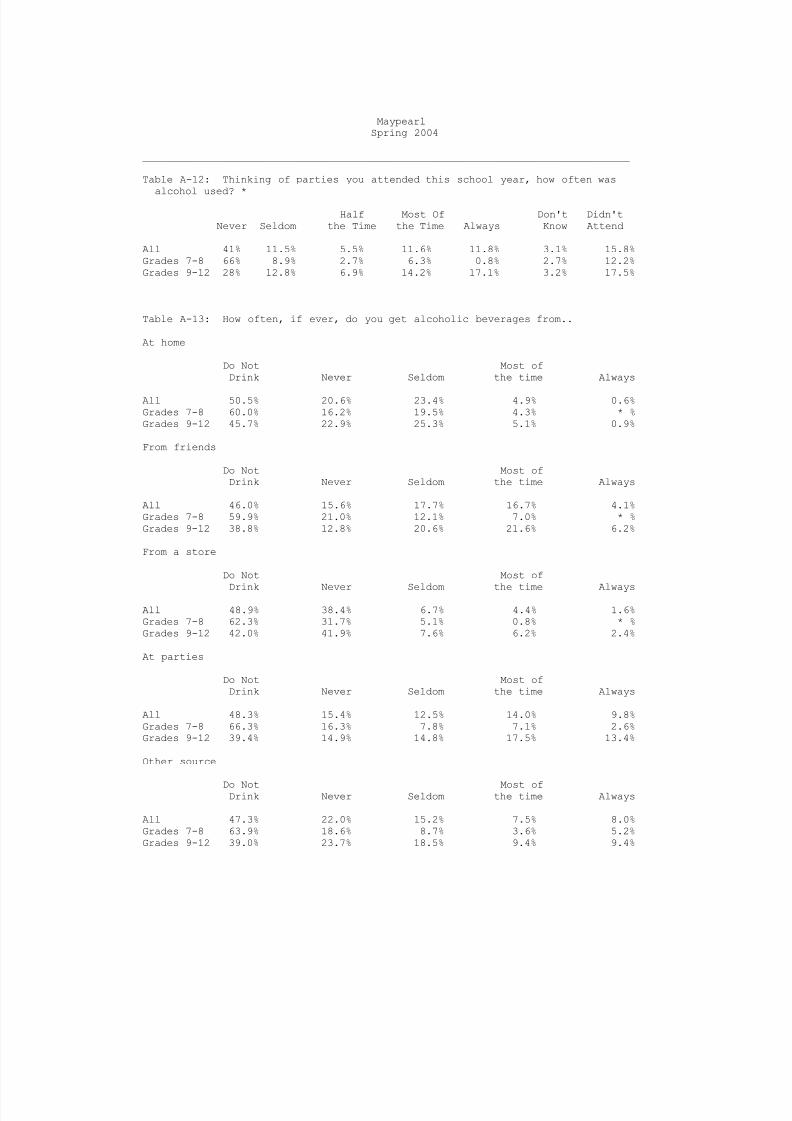
Table A-12: Thinking of parties you attended this school year, how often was
alcohol used? *
Half Most Of Don't Didn'tNever Seldom the Time the Time Always Know Attend
All 41% 11.5% 5.5% 11.6% 11.8% 3.1% 15.8%Grades 7-8 66% 8.9% 2.7% 6.3% 0.8% 2.7% 12.2%Grades 9-12 28% 12.8% 6.9% 14.2% 17.1% 3.2% 17.5%
________________________________________________________________________________
Table A-13: How often, if ever, do you get alcoholic beverages from..
At home
Do Not Most ofDrink Never Seldom the time Always
All 50.5% 20.6% 23.4% 4.9% 0.6%Grades 7-8 60.0% 16.2% 19.5% 4.3% * %Grades 9-12 45.7% 22.9% 25.3% 5.1% 0.9%
From friends
Do Not Most ofDrink Never Seldom the time Always
All 46.0% 15.6% 17.7% 16.7% 4.1%Grades 7-8 59.9% 21.0% 12.1% 7.0% * %Grades 9-12 38.8% 12.8% 20.6% 21.6% 6.2%
From a store
Do Not Most of
Drink Never Seldom the time Always
All 48.9% 38.4% 6.7% 4.4% 1.6%Grades 7-8 62.3% 31.7% 5.1% 0.8% * %Grades 9-12 42.0% 41.9% 7.6% 6.2% 2.4%
At parties
Do Not Most ofDrink Never Seldom the time Always
All 48.3% 15.4% 12.5% 14.0% 9.8%Grades 7-8 66.3% 16.3% 7.8% 7.1% 2.6%Grades 9-12 39.4% 14.9% 14.8% 17.5% 13.4%
Other source
Do Not Most ofDrink Never Seldom the time Always
All 47.3% 22.0% 15.2% 7.5% 8.0%Grades 7-8 63.9% 18.6% 8.7% 3.6% 5.2%Grades 9-12 39.0% 23.7% 18.5% 9.4% 9.4%
8/14/2019 ELLIS COUNTY - Maypearl ISD - 2004 Texas School Survey of Drug and Alcohol Use
http://slidepdf.com/reader/full/ellis-county-maypearl-isd-2004-texas-school-survey-of-drug-and-alcohol 13/90
MaypearlSpring 2004
________________________________________________________________________________
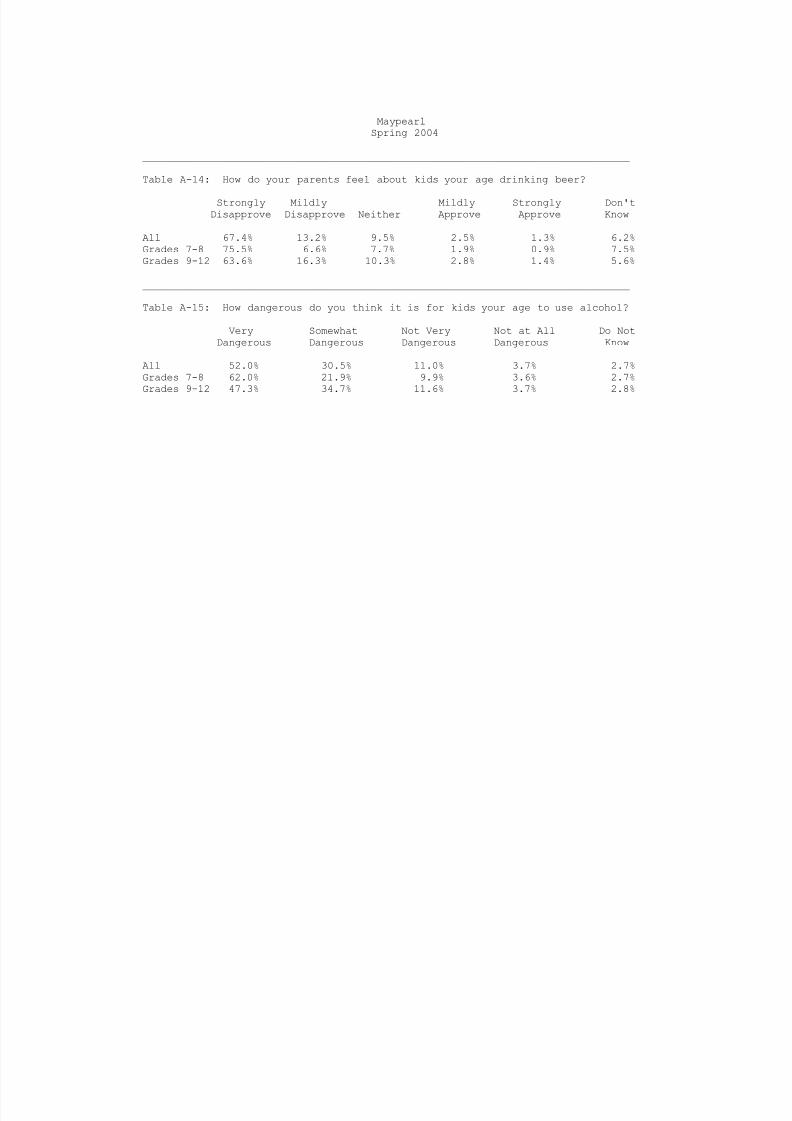
Table A-14: How do your parents feel about kids your age drinking beer?
Strongly Mildly Mildly Strongly Don'tDisapprove Disapprove Neither Approve Approve Know
All 67.4% 13.2% 9.5% 2.5% 1.3% 6.2%Grades 7-8 75.5% 6.6% 7.7% 1.9% 0.9% 7.5%Grades 9-12 63.6% 16.3% 10.3% 2.8% 1.4% 5.6%
________________________________________________________________________________
Table A-15: How dangerous do you think it is for kids your age to use alcohol?
Very Somewhat Not Very Not at All Do NotDangerous Dangerous Dangerous Dangerous Know
All 52.0% 30.5% 11.0% 3.7% 2.7%Grades 7-8 62.0% 21.9% 9.9% 3.6% 2.7%
Grades 9-12 47.3% 34.7% 11.6% 3.7% 2.8%

8/14/2019 ELLIS COUNTY - Maypearl ISD - 2004 Texas School Survey of Drug and Alcohol Use
http://slidepdf.com/reader/full/ellis-county-maypearl-isd-2004-texas-school-survey-of-drug-and-alcohol 14/90
MaypearlSpring 2004
________________________________________________________________________________
Table D-1: How recently, if ever, have you used...
Past School Ever NeverMonth Year Used Used
________________________________________________________________________________Marijuana? All 10.0% 15.3% 24.9% 75.1%
Grades 7-8 0.9% 3.3% 6.7% 93.3%Grades 9-12 14.6% 21.2% 33.9% 66.1%
________________________________________________________________________________Cocaine? All 0.6% 2.6% 5.9% 94.1%
Grades 7-8 * % 0.8% 0.8% 99.2%Grades 9-12 0.9% 3.6% 8.6% 91.4%
________________________________________________________________________________Crack? All 1.2% 2.1% 3.0% 97.0%
Grades 7-8 * % 0.8% 0.8% 99.2%Grades 9-12 1.8% 2.7% 4.0% 96.0%
________________________________________________________________________________Hallucinogens? All 0.6% 2.1% 4.7% 95.3%
Grades 7-8 * % 1.7% 3.4% 96.6%Grades 9-12 0.9% 2.2% 5.3% 94.7%________________________________________________________________________________Uppers? All 3.5% 4.1% 5.6% 94.4%
Grades 7-8 0.8% 0.8% 2.5% 97.5%Grades 9-12 4.9% 5.8% 7.1% 92.9%
________________________________________________________________________________Downers? All 2.4% 3.9% 5.0% 95.0%
Grades 7-8 * % 0.9% 2.5% 97.5%Grades 9-12 3.6% 5.4% 6.3% 93.7%
________________________________________________________________________________Rohypnol? All 0.6% 0.6% 2.1% 97.9%
Grades 7-8 * % 0.6% 2.3% 97.7%Grades 9-12 0.9% 1.5% 2.8% 97.2%
________________________________________________________________________________Steroids? All 1.4% 2.3% 3.5% 96.5%
Grades 7-8 2.4% 3.2% 3.2% 96.8%
Grades 9-12 0.9% 1.8% 3.6% 96.4%________________________________________________________________________________Ecstasy? All 0.6% 1.5% 4.2% 95.8%
Grades 7-8 * % * % 0.9% 99.1%Grades 9-12 0.9% 2.3% 5.9% 94.1%
________________________________________________________________________________Heroin? All 0.6% 0.6% 1.2% 98.8%
Grades 7-8 0.8% 1.3% 1.3% 98.7%Grades 9-12 0.5% 1.8% 2.7% 97.3%
________________________________________________________________________________
Table D-2: How often do you normally use...
Marijuana?
Several Several About About Less Than
Never Every Times Times Once a Once a Once aUsed Day a Week a Month Month Year Year
All 78.1% 0.9% 1.3% 5.0% 4.7% 3.1% 7.1%Grades 7-8 94.7% * % * % 0.9% 0.9% 0.8% 2.7%Grades 9-12 69.9% 1.4% 1.9% 7.0% 6.5% 4.2% 9.2%

8/14/2019 ELLIS COUNTY - Maypearl ISD - 2004 Texas School Survey of Drug and Alcohol Use
http://slidepdf.com/reader/full/ellis-county-maypearl-isd-2004-texas-school-survey-of-drug-and-alcohol 15/90
MaypearlSpring 2004
________________________________________________________________________________
Cocaine?
Several Several About About Less ThanNever Every Times Times Once a Once a Once aUsed Day a Week a Month Month Year Year
All 96.2% * % * % 0.3% 0.6% 1.5% 1.3%Grades 7-8 99.1% * % * % * % * % 0.9% * %Grades 9-12 94.8% * % * % 0.5% 0.9% 1.9% 1.9%
Crack?
Several Several About About Less ThanNever Every Times Times Once a Once a Once aUsed Day a Week a Month Month Year Year
All 97.8% * % * % 0.6% 0.6% * % 1.0%Grades 7-8 99.2% * % * % 0.8% * % * % * %
Grades 9-12 97.2% * % * % 0.5% 0.9% * % 1.4%
Hallucinogens?
Several Several About About Less ThanNever Every Times Times Once a Once a Once aUsed Day a Week a Month Month Year Year
All 96.6% * % * % 0.6% * % 0.9% 1.9%Grades 7-8 98.2% * % * % 0.9% * % * % 0.9%Grades 9-12 95.7% * % * % 0.5% * % 1.4% 2.4%
Uppers?
Several Several About About Less ThanNever Every Times Times Once a Once a Once aUsed Day a Week a Month Month Year Year
All 94.0% 1.0% 1.3% 0.3% 1.6% 0.9% 0.9%Grades 7-8 98.2% * % * % * % 0.9% * % 0.9%Grades 9-12 92.0% 1.4% 1.9% 0.5% 1.9% 1.4% 0.9%
Downers?
Several Several About About Less ThanNever Every Times Times Once a Once a Once aUsed Day a Week a Month Month Year Year
All 95.6% 0.6% 0.3% 0.3% 1.2% 1.3% 0.6%Grades 7-8 97.3% * % * % * % 0.9% * % 1.8%Grades 9-12 94.8% 1.0% 0.5% 0.5% 1.4% 1.9% * %
Rohypnol?
Several Several About About Less ThanNever Every Times Times Once a Once a Once aUsed Day a Week a Month Month Year Year
All 99.1% * % * % * % * % 0.3% 0.6%Grades 7-8 99.1% * % * % * % * % 0.9% * %Grades 9-12 99.1% * % * % * % * % * % 0.9%

8/14/2019 ELLIS COUNTY - Maypearl ISD - 2004 Texas School Survey of Drug and Alcohol Use
http://slidepdf.com/reader/full/ellis-county-maypearl-isd-2004-texas-school-survey-of-drug-and-alcohol 16/90
MaypearlSpring 2004
________________________________________________________________________________
Steroids?
Several Several About About Less ThanNever Every Times Times Once a Once a Once aUsed Day a Week a Month Month Year Year
All 97.5% 0.9% * % * % 0.3% 0.7% 0.6%Grades 7-8 97.4% 1.8% * % * % 0.9% * % * %Grades 9-12 97.6% 0.5% * % * % * % 1.0% 0.9%
Ecstasy?
Several Several About About Less ThanNever Every Times Times Once a Once a Once aUsed Day a Week a Month Month Year Year
All 96.8% * % * % * % * % 0.3% 2.9%Grades 7-8 99.0% * % * % * % * % * % 1.0%
Grades 9-12 95.7% * % * % * % * % 0.5% 3.8%
Heroin?
Several Several About About Less ThanNever Every Times Times Once a Once a Once aUsed Day a Week a Month Month Year Year
All 99.7% * % * % * % * % * % 0.3%Grades 7-8 100.0% * % * % * % * % * % * %Grades 9-12 99.5% * % * % * % * % * % 0.5%
________________________________________________________________________________
Table D-3: Average age of first use of:
Grades 7-8 Grades 9-12
Marijuana * 14.3Cocaine * 15.2Crack * *Hallucinogens * 13.8Uppers * 15.0Downers * 15.2Rohypnol * *Steroids * *Ecstasy * 14.8Heroin * *

8/14/2019 ELLIS COUNTY - Maypearl ISD - 2004 Texas School Survey of Drug and Alcohol Use
http://slidepdf.com/reader/full/ellis-county-maypearl-isd-2004-texas-school-survey-of-drug-and-alcohol 17/90
MaypearlSpring 2004
________________________________________________________________________________
Table D-4: Age of first use of marijuana by family situation:
Two parent family
Never 9/Under 10-11 12-13 14-15 16-17 18/Over
All 81.2% 0.5% 0.5% 3.2% 7.9% 6.7% * %Grades 7-8 97.3% * % * % 2.7% * % * % * %Grades 9-12 74.1% 0.7% 0.7% 3.5% 11.4% 9.7% * %
Other family situation
Never 9/Under 10-11 12-13 14-15 16-17 18/Over
All 64.1% 2.6% 2.6% 9.5% 14.0% 7.1% * %Grades 7-8 93.1% * % 2.4% 4.5% * % * % * %Grades 9-12 47.5% 4.1% 2.7% 12.4% 22.0% 11.2% * %
________________________________________________________________________________
Table D-5: If you wanted some, how difficult would it be to get..
Marijuana?
Never Very Somewhat Somewhat VeryHeard Of Impossible Difficult Difficult Easy Easy
All 11.2% 26.5% 8.9% 11.3% 16.0% 26.2%Grades 7-8 17.4% 51.7% 9.6% 4.4% 3.5% 13.4%Grades 9-12 8.1% 13.8% 8.5% 14.7% 22.3% 32.6%
Cocaine?
Never Very Somewhat Somewhat Very
Heard Of Impossible Difficult Difficult Easy Easy
All 15.0% 36.4% 13.3% 14.4% 11.4% 9.4%Grades 7-8 16.8% 59.8% 11.6% 2.6% 3.7% 5.5%Grades 9-12 14.2% 25.0% 14.1% 20.2% 15.2% 11.2%
Crack?
Never Very Somewhat Somewhat VeryHeard Of Impossible Difficult Difficult Easy Easy
All 15.4% 36.0% 16.0% 13.4% 9.7% 9.5%Grades 7-8 17.4% 59.6% 10.5% 1.8% 2.7% 8.0%Grades 9-12 14.5% 24.3% 18.6% 19.1% 13.2% 10.2%
Hallucinogens?
Never Very Somewhat Somewhat VeryHeard Of Impossible Difficult Difficult Easy Easy
All 32.9% 29.2% 11.5% 9.4% 8.1% 8.9%Grades 7-8 45.3% 34.8% 8.2% 1.9% 4.5% 5.4%Grades 9-12 26.8% 26.4% 13.1% 13.2% 9.9% 10.7%

8/14/2019 ELLIS COUNTY - Maypearl ISD - 2004 Texas School Survey of Drug and Alcohol Use
http://slidepdf.com/reader/full/ellis-county-maypearl-isd-2004-texas-school-survey-of-drug-and-alcohol 18/90
MaypearlSpring 2004
________________________________________________________________________________
Uppers?
Never Very Somewhat Somewhat VeryHeard Of Impossible Difficult Difficult Easy Easy
All 45.5% 21.7% 9.4% 8.9% 4.4% 10.1%Grades 7-8 50.9% 30.5% 6.5% 3.8% 3.7% 4.7%Grades 9-12 42.9% 17.5% 10.8% 11.4% 4.7% 12.7%
Downers?
Never Very Somewhat Somewhat VeryHeard Of Impossible Difficult Difficult Easy Easy
All 45.0% 22.3% 8.3% 8.3% 4.6% 11.4%Grades 7-8 50.5% 32.9% 5.5% 2.6% 3.7% 4.7%Grades 9-12 42.5% 17.4% 9.5% 11.0% 5.1% 14.6%
Rohypnol?
Never Very Somewhat Somewhat VeryHeard Of Impossible Difficult Difficult Easy Easy
All 48.1% 22.9% 9.3% 7.6% 5.0% 7.1%Grades 7-8 50.5% 32.7% 8.9% 2.7% 1.7% 3.6%Grades 9-12 47.0% 18.0% 9.5% 10.0% 6.6% 8.9%
Steroids?
Never Very Somewhat Somewhat VeryHeard Of Impossible Difficult Difficult Easy Easy
All 20.8% 32.2% 12.7% 13.5% 8.4% 12.3%Grades 7-8 20.1% 50.5% 8.1% 6.3% 6.1% 8.9%Grades 9-12 21.2% 23.2% 15.0% 17.0% 9.5% 14.0%
Ecstasy?
Never Very Somewhat Somewhat VeryHeard Of Impossible Difficult Difficult Easy Easy
All 23.4% 34.6% 11.4% 10.9% 8.4% 11.3%Grades 7-8 30.5% 49.1% 6.2% 2.7% 3.5% 8.0%Grades 9-12 20.0% 27.5% 13.9% 14.9% 10.7% 12.9%
Heroin?
Never Very Somewhat Somewhat VeryHeard Of Impossible Difficult Difficult Easy Easy
All 23.7% 38.7% 12.7% 11.7% 4.6% 8.5%Grades 7-8 29.4% 50.3% 5.4% 6.4% 1.7% 6.9%
Grades 9-12 20.9% 33.1% 16.3% 14.4% 6.1% 9.2%

8/14/2019 ELLIS COUNTY - Maypearl ISD - 2004 Texas School Survey of Drug and Alcohol Use
http://slidepdf.com/reader/full/ellis-county-maypearl-isd-2004-texas-school-survey-of-drug-and-alcohol 19/90
MaypearlSpring 2004
________________________________________________________________________________
Table D-6: Since school began in the fall, on how many days (if any) have you..
Attended class while high from marijuana use?
None 1-3 Days 4-9 Days 10+ Days
All 92% 4.3% 0.9% 3.2%Grades 7-8 99% 0.9% * % * %Grades 9-12 88% 6.0% 1.4% 4.7%
Attended class while high from use of some other drug?
None 1-3 Days 4-9 Days 10+ Days
All 95% 3.1% 0.9% 0.6%Grades 7-8 99% * % 0.9% * %Grades 9-12 94% 4.6% 0.9% 0.9%
Gotten into trouble with teachers because of your drug use?
None 1-3 Days 4-9 Days 10+ Days
All 99% 0.9% 0.3% * %Grades 7-8 100% * % * % * %Grades 9-12 98% 1.4% 0.5% * %
________________________________________________________________________________
Table D-7: School year use of marijuana by absences and conduct problems:
Average days absent due to illness or other reasons:
Marijuana Users: 4.7 days per studentMarijuana Non-users: 3.6 days per student
Average days conduct problems reported:
Marijuana Users: 4.0 days per studentMarijuana Non-users: 1.0 days per student
________________________________________________________________________________
Table D-8: During the past twelve months, how many times have you..
Driven a car when you've felt high from drugs?
None 1-3 Times 4-9 Times 10+ Times
All 89.4% 6.3% 1.9% 2.4%Grades 9-12 89.4% 6.3% 1.9% 2.4%
Gotten into trouble with the police because of drug use?
None 1-3 Times 4-9 Times 10+ Times
All 97.1% 2.2% 0.3% 0.3%Grades 7-8 99.0% * % * % 1.0%Grades 9-12 96.3% 3.3% 0.5% * %

8/14/2019 ELLIS COUNTY - Maypearl ISD - 2004 Texas School Survey of Drug and Alcohol Use
http://slidepdf.com/reader/full/ellis-county-maypearl-isd-2004-texas-school-survey-of-drug-and-alcohol 20/90
MaypearlSpring 2004
________________________________________________________________________________
Table D-9: About how many of your close friends use marijuana?
Never heardNone A Few Some Most All
All 58.2% 15.1 % 13.3% 10.4% 3.0%Grades 7-8 81.4% 9.2 % 4.2% 4.3% 0.9%Grades 9-12 46.7% 18.0 % 17.9% 13.5% 4.0%
________________________________________________________________________________
Table D-10: During the past twelve months, how many times have you..
Had difficulties of any kind with your friends because of your drug use?
None 1-3 Times 4-9 Times 10+ Times
All 91.9% 6.5% 1.3% 0.3%
Grades 7-8 96.1% 2.9% 0.9% * %Grades 9-12 90.0% 8.1% 1.4% 0.5%
Been criticized by someone you were dating because of drug use?
None 1-3 Times 4-9 Times 10+ Times
All 93.2% 4.9% 0.3% 1.6%Grades 7-8 99.1% * % * % 0.9%Grades 9-12 90.5% 7.1% 0.5% 1.9%
________________________________________________________________________________
Table D-11: Thinking of parties you attended this school year, how often wasmarijuana used?*
Half Most Of Don't Didn't
Never Seldom the Time the Time Always Know Attend
All 51% 8.5% 4.0% 9.8% 6.5% 3.9% 16.7%Grades 7-8 71% 5.5% 1.9% 1.7% 0.9% 5.5% 13.4%Grades 9-12 41% 10.0% 5.0% 13.7% 9.1% 3.2% 18.3%
________________________________________________________________________________
Table D-12: How often, if ever, do you smoke marijuana in..
Joints?
Half the Most of Don'tNever Seldom Time the Time Always Know
All 79.8% 8.4% 3.3% 5.2% 2.4% 0.9%Grades 7-8 96.6% 1.7% * % 0.9% 0.8% * %
Grades 9-1 71.6% 11.7% 4.9% 7.3% 3.2% 1.3%
8/14/2019 ELLIS COUNTY - Maypearl ISD - 2004 Texas School Survey of Drug and Alcohol Use
http://slidepdf.com/reader/full/ellis-county-maypearl-isd-2004-texas-school-survey-of-drug-and-alcohol 21/90
MaypearlSpring 2004
________________________________________________________________________________
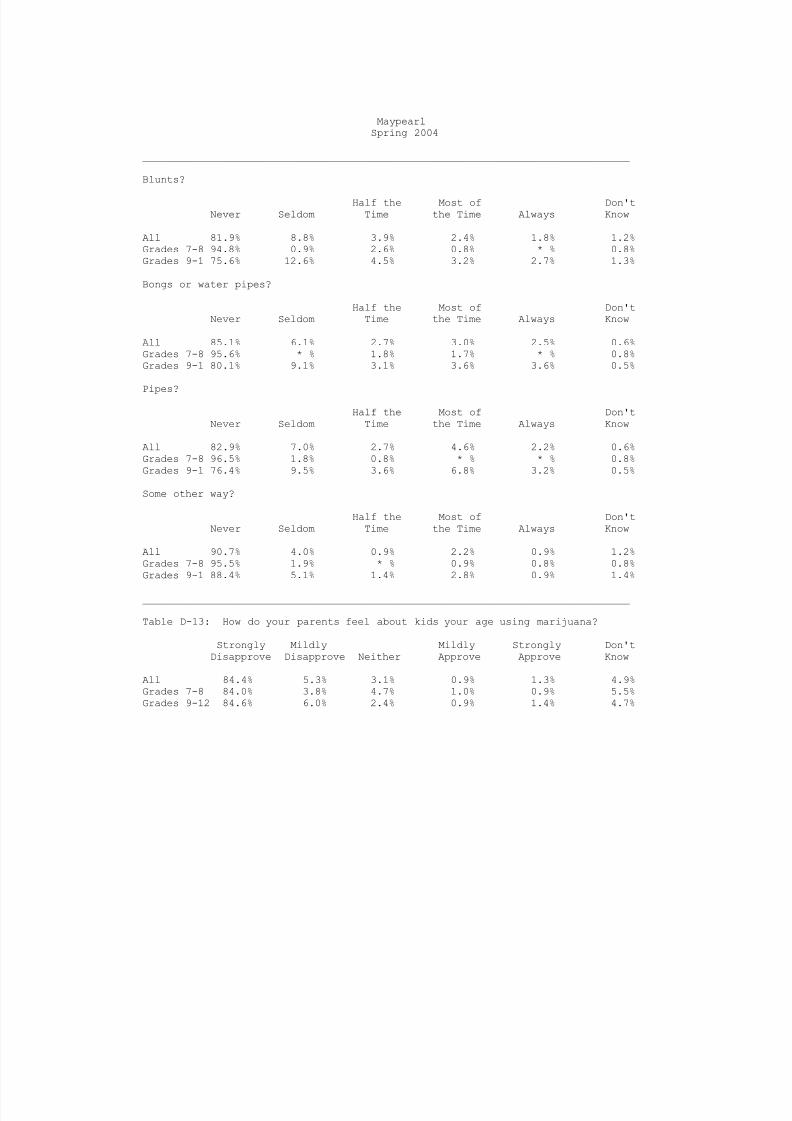
Blunts?
Half the Most of Don'tNever Seldom Time the Time Always Know
All 81.9% 8.8% 3.9% 2.4% 1.8% 1.2%Grades 7-8 94.8% 0.9% 2.6% 0.8% * % 0.8%Grades 9-1 75.6% 12.6% 4.5% 3.2% 2.7% 1.3%
Bongs or water pipes?
Half the Most of Don'tNever Seldom Time the Time Always Know
All 85.1% 6.1% 2.7% 3.0% 2.5% 0.6%Grades 7-8 95.6% * % 1.8% 1.7% * % 0.8%Grades 9-1 80.1% 9.1% 3.1% 3.6% 3.6% 0.5%
Pipes?
Half the Most of Don'tNever Seldom Time the Time Always Know
All 82.9% 7.0% 2.7% 4.6% 2.2% 0.6%Grades 7-8 96.5% 1.8% 0.8% * % * % 0.8%Grades 9-1 76.4% 9.5% 3.6% 6.8% 3.2% 0.5%
Some other way?
Half the Most of Don'tNever Seldom Time the Time Always Know
All 90.7% 4.0% 0.9% 2.2% 0.9% 1.2%Grades 7-8 95.5% 1.9% * % 0.9% 0.8% 0.8%Grades 9-1 88.4% 5.1% 1.4% 2.8% 0.9% 1.4%
________________________________________________________________________________
Table D-13: How do your parents feel about kids your age using marijuana?
Strongly Mildly Mildly Strongly Don'tDisapprove Disapprove Neither Approve Approve Know
All 84.4% 5.3% 3.1% 0.9% 1.3% 4.9%Grades 7-8 84.0% 3.8% 4.7% 1.0% 0.9% 5.5%Grades 9-12 84.6% 6.0% 2.4% 0.9% 1.4% 4.7%

8/14/2019 ELLIS COUNTY - Maypearl ISD - 2004 Texas School Survey of Drug and Alcohol Use
http://slidepdf.com/reader/full/ellis-county-maypearl-isd-2004-texas-school-survey-of-drug-and-alcohol 22/90
MaypearlSpring 2004
________________________________________________________________________________
Table D-14: How dangerous do you think it is for kids your age to use...
Marijuana?
Very Somewhat Not Very Not at All Do NotDangerous Dangerous Dangerous Dangerous Know
All 67.3% 14.9% 10.1% 4.8% 2.8%Grades 7-8 88.8% 3.8% 4.6% 1.0% 1.8%Grades 9-12 56.9% 20.3% 12.8% 6.7% 3.3%
Cocaine?
Very Somewhat Not Very Not at All Do NotDangerous Dangerous Dangerous Dangerous Know
All 83.6% 9.9% 1.8% 1.0% 3.7%Grades 7-8 92.9% 3.6% 1.8% * % 1.8%
Grades 9-12 79.0% 13.0% 1.9% 1.4% 4.7%
Crack?
Very Somewhat Not Very Not at All Do NotDangerous Dangerous Dangerous Dangerous Know
All 86.2% 7.5% 0.9% 1.3% 4.1%Grades 7-8 92.5% 3.8% 1.8% * % 1.8%Grades 9-12 83.2% 9.3% 0.5% 1.9% 5.1%
Ecstasy?
Very Somewhat Not Very Not at All Do NotDangerous Dangerous Dangerous Dangerous Know
All 87.8% 5.9% 0.6% 1.0% 4.7%
Grades 7-8 93.9% 1.7% 1.7% * % 2.7%Grades 9-12 84.8% 8.0% * % 1.4% 5.7%
Steroids?
Very Somewhat Not Very Not at All Do NotDangerous Dangerous Dangerous Dangerous Know
All 77.4% 12.0% 3.9% 2.1% 4.6%Grades 7-8 83.7% 7.0% 2.5% 3.3% 3.4%Grades 9-12 74.3% 14.5% 4.6% 1.4% 5.2%
Heroin?
Very Somewhat Not Very Not at All Do NotDangerous Dangerous Dangerous Dangerous Know
All 89.3% 4.6% 0.9% 1.3% 4.0%Grades 7-8 93.3% 0.8% 2.5% * % 3.4%Grades 9-12 87.2% 6.6% * % 1.9% 4.3%

8/14/2019 ELLIS COUNTY - Maypearl ISD - 2004 Texas School Survey of Drug and Alcohol Use
http://slidepdf.com/reader/full/ellis-county-maypearl-isd-2004-texas-school-survey-of-drug-and-alcohol 23/90

8/14/2019 ELLIS COUNTY - Maypearl ISD - 2004 Texas School Survey of Drug and Alcohol Use
http://slidepdf.com/reader/full/ellis-county-maypearl-isd-2004-texas-school-survey-of-drug-and-alcohol 24/90
MaypearlSpring 2004
________________________________________________________________________________
Table I-1: How recently, if ever, have you used...
Past School Ever NeverMonth Year Used Used
________________________________________________________________________________Any inhalant? All 4.5% 7.3% 15.6% 84.4%
Grades 7-8 4.7% 8.0% 14.3% 85.7%Grades 9-12 4.4% 7.0% 16.3% 83.7%
________________________________________________________________________________Liquid or spray paint? All 1.5% 1.7% 6.1% 93.9%
Grades 7-8 0.8% 1.6% 4.1% 95.9%Grades 9-12 1.8% 1.8% 7.1% 92.9%
________________________________________________________________________________Whiteout, correction fld?All 1.7% 2.5% 6.3% 93.7%
Grades 7-8 2.3% 4.0% 6.5% 93.5%Grades 9-12 1.3% 1.8% 6.2% 93.8%
________________________________________________________________________________Gasoline? All 0.8% 1.4% 4.6% 95.4%
Grades 7-8 1.6% 3.2% 4.1% 95.9%Grades 9-12 0.4% 0.4% 4.9% 95.1%________________________________________________________________________________Freon? All 0.6% 0.8% 1.4% 98.6%
Grades 7-8 0.8% 1.6% 1.6% 98.4%Grades 9-12 0.5% 0.5% 1.4% 98.6%
________________________________________________________________________________Poppers, Locker Room? All 1.2% 1.5% 2.0% 98.0%
Grades 7-8 0.8% 0.8% 1.6% 98.4%Grades 9-12 1.3% 1.8% 2.3% 97.7%
________________________________________________________________________________Glue? All 0.6% 0.6% 3.8% 96.2%
Grades 7-8 0.9% 1.5% 3.9% 96.1%Grades 9-12 0.4% 1.9% 5.5% 94.5%
________________________________________________________________________________Paint,lacquer thinner? All 0.6% 1.8% 4.2% 95.8%
Grades 7-8 * % * % 1.6% 98.4%
Grades 9-12 0.9% 2.7% 5.5% 94.5%________________________________________________________________________________Nitrous oxide? All 1.2% 1.5% 3.8% 96.2%
Grades 7-8 0.8% 0.8% 3.3% 96.7%Grades 9-12 1.4% 1.8% 4.1% 95.9%
________________________________________________________________________________Octane booster? All 0.3% 0.3% 0.9% 99.1%
Grades 7-8 * % 0.3% 0.3% 99.7%Grades 9-12 0.5% 0.8% 1.7% 98.3%
________________________________________________________________________________Other sprays? All 1.4% 1.4% 2.5% 97.5%
Grades 7-8 2.3% 3.7% 5.3% 94.7%Grades 9-12 0.9% 4.6% 5.5% 94.5%
________________________________________________________________________________Other inhalants? All 2.6% 4.0% 8.3% 91.7%
Grades 7-8 3.1% 3.9% 9.6% 90.4%Grades 9-12 2.3% 4.1% 7.7% 92.3%

8/14/2019 ELLIS COUNTY - Maypearl ISD - 2004 Texas School Survey of Drug and Alcohol Use
http://slidepdf.com/reader/full/ellis-county-maypearl-isd-2004-texas-school-survey-of-drug-and-alcohol 25/90
MaypearlSpring 2004
________________________________________________________________________________
Table I-2: How often do you normally use inhalants?
Several Several About About Less ThanNever Every Times Times Once a Once a Once aUsed Day a Week a Month Month Year Year
All 92.5% 0.5% * % 0.6% 0.9% 2.1% 3.4%Grades 7-8 91.6% 1.6% * % 0.9% 0.8% 3.3% 1.8%Grades 9-12 93.0% * % * % 0.5% 0.9% 1.4% 4.2%
________________________________________________________________________________
Table I-3: Number of different kinds of inhalants used:
0 1 2-3 4+
All 86.6% 6.2% 3.6% 3.6%Grades 7-8 87.5% 5.5% 4.6% 2.3%
Grades 9-12 86.2% 6.5% 3.1% 4.3%
________________________________________________________________________________
Table I-4: Average age of first use of:
Grades 7-8 Grades 9-12
Inhalants 12.2 12.4
________________________________________________________________________________
Table I-5: Since school began in the fall, on how many days (if any) have youattended class while high from inhalant use?
None 1-3 Days 4-9 Days 10+ Days
All 98% 0.9% 0.6% 0.6%Grades 7-8 97% 1.7% 0.9% * %Grades 9-12 98% 0.5% 0.5% 0.9%
________________________________________________________________________________
Table I-6: School year use of inhalants by absences and conduct problems:
Average days absent due to illness or other reasons:
Inhalants Users: 3.9 days per studentInhalants Non-users: 3.7 days per student
Average days conduct problems reported:
Inhalants Users: 3.7 days per studentInhalants Non-users: 1.2 days per student

8/14/2019 ELLIS COUNTY - Maypearl ISD - 2004 Texas School Survey of Drug and Alcohol Use
http://slidepdf.com/reader/full/ellis-county-maypearl-isd-2004-texas-school-survey-of-drug-and-alcohol 26/90
MaypearlSpring 2004
________________________________________________________________________________
Table I-7: About how many of your close friends use inhalants?
Never heardNone A Few Some Most All
All 87.1% 8.0 % 2.3% 1.7% 0.9%Grades 7-8 87.4% 5.0 % 2.5% 3.3% 1.8%Grades 9-12 86.9% 9.5 % 2.3% 0.9% 0.5%
________________________________________________________________________________
Table I-8: How dangerous do you think it is for kids your age to use inhalants?
Very Somewhat Not Very Not at All Do NotDangerous Dangerous Dangerous Dangerous Know
All 77.7% 15.3% 1.6% 1.7% 3.8%Grades 7-8 87.2% 9.1% 1.9% * % 1.8%
Grades 9-12 73.1% 18.2% 1.4% 2.4% 4.8%

8/14/2019 ELLIS COUNTY - Maypearl ISD - 2004 Texas School Survey of Drug and Alcohol Use
http://slidepdf.com/reader/full/ellis-county-maypearl-isd-2004-texas-school-survey-of-drug-and-alcohol 27/90

8/14/2019 ELLIS COUNTY - Maypearl ISD - 2004 Texas School Survey of Drug and Alcohol Use
http://slidepdf.com/reader/full/ellis-county-maypearl-isd-2004-texas-school-survey-of-drug-and-alcohol 28/90
MaypearlSpring 2004
________________________________________________________________________________
Table X-1: Since school began in the fall, have you gotten any information
on drugs or alcohol from the following sources?
Health class
No Yes
All 58.8% 41.2%Grades 7-8 74.3% 25.7%Grades 9-12 52.0% 48.0%
An assembly program
No Yes
All 45.3% 54.7%Grades 7-8 64.6% 35.4%Grades 9-12 37.1% 62.9%
Guidance counselor
No Yes
All 85.4% 14.6%Grades 7-8 81.6% 18.4%Grades 9-12 87.1% 12.9%
Science class
No Yes
All 82.4% 17.6%Grades 7-8 91.8% 8.2%Grades 9-12 78.1% 21.9%
Social studies class
No Yes
All 90.7% 9.3%Grades 7-8 95.2% 4.8%Grades 9-12 88.8% 11.2%
Student group session
No Yes
All 87.5% 12.5%Grades 7-8 93.9% 6.1%Grades 9-12 84.6% 15.4%
An invited school guest
No Yes
All 71.7% 28.3%Grades 7-8 74.0% 26.0%Grades 9-12 70.7% 29.3%

8/14/2019 ELLIS COUNTY - Maypearl ISD - 2004 Texas School Survey of Drug and Alcohol Use
http://slidepdf.com/reader/full/ellis-county-maypearl-isd-2004-texas-school-survey-of-drug-and-alcohol 29/90
MaypearlSpring 2004
________________________________________________________________________________
Some other school source
No Yes
All 71.9% 28.1%Grades 7-8 78.3% 21.7%Grades 9-12 69.0% 31.0%
Any school source
No Yes
All 44.4% 55.6%Grades 7-8 58.5% 41.5%Grades 9-12 37.2% 62.8%
________________________________________________________________________________
Table X-2: If you had a drug or alcohol problem and needed help, who would yougo to?
A counselor or program in school
No Yes
All 64.1% 35.9%Grades 7-8 61.5% 38.5%Grades 9-12 65.3% 34.7%
Another adult in school (such as a nurse or teacher)
No Yes
All 72.3% 27.7%Grades 7-8 70.9% 29.1%
Grades 9-12 73.0% 27.0%
A counselor or program outside of school
No Yes
All 62.7% 37.3%Grades 7-8 58.6% 41.4%Grades 9-12 64.6% 35.4%
Your parents
No Yes
All 42.7% 57.3%Grades 7-8 29.9% 70.1%Grades 9-12 48.8% 51.2%

8/14/2019 ELLIS COUNTY - Maypearl ISD - 2004 Texas School Survey of Drug and Alcohol Use
http://slidepdf.com/reader/full/ellis-county-maypearl-isd-2004-texas-school-survey-of-drug-and-alcohol 30/90
MaypearlSpring 2004
________________________________________________________________________________
A medical doctor
No Yes
All 54.8% 45.2%Grades 7-8 46.7% 53.3%Grades 9-12 58.8% 41.2%
Your friends
No Yes
All 21.3% 78.7%Grades 7-8 25.2% 74.8%Grades 9-12 19.5% 80.5%
Another adult (a relative, clergyman, or other family friend)
No Yes
All 40.5% 59.5%Grades 7-8 38.4% 61.6%Grades 9-12 41.6% 58.4%
________________________________________________________________________________
Table X-3: Since school began in the fall, have you sought help, other thanfrom family or friends, for problems in any way connected with your use ofalcohol, marijuana, or other drugs?
No Yes
All 93.5% 6.5%Grades 7-8 95.9% 4.1%Grades 9-12 92.4% 7.6%
________________________________________________________________________________
Table X-4: About how many of your friends:
Feel close to their parents?
None A Few Some Most All
All 7.1% 29.5% 21.2% 34.0% 8.2%Grades 7-8 6.5% 26.3% 16.0% 36.2% 15.1%Grades 9-12 7.4% 31.1% 23.8% 32.9% 4.8%
Sometimes carry weapons?
None A Few Some Most All
All 67.9% 17.2% 9.8% 4.0% 1.1%Grades 7-8 70.6% 14.6% 9.9% 3.3% 1.6%Grades 9-12 66.5% 18.5% 9.7% 4.4% 0.9%

8/14/2019 ELLIS COUNTY - Maypearl ISD - 2004 Texas School Survey of Drug and Alcohol Use
http://slidepdf.com/reader/full/ellis-county-maypearl-isd-2004-texas-school-survey-of-drug-and-alcohol 31/90
MaypearlSpring 2004
________________________________________________________________________________
Care about making good grades?
None A Few Some Most All
All 6.7% 14.8% 23.3% 38.1% 17.2%Grades 7-8 7.4% 15.7% 19.5% 35.8% 21.6%Grades 9-12 6.3% 14.3% 25.3% 39.2% 14.8%
Belong/want to belong to a gang?
None A Few Some Most All
All 87.4% 7.9% 3.0% 1.1% 0.6%Grades 7-8 82.5% 9.6% 4.5% 2.5% 0.8%Grades 9-12 89.9% 7.1% 2.2% 0.4% 0.4%
Wish they could drop out of school?
None A Few Some Most All
All 50.8% 32.6% 7.6% 5.1% 3.9%Grades 7-8 56.3% 29.9% 2.4% 5.7% 5.6%Grades 9-12 48.1% 33.9% 10.2% 4.8% 3.0%

8/14/2019 ELLIS COUNTY - Maypearl ISD - 2004 Texas School Survey of Drug and Alcohol Use
http://slidepdf.com/reader/full/ellis-county-maypearl-isd-2004-texas-school-survey-of-drug-and-alcohol 32/90
MaypearlSpring 2004
Table B1: Prevalence and recency of use of selected substances by grade--> All students
Past School Ever NeverMonth Year Used Used
________________________________________________________________________________
Tobacco All 14.7% 18.2% 36.6% 63.4%Grades 7-8 4.7% 7.2% 22.9% 77.1%Grades 9-12 19.9% 23.9% 43.7% 56.3%
________________________________________________________________________________Alcohol All 25.3% 34.4% 61.8% 38.2%
Grades 7-8 15.3% 20.1% 53.4% 46.6%Grades 9-12 30.4% 41.7% 66.0% 34.0%
________________________________________________________________________________Inhalants All 4.5% 7.3% 15.6% 84.4%
Grades 7-8 4.7% 8.0% 14.3% 85.7%Grades 9-12 4.4% 7.0% 16.3% 83.7%
________________________________________________________________________________Any Illicit Drug All 11.3% 16.1% 26.2% 73.8%
Grades 7-8 1.6% 6.5% 10.6% 89.4%Grades 9-12 16.2% 21.0% 34.1% 65.9%
________________________________________________________________________________Marijuana All 10.0% 15.3% 24.9% 75.1%
Grades 7-8 0.9% 3.3% 6.7% 93.3%Grades 9-12 14.6% 21.2% 33.9% 66.1%________________________________________________________________________________Marijuana Only All 3.7% 5.6% 13.5% 86.5%
Grades 7-8 * % 1.6% 4.0% 96.0%Grades 9-12 5.5% 7.7% 18.3% 81.7%
________________________________________________________________________________Cocaine or Crack All 1.2% 3.5% 6.2% 93.8%
Grades 7-8 * % 0.8% 0.8% 99.2%Grades 9-12 1.8% 4.9% 8.9% 91.1%
________________________________________________________________________________Cocaine All 0.6% 2.6% 5.9% 94.1%
Grades 7-8 * % 0.8% 0.8% 99.2%Grades 9-12 0.9% 3.6% 8.6% 91.4%
________________________________________________________________________________Crack All 1.2% 2.1% 3.0% 97.0%
Grades 7-8 * % 0.8% 0.8% 99.2%
Grades 9-12 1.8% 2.7% 4.0% 96.0%________________________________________________________________________________Hallucinogens All 0.6% 2.1% 4.7% 95.3%
Grades 7-8 * % 1.7% 3.4% 96.6%Grades 9-12 0.9% 2.2% 5.3% 94.7%
________________________________________________________________________________Uppers All 3.5% 4.1% 5.6% 94.4%
Grades 7-8 0.8% 0.8% 2.5% 97.5%Grades 9-12 4.9% 5.8% 7.1% 92.9%
________________________________________________________________________________Downers All 2.4% 3.9% 5.0% 95.0%
Grades 7-8 * % 0.9% 2.5% 97.5%Grades 9-12 3.6% 5.4% 6.3% 93.7%
________________________________________________________________________________Rohypnol All 0.6% 0.6% 2.1% 97.9%
Grades 7-8 * % * % 1.7% 98.3%Grades 9-12 0.9% 0.9% 2.2% 97.8%
________________________________________________________________________________Steroids All 1.4% 2.3% 3.5% 96.5%
Grades 7-8 2.4% 3.2% 3.2% 96.8%Grades 9-12 0.9% 1.8% 3.6% 96.4%
________________________________________________________________________________Ecstasy All 0.6% 1.5% 4.2% 95.8%
Grades 7-8 * % * % 0.9% 99.1%Grades 9-12 0.9% 2.3% 5.9% 94.1%
________________________________________________________________________________Heroin All 0.6% 0.6% 1.2% 98.8%
Grades 7-8 0.8% 0.8% 0.8% 99.2%Grades 9-12 0.5% 0.5% 1.3% 98.7%

8/14/2019 ELLIS COUNTY - Maypearl ISD - 2004 Texas School Survey of Drug and Alcohol Use
http://slidepdf.com/reader/full/ellis-county-maypearl-isd-2004-texas-school-survey-of-drug-and-alcohol 33/90
MaypearlSpring 2004
Table B2: Prevalence and recency of use of selected substances by grade--> Male students
Past School Ever NeverMonth Year Used Used
________________________________________________________________________________
Tobacco All 12.7% 15.1% 38.4% 61.6%Grades 7-8 4.4% 4.4% 21.8% 78.2%Grades 9-12 17.5% 21.3% 48.0% 52.0%
________________________________________________________________________________Alcohol All 23.6% 32.3% 61.8% 38.2%
Grades 7-8 16.7% 19.7% 54.1% 45.9%Grades 9-12 27.4% 39.3% 66.1% 33.9%
________________________________________________________________________________Inhalants All 5.1% 5.6% 14.8% 85.2%
Grades 7-8 6.1% 7.6% 15.1% 84.9%Grades 9-12 4.6% 4.6% 14.6% 85.4%
________________________________________________________________________________Any Illicit Drug All 9.9% 14.0% 26.2% 73.8%
Grades 7-8 * % 3.1% 6.1% 93.9%Grades 9-12 15.4% 20.0% 37.2% 62.8%
________________________________________________________________________________Marijuana All 10.1% 13.6% 25.4% 74.6%
Grades 7-8 * % 1.5% 3.0% 97.0%Grades 9-12 15.7% 20.3% 37.9% 62.1%________________________________________________________________________________Marijuana Only All 2.8% 4.0% 13.7% 86.3%
Grades 7-8 * % * % 1.4% 98.6%Grades 9-12 4.4% 6.2% 20.6% 79.4%
________________________________________________________________________________Cocaine or Crack All 1.2% 4.1% 7.1% 92.9%
Grades 7-8 * % 1.5% 1.5% 98.5%Grades 9-12 1.9% 5.6% 10.2% 89.8%
________________________________________________________________________________Cocaine All * % 2.3% 6.6% 93.4%
Grades 7-8 * % 1.5% 1.5% 98.5%Grades 9-12 * % 2.8% 9.4% 90.6%
________________________________________________________________________________Crack All 1.2% 2.9% 3.5% 96.5%
Grades 7-8 * % 1.5% 1.5% 98.5%
Grades 9-12 1.9% 3.7% 4.7% 95.3%________________________________________________________________________________Hallucinogens All 0.6% 2.4% 4.7% 95.3%
Grades 7-8 * % 1.7% 3.2% 96.8%Grades 9-12 0.9% 2.8% 5.5% 94.5%
________________________________________________________________________________Uppers All 2.4% 2.4% 4.2% 95.8%
Grades 7-8 * % * % 1.7% 98.3%Grades 9-12 3.7% 3.7% 5.5% 94.5%
________________________________________________________________________________Downers All 2.4% 3.0% 4.7% 95.3%
Grades 7-8 * % * % 1.5% 98.5%Grades 9-12 3.7% 4.6% 6.4% 93.6%
________________________________________________________________________________Rohypnol All 0.6% 0.6% 1.8% 98.2%
Grades 7-8 * % * % * % 100.0%Grades 9-12 0.9% 0.9% 2.8% 97.2%
________________________________________________________________________________Steroids All 2.2% 4.0% 4.6% 95.4%
Grades 7-8 4.6% 6.1% 6.1% 93.9%Grades 9-12 0.9% 2.8% 3.8% 96.2%
________________________________________________________________________________Ecstasy All 0.6% 1.2% 3.1% 96.9%
Grades 7-8 * % * % * % 100.0%Grades 9-12 1.0% 1.9% 4.8% 95.2%
________________________________________________________________________________Heroin All 0.6% 0.6% 1.8% 98.2%
Grades 7-8 * % * % * % 100.0%Grades 9-12 0.9% 0.9% 2.8% 97.2%

8/14/2019 ELLIS COUNTY - Maypearl ISD - 2004 Texas School Survey of Drug and Alcohol Use
http://slidepdf.com/reader/full/ellis-county-maypearl-isd-2004-texas-school-survey-of-drug-and-alcohol 34/90
MaypearlSpring 2004
Table B3: Prevalence and recency of use of selected substances by grade--> Female students
Past School Ever NeverMonth Year Used Used
________________________________________________________________________________
Tobacco All 16.1% 20.7% 34.3% 65.7%Grades 7-8 5.1% 10.4% 24.0% 76.0%Grades 9-12 21.3% 25.6% 39.2% 60.8%
________________________________________________________________________________Alcohol All 26.5% 36.1% 61.5% 38.5%
Grades 7-8 13.8% 20.5% 52.7% 47.3%Grades 9-12 32.5% 43.5% 65.7% 34.3%
________________________________________________________________________________Inhalants All 4.0% 9.1% 16.6% 83.4%
Grades 7-8 3.3% 8.4% 13.4% 86.6%Grades 9-12 4.3% 9.4% 18.1% 81.9%
________________________________________________________________________________Any Illicit Drug All 12.1% 17.7% 25.8% 74.2%
Grades 7-8 3.4% 10.3% 15.6% 84.4%Grades 9-12 16.2% 21.3% 30.6% 69.4%
________________________________________________________________________________Marijuana All 9.4% 16.4% 23.9% 76.1%
Grades 7-8 1.9% 5.4% 11.0% 89.0%Grades 9-12 12.8% 21.3% 29.7% 70.3%________________________________________________________________________________Marijuana Only All 3.9% 6.7% 12.8% 87.2%
Grades 7-8 * % 3.3% 6.8% 93.2%Grades 9-12 5.7% 8.2% 15.6% 84.4%
________________________________________________________________________________Cocaine or Crack All 1.2% 2.9% 5.3% 94.7%
Grades 7-8 * % * % * % 100.0%Grades 9-12 1.7% 4.3% 7.8% 92.2%
________________________________________________________________________________Cocaine All 1.2% 3.0% 5.3% 94.7%
Grades 7-8 * % * % * % 100.0%Grades 9-12 1.7% 4.3% 7.8% 92.2%
________________________________________________________________________________Crack All 1.2% 1.2% 2.4% 97.6%
Grades 7-8 * % * % * % 100.0%
Grades 9-12 1.7% 1.7% 3.5% 96.5%________________________________________________________________________________Hallucinogens All 0.6% 1.8% 4.7% 95.3%
Grades 7-8 * % 1.8% 3.7% 96.3%Grades 9-12 0.9% 1.8% 5.2% 94.8%
________________________________________________________________________________Uppers All 4.6% 5.8% 7.0% 93.0%
Grades 7-8 1.6% 1.6% 3.4% 96.6%Grades 9-12 6.1% 7.8% 8.7% 91.3%
________________________________________________________________________________Downers All 2.4% 4.8% 5.4% 94.6%
Grades 7-8 * % 1.8% 3.6% 96.4%Grades 9-12 3.5% 6.2% 6.2% 93.8%
________________________________________________________________________________Rohypnol All 0.6% 0.6% 2.3% 97.7%
Grades 7-8 * % * % 3.5% 96.5%Grades 9-12 0.9% 0.9% 1.7% 98.3%
________________________________________________________________________________Steroids All 0.6% 0.6% 2.4% 97.6%
Grades 7-8 * % * % * % 100.0%Grades 9-12 0.9% 0.9% 3.5% 96.5%
________________________________________________________________________________Ecstasy All 0.6% 1.8% 5.3% 94.7%
Grades 7-8 * % * % 1.8% 98.2%Grades 9-12 0.9% 2.6% 7.0% 93.0%
________________________________________________________________________________Heroin All 0.5% 0.5% 0.5% 99.5%
Grades 7-8 1.6% 1.6% 1.6% 98.4%Grades 9-12 * % * % * % 100.0%

8/14/2019 ELLIS COUNTY - Maypearl ISD - 2004 Texas School Survey of Drug and Alcohol Use
http://slidepdf.com/reader/full/ellis-county-maypearl-isd-2004-texas-school-survey-of-drug-and-alcohol 35/90
MaypearlSpring 2004
Table B4: Prevalence and recency of use of selected substances by grade--> White students
Past School Ever NeverMonth Year Used Used
________________________________________________________________________________
Tobacco All 15.7% 19.0% 34.9% 65.1%Grades 7-8 3.2% 5.5% 17.1% 82.9%Grades 9-12 22.6% 26.3% 44.6% 55.4%
________________________________________________________________________________Alcohol All 25.3% 32.8% 60.1% 39.9%
Grades 7-8 12.9% 18.3% 45.6% 54.4%Grades 9-12 32.0% 40.8% 68.0% 32.0%
________________________________________________________________________________Inhalants All 3.3% 5.3% 10.9% 89.1%
Grades 7-8 2.3% 4.4% 8.7% 91.3%Grades 9-12 3.9% 5.7% 12.1% 87.9%
________________________________________________________________________________Any Illicit Drug All 11.0% 15.4% 24.3% 75.7%
Grades 7-8 1.1% 5.5% 7.8% 92.2%Grades 9-12 16.3% 20.7% 33.2% 66.8%
________________________________________________________________________________Marijuana All 9.8% 14.3% 22.9% 77.1%
Grades 7-8 1.1% 2.2% 4.5% 95.5%Grades 9-12 14.5% 20.8% 32.8% 67.2%________________________________________________________________________________Marijuana Only All 3.6% 5.1% 12.3% 87.7%
Grades 7-8 * % 1.0% 2.1% 97.9%Grades 9-12 5.5% 7.3% 17.8% 82.2%
________________________________________________________________________________Cocaine or Crack All 1.7% 2.9% 4.5% 95.5%
Grades 7-8 * % * % * % 100.0%Grades 9-12 2.5% 4.4% 7.0% 93.0%
________________________________________________________________________________Cocaine All 0.8% 2.5% 4.1% 95.9%
Grades 7-8 * % * % * % 100.0%Grades 9-12 1.3% 3.8% 6.4% 93.6%
________________________________________________________________________________Crack All 1.7% 1.7% 2.5% 97.5%
Grades 7-8 * % * % * % 100.0%
Grades 9-12 2.6% 2.6% 3.8% 96.2%________________________________________________________________________________Hallucinogens All 0.4% 2.5% 4.9% 95.1%
Grades 7-8 * % 2.3% 3.4% 96.6%Grades 9-12 0.6% 2.6% 5.7% 94.3%
________________________________________________________________________________Uppers All 3.7% 4.6% 5.8% 94.2%
Grades 7-8 * % * % 1.2% 98.8%Grades 9-12 5.7% 7.0% 8.3% 91.7%
________________________________________________________________________________Downers All 2.5% 4.1% 5.0% 95.0%
Grades 7-8 * % 1.2% 1.2% 98.8%Grades 9-12 3.8% 5.8% 7.0% 93.0%
________________________________________________________________________________Rohypnol All 0.8% 0.8% 2.8% 97.2%
Grades 7-8 * % * % 2.3% 97.7%Grades 9-12 1.3% 1.3% 3.2% 96.8%
________________________________________________________________________________Steroids All 1.2% 2.4% 4.0% 96.0%
Grades 7-8 2.1% 3.1% 3.1% 96.9%Grades 9-12 0.6% 1.9% 4.5% 95.5%
________________________________________________________________________________Ecstasy All 0.8% 1.7% 4.1% 95.9%
Grades 7-8 * % * % 1.1% 98.9%Grades 9-12 1.3% 2.6% 5.8% 94.2%
________________________________________________________________________________Heroin All 0.4% 0.4% 0.4% 99.6%
Grades 7-8 * % * % * % 100.0%Grades 9-12 0.6% 0.6% 0.6% 99.4%

8/14/2019 ELLIS COUNTY - Maypearl ISD - 2004 Texas School Survey of Drug and Alcohol Use
http://slidepdf.com/reader/full/ellis-county-maypearl-isd-2004-texas-school-survey-of-drug-and-alcohol 36/90
MaypearlSpring 2004
Table B5: Prevalence and recency of use of selected substances by grade--> Black students
Past School Ever NeverMonth Year Used Used
________________________________________________________________________________
Tobacco All 8.2% 8.2% 26.5% 73.5%Grades 7-8 * % * % * % 100.0%Grades 9-12 * % * % * % 100.0%
________________________________________________________________________________Alcohol All 16.9% 32.7% 58.1% 41.9%
Grades 7-8 * % * % * % 100.0%Grades 9-12 * % * % * % 100.0%
________________________________________________________________________________Inhalants All 6.9% 6.9% 6.9% 93.1%
Grades 7-8 * % * % * % 100.0%Grades 9-12 * % * % * % 100.0%
________________________________________________________________________________Any Illicit Drug All 8.6% 8.6% 41.5% 58.5%
Grades 7-8 * % * % * % 100.0%Grades 9-12 * % * % * % 100.0%
________________________________________________________________________________Marijuana All 9.4% 9.4% 45.2% 54.8%
Grades 7-8 * % * % * % 100.0%Grades 9-12 * % * % * % 100.0%________________________________________________________________________________Marijuana Only All * % * % 30.3% 69.7%
Grades 7-8 * % * % * % 100.0%Grades 9-12 * % * % * % 100.0%
________________________________________________________________________________Cocaine or Crack All * % * % 9.4% 90.6%
Grades 7-8 * % * % * % 100.0%Grades 9-12 * % * % * % 100.0%
________________________________________________________________________________Cocaine All * % * % 9.4% 90.6%
Grades 7-8 * % * % * % 100.0%Grades 9-12 * % * % * % 100.0%
________________________________________________________________________________Crack All * % * % * % 100.0%
Grades 7-8 * % * % * % 100.0%
Grades 9-12 * % * % * % 100.0%________________________________________________________________________________Hallucinogens All * % * % * % 100.0%
Grades 7-8 * % * % * % 100.0%Grades 9-12 * % * % * % 100.0%
________________________________________________________________________________Uppers All * % * % * % 100.0%
Grades 7-8 * % * % * % 100.0%Grades 9-12 * % * % * % 100.0%
________________________________________________________________________________Downers All * % * % * % 100.0%
Grades 7-8 * % * % * % 100.0%Grades 9-12 * % * % * % 100.0%
________________________________________________________________________________Rohypnol All * % * % * % 100.0%
Grades 7-8 * % * % * % 100.0%Grades 9-12 * % * % * % 100.0%
________________________________________________________________________________Steroids All 8.2% 8.2% 8.2% 91.8%
Grades 7-8 * % * % * % 100.0%Grades 9-12 * % * % * % 100.0%
________________________________________________________________________________Ecstasy All * % * % * % 100.0%
Grades 7-8 * % * % * % 100.0%Grades 9-12 * % * % * % 100.0%
________________________________________________________________________________Heroin All * % * % * % 100.0%
Grades 7-8 * % * % * % 100.0%Grades 9-12 * % * % * % 100.0%
8/14/2019 ELLIS COUNTY - Maypearl ISD - 2004 Texas School Survey of Drug and Alcohol Use
http://slidepdf.com/reader/full/ellis-county-maypearl-isd-2004-texas-school-survey-of-drug-and-alcohol 37/90
MaypearlSpring 2004
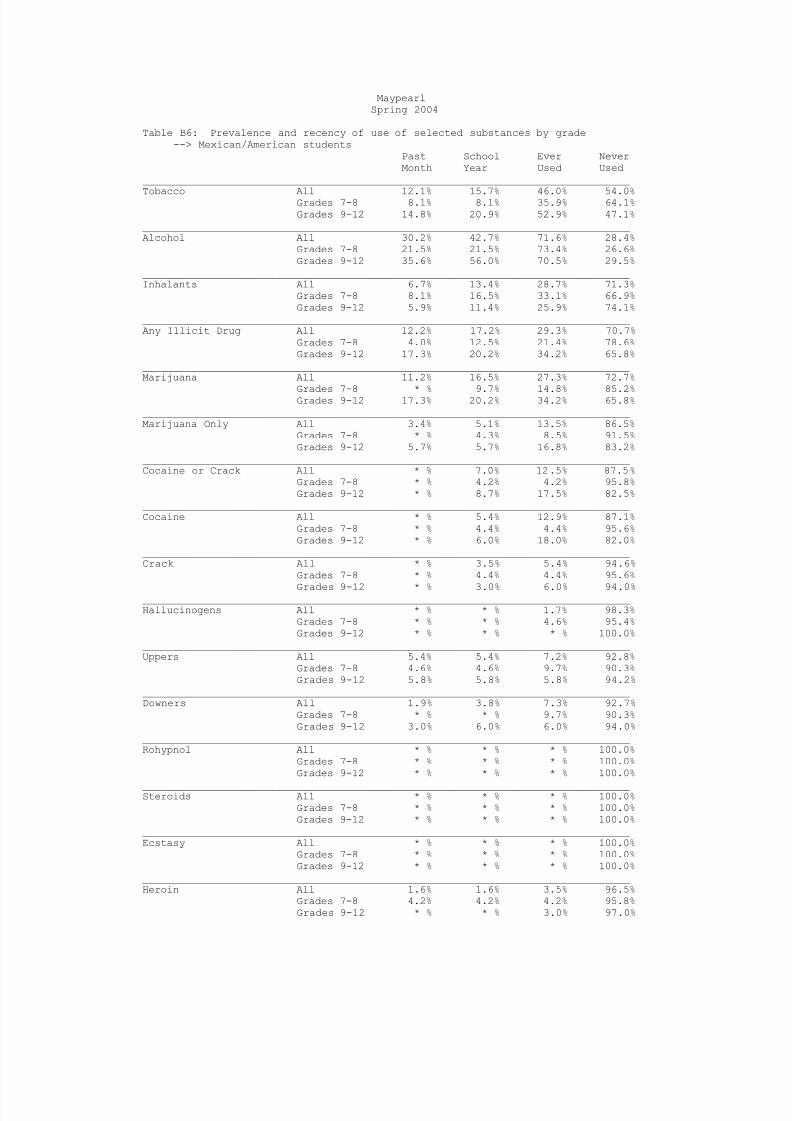
Table B6: Prevalence and recency of use of selected substances by grade--> Mexican/American students
Past School Ever NeverMonth Year Used Used
________________________________________________________________________________
Tobacco All 12.1% 15.7% 46.0% 54.0%Grades 7-8 8.1% 8.1% 35.9% 64.1%Grades 9-12 14.8% 20.9% 52.9% 47.1%
________________________________________________________________________________Alcohol All 30.2% 42.7% 71.6% 28.4%
Grades 7-8 21.5% 21.5% 73.4% 26.6%Grades 9-12 35.6% 56.0% 70.5% 29.5%
________________________________________________________________________________Inhalants All 6.7% 13.4% 28.7% 71.3%
Grades 7-8 8.1% 16.5% 33.1% 66.9%Grades 9-12 5.9% 11.4% 25.9% 74.1%
________________________________________________________________________________Any Illicit Drug All 12.2% 17.2% 29.3% 70.7%
Grades 7-8 4.0% 12.5% 21.4% 78.6%Grades 9-12 17.3% 20.2% 34.2% 65.8%
________________________________________________________________________________Marijuana All 11.2% 16.5% 27.3% 72.7%
Grades 7-8 * % 9.7% 14.8% 85.2%Grades 9-12 17.3% 20.2% 34.2% 65.8%________________________________________________________________________________Marijuana Only All 3.4% 5.1% 13.5% 86.5%
Grades 7-8 * % 4.3% 8.5% 91.5%Grades 9-12 5.7% 5.7% 16.8% 83.2%
________________________________________________________________________________Cocaine or Crack All * % 7.0% 12.5% 87.5%
Grades 7-8 * % 4.2% 4.2% 95.8%Grades 9-12 * % 8.7% 17.5% 82.5%
________________________________________________________________________________Cocaine All * % 5.4% 12.9% 87.1%
Grades 7-8 * % 4.4% 4.4% 95.6%Grades 9-12 * % 6.0% 18.0% 82.0%
________________________________________________________________________________Crack All * % 3.5% 5.4% 94.6%
Grades 7-8 * % 4.4% 4.4% 95.6%
Grades 9-12 * % 3.0% 6.0% 94.0%________________________________________________________________________________Hallucinogens All * % * % 1.7% 98.3%
Grades 7-8 * % * % 4.6% 95.4%Grades 9-12 * % * % * % 100.0%
________________________________________________________________________________Uppers All 5.4% 5.4% 7.2% 92.8%
Grades 7-8 4.6% 4.6% 9.7% 90.3%Grades 9-12 5.8% 5.8% 5.8% 94.2%
________________________________________________________________________________Downers All 1.9% 3.8% 7.3% 92.7%
Grades 7-8 * % * % 9.7% 90.3%Grades 9-12 3.0% 6.0% 6.0% 94.0%
________________________________________________________________________________Rohypnol All * % * % * % 100.0%
Grades 7-8 * % * % * % 100.0%Grades 9-12 * % * % * % 100.0%
________________________________________________________________________________Steroids All * % * % * % 100.0%
Grades 7-8 * % * % * % 100.0%Grades 9-12 * % * % * % 100.0%
________________________________________________________________________________Ecstasy All * % * % * % 100.0%
Grades 7-8 * % * % * % 100.0%Grades 9-12 * % * % * % 100.0%
________________________________________________________________________________Heroin All 1.6% 1.6% 3.5% 96.5%
Grades 7-8 4.2% 4.2% 4.2% 95.8%Grades 9-12 * % * % 3.0% 97.0%

8/14/2019 ELLIS COUNTY - Maypearl ISD - 2004 Texas School Survey of Drug and Alcohol Use
http://slidepdf.com/reader/full/ellis-county-maypearl-isd-2004-texas-school-survey-of-drug-and-alcohol 38/90
MaypearlSpring 2004
Table B7: Prevalence and recency of use of selected substances by grade--> Students reporting A and B grades
Past School Ever NeverMonth Year Used Used
________________________________________________________________________________
Tobacco All 12.1% 15.9% 33.5% 66.5%Grades 7-8 3.5% 7.1% 19.7% 80.3%Grades 9-12 16.5% 20.3% 40.5% 59.5%
________________________________________________________________________________Alcohol All 23.3% 30.3% 58.5% 41.5%
Grades 7-8 9.5% 11.8% 44.6% 55.4%Grades 9-12 30.2% 39.6% 65.5% 34.5%
________________________________________________________________________________Inhalants All 4.4% 6.5% 14.2% 85.8%
Grades 7-8 5.7% 8.1% 15.0% 85.0%Grades 9-12 3.8% 5.6% 13.8% 86.2%
________________________________________________________________________________Any Illicit Drug All 9.5% 13.7% 24.0% 76.0%
Grades 7-8 2.3% 6.0% 10.8% 89.2%Grades 9-12 13.1% 17.5% 30.6% 69.4%
________________________________________________________________________________Marijuana All 8.5% 12.7% 23.2% 76.8%
Grades 7-8 1.3% 2.5% 7.5% 92.5%Grades 9-12 12.0% 17.7% 30.9% 69.1%________________________________________________________________________________Marijuana Only All 3.7% 5.3% 14.2% 85.8%
Grades 7-8 * % 1.2% 4.7% 95.3%Grades 9-12 5.5% 7.4% 19.0% 81.0%
________________________________________________________________________________Cocaine or Crack All 0.8% 2.1% 4.2% 95.8%
Grades 7-8 * % * % * % 100.0%Grades 9-12 1.3% 3.2% 6.3% 93.7%
________________________________________________________________________________Cocaine All 0.9% 1.7% 4.3% 95.7%
Grades 7-8 * % * % * % 100.0%Grades 9-12 1.3% 2.6% 6.4% 93.6%
________________________________________________________________________________Crack All 0.9% 1.3% 1.7% 98.3%
Grades 7-8 * % * % * % 100.0%
Grades 9-12 1.3% 1.9% 2.6% 97.4%________________________________________________________________________________Hallucinogens All 0.8% 2.1% 4.2% 95.8%
Grades 7-8 * % 1.2% 2.5% 97.5%Grades 9-12 1.3% 2.5% 5.0% 95.0%
________________________________________________________________________________Uppers All 2.1% 2.5% 4.2% 95.8%
Grades 7-8 1.1% 1.1% 2.4% 97.6%Grades 9-12 2.5% 3.2% 5.1% 94.9%
________________________________________________________________________________Downers All 1.3% 2.6% 3.9% 96.1%
Grades 7-8 * % 1.3% 2.5% 97.5%Grades 9-12 1.9% 3.2% 4.5% 95.5%
________________________________________________________________________________Rohypnol All 0.8% 0.8% 2.1% 97.9%
Grades 7-8 * % * % 2.5% 97.5%Grades 9-12 1.3% 1.3% 1.9% 98.1%
________________________________________________________________________________Steroids All 1.6% 2.5% 3.8% 96.2%
Grades 7-8 2.4% 2.4% 2.4% 97.6%Grades 9-12 1.3% 2.6% 4.5% 95.5%
________________________________________________________________________________Ecstasy All 0.4% 1.7% 4.3% 95.7%
Grades 7-8 * % * % 1.3% 98.7%Grades 9-12 0.6% 2.5% 5.7% 94.3%
________________________________________________________________________________Heroin All 0.4% 0.4% 0.8% 99.2%
Grades 7-8 1.1% 1.1% 1.1% 98.9%Grades 9-12 * % * % 0.6% 99.4%

8/14/2019 ELLIS COUNTY - Maypearl ISD - 2004 Texas School Survey of Drug and Alcohol Use
http://slidepdf.com/reader/full/ellis-county-maypearl-isd-2004-texas-school-survey-of-drug-and-alcohol 39/90
MaypearlSpring 2004
Table B8: Prevalence and recency of use of selected substances by grade--> Students reporting C, D, and F grades
Past School Ever NeverMonth Year Used Used
________________________________________________________________________________
Tobacco All 21.8% 25.1% 45.3% 54.7%Grades 7-8 8.3% 8.3% 30.1% 69.9%Grades 9-12 29.7% 35.0% 54.1% 45.9%
________________________________________________________________________________Alcohol All 35.0% 47.0% 71.1% 28.9%
Grades 7-8 32.0% 40.8% 73.4% 26.6%Grades 9-12 36.7% 50.4% 69.8% 30.2%
________________________________________________________________________________Inhalants All 5.6% 9.8% 19.7% 80.3%
Grades 7-8 2.8% 8.5% 14.2% 85.8%Grades 9-12 7.1% 10.5% 22.8% 77.2%
________________________________________________________________________________Any Illicit Drug All 16.8% 23.2% 33.1% 66.9%
Grades 7-8 * % 8.5% 11.5% 88.5%Grades 9-12 26.2% 31.5% 45.3% 54.7%
________________________________________________________________________________Marijuana All 14.7% 22.3% 30.1% 69.9%
Grades 7-8 * % 5.7% 5.7% 94.3%Grades 9-12 22.8% 31.5% 43.5% 56.5%________________________________________________________________________________Marijuana Only All 3.2% 5.2% 10.5% 89.5%
Grades 7-8 * % 2.7% 2.7% 97.3%Grades 9-12 4.9% 6.6% 14.9% 85.1%
________________________________________________________________________________Cocaine or Crack All 2.3% 7.9% 12.5% 87.5%
Grades 7-8 * % 2.8% 2.8% 97.2%Grades 9-12 3.6% 10.6% 17.7% 82.3%
________________________________________________________________________________Cocaine All * % 5.6% 11.3% 88.7%
Grades 7-8 * % 2.8% 2.8% 97.2%Grades 9-12 * % 7.1% 15.9% 84.1%
________________________________________________________________________________Crack All 2.3% 4.5% 6.8% 93.2%
Grades 7-8 * % 2.9% 2.9% 97.1%
Grades 9-12 3.6% 5.3% 8.9% 91.1%________________________________________________________________________________Hallucinogens All * % 2.3% 6.8% 93.2%
Grades 7-8 * % 3.2% 6.1% 93.9%Grades 9-12 * % 1.8% 7.2% 92.8%
________________________________________________________________________________Uppers All 8.1% 9.3% 10.4% 89.6%
Grades 7-8 * % * % 3.3% 96.7%Grades 9-12 12.3% 14.0% 14.0% 86.0%
________________________________________________________________________________Downers All 5.7% 8.0% 9.0% 91.0%
Grades 7-8 * % * % 2.9% 97.1%Grades 9-12 8.7% 12.2% 12.2% 87.8%
________________________________________________________________________________Rohypnol All * % * % 2.4% 97.6%
Grades 7-8 * % * % * % 100.0%Grades 9-12 * % * % 3.7% 96.3%
________________________________________________________________________________Steroids All 1.0% 2.0% 3.2% 96.8%
Grades 7-8 2.8% 5.7% 5.7% 94.3%Grades 9-12 * % * % 1.9% 98.1%
________________________________________________________________________________Ecstasy All 1.2% 1.2% 4.7% 95.3%
Grades 7-8 * % * % * % 100.0%Grades 9-12 1.9% 1.9% 7.4% 92.6%
________________________________________________________________________________Heroin All 1.2% 1.2% 2.3% 97.7%
Grades 7-8 * % * % * % 100.0%Grades 9-12 1.8% 1.8% 3.6% 96.4%

8/14/2019 ELLIS COUNTY - Maypearl ISD - 2004 Texas School Survey of Drug and Alcohol Use
http://slidepdf.com/reader/full/ellis-county-maypearl-isd-2004-texas-school-survey-of-drug-and-alcohol 40/90
MaypearlSpring 2004
Table B9: Prevalence and recency of use of selected substances by grade--> Students living with two parents
Past School Ever NeverMonth Year Used Used
________________________________________________________________________________
Tobacco All 12.5% 14.8% 27.6% 72.4%Grades 7-8 5.3% 5.3% 17.2% 82.8%Grades 9-12 15.8% 19.2% 32.4% 67.6%
________________________________________________________________________________Alcohol All 20.2% 28.6% 54.6% 45.4%
Grades 7-8 8.1% 13.3% 43.7% 56.3%Grades 9-12 25.8% 35.7% 59.6% 40.4%
________________________________________________________________________________Inhalants All 3.1% 5.3% 14.7% 85.3%
Grades 7-8 2.8% 4.1% 12.2% 87.8%Grades 9-12 3.3% 5.9% 15.9% 84.1%
________________________________________________________________________________Any Illicit Drug All 6.3% 11.2% 21.5% 78.5%
Grades 7-8 * % 4.1% 9.6% 90.4%Grades 9-12 9.2% 14.5% 26.9% 73.1%
________________________________________________________________________________Marijuana All 6.4% 10.5% 20.0% 80.0%
Grades 7-8 * % 1.3% 5.5% 94.5%Grades 9-12 9.3% 14.6% 26.4% 73.6%________________________________________________________________________________Marijuana Only All 3.1% 4.8% 13.1% 86.9%
Grades 7-8 * % 1.3% 3.9% 96.1%Grades 9-12 4.5% 6.4% 17.2% 82.8%
________________________________________________________________________________Cocaine or Crack All 0.5% 2.7% 4.1% 95.9%
Grades 7-8 * % * % * % 100.0%Grades 9-12 0.7% 4.0% 6.0% 94.0%
________________________________________________________________________________Cocaine All * % 1.4% 3.7% 96.3%
Grades 7-8 * % * % * % 100.0%Grades 9-12 * % 2.0% 5.4% 94.6%
________________________________________________________________________________Crack All 0.5% 1.4% 2.3% 97.7%
Grades 7-8 * % * % * % 100.0%
Grades 9-12 0.7% 2.0% 3.3% 96.7%________________________________________________________________________________Hallucinogens All 0.5% 0.9% 2.7% 97.3%
Grades 7-8 * % 1.4% 2.9% 97.1%Grades 9-12 0.7% 0.7% 2.7% 97.3%
________________________________________________________________________________Uppers All 0.9% 1.9% 2.8% 97.2%
Grades 7-8 * % * % 3.0% 97.0%Grades 9-12 1.3% 2.7% 2.7% 97.3%
________________________________________________________________________________Downers All 0.5% 2.3% 2.8% 97.2%
Grades 7-8 * % 1.5% 2.9% 97.1%Grades 9-12 0.7% 2.7% 2.7% 97.3%
________________________________________________________________________________Rohypnol All * % * % 0.9% 99.1%
Grades 7-8 * % * % 1.4% 98.6%Grades 9-12 * % * % 0.7% 99.3%
________________________________________________________________________________Steroids All 1.7% 2.7% 3.6% 96.4%
Grades 7-8 4.0% 4.0% 4.0% 96.0%Grades 9-12 0.7% 2.1% 3.4% 96.6%
________________________________________________________________________________Ecstasy All 0.5% 1.4% 3.3% 96.7%
Grades 7-8 * % * % 1.5% 98.5%Grades 9-12 0.7% 2.0% 4.1% 95.9%
________________________________________________________________________________Heroin All 0.5% 0.5% 1.4% 98.6%
Grades 7-8 * % * % * % 100.0%Grades 9-12 0.7% 0.7% 2.0% 98.0%

8/14/2019 ELLIS COUNTY - Maypearl ISD - 2004 Texas School Survey of Drug and Alcohol Use
http://slidepdf.com/reader/full/ellis-county-maypearl-isd-2004-texas-school-survey-of-drug-and-alcohol 41/90
MaypearlSpring 2004
Table B10: Prevalence and recency of use of selected substances by grade--> Students not living with two parents
Past School Ever NeverMonth Year Used Used
________________________________________________________________________________
Tobacco All 19.4% 25.2% 53.4% 46.6%Grades 7-8 4.2% 10.9% 29.8% 70.2%Grades 9-12 28.3% 33.7% 67.4% 32.6%
________________________________________________________________________________Alcohol All 35.4% 46.2% 75.6% 24.4%
Grades 7-8 27.6% 32.1% 68.1% 31.9%Grades 9-12 40.0% 54.5% 79.9% 20.1%
________________________________________________________________________________Inhalants All 6.5% 10.5% 16.4% 83.6%
Grades 7-8 6.1% 12.4% 14.6% 85.4%Grades 9-12 6.7% 9.4% 17.5% 82.5%
________________________________________________________________________________Any Illicit Drug All 20.8% 25.7% 35.7% 64.3%
Grades 7-8 4.2% 10.7% 12.9% 87.1%Grades 9-12 30.5% 34.5% 49.1% 50.9%
________________________________________________________________________________Marijuana All 17.0% 24.6% 34.7% 65.3%
Grades 7-8 2.3% 6.6% 8.9% 91.1%Grades 9-12 25.5% 35.0% 49.7% 50.3%________________________________________________________________________________Marijuana Only All 4.9% 7.3% 14.8% 85.2%
Grades 7-8 * % 2.2% 4.4% 95.6%Grades 9-12 7.8% 10.4% 21.0% 79.0%
________________________________________________________________________________Cocaine or Crack All 2.6% 5.0% 10.2% 89.8%
Grades 7-8 * % 2.0% 2.0% 98.0%Grades 9-12 4.1% 6.8% 15.0% 85.0%
________________________________________________________________________________Cocaine All 1.7% 5.1% 10.2% 89.8%
Grades 7-8 * % 2.1% 2.1% 97.9%Grades 9-12 2.7% 6.8% 15.0% 85.0%
________________________________________________________________________________Crack All 2.6% 3.4% 4.2% 95.8%
Grades 7-8 * % 2.1% 2.1% 97.9%
Grades 9-12 4.1% 4.1% 5.5% 94.5%________________________________________________________________________________Hallucinogens All 0.9% 4.2% 8.4% 91.6%
Grades 7-8 * % 2.3% 4.3% 95.7%Grades 9-12 1.3% 5.4% 10.7% 89.3%
________________________________________________________________________________Uppers All 8.5% 8.5% 11.1% 88.9%
Grades 7-8 2.1% 2.1% 2.1% 97.9%Grades 9-12 12.3% 12.3% 16.4% 83.6%
________________________________________________________________________________Downers All 5.9% 6.8% 9.3% 90.7%
Grades 7-8 * % * % 2.1% 97.9%Grades 9-12 9.3% 10.6% 13.3% 86.7%
________________________________________________________________________________Rohypnol All 1.7% 1.7% 4.2% 95.8%
Grades 7-8 * % * % 2.3% 97.7%Grades 9-12 2.7% 2.7% 5.4% 94.6%
________________________________________________________________________________Steroids All 0.9% 1.6% 3.4% 96.6%
Grades 7-8 * % 2.1% 2.1% 97.9%Grades 9-12 1.4% 1.4% 4.1% 95.9%
________________________________________________________________________________Ecstasy All 0.9% 1.7% 6.0% 94.0%
Grades 7-8 * % * % * % 100.0%Grades 9-12 1.4% 2.8% 9.6% 90.4%
________________________________________________________________________________Heroin All 0.7% 0.7% 0.7% 99.3%
Grades 7-8 2.1% 2.1% 2.1% 97.9%Grades 9-12 * % * % * % 100.0%

8/14/2019 ELLIS COUNTY - Maypearl ISD - 2004 Texas School Survey of Drug and Alcohol Use
http://slidepdf.com/reader/full/ellis-county-maypearl-isd-2004-texas-school-survey-of-drug-and-alcohol 42/90
MaypearlSpring 2004
Table B11: Prevalence and recency of use of selected substances by grade--> Students would seek help from adults for substance abuse problems
Past School Ever NeverMonth Year Used Used
________________________________________________________________________________
Tobacco All 12.5% 16.5% 33.6% 66.4%Grades 7-8 6.7% 9.0% 22.1% 77.9%Grades 9-12 15.5% 20.5% 39.6% 60.4%
________________________________________________________________________________Alcohol All 22.6% 31.0% 60.4% 39.6%
Grades 7-8 13.6% 16.9% 50.0% 50.0%Grades 9-12 27.3% 38.3% 65.8% 34.2%
________________________________________________________________________________Inhalants All 2.8% 6.8% 15.2% 84.8%
Grades 7-8 3.4% 7.8% 14.4% 85.6%Grades 9-12 2.5% 6.2% 15.6% 84.4%
________________________________________________________________________________Any Illicit Drug All 9.8% 13.8% 22.7% 77.3%
Grades 7-8 1.2% 7.0% 9.2% 90.8%Grades 9-12 14.2% 17.3% 29.7% 70.3%
________________________________________________________________________________Marijuana All 9.1% 12.8% 21.4% 78.6%
Grades 7-8 1.2% 3.6% 5.9% 94.1%Grades 9-12 13.0% 17.3% 29.0% 71.0%________________________________________________________________________________Marijuana Only All 3.2% 4.7% 12.3% 87.7%
Grades 7-8 * % 2.2% 3.2% 96.8%Grades 9-12 4.8% 6.0% 17.0% 83.0%
________________________________________________________________________________Cocaine or Crack All 0.8% 2.9% 5.0% 95.0%
Grades 7-8 * % * % * % 100.0%Grades 9-12 1.3% 4.4% 7.5% 92.5%
________________________________________________________________________________Cocaine All 0.4% 2.5% 5.0% 95.0%
Grades 7-8 * % * % * % 100.0%Grades 9-12 0.6% 3.7% 7.5% 92.5%
________________________________________________________________________________Crack All 0.8% 1.2% 2.1% 97.9%
Grades 7-8 * % * % * % 100.0%
Grades 9-12 1.3% 1.9% 3.1% 96.9%________________________________________________________________________________Hallucinogens All * % 0.8% 2.9% 97.1%
Grades 7-8 * % 2.4% 3.7% 96.3%Grades 9-12 * % * % 2.5% 97.5%
________________________________________________________________________________Uppers All 2.5% 2.9% 3.7% 96.3%
Grades 7-8 * % * % 1.2% 98.8%Grades 9-12 3.7% 4.4% 5.0% 95.0%
________________________________________________________________________________Downers All 2.5% 3.7% 4.2% 95.8%
Grades 7-8 * % 1.2% 1.2% 98.8%Grades 9-12 3.8% 5.0% 5.7% 94.3%
________________________________________________________________________________Rohypnol All * % * % 1.6% 98.4%
Grades 7-8 * % * % 2.4% 97.6%Grades 9-12 * % * % 1.2% 98.8%
________________________________________________________________________________Steroids All 0.7% 2.0% 3.2% 96.8%
Grades 7-8 2.2% 3.4% 3.4% 96.6%Grades 9-12 * % 1.3% 3.2% 96.8%
________________________________________________________________________________Ecstasy All * % 0.4% 2.5% 97.5%
Grades 7-8 * % * % 1.2% 98.8%Grades 9-12 * % 0.6% 3.2% 96.8%
________________________________________________________________________________Heroin All * % * % 0.4% 99.6%
Grades 7-8 * % * % * % 100.0%Grades 9-12 * % * % 0.6% 99.4%
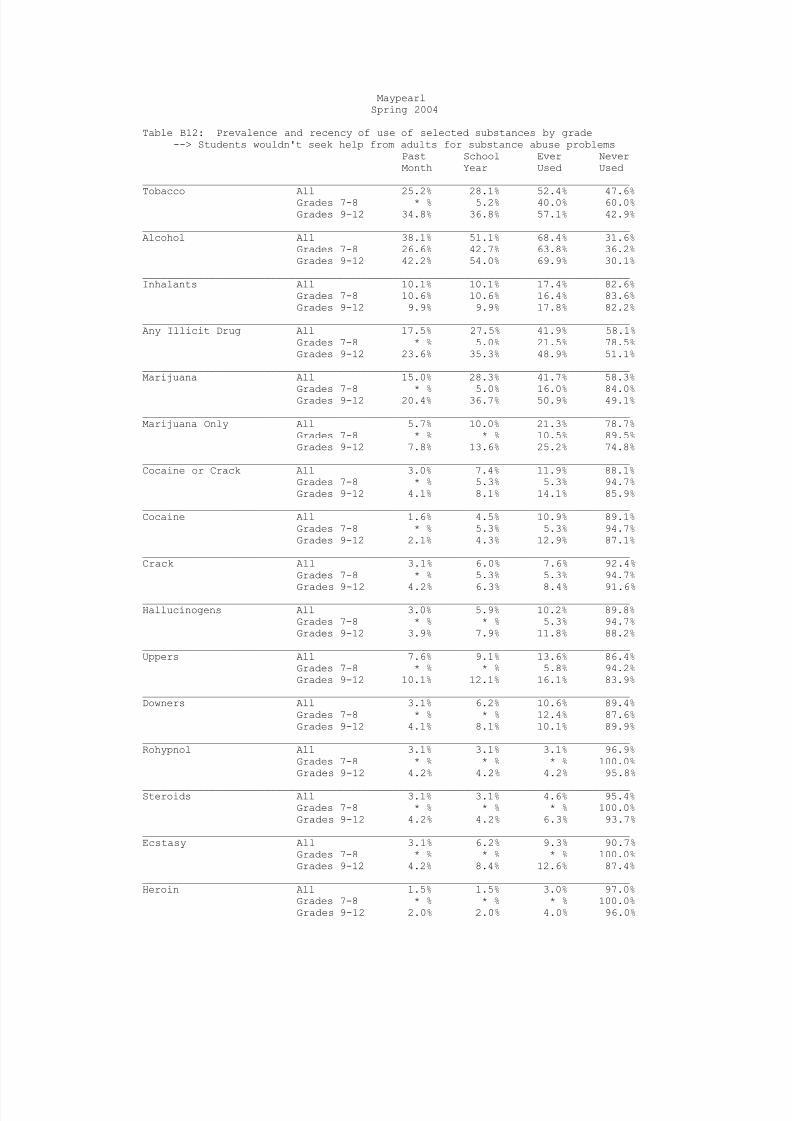
8/14/2019 ELLIS COUNTY - Maypearl ISD - 2004 Texas School Survey of Drug and Alcohol Use
http://slidepdf.com/reader/full/ellis-county-maypearl-isd-2004-texas-school-survey-of-drug-and-alcohol 43/90
MaypearlSpring 2004
Table B12: Prevalence and recency of use of selected substances by grade--> Students wouldn't seek help from adults for substance abuse problems
Past School Ever NeverMonth Year Used Used
________________________________________________________________________________
Tobacco All 25.2% 28.1% 52.4% 47.6%Grades 7-8 * % 5.2% 40.0% 60.0%Grades 9-12 34.8% 36.8% 57.1% 42.9%
________________________________________________________________________________Alcohol All 38.1% 51.1% 68.4% 31.6%
Grades 7-8 26.6% 42.7% 63.8% 36.2%Grades 9-12 42.2% 54.0% 69.9% 30.1%
________________________________________________________________________________Inhalants All 10.1% 10.1% 17.4% 82.6%
Grades 7-8 10.6% 10.6% 16.4% 83.6%Grades 9-12 9.9% 9.9% 17.8% 82.2%
________________________________________________________________________________Any Illicit Drug All 17.5% 27.5% 41.9% 58.1%
Grades 7-8 * % 5.0% 21.5% 78.5%Grades 9-12 23.6% 35.3% 48.9% 51.1%
________________________________________________________________________________Marijuana All 15.0% 28.3% 41.7% 58.3%
Grades 7-8 * % 5.0% 16.0% 84.0%Grades 9-12 20.4% 36.7% 50.9% 49.1%________________________________________________________________________________Marijuana Only All 5.7% 10.0% 21.3% 78.7%
Grades 7-8 * % * % 10.5% 89.5%Grades 9-12 7.8% 13.6% 25.2% 74.8%
________________________________________________________________________________Cocaine or Crack All 3.0% 7.4% 11.9% 88.1%
Grades 7-8 * % 5.3% 5.3% 94.7%Grades 9-12 4.1% 8.1% 14.1% 85.9%
________________________________________________________________________________Cocaine All 1.6% 4.5% 10.9% 89.1%
Grades 7-8 * % 5.3% 5.3% 94.7%Grades 9-12 2.1% 4.3% 12.9% 87.1%
________________________________________________________________________________Crack All 3.1% 6.0% 7.6% 92.4%
Grades 7-8 * % 5.3% 5.3% 94.7%
Grades 9-12 4.2% 6.3% 8.4% 91.6%________________________________________________________________________________Hallucinogens All 3.0% 5.9% 10.2% 89.8%
Grades 7-8 * % * % 5.3% 94.7%Grades 9-12 3.9% 7.9% 11.8% 88.2%
________________________________________________________________________________Uppers All 7.6% 9.1% 13.6% 86.4%
Grades 7-8 * % * % 5.8% 94.2%Grades 9-12 10.1% 12.1% 16.1% 83.9%
________________________________________________________________________________Downers All 3.1% 6.2% 10.6% 89.4%
Grades 7-8 * % * % 12.4% 87.6%Grades 9-12 4.1% 8.1% 10.1% 89.9%
________________________________________________________________________________Rohypnol All 3.1% 3.1% 3.1% 96.9%
Grades 7-8 * % * % * % 100.0%Grades 9-12 4.2% 4.2% 4.2% 95.8%
________________________________________________________________________________Steroids All 3.1% 3.1% 4.6% 95.4%
Grades 7-8 * % * % * % 100.0%Grades 9-12 4.2% 4.2% 6.3% 93.7%
________________________________________________________________________________Ecstasy All 3.1% 6.2% 9.3% 90.7%
Grades 7-8 * % * % * % 100.0%Grades 9-12 4.2% 8.4% 12.6% 87.4%
________________________________________________________________________________Heroin All 1.5% 1.5% 3.0% 97.0%
Grades 7-8 * % * % * % 100.0%Grades 9-12 2.0% 2.0% 4.0% 96.0%
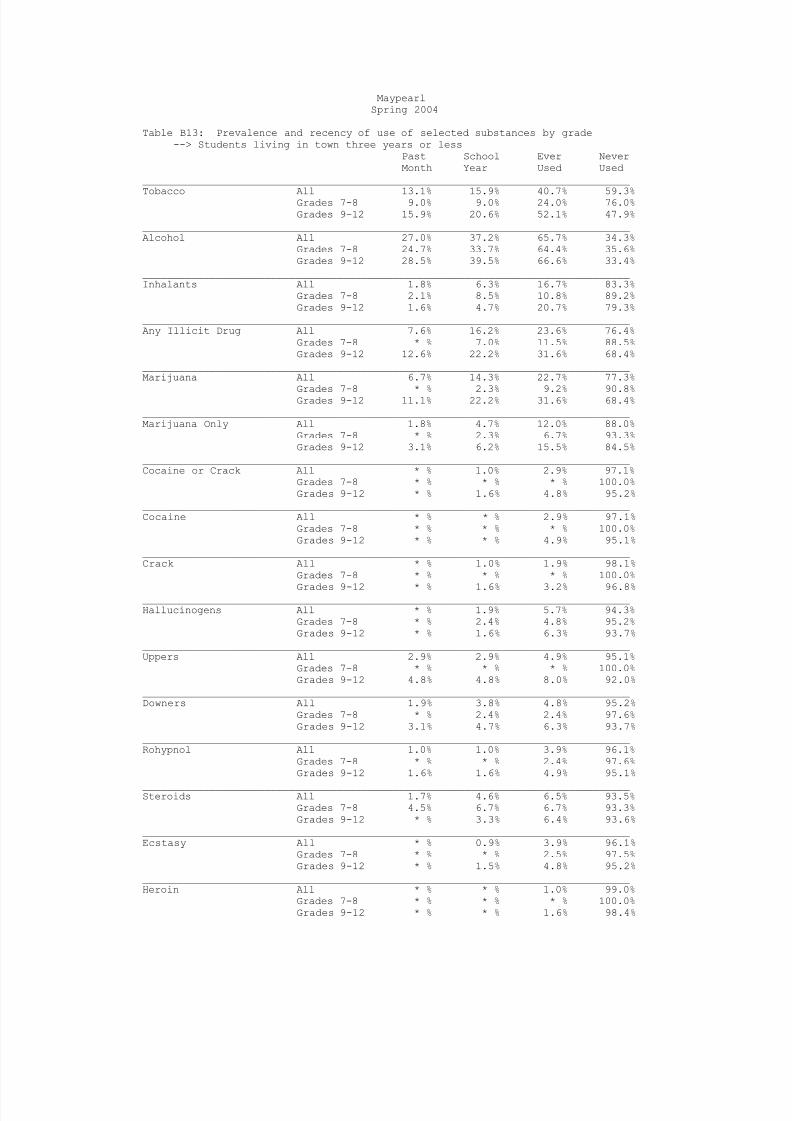
8/14/2019 ELLIS COUNTY - Maypearl ISD - 2004 Texas School Survey of Drug and Alcohol Use
http://slidepdf.com/reader/full/ellis-county-maypearl-isd-2004-texas-school-survey-of-drug-and-alcohol 44/90
MaypearlSpring 2004
Table B13: Prevalence and recency of use of selected substances by grade--> Students living in town three years or less
Past School Ever NeverMonth Year Used Used
________________________________________________________________________________
Tobacco All 13.1% 15.9% 40.7% 59.3%Grades 7-8 9.0% 9.0% 24.0% 76.0%Grades 9-12 15.9% 20.6% 52.1% 47.9%
________________________________________________________________________________Alcohol All 27.0% 37.2% 65.7% 34.3%
Grades 7-8 24.7% 33.7% 64.4% 35.6%Grades 9-12 28.5% 39.5% 66.6% 33.4%
________________________________________________________________________________Inhalants All 1.8% 6.3% 16.7% 83.3%
Grades 7-8 2.1% 8.5% 10.8% 89.2%Grades 9-12 1.6% 4.7% 20.7% 79.3%
________________________________________________________________________________Any Illicit Drug All 7.6% 16.2% 23.6% 76.4%
Grades 7-8 * % 7.0% 11.5% 88.5%Grades 9-12 12.6% 22.2% 31.6% 68.4%
________________________________________________________________________________Marijuana All 6.7% 14.3% 22.7% 77.3%
Grades 7-8 * % 2.3% 9.2% 90.8%Grades 9-12 11.1% 22.2% 31.6% 68.4%________________________________________________________________________________Marijuana Only All 1.8% 4.7% 12.0% 88.0%
Grades 7-8 * % 2.3% 6.7% 93.3%Grades 9-12 3.1% 6.2% 15.5% 84.5%
________________________________________________________________________________Cocaine or Crack All * % 1.0% 2.9% 97.1%
Grades 7-8 * % * % * % 100.0%Grades 9-12 * % 1.6% 4.8% 95.2%
________________________________________________________________________________Cocaine All * % * % 2.9% 97.1%
Grades 7-8 * % * % * % 100.0%Grades 9-12 * % * % 4.9% 95.1%
________________________________________________________________________________Crack All * % 1.0% 1.9% 98.1%
Grades 7-8 * % * % * % 100.0%
Grades 9-12 * % 1.6% 3.2% 96.8%________________________________________________________________________________Hallucinogens All * % 1.9% 5.7% 94.3%
Grades 7-8 * % 2.4% 4.8% 95.2%Grades 9-12 * % 1.6% 6.3% 93.7%
________________________________________________________________________________Uppers All 2.9% 2.9% 4.9% 95.1%
Grades 7-8 * % * % * % 100.0%Grades 9-12 4.8% 4.8% 8.0% 92.0%
________________________________________________________________________________Downers All 1.9% 3.8% 4.8% 95.2%
Grades 7-8 * % 2.4% 2.4% 97.6%Grades 9-12 3.1% 4.7% 6.3% 93.7%
________________________________________________________________________________Rohypnol All 1.0% 1.0% 3.9% 96.1%
Grades 7-8 * % * % 2.4% 97.6%Grades 9-12 1.6% 1.6% 4.9% 95.1%
________________________________________________________________________________Steroids All 1.7% 4.6% 6.5% 93.5%
Grades 7-8 4.5% 6.7% 6.7% 93.3%Grades 9-12 * % 3.3% 6.4% 93.6%
________________________________________________________________________________Ecstasy All * % 0.9% 3.9% 96.1%
Grades 7-8 * % * % 2.5% 97.5%Grades 9-12 * % 1.5% 4.8% 95.2%
________________________________________________________________________________Heroin All * % * % 1.0% 99.0%
Grades 7-8 * % * % * % 100.0%Grades 9-12 * % * % 1.6% 98.4%

8/14/2019 ELLIS COUNTY - Maypearl ISD - 2004 Texas School Survey of Drug and Alcohol Use
http://slidepdf.com/reader/full/ellis-county-maypearl-isd-2004-texas-school-survey-of-drug-and-alcohol 45/90
MaypearlSpring 2004
Table B14: Prevalence and recency of use of selected substances by grade--> Students living in town more than three years
Past School Ever NeverMonth Year Used Used
________________________________________________________________________________
Tobacco All 15.4% 18.9% 34.9% 65.1%Grades 7-8 2.4% 5.1% 21.8% 78.2%Grades 9-12 21.3% 25.1% 40.9% 59.1%
________________________________________________________________________________Alcohol All 24.4% 32.5% 60.1% 39.9%
Grades 7-8 9.0% 11.6% 47.8% 52.2%Grades 9-12 31.3% 41.8% 65.6% 34.4%
________________________________________________________________________________Inhalants All 5.9% 7.6% 14.7% 85.3%
Grades 7-8 6.5% 6.5% 15.4% 84.6%Grades 9-12 5.7% 8.1% 14.4% 85.6%
________________________________________________________________________________Any Illicit Drug All 12.8% 15.7% 27.2% 72.8%
Grades 7-8 1.2% 5.0% 9.0% 91.0%Grades 9-12 18.0% 20.5% 35.3% 64.7%
________________________________________________________________________________Marijuana All 11.4% 15.2% 25.7% 74.3%
Grades 7-8 * % 2.6% 4.0% 96.0%Grades 9-12 16.3% 20.7% 35.1% 64.9%________________________________________________________________________________Marijuana Only All 4.6% 5.8% 14.2% 85.8%
Grades 7-8 * % 1.2% 2.5% 97.5%Grades 9-12 6.7% 7.9% 19.4% 80.6%
________________________________________________________________________________Cocaine or Crack All 1.8% 4.7% 7.8% 92.2%
Grades 7-8 * % 1.2% 1.2% 98.8%Grades 9-12 2.5% 6.3% 10.7% 89.3%
________________________________________________________________________________Cocaine All 0.9% 3.9% 7.4% 92.6%
Grades 7-8 * % 1.3% 1.3% 98.7%Grades 9-12 1.3% 5.1% 10.2% 89.8%
________________________________________________________________________________Crack All 1.8% 2.6% 3.5% 96.5%
Grades 7-8 * % 1.3% 1.3% 98.7%
Grades 9-12 2.5% 3.2% 4.4% 95.6%________________________________________________________________________________Hallucinogens All 0.9% 2.2% 4.3% 95.7%
Grades 7-8 * % 1.4% 2.7% 97.3%Grades 9-12 1.3% 2.5% 5.1% 94.9%
________________________________________________________________________________Uppers All 3.9% 4.8% 6.0% 94.0%
Grades 7-8 1.3% 1.3% 4.0% 96.0%Grades 9-12 5.0% 6.3% 6.9% 93.1%
________________________________________________________________________________Downers All 2.7% 4.0% 5.3% 94.7%
Grades 7-8 * % * % 2.7% 97.3%Grades 9-12 3.8% 5.8% 6.4% 93.6%
________________________________________________________________________________Rohypnol All 0.4% 0.4% 0.9% 99.1%
Grades 7-8 * % * % * % 100.0%Grades 9-12 0.6% 0.6% 1.3% 98.7%
________________________________________________________________________________Steroids All 1.3% 1.3% 2.2% 97.8%
Grades 7-8 1.3% 1.3% 1.3% 98.7%Grades 9-12 1.3% 1.3% 2.6% 97.4%
________________________________________________________________________________Ecstasy All 0.9% 1.8% 4.5% 95.5%
Grades 7-8 * % * % * % 100.0%Grades 9-12 1.3% 2.6% 6.5% 93.5%
________________________________________________________________________________Heroin All 0.8% 0.8% 1.3% 98.7%
Grades 7-8 1.3% 1.3% 1.3% 98.7%Grades 9-12 0.6% 0.6% 1.3% 98.7%

8/14/2019 ELLIS COUNTY - Maypearl ISD - 2004 Texas School Survey of Drug and Alcohol Use
http://slidepdf.com/reader/full/ellis-county-maypearl-isd-2004-texas-school-survey-of-drug-and-alcohol 46/90
MaypearlSpring 2004
The FREQ Procedure
GENDER
q1 Frequency Percent
_______________________________Female 180.9554 50.41Male 178.0164 49.59
Frequency Missing = 1.0281690141
GRADE
q2 Frequency Percent____________________________________Grade 7 61.69014 17.14Grade 8 60 16.67Grade 9 68.4507 19.01Grade 10 53.23944 14.79Grade 11 61.69014 17.14Grade 12 54.92958 15.26
LIVE WITH BOTH PARENTS
q3 Frequency Percent___________________________________No 122.9667 34.62Yes 232.1907 65.38
Frequency Missing = 4.8425849213
AGE
q4 Frequency Percent______________________________________11 or younger 1.943615 0.54
12 18.14416 5.0713 56.00994 15.6514 64.95603 18.1515 61.41712 17.1616 54.44529 15.2117 66.85989 18.6818 34.18496 9.55
Frequency Missing = 2.0390032503
ETHNICITY
q5 Frequency Percent_________________________________________African/American 13.0829 3.71Asian/American 1 0.28
Mexican/American 59.05794 16.73Native/American 8.187432 2.32Other 14.49817 4.11White 257.166 72.85
Frequency Missing = 7.0075370691
The frequencies have been weighted so that theanalysis reflects the distribution of students by grade
level in the district

8/14/2019 ELLIS COUNTY - Maypearl ISD - 2004 Texas School Survey of Drug and Alcohol Use
http://slidepdf.com/reader/full/ellis-county-maypearl-isd-2004-texas-school-survey-of-drug-and-alcohol 47/90
MaypearlSpring 2004
The FREQ Procedure
ON AVERAGE WHAT GRADES DO YOU GET
q6 Frequency Percent
___________________________________Mostly A's 75.20756 21.81Mostly B's 175.0098 50.75Mostly C's 79.08225 22.93Mostly D's 11.80288 3.42Mostly F's 3.774712 1.09
Frequency Missing = 15.122809254
LENGTH OF TIME IN THIS DISTRICT
q7 Frequency Percent__________________________________<1 year 46.86905 13.312-3 years 62.44149 17.74>4 years 242.701 68.95
Frequency Missing = 7.988464725
DO YOU HAVE A JOB
q8 Frequency Percent___________________________________No 272.2542 77.32Yes 79.85017 22.68
Frequency Missing = 7.8956726786
DO YOU GET AN ALLOWANCE
q9 Frequency Percent
___________________________________No 238.1112 68.04Yes 111.8581 31.96
Frequency Missing = 10.030718246
EITHER PARENT COLLEGE GRADUATE
q10 Frequency Percent___________________________________Don't Know 56.47021 16.00No 141.9546 40.22Yes 154.4939 43.78
Frequency Missing = 7.0812567714
The frequencies have been weighted so that theanalysis reflects the distribution of students by grade
level in the district

8/14/2019 ELLIS COUNTY - Maypearl ISD - 2004 Texas School Survey of Drug and Alcohol Use
http://slidepdf.com/reader/full/ellis-county-maypearl-isd-2004-texas-school-survey-of-drug-and-alcohol 48/90
MaypearlSpring 2004
The FREQ Procedure
QUALIFY FOR FREE/REDUCED PRICE LUNCH
q11 Frequency Percent
___________________________________Don't Know 61.92749 17.64No 213.1076 60.71Yes 76.00208 21.65
Frequency Missing = 8.962844943
PARTICIPATE IN ATHLETICS
q12a Frequency Percent___________________________________No 116.7329 34.15Yes 225.1251 65.85
Frequency Missing = 18.141992225
PARTICIPATE IN BAND/ORCHESTRA
q12b Frequency Percent___________________________________No 210.9947 68.35Yes 97.69233 31.65
Frequency Missing = 51.312938675
PARTICIPATE IN CHOIR
q12c Frequency Percent___________________________________No 258.3819 88.84Yes 32.45063 11.16
Frequency Missing = 69.167504987
PARTICIPATE IN DRAMA/SPEECH
q12d Frequency Percent___________________________________No 222.1597 77.69Yes 63.79612 22.31
Frequency Missing = 74.044152218
PARTICIPATE IN DRILL TEAM/CHEERLEADING
q12e Frequency Percent
___________________________________No 255.7157 86.46Yes 40.04235 13.54
Frequency Missing = 64.241925728
The frequencies have been weighted so that theanalysis reflects the distribution of students by grade
level in the district

8/14/2019 ELLIS COUNTY - Maypearl ISD - 2004 Texas School Survey of Drug and Alcohol Use
http://slidepdf.com/reader/full/ellis-county-maypearl-isd-2004-texas-school-survey-of-drug-and-alcohol 49/90
MaypearlSpring 2004
The FREQ Procedure
PARTICIPATE IN STUDENT GOVERNMENT
q12f Frequency Percent
___________________________________No 228.7349 79.24Yes 59.91778 20.76
Frequency Missing = 71.347353308
PARTICIPATE IN SCHOOL NEWSPAPER/YEARBOOK
q12g Frequency Percent___________________________________No 270.3074 95.03Yes 14.1282 4.97
Frequency Missing = 75.564356686
PARTICIPATE IN ACADEMIC CLUBS/SOCIETIES q12h Frequency Percent___________________________________No 223.7022 74.98Yes 74.64812 25.02
Frequency Missing = 61.649658559
PARTICIPATE IN SERVICE CLUBS
q12i Frequency Percent___________________________________No 276.9113 95.94Yes 11.71243 4.06
Frequency Missing = 71.376223361
PARTICIPATE IN VOE/DE/WORK-STUDY
q12j Frequency Percent___________________________________No 275.585 96.13Yes 11.09509 3.87
Frequency Missing = 73.319885333
PARTICIPATE IN OTHER CLUBS
q12k Frequency Percent___________________________________
No 207.5303 70.44Yes 87.11008 29.56
Frequency Missing = 65.359589622
The frequencies have been weighted so that theanalysis reflects the distribution of students by grade
level in the district

8/14/2019 ELLIS COUNTY - Maypearl ISD - 2004 Texas School Survey of Drug and Alcohol Use
http://slidepdf.com/reader/full/ellis-county-maypearl-isd-2004-texas-school-survey-of-drug-and-alcohol 50/90
MaypearlSpring 2004
The FREQ Procedure
DO YOU FEEL SAFE IN YOUR HOME
q13a Frequency Percent
________________________________________Very Safe 265.8298 74.90Somewhat Safe 76.29271 21.49Not Very Safe 5.850823 1.65Not Safe At All 1.028169 0.29Don't Know 5.93208 1.67
Frequency Missing = 5.0664712255
DO YOU FEEL SAFE IN YOUR NEIGHBORHOOD
q13b Frequency Percent________________________________________Very Safe 170.5751 48.34Somewhat Safe 145.5162 41.24Not Very Safe 22.63253 6.41
Not Safe At All 8.974333 2.54Don't Know 5.156667 1.46
Frequency Missing = 7.1451787649
DO YOU FEEL SAFE AT SCHOOL
q13c Frequency Percent________________________________________Very Safe 137.0573 38.72Somewhat Safe 161.7068 45.68Not Very Safe 27.8768 7.88Not Safe At All 18.17499 5.13Don't Know 9.170705 2.59
Frequency Missing = 6.0133834682
FRIENDS FEELING CLOSE TO THEIR PARENTS
q14a Frequency Percent______________________________None 25.18059 7.07A Few 105.0938 29.52Some 75.49438 21.20Most 121.077 34.01All 29.19398 8.20
Frequency Missing = 3.9602957109
The frequencies have been weighted so that theanalysis reflects the distribution of students by grade
level in the district

8/14/2019 ELLIS COUNTY - Maypearl ISD - 2004 Texas School Survey of Drug and Alcohol Use
http://slidepdf.com/reader/full/ellis-county-maypearl-isd-2004-texas-school-survey-of-drug-and-alcohol 51/90
MaypearlSpring 2004
The FREQ Procedure
HOW MANY FRIENDS CARRY WEAPONS
q14b Frequency Percent
______________________________None 237.5448 67.85A Few 60.23962 17.21Some 34.19392 9.77Most 14.13755 4.04All 3.963546 1.13
Frequency Missing = 9.9205445256
HOW MANY FRIENDS CARE ABOUT GOOD GRADES
q14c Frequency Percent______________________________None 23.20706 6.69A Few 51.29422 14.79Some 80.86654 23.31
Most 132.0402 38.06All 59.49813 17.15
Frequency Missing = 13.093892305
HOW MANY FRIENDS BELONG TO A GANG
q14d Frequency Percent______________________________None 308.4229 87.42A Few 27.89093 7.91Some 10.49049 2.97Most 3.985915 1.13All 2.028169 0.57
Frequency Missing = 7.1815858869
FRIENDS WISHING TO DROP OUT OF SCHOOL
q14e Frequency Percent______________________________None 178.3651 50.85A Few 114.1826 32.55Some 26.58453 7.58Most 17.9537 5.12All 13.69016 3.90
Frequency Missing = 9.223839408
PARENTS ATTEND PTA/SCHOOL OPEN HOUSES
q15 Frequency Percent___________________________________No 175.6927 52.59Yes 158.3734 47.41
Frequency Missing = 25.933927994
The frequencies have been weighted so that theanalysis reflects the distribution of students by grade
level in the district

8/14/2019 ELLIS COUNTY - Maypearl ISD - 2004 Texas School Survey of Drug and Alcohol Use
http://slidepdf.com/reader/full/ellis-county-maypearl-isd-2004-texas-school-survey-of-drug-and-alcohol 52/90
MaypearlSpring 2004
The FREQ Procedure
EVER INHALED SPRAY PAINT FOR KICKS
q16a Frequency Percent
___________________________________________Never Heard/Used 326.6466 93.90In Your Lifetime 15.14183 4.35Since School Began 1 0.29In the Past Month 5.07796 1.46
Frequency Missing = 12.13364349
EVER INHALED WHITEOUT FOR KICKS
q16b Frequency Percent___________________________________________Never Heard/Used 324.7894 93.66In Your Lifetime 13.33046 3.84Since School Began 2.893123 0.83In the Past Month 5.772115 1.66
Frequency Missing = 13.214900261
EVER INHALED GASOLINE FOR KICKS
q16c Frequency Percent___________________________________________Never Heard/Used 328.9062 95.38In Your Lifetime 11.19632 3.25Since School Began 1.907208 0.55In the Past Month 2.842585 0.82
Frequency Missing = 15.147727997
EVER INHALED FREON FOR KICKS
q16d Frequency Percent
___________________________________________Never Heard/Used 336.9036 98.56In Your Lifetime 2.064576 0.60Since School Began 0.907208 0.27In the Past Month 1.935377 0.57
Frequency Missing = 18.189280479
EVER INHALED POPPERS, ETC. FOR KICKS
q16e Frequency Percent___________________________________________Never Heard/Used 335.7206 97.95In Your Lifetime 2.036407 0.59
Since School Began 1.036407 0.30In the Past Month 3.949461 1.15
Frequency Missing = 17.257153782
The frequencies have been weighted so that theanalysis reflects the distribution of students by grade
level in the district

8/14/2019 ELLIS COUNTY - Maypearl ISD - 2004 Texas School Survey of Drug and Alcohol Use
http://slidepdf.com/reader/full/ellis-county-maypearl-isd-2004-texas-school-survey-of-drug-and-alcohol 53/90
MaypearlSpring 2004
The FREQ Procedure
EVER INHALED GLUE FOR KICKS
q16f Frequency Percent
___________________________________________Never Heard/Used 329.699 96.16In Your Lifetime 11.12256 3.24In the Past Month 2.028169 0.59
Frequency Missing = 17.150277229
EVER INHALED PAINT THINNERS FOR KICKS
q16g Frequency Percent___________________________________________Never Heard/Used 326.4105 95.83In Your Lifetime 8.03311 2.36Since School Began 4.154071 1.22In the Past Month 2.014085 0.59
Frequency Missing = 19.38824804
EVER INHALED NITROUS OXIDE FOR KICKS
q16h Frequency Percent___________________________________________Never Heard/Used 330.7187 96.20In Your Lifetime 8.014038 2.33Since School Began 1.036407 0.30In the Past Month 4.016634 1.17
Frequency Missing = 16.214199222
EVER INHALED OCTANE BOOSTER FOR KICKS
q16i Frequency Percent___________________________________________Never Heard/Used 336.6931 99.09In Your Lifetime 2.064576 0.61In the Past Month 1.028169 0.30
Frequency Missing = 20.214199222
EVER INHALED OTHER SPRAYS FOR KICKS
q16j Frequency Percent___________________________________________Never Heard/Used 337.1927 97.48In Your Lifetime 3.921292 1.13In the Past Month 4.777962 1.38
Frequency Missing = 14.108023708
The frequencies have been weighted so that theanalysis reflects the distribution of students by grade
level in the district

8/14/2019 ELLIS COUNTY - Maypearl ISD - 2004 Texas School Survey of Drug and Alcohol Use
http://slidepdf.com/reader/full/ellis-county-maypearl-isd-2004-texas-school-survey-of-drug-and-alcohol 54/90
MaypearlSpring 2004
The FREQ Procedure
EVER INHALED OTHER INHALANTS FOR KICKS
q16k Frequency Percent
___________________________________________Never Heard/Used 316.1181 91.69In Your Lifetime 14.89563 4.32Since School Began 4.943615 1.43In the Past Month 8.802834 2.55
Frequency Missing = 15.239819005
RECENT CIGARETTE USE
q17a Frequency Percent___________________________________________Never Heard/Used 227.0341 64.87In Your Lifetime 60.6466 17.33Since School Began 13.33067 3.81In the Past Month 48.97272 13.99
Frequency Missing = 10.0159327
RECENT SMOKELESS TOBACCO USE
q17b Frequency Percent___________________________________________Never Heard/Used 311.2793 89.74In Your Lifetime 24.53997 7.08In the Past Month 11.03047 3.18
Frequency Missing = 13.150277229
RECENT BEER USE
q17c Frequency Percent___________________________________________Never Heard/Used 181.3999 52.27In Your Lifetime 84.53015 24.36Since School Began 18.25196 5.26In the Past Month 62.84178 18.11
Frequency Missing = 12.976228411
RECENT WINE COOLER USE
q17d Frequency Percent___________________________________________Never Heard/Used 191.5394 55.18In Your Lifetime 75.82824 21.85Since School Began 32.32148 9.31
In the Past Month 47.41338 13.66
Frequency Missing = 12.897520872
The frequencies have been weighted so that theanalysis reflects the distribution of students by grade
level in the district

8/14/2019 ELLIS COUNTY - Maypearl ISD - 2004 Texas School Survey of Drug and Alcohol Use
http://slidepdf.com/reader/full/ellis-county-maypearl-isd-2004-texas-school-survey-of-drug-and-alcohol 55/90
MaypearlSpring 2004
The FREQ Procedure
RECENT WINE USE
q17e Frequency Percent
___________________________________________Never Heard/Used 204.3732 59.24In Your Lifetime 73.86791 21.41Since School Began 28.38026 8.23In the Past Month 38.37427 11.12
Frequency Missing = 15.004397425
RECENT LIQUOR USE
q17f Frequency Percent___________________________________________Never Heard/Used 198.4413 57.05In Your Lifetime 64.00055 18.40Since School Began 26.41946 7.60In the Past Month 58.97692 16.96
Frequency Missing = 12.161812504
RECENT MARIJUANA USE
q18a Frequency Percent___________________________________________Never Heard/Used 260.7355 75.10In Your Lifetime 33.45957 9.64Since School Began 18.1672 5.23In the Past Month 34.80742 10.03
Frequency Missing = 12.830348607
RECENT COCAINE USE
q18b Frequency Percent
___________________________________________Never Heard/Used 326.421 94.07In Your Lifetime 11.40089 3.29Since School Began 7.100936 2.05In the Past Month 2.072814 0.60
Frequency Missing = 13.004397425
RECENT CRACK USE
q18c Frequency Percent___________________________________________Never Heard/Used 336.6959 97.05In Your Lifetime 3.109221 0.90
Since School Began 2.963546 0.85In the Past Month 4.162309 1.20
Frequency Missing = 13.069020458
The frequencies have been weighted so that theanalysis reflects the distribution of students by grade
level in the district

8/14/2019 ELLIS COUNTY - Maypearl ISD - 2004 Texas School Survey of Drug and Alcohol Use
http://slidepdf.com/reader/full/ellis-county-maypearl-isd-2004-texas-school-survey-of-drug-and-alcohol 56/90
MaypearlSpring 2004
The FREQ Procedure
RECENT HALLUCINOGEN USE
q18e Frequency Percent
___________________________________________Never Heard/Used 329.9818 95.32In Your Lifetime 9.044598 2.61Since School Began 5.092745 1.47In the Past Month 2.064576 0.60
Frequency Missing = 13.8162641
RECENT UPPER USE
q18f Frequency Percent___________________________________________Never Heard/Used 326.9329 94.40In Your Lifetime 5.100983 1.47Since School Began 2.072814 0.60In the Past Month 12.22359 3.53
Frequency Missing = 13.669683258
RECENT DOWNER USE
q18g Frequency Percent___________________________________________Never Heard/Used 326.8907 94.97In Your Lifetime 3.980022 1.16Since School Began 5.13739 1.49In the Past Month 8.198716 2.38
Frequency Missing = 15.79319355
RECENT ROHYPNOL USE
q18h Frequency Percent
___________________________________________Never Heard/Used 337.8786 97.93In Your Lifetime 5.067172 1.47In the Past Month 2.064576 0.60
Frequency Missing = 14.989611879
RECENT STEROID USE
q18i Frequency Percent___________________________________________Never Heard/Used 329.1213 96.52In Your Lifetime 4.103579 1.20Since School Began 2.988465 0.88
In the Past Month 4.7862 1.40
Frequency Missing = 19.000446116
The frequencies have been weighted so that theanalysis reflects the distribution of students by grade
level in the district

8/14/2019 ELLIS COUNTY - Maypearl ISD - 2004 Texas School Survey of Drug and Alcohol Use
http://slidepdf.com/reader/full/ellis-county-maypearl-isd-2004-texas-school-survey-of-drug-and-alcohol 57/90
MaypearlSpring 2004
The FREQ Procedure
RECENT ECSTASY USE
q18j Frequency Percent
___________________________________________Never Heard/Used 326.7131 95.79In Your Lifetime 9.232732 2.71Since School Began 3.050492 0.89In the Past Month 2.089495 0.61
Frequency Missing = 18.914154611
RECENT HEROIN USE
q18k Frequency Percent___________________________________________Never Heard/Used 343.8223 98.85In Your Lifetime 2.056338 0.59In the Past Month 1.960296 0.56
Frequency Missing = 12.161111465
TOBACCO USE IN PAST MONTH
q19a Frequency Percent_________________________________________Never Heard/Used 271.3138 79.161-2 times 33.53423 9.783-10 times 10.28083 3.0011+ times 27.61673 8.06
Frequency Missing = 17.254353235
ALCOHOL USE IN PAST MONTH
q19b Frequency Percent_________________________________________Never Heard/Used 238.3449 69.121-2 times 55.31973 16.043-10 times 30.76471 8.9211+ times 20.40064 5.92
Frequency Missing = 15.170003716
INHALANT USE IN PAST MONTH
q19c Frequency Percent_________________________________________Never Heard/Used 326.1564 95.421-2 times 11.66779 3.4111+ times 3.971784 1.16
Frequency Missing = 18.204019129
The frequencies have been weighted so that theanalysis reflects the distribution of students by grade
level in the district

8/14/2019 ELLIS COUNTY - Maypearl ISD - 2004 Texas School Survey of Drug and Alcohol Use
http://slidepdf.com/reader/full/ellis-county-maypearl-isd-2004-texas-school-survey-of-drug-and-alcohol 58/90
MaypearlSpring 2004
The FREQ Procedure
MARIJUANA USE IN PAST MONTH
q19d Frequency Percent
_________________________________________Never Heard/Used 300.0342 87.511-2 times 16.10847 4.703-10 times 15.36773 4.4811+ times 11.34195 3.31
Frequency Missing = 17.147681101
COCAINE USE IN PAST MONTH
q19e Frequency Percent_________________________________________Never Heard/Used 330.5898 97.591-2 times 5.044598 1.493-10 times 1.053088 0.3111+ times 2.072814 0.61
Frequency Missing = 21.239725212
CRACK USE IN PAST MONTH
q19f Frequency Percent_________________________________________Never Heard/Used 332.8449 98.211-2 times 1.943615 0.573-10 times 2.072814 0.6111+ times 2.053088 0.61
Frequency Missing = 21.0856073
CLOSE FRIENDS USE CIGARETTES
q20a Frequency Percent
_________________________________________Never heard/None 137.2192 40.20A few 111.805 32.76Some 51.06366 14.96Most 33.0436 9.68All 8.171406 2.39
Frequency Missing = 18.697151233
CLOSE FRIENDS USE SMOKELESS TOBACCO
q20b Frequency Percent_________________________________________Never heard/None 253.7106 75.45
A few 57.09673 16.98Some 18.47889 5.50Most 2.943615 0.88All 4.042254 1.20
Frequency Missing = 23.727869479
The frequencies have been weighted so that theanalysis reflects the distribution of students by grade
level in the district

8/14/2019 ELLIS COUNTY - Maypearl ISD - 2004 Texas School Survey of Drug and Alcohol Use
http://slidepdf.com/reader/full/ellis-county-maypearl-isd-2004-texas-school-survey-of-drug-and-alcohol 59/90
MaypearlSpring 2004
The FREQ Procedure
CLOSE FRIENDS USE BEER
q20c Frequency Percent
_________________________________________Never heard/None 108.5131 32.08A few 98.76361 29.20Some 66.98945 19.80Most 44.62998 13.19All 19.35105 5.72
Frequency Missing = 21.752788223
CLOSE FRIENDS USE WINE COOLERS
q20d Frequency Percent_________________________________________Never heard/None 156.866 46.51A few 80.91538 23.99Some 53.17334 15.76
Most 36.18564 10.73All 10.14908 3.01
Frequency Missing = 22.710534701
CLOSE FRIENDS USE WINE
q20e Frequency Percent_________________________________________Never heard/None 186.282 55.37A few 75.03115 22.30Some 46.49169 13.82Most 20.43095 6.07All 8.171406 2.43
Frequency Missing = 23.592823912
CLOSE FRIENDS USE LIQUOR
q20f Frequency Percent_________________________________________Never heard/None 155.3934 46.23A few 72.80296 21.66Some 43.80556 13.03Most 50.93577 15.15All 13.22429 3.93
Frequency Missing = 23.837996304
The frequencies have been weighted so that theanalysis reflects the distribution of students by grade
level in the district

8/14/2019 ELLIS COUNTY - Maypearl ISD - 2004 Texas School Survey of Drug and Alcohol Use
http://slidepdf.com/reader/full/ellis-county-maypearl-isd-2004-texas-school-survey-of-drug-and-alcohol 60/90
MaypearlSpring 2004
The FREQ Procedure
CLOSE FRIENDS USE INHALANTS
q20g Frequency Percent
_________________________________________Never heard/None 297.92 87.09A few 27.27679 7.97Some 7.971083 2.33Most 5.895673 1.72All 3.028169 0.89
Frequency Missing = 17.908308212
CLOSE FRIENDS USE MARIJUANA
q20h Frequency Percent_________________________________________Never heard/None 199.7383 58.22A few 51.7322 15.08Some 45.69115 13.32
Most 35.72286 10.41All 10.21041 2.98
Frequency Missing = 16.905057941
DIFFICULT TO GET CIGARETTES
q21a Frequency Percent_______________________________________Never heard of 26.62907 7.87Impossible 59.2308 17.51Very difficult 21.6946 6.41Somewhat diff 32.01448 9.46Somewhat easy 56.60849 16.73Very easy 142.1146 42.01
Frequency Missing = 21.707938573
DIFFICULT TO GET SMOKELESS TOBACCO
q21b Frequency Percent_______________________________________Never heard of 63.02787 18.98Impossible 61.65831 18.56Very difficult 26.51985 7.98Somewhat diff 30.61534 9.22Somewhat easy 42.84857 12.90Very easy 107.4744 32.36
Frequency Missing = 27.85566657
The frequencies have been weighted so that theanalysis reflects the distribution of students by grade
level in the district
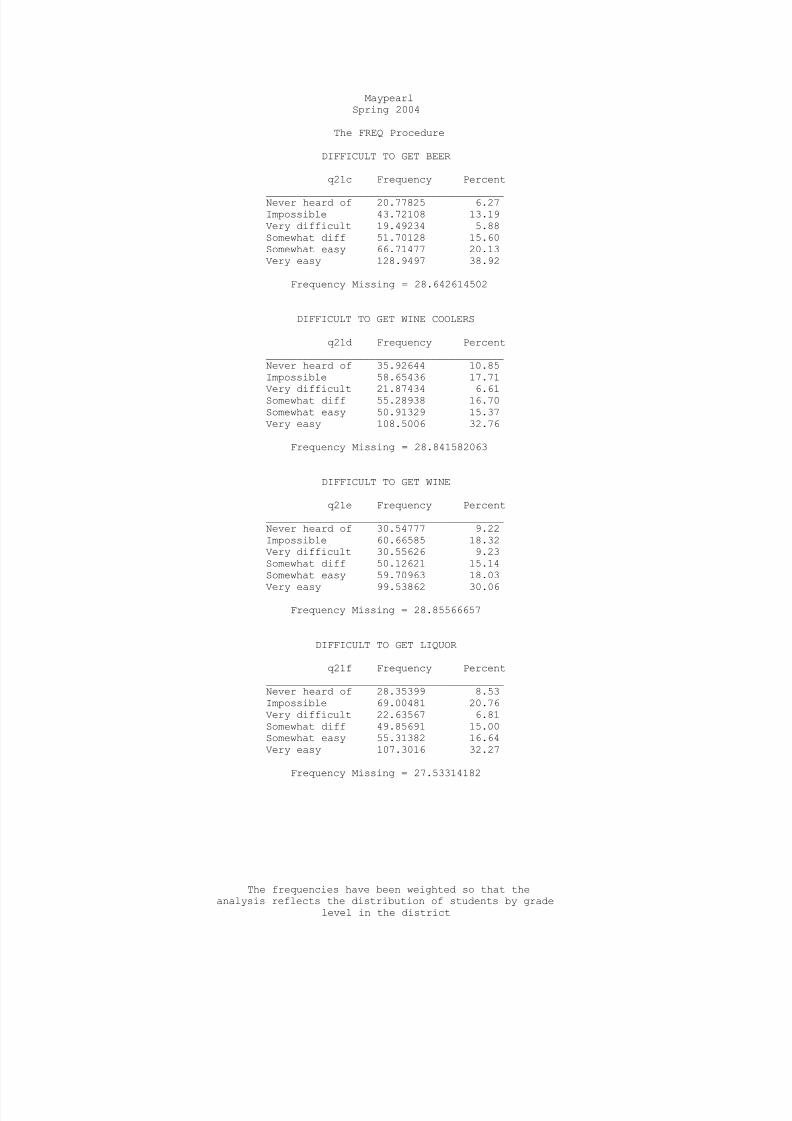
8/14/2019 ELLIS COUNTY - Maypearl ISD - 2004 Texas School Survey of Drug and Alcohol Use
http://slidepdf.com/reader/full/ellis-county-maypearl-isd-2004-texas-school-survey-of-drug-and-alcohol 61/90
MaypearlSpring 2004
The FREQ Procedure
DIFFICULT TO GET BEER
q21c Frequency Percent
_______________________________________Never heard of 20.77825 6.27Impossible 43.72108 13.19Very difficult 19.49234 5.88Somewhat diff 51.70128 15.60Somewhat easy 66.71477 20.13Very easy 128.9497 38.92
Frequency Missing = 28.642614502
DIFFICULT TO GET WINE COOLERS
q21d Frequency Percent_______________________________________Never heard of 35.92644 10.85Impossible 58.65436 17.71
Very difficult 21.87434 6.61Somewhat diff 55.28938 16.70Somewhat easy 50.91329 15.37Very easy 108.5006 32.76
Frequency Missing = 28.841582063
DIFFICULT TO GET WINE
q21e Frequency Percent_______________________________________Never heard of 30.54777 9.22Impossible 60.66585 18.32Very difficult 30.55626 9.23Somewhat diff 50.12621 15.14Somewhat easy 59.70963 18.03
Very easy 99.53862 30.06
Frequency Missing = 28.85566657
DIFFICULT TO GET LIQUOR
q21f Frequency Percent_______________________________________Never heard of 28.35399 8.53Impossible 69.00481 20.76Very difficult 22.63567 6.81Somewhat diff 49.85691 15.00Somewhat easy 55.31382 16.64Very easy 107.3016 32.27
Frequency Missing = 27.53314182
The frequencies have been weighted so that theanalysis reflects the distribution of students by grade
level in the district

8/14/2019 ELLIS COUNTY - Maypearl ISD - 2004 Texas School Survey of Drug and Alcohol Use
http://slidepdf.com/reader/full/ellis-county-maypearl-isd-2004-texas-school-survey-of-drug-and-alcohol 62/90
MaypearlSpring 2004
The FREQ Procedure
DIFFICULT TO GET INHALANTS
q21g Frequency Percent
_______________________________________Never heard of 52.46172 16.02Impossible 51.62519 15.76Very difficult 13.90321 4.25Somewhat diff 21.95934 6.71Somewhat easy 33.62073 10.27Very easy 153.9115 47.00
Frequency Missing = 32.518356274
DIFFICULT TO GET MARIJUANA
q21h Frequency Percent_______________________________________Never heard of 36.47091 11.21Impossible 86.13651 26.47
Very difficult 28.87944 8.87Somewhat diff 36.64001 11.26Somewhat easy 52.19887 16.04Very easy 85.10796 26.15
Frequency Missing = 34.566298671
DIFFICULT TO GET COCAINE
q21i Frequency Percent_______________________________________Never heard of 48.71707 15.02Impossible 118.1853 36.45Very difficult 43.11406 13.30Somewhat diff 46.82574 14.44Somewhat easy 37.04809 11.43
Very easy 30.36942 9.37
Frequency Missing = 35.740347489
DIFFICULT TO GET CRACK
q21j Frequency Percent_______________________________________Never heard of 50.68631 15.44Impossible 118.1993 36.00Very difficult 52.41966 15.97Somewhat diff 43.96338 13.39Somewhat easy 31.92718 9.72Very easy 31.14438 9.49
Frequency Missing = 31.65974486
The frequencies have been weighted so that theanalysis reflects the distribution of students by grade
level in the district
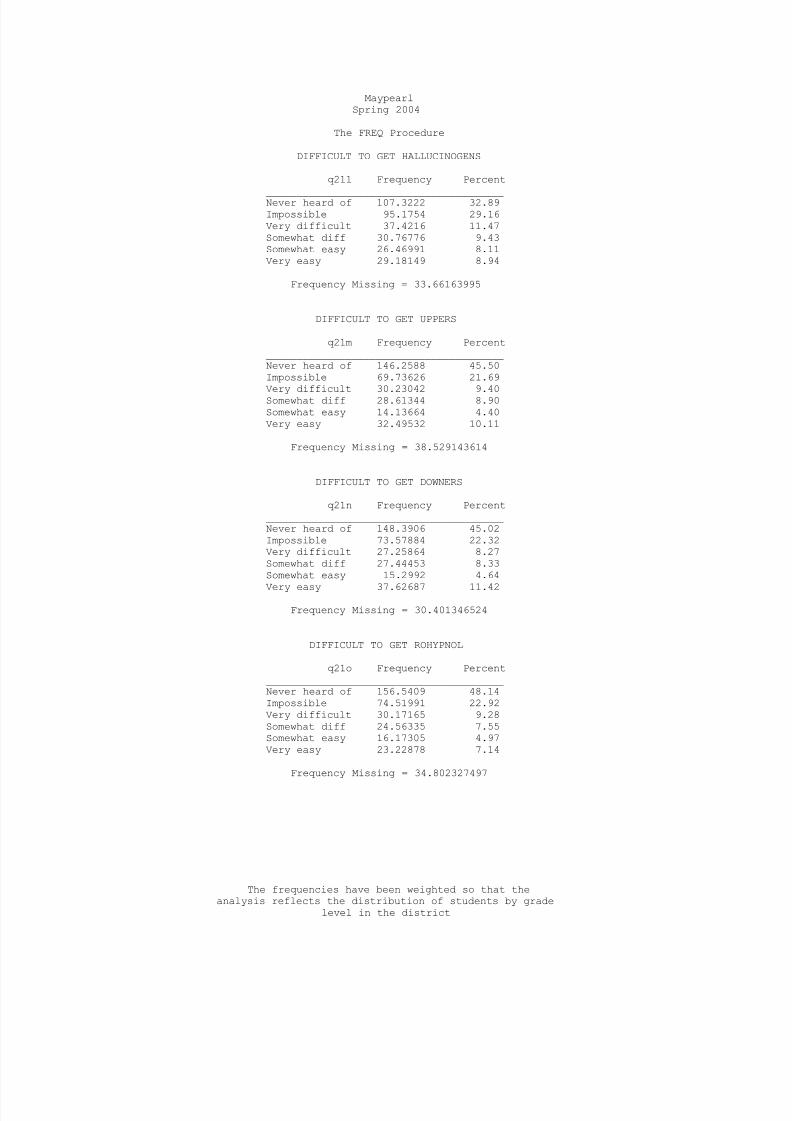
8/14/2019 ELLIS COUNTY - Maypearl ISD - 2004 Texas School Survey of Drug and Alcohol Use
http://slidepdf.com/reader/full/ellis-county-maypearl-isd-2004-texas-school-survey-of-drug-and-alcohol 63/90
MaypearlSpring 2004
The FREQ Procedure
DIFFICULT TO GET HALLUCINOGENS
q21l Frequency Percent
_______________________________________Never heard of 107.3222 32.89Impossible 95.1754 29.16Very difficult 37.4216 11.47Somewhat diff 30.76776 9.43Somewhat easy 26.46991 8.11Very easy 29.18149 8.94
Frequency Missing = 33.66163995
DIFFICULT TO GET UPPERS
q21m Frequency Percent_______________________________________Never heard of 146.2588 45.50Impossible 69.73626 21.69
Very difficult 30.23042 9.40Somewhat diff 28.61344 8.90Somewhat easy 14.13664 4.40Very easy 32.49532 10.11
Frequency Missing = 38.529143614
DIFFICULT TO GET DOWNERS
q21n Frequency Percent_______________________________________Never heard of 148.3906 45.02Impossible 73.57884 22.32Very difficult 27.25864 8.27Somewhat diff 27.44453 8.33Somewhat easy 15.2992 4.64
Very easy 37.62687 11.42
Frequency Missing = 30.401346524
DIFFICULT TO GET ROHYPNOL
q21o Frequency Percent_______________________________________Never heard of 156.5409 48.14Impossible 74.51991 22.92Very difficult 30.17165 9.28Somewhat diff 24.56335 7.55Somewhat easy 16.17305 4.97Very easy 23.22878 7.14
Frequency Missing = 34.802327497
The frequencies have been weighted so that theanalysis reflects the distribution of students by grade
level in the district

8/14/2019 ELLIS COUNTY - Maypearl ISD - 2004 Texas School Survey of Drug and Alcohol Use
http://slidepdf.com/reader/full/ellis-county-maypearl-isd-2004-texas-school-survey-of-drug-and-alcohol 64/90
MaypearlSpring 2004
The FREQ Procedure
DIFFICULT TO GET STEROIDS
q21p Frequency Percent
_______________________________________Never heard of 67.72517 20.82Impossible 104.8581 32.24Very difficult 41.45731 12.75Somewhat diff 43.88942 13.49Somewhat easy 27.16316 8.35Very easy 40.1658 12.35
Frequency Missing = 34.741001632
DIFFICULT TO GET ECSTASY
q21q Frequency Percent_______________________________________Never heard of 76.96809 23.43Impossible 113.6015 34.59
Very difficult 37.37626 11.38Somewhat diff 35.9042 10.93Somewhat easy 27.44149 8.35Very easy 37.16971 11.32
Frequency Missing = 31.5387838
DIFFICULT TO GET HEROIN
q21r Frequency Percent_______________________________________Never heard of 78.05005 23.71Impossible 127.5333 38.74Very difficult 41.75162 12.68Somewhat diff 38.67517 11.75Somewhat easy 15.27923 4.64
Very easy 27.91135 8.48
Frequency Missing = 30.799281646
AGE WHEN FIRST USED CIGARETTES
q22a Frequency Percent______________________________________9 or younger 27.10459 22.0810 years old 6.735708 5.4911 years old 12.89233 10.5012 years old 13.95675 11.3713 years old 16.15576 13.1614 years old 12.34475 10.0615 years old 14.08126 11.4716 years old 8.157321 6.65
17 years old 7.25485 5.9118 or older 4.072814 3.32
Frequency Missing = 237.24387252
The frequencies have been weighted so that theanalysis reflects the distribution of students by grade
level in the district

8/14/2019 ELLIS COUNTY - Maypearl ISD - 2004 Texas School Survey of Drug and Alcohol Use
http://slidepdf.com/reader/full/ellis-county-maypearl-isd-2004-texas-school-survey-of-drug-and-alcohol 65/90
MaypearlSpring 2004
The FREQ Procedure
AGE WHEN FIRST USED SMOKELESS TOBACCO
q22b Frequency Percent
______________________________________9 or younger 8.075363 21.5310 years old 3.996703 10.6611 years old 3.836739 10.2312 years old 1.036407 2.7613 years old 6.159263 16.4214 years old 3.084507 8.2215 years old 5.095137 13.5916 years old 4.145628 11.0517 years old 2.072814 5.53
Frequency Missing = 322.49743814
AGE WHEN FIRST USED BEER
q22c Frequency Percent
______________________________________9 or younger 36.78066 22.0210 years old 5.802881 3.4711 years old 13.93068 8.3412 years old 20.88908 12.5113 years old 31.24866 18.7114 years old 20.37511 12.2015 years old 16.37856 9.8116 years old 10.27239 6.1517 years old 7.201967 4.3118 or older 4.13739 2.48
Frequency Missing = 192.98261953
AGE WHEN FIRST USED WINE COOLERS
q22d Frequency Percent______________________________________9 or younger 20.32407 13.0510 years old 3.988465 2.5611 years old 20.953 13.4512 years old 21.75658 13.9713 years old 28.40928 18.2414 years old 22.48973 14.4415 years old 20.40089 13.1016 years old 8.149083 5.2317 years old 8.283019 5.3218 or older 1.028169 0.66
Frequency Missing = 204.21770923
The frequencies have been weighted so that theanalysis reflects the distribution of students by grade
level in the district

8/14/2019 ELLIS COUNTY - Maypearl ISD - 2004 Texas School Survey of Drug and Alcohol Use
http://slidepdf.com/reader/full/ellis-county-maypearl-isd-2004-texas-school-survey-of-drug-and-alcohol 66/90
MaypearlSpring 2004
The FREQ Procedure
AGE WHEN FIRST USED WINE
q22e Frequency Percent
______________________________________9 or younger 16.93697 11.7110 years old 4.996703 3.4611 years old 10.97363 7.5912 years old 26.89332 18.6013 years old 27.62233 19.1014 years old 25.49557 17.6315 years old 16.28907 11.2616 years old 9.177252 6.3517 years old 6.218443 4.30
Frequency Missing = 215.39669898
AGE WHEN FIRST USED LIQUOR
q22f Frequency Percent
______________________________________9 or younger 9.027217 6.6010 years old 3.893123 2.8511 years old 7.816264 5.7112 years old 10.88089 7.9513 years old 29.48989 21.5614 years old 21.46156 15.6915 years old 30.51011 22.3116 years old 14.3933 10.5217 years old 8.274781 6.0518 or older 1.036407 0.76
Frequency Missing = 223.21646467
AGE WHEN FIRST USED INHALANTS
q22g Frequency Percent______________________________________9 or younger 7.100282 20.8010 years old 1.935377 5.6711 years old 1.943615 5.6912 years old 3.920591 11.4813 years old 8.064576 23.6214 years old 8.067172 23.6315 years old 1.036407 3.0417 years old 2.072814 6.07
Frequency Missing = 325.85916455
The frequencies have been weighted so that theanalysis reflects the distribution of students by grade
level in the district

8/14/2019 ELLIS COUNTY - Maypearl ISD - 2004 Texas School Survey of Drug and Alcohol Use
http://slidepdf.com/reader/full/ellis-county-maypearl-isd-2004-texas-school-survey-of-drug-and-alcohol 67/90
MaypearlSpring 2004
The FREQ Procedure
AGE WHEN FIRST USED MARIJUANA
q22h Frequency Percent
______________________________________9 or younger 4.086899 4.9610 years old 3.022323 3.6711 years old 1.036407 1.2612 years old 7.142536 8.6713 years old 10.9544 13.3014 years old 14.30749 17.3715 years old 19.07866 23.1616 years old 15.50492 18.8217 years old 7.238374 8.79
Frequency Missing = 277.6279949
AGE WHEN FIRST USED COCAINE
q22i Frequency Percent
______________________________________10 years old 1.036407 6.3112 years old 1.036407 6.3113 years old 1.943615 11.8415 years old 4.129152 25.1516 years old 4.129152 25.1517 years old 3.109221 18.9418 or older 1.036407 6.31
Frequency Missing = 343.57963765
AGE WHEN FIRST USED CRACK
q22j Frequency Percent______________________________________11 years old 0.907208 9.85
12 years old 2.081257 22.6114 years old 1.036407 11.2616 years old 1.036407 11.2617 years old 4.145628 45.03
Frequency Missing = 350.79309254
AGE WHEN FIRST USED HALLUCINOGENS
q22l Frequency Percent______________________________________9 or younger 1.036407 7.2710 years old 1.028169 7.2112 years old 1 7.0213 years old 2.056338 14.4314 years old 3.014085 21.15
15 years old 3.05873 21.4616 years old 3.05873 21.46
Frequency Missing = 345.74754185
The frequencies have been weighted so that theanalysis reflects the distribution of students by grade
level in the district
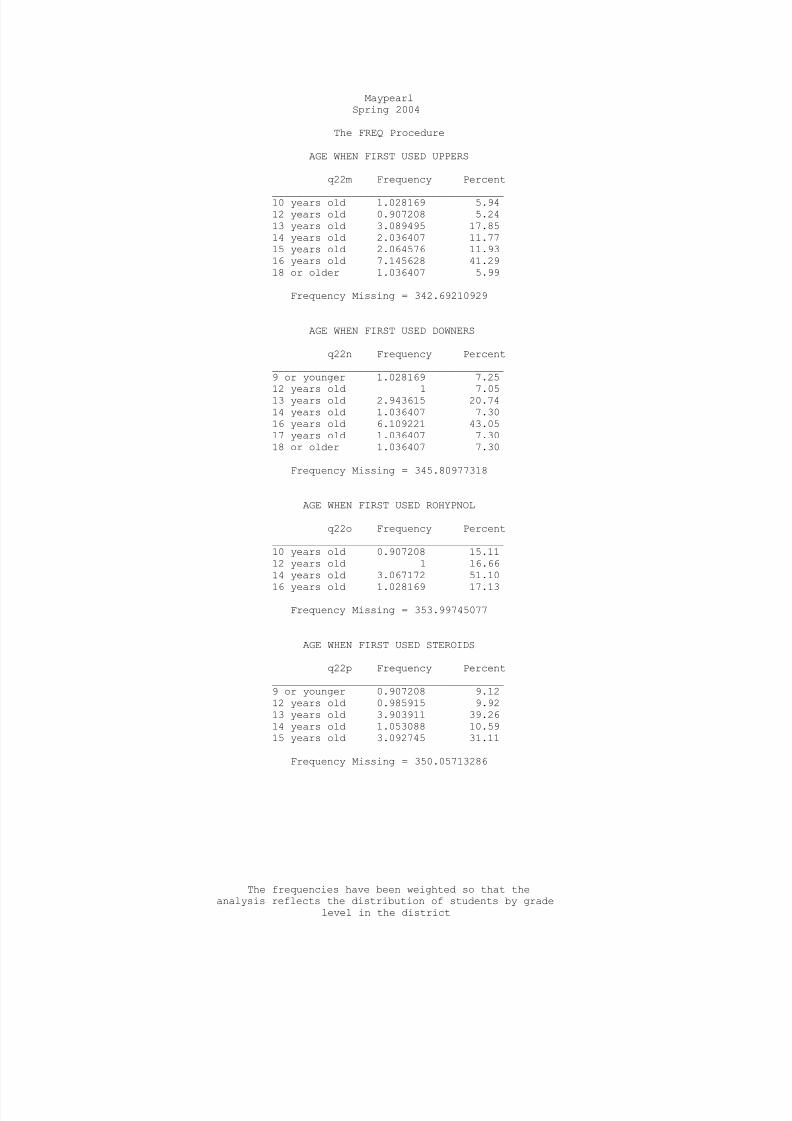
8/14/2019 ELLIS COUNTY - Maypearl ISD - 2004 Texas School Survey of Drug and Alcohol Use
http://slidepdf.com/reader/full/ellis-county-maypearl-isd-2004-texas-school-survey-of-drug-and-alcohol 68/90
MaypearlSpring 2004
The FREQ Procedure
AGE WHEN FIRST USED UPPERS
q22m Frequency Percent
______________________________________10 years old 1.028169 5.9412 years old 0.907208 5.2413 years old 3.089495 17.8514 years old 2.036407 11.7715 years old 2.064576 11.9316 years old 7.145628 41.2918 or older 1.036407 5.99
Frequency Missing = 342.69210929
AGE WHEN FIRST USED DOWNERS
q22n Frequency Percent______________________________________9 or younger 1.028169 7.25
12 years old 1 7.0513 years old 2.943615 20.7414 years old 1.036407 7.3016 years old 6.109221 43.0517 years old 1.036407 7.3018 or older 1.036407 7.30
Frequency Missing = 345.80977318
AGE WHEN FIRST USED ROHYPNOL
q22o Frequency Percent______________________________________10 years old 0.907208 15.1112 years old 1 16.6614 years old 3.067172 51.10
16 years old 1.028169 17.13
Frequency Missing = 353.99745077
AGE WHEN FIRST USED STEROIDS
q22p Frequency Percent______________________________________9 or younger 0.907208 9.1212 years old 0.985915 9.9213 years old 3.903911 39.2614 years old 1.053088 10.5915 years old 3.092745 31.11
Frequency Missing = 350.05713286
The frequencies have been weighted so that theanalysis reflects the distribution of students by grade
level in the district

8/14/2019 ELLIS COUNTY - Maypearl ISD - 2004 Texas School Survey of Drug and Alcohol Use
http://slidepdf.com/reader/full/ellis-county-maypearl-isd-2004-texas-school-survey-of-drug-and-alcohol 69/90
MaypearlSpring 2004
The FREQ Procedure
AGE WHEN FIRST USED ECSTASY
q22q Frequency Percent
______________________________________12 years old 1 8.8513 years old 2.056338 18.1914 years old 2.089495 18.4815 years old 2.014085 17.8216 years old 4.145628 36.67
Frequency Missing = 348.6944541
AGE WHEN FIRST USED HEROIN
q22r Frequency Percent______________________________________13 years old 1.028169 100.00
Frequency Missing = 358.97183099
HOW OFTEN NORMALLY USE CIGARETTES
q23a Frequency Percent_________________________________________Every day 17.37576 5.13Several times/wk 6.173798 1.82Several times/mo 13.07791 3.86About once/month 20.54672 6.06About once/year 14.88328 4.39< once/year 27.99591 8.26Never used 238.8957 70.48
Frequency Missing = 21.050890848
HOW OFTEN NORMALLY USE SMOKELESS TOBACCO
q23b Frequency Percent_________________________________________Several times/wk 2.028169 0.61About once/month 2.971784 0.89About once/year 7.229481 2.18< once/year 18.23747 5.49Never used 301.6537 90.83
Frequency Missing = 27.879391263
The frequencies have been weighted so that theanalysis reflects the distribution of students by grade
level in the district

8/14/2019 ELLIS COUNTY - Maypearl ISD - 2004 Texas School Survey of Drug and Alcohol Use
http://slidepdf.com/reader/full/ellis-county-maypearl-isd-2004-texas-school-survey-of-drug-and-alcohol 70/90
MaypearlSpring 2004
The FREQ Procedure
HOW OFTEN NORMALLY USE BEER
q23c Frequency Percent
_________________________________________Several times/wk 7.999906 2.41Several times/mo 30.73695 9.28About once/month 31.44224 9.49About once/year 29.18269 8.81< once/year 48.0026 14.49Never used 183.8996 55.51
Frequency Missing = 28.736060691
HOW OFTEN NORMALLY USE WINE COOLERS
q23d Frequency Percent_________________________________________Several times/wk 7.024919 2.11Several times/mo 14.28837 4.29
About once/month 30.43161 9.13About once/year 40.28597 12.09< once/year 40.71932 12.22Never used 200.4484 60.16
Frequency Missing = 26.801384762
HOW OFTEN NORMALLY USE WINE
q23e Frequency Percent_________________________________________Several times/wk 2.957746 0.89Several times/mo 8.249412 2.49About once/month 33.62204 10.13About once/year 37.23557 11.22< once/year 49.50572 14.91
Never used 200.3953 60.37
Frequency Missing = 28.034210213
HOW OFTEN NORMALLY USE LIQUOR
q23f Frequency Percent_________________________________________Several times/wk 6.980022 2.13Several times/mo 30.55446 9.31About once/month 32.48968 9.90About once/year 28.56719 8.71< once/year 33.37797 10.17Never used 196.109 59.78
Frequency Missing = 31.921644784
The frequencies have been weighted so that theanalysis reflects the distribution of students by grade
level in the district

8/14/2019 ELLIS COUNTY - Maypearl ISD - 2004 Texas School Survey of Drug and Alcohol Use
http://slidepdf.com/reader/full/ellis-county-maypearl-isd-2004-texas-school-survey-of-drug-and-alcohol 71/90
MaypearlSpring 2004
The FREQ Procedure
HOW OFTEN NORMALLY USE INHALANTS
q23g Frequency Percent
_________________________________________Every day 1.814416 0.55Several times/mo 2.028169 0.61About once/month 2.929531 0.89About once/year 6.797034 2.06< once/year 11.27758 3.41Never used 305.8586 92.49
Frequency Missing = 29.294661163
HOW OFTEN NORMALLY USE MARIJUANA
q23h Frequency Percent_________________________________________Every day 3.050492 0.92Several times/wk 4.13739 1.25
Several times/mo 16.37856 4.96About once/month 15.41671 4.67About once/year 10.06692 3.05< once/year 23.27494 7.05Never used 257.6133 78.08
Frequency Missing = 30.061678188
HOW OFTEN NORMALLY USE COCAINE
q23i Frequency Percent_________________________________________Several times/mo 1.036407 0.32About once/month 2.056338 0.63About once/year 5.052836 1.55< once/year 4.129152 1.27
Never used 313.9213 96.24
Frequency Missing = 33.803933994
HOW OFTEN NORMALLY USE CRACK
q23j Frequency Percent_________________________________________Several times/mo 1.960296 0.60About once/month 2.072814 0.64< once/year 3.100983 0.95Never used 319.0262 97.81
Frequency Missing = 33.839686974
The frequencies have been weighted so that theanalysis reflects the distribution of students by grade
level in the district

8/14/2019 ELLIS COUNTY - Maypearl ISD - 2004 Texas School Survey of Drug and Alcohol Use
http://slidepdf.com/reader/full/ellis-county-maypearl-isd-2004-texas-school-survey-of-drug-and-alcohol 72/90
MaypearlSpring 2004
The FREQ Procedure
HOW OFTEN NORMALLY USE HALLUCINOGENS
q23l Frequency Percent
_________________________________________Several times/mo 2.028169 0.63About once/year 3 0.93< once/year 6.123306 1.89Never used 312.8797 96.56
Frequency Missing = 35.968839246
HOW OFTEN NORMALLY USE UPPERS
q23m Frequency Percent_________________________________________Every day 3.117664 0.96Several times/wk 4.154071 1.28Several times/mo 1.028169 0.32About once/month 5.086899 1.56
About once/year 3.05873 0.94< once/year 2.980022 0.92Never used 305.7597 94.03
Frequency Missing = 34.814721334
HOW OFTEN NORMALLY USE DOWNERS
q23n Frequency Percent_________________________________________Every day 2.089495 0.64Several times/wk 1.036407 0.32Several times/mo 1.028169 0.32About once/month 4 1.23About once/year 4.145628 1.27< once/year 1.907208 0.58
Never used 311.9252 95.64
Frequency Missing = 33.867855988
HOW OFTEN NORMALLY USE ROHYPNOL
q23o Frequency Percent_________________________________________About once/year 1 0.31< once/year 2.014085 0.62Never used 320.8935 99.07
Frequency Missing = 36.092396434
The frequencies have been weighted so that theanalysis reflects the distribution of students by grade
level in the district

8/14/2019 ELLIS COUNTY - Maypearl ISD - 2004 Texas School Survey of Drug and Alcohol Use
http://slidepdf.com/reader/full/ellis-county-maypearl-isd-2004-texas-school-survey-of-drug-and-alcohol 73/90
MaypearlSpring 2004
The FREQ Procedure
HOW OFTEN NORMALLY USE STEROIDS
q23p Frequency Percent
_________________________________________Every day 2.867504 0.91About once/month 0.907208 0.29About once/year 2.081257 0.66< once/year 2.022323 0.64Never used 308.5048 97.51
Frequency Missing = 43.616900927
HOW OFTEN NORMALLY USE ECSTASY
q23q Frequency Percent_________________________________________About once/year 1.036407 0.32< once/year 9.18224 2.87Never used 310.0883 96.81
Frequency Missing = 39.693059235
HOW OFTEN NORMALLY USE HEROIN
q23r Frequency Percent_________________________________________< once/year 1.028169 0.32Never used 320.987 99.68
Frequency Missing = 37.984818842
HOW MANY CIGARETTES IN PAST 30 DAYS
q24 Frequency Percent
_________________________________________None 292.3262 83.71Less than 1 32.3949 9.28> 1 and < 10 16.20691 4.64> 10 and < 1pk 5.165559 1.48> 1pk and < 2pks 3.100983 0.89
Frequency Missing = 10.805429864
The frequencies have been weighted so that theanalysis reflects the distribution of students by grade
level in the district

8/14/2019 ELLIS COUNTY - Maypearl ISD - 2004 Texas School Survey of Drug and Alcohol Use
http://slidepdf.com/reader/full/ellis-county-maypearl-isd-2004-texas-school-survey-of-drug-and-alcohol 74/90
MaypearlSpring 2004
The FREQ Procedure
AMOUNT OF BEER AT ONE TIME
q25a Frequency Percent
_________________________________________Never drink this 183.7826 53.8712+ drinks 17.52485 5.149-11 drinks 6.151475 1.805-8 drinks 17.38355 5.103-4 drinks 22.27333 6.532 drinks 13.13685 3.851 drink 29.2588 8.58< 1 drink 51.64746 15.14
Frequency Missing = 18.841135947
AMOUNT OF WINE COOLERS AT ONE TIME
q25b Frequency Percent_________________________________________
Never drink this 186.6023 56.1612+ drinks 9.103532 2.749-11 drinks 11.20971 3.375-8 drinks 16.05304 4.833-4 drinks 20.16226 6.072 drinks 23.57119 7.091 drink 26.19462 7.88< 1 drink 39.39539 11.86
Frequency Missing = 27.707938573
AMOUNT OF WINE AT ONE TIME
q25c Frequency Percent_________________________________________Never drink this 199.9828 60.37
12+ drinks 1.028169 0.319-11 drinks 4.100983 1.245-8 drinks 4.111817 1.243-4 drinks 13.38181 4.042 drinks 15.22054 4.591 drink 38.1723 11.52< 1 drink 55.25396 16.68
Frequency Missing = 28.747642862
The frequencies have been weighted so that theanalysis reflects the distribution of students by grade
level in the district

8/14/2019 ELLIS COUNTY - Maypearl ISD - 2004 Texas School Survey of Drug and Alcohol Use
http://slidepdf.com/reader/full/ellis-county-maypearl-isd-2004-texas-school-survey-of-drug-and-alcohol 75/90
MaypearlSpring 2004
The FREQ Procedure
AMOUNT OF LIQUOR AT ONE TIME
q25d Frequency Percent
_________________________________________Never drink this 192.4379 57.7312+ drinks 8.173798 2.459-11 drinks 11.32243 3.405-8 drinks 18.34755 5.503-4 drinks 26.45637 7.942 drinks 18.52699 5.561 drink 25.06807 7.52< 1 drink 33.03112 9.91
Frequency Missing = 26.635778472
BEERS, FIVE OR MORE AT ONE TIME
q26a Frequency Percent_________________________________________
Never drink this 193.5392 57.57Never 5+ at time 35.58707 10.59Every day 1.028169 0.31Several times/wk 5.140845 1.53Several times/mo 25.37151 7.55About once/month 21.08829 6.27< once/month 24.58527 7.31< once/year 29.83265 8.87
Frequency Missing = 23.827004544
WINE COOLERS, FIVE OR MORE AT ONE TIME
q26b Frequency Percent_________________________________________Never drink this 199.6589 59.90
Never 5+ at time 40.68546 12.21Every day 1 0.30Several times/wk 4.935377 1.48Several times/mo 16.15402 4.85About once/month 12.00749 3.60< once/month 28.33816 8.50< once/year 30.56504 9.17
Frequency Missing = 26.655504958
The frequencies have been weighted so that theanalysis reflects the distribution of students by grade
level in the district

8/14/2019 ELLIS COUNTY - Maypearl ISD - 2004 Texas School Survey of Drug and Alcohol Use
http://slidepdf.com/reader/full/ellis-county-maypearl-isd-2004-texas-school-survey-of-drug-and-alcohol 76/90
MaypearlSpring 2004
The FREQ Procedure
WINE, FIVE OR MORE AT ONE TIME
q26c Frequency Percent
_________________________________________Never drink this 206.6795 62.36Never 5+ at time 38.70474 11.68Several times/wk 2.056338 0.62Several times/mo 7.125902 2.15About once/month 11.93767 3.60< once/month 25.35798 7.65< once/year 39.565 11.94
Frequency Missing = 28.572846109
LIQUOR, FIVE OR MORE AT ONE TIME
q26d Frequency Percent_________________________________________Never drink this 190.0907 57.90
Never 5+ at time 36.81421 11.21Every day 1.028169 0.31Several times/wk 2.014085 0.61Several times/mo 29.39713 8.95About once/month 19.09434 5.82< once/month 21.43425 6.53< once/year 28.46151 8.67
Frequency Missing = 31.665638156
GET ALCOHOLIC BEVERAGES FROM HOME
q27a Frequency Percent_________________________________________Do not Drink 167.1909 50.52Never 68.25172 20.62
Seldom 77.36423 23.38Most of the Time 16.12256 4.87Always 2.022323 0.61
Frequency Missing = 29.048247824
GET ALCOHOLIC BEVERAGES FROM FRIENDS
q27b Frequency Percent_________________________________________Do not Drink 151.7081 45.99Never 51.40554 15.58Seldom 58.44918 17.72Most of the Time 54.93496 16.65Always 13.40653 4.06
Frequency Missing = 30.095693602
The frequencies have been weighted so that theanalysis reflects the distribution of students by grade
level in the district

8/14/2019 ELLIS COUNTY - Maypearl ISD - 2004 Texas School Survey of Drug and Alcohol Use
http://slidepdf.com/reader/full/ellis-county-maypearl-isd-2004-texas-school-survey-of-drug-and-alcohol 77/90
MaypearlSpring 2004
The FREQ Procedure
GET ALCOHOLIC BEVERAGES FROM A STORE
q27c Frequency Percent
_________________________________________Do not Drink 159.8936 48.90Never 125.6093 38.42Seldom 22.00983 6.73Most of the Time 14.28882 4.37Always 5.173798 1.58
Frequency Missing = 33.024570028
GET ALCOHOLIC BEVERAGES AT PARTIES
q27d Frequency Percent_________________________________________Do not Drink 160.5058 48.33Never 50.99296 15.35Seldom 41.40632 12.47
Most of the Time 46.6019 14.03Always 32.62702 9.82
Frequency Missing = 27.865960898
GET ALCOHOLIC BEVERAGES FROM OTHER
q27e Frequency Percent_________________________________________Do not Drink 153.7085 47.27Never 71.62298 22.03Seldom 49.468 15.21Most of the Time 24.35035 7.49Always 26.0048 8.00
Frequency Missing = 34.845328953
USE MARIJUANA AS JOINTS
q28a Frequency Percent_________________________________________Never 269.8952 79.79Seldom 28.44203 8.41Half the time 11.2154 3.32Most of the time 17.49124 5.17Always 8.162262 2.41Don't know 3.042254 0.90
Frequency Missing = 21.751594172
The frequencies have been weighted so that theanalysis reflects the distribution of students by grade
level in the district

8/14/2019 ELLIS COUNTY - Maypearl ISD - 2004 Texas School Survey of Drug and Alcohol Use
http://slidepdf.com/reader/full/ellis-county-maypearl-isd-2004-texas-school-survey-of-drug-and-alcohol 78/90
MaypearlSpring 2004
The FREQ Procedure
USE MARIJUANA AS BLUNTS
q28b Frequency Percent
_________________________________________Never 276.1396 81.90Seldom 29.64989 8.79Half the time 13.18718 3.91Most of the time 8.145786 2.42Always 6.083648 1.80Don't know 3.949461 1.17
Frequency Missing = 22.844386218
USE MARIJUANA IN BONGS OR WATER PIPES
q28c Frequency Percent_________________________________________Never 285.2736 85.13Seldom 20.48454 6.11
Half the time 9.095137 2.71Most of the time 10.06453 3.00Always 8.232732 2.46Don't know 1.935377 0.58
Frequency Missing = 24.914107715
USE MARIJUANA IN PIPES
q28d Frequency Percent_________________________________________Never 277.185 82.93Seldom 23.49602 7.03Half the time 9.047194 2.71Most of the time 15.37012 4.60Always 7.204563 2.16
Don't know 1.935377 0.58
Frequency Missing = 25.761680473
USE MARIJUANA OTHER WAYS
q28e Frequency Percent_________________________________________Never 298.7283 90.73Seldom 13.30056 4.04Half the time 3.008238 0.91Most of the time 7.218647 2.19Always 2.996703 0.91Don't know 3.999953 1.21
Frequency Missing = 30.747595966
The frequencies have been weighted so that theanalysis reflects the distribution of students by grade
level in the district

8/14/2019 ELLIS COUNTY - Maypearl ISD - 2004 Texas School Survey of Drug and Alcohol Use
http://slidepdf.com/reader/full/ellis-county-maypearl-isd-2004-texas-school-survey-of-drug-and-alcohol 79/90
MaypearlSpring 2004
The FREQ Procedure
TAKE DXM, TRIPLE C'S, ETC. TO GET HIGH
q29a Frequency Percent
____________________________________________Never heard/used 323.0861 95.22At least once/month 3.117664 0.92At least once/year 3.109221 0.92At least once/life 10.00255 2.95
Frequency Missing = 20.684421908
TAKE CODEINE COUGH SYRUP TO GET HIGH
q29b Frequency Percent____________________________________________Never heard/used 314.8057 91.98At least once/month 8.115068 2.37At least once/year 4.095137 1.20At least once/life 15.24331 4.45
Frequency Missing = 17.740806832
DANGEROUS FOR KIDS TO USE TOBACCO
q30a Frequency Percent___________________________________Very 162.7305 49.00Somewhat 102.2362 30.78Not very 44.64691 13.44Not at all 9.285819 2.80Don't know 13.20641 3.98
Frequency Missing = 27.894176808
DANGEROUS FOR KIDS TO USE ALCOHOL
q30b Frequency Percent___________________________________Very 170.2009 51.99Somewhat 99.94626 30.53Not very 36.1267 11.04Not at all 12.08051 3.69Don't know 8.99081 2.75
Frequency Missing = 32.65480392
The frequencies have been weighted so that theanalysis reflects the distribution of students by grade
level in the district

8/14/2019 ELLIS COUNTY - Maypearl ISD - 2004 Texas School Survey of Drug and Alcohol Use
http://slidepdf.com/reader/full/ellis-county-maypearl-isd-2004-texas-school-survey-of-drug-and-alcohol 80/90
MaypearlSpring 2004
The FREQ Procedure
DANGEROUS FOR KIDS TO USE INHALANTS
q30c Frequency Percent
___________________________________Very 245.6142 77.68Somewhat 48.24757 15.26Not very 5.042254 1.59Not at all 5.223839 1.65Don't know 12.05299 3.81
Frequency Missing = 43.819165656
DANGEROUS FOR KIDS TO USE MARIJUANA
q30d Frequency Percent___________________________________Very 216.1849 67.31Somewhat 47.96124 14.93Not very 32.51306 10.12
Not at all 15.42581 4.80Don't know 9.111771 2.84
Frequency Missing = 38.803186059
DANGEROUS FOR KIDS TO USE COCAINE
q30e Frequency Percent___________________________________Very 274.1374 83.56Somewhat 32.54083 9.92Not very 6.044598 1.84Not at all 3.117664 0.95Don't know 12.22054 3.73
Frequency Missing = 31.938979562
DANGEROUS FOR KIDS TO USE CRACK
q30f Frequency Percent___________________________________Very 279.4859 86.19Somewhat 24.434 7.53Not very 2.935377 0.91Not at all 4.170752 1.29Don't know 13.24871 4.09
Frequency Missing = 35.725226455
The frequencies have been weighted so that theanalysis reflects the distribution of students by grade
level in the district

8/14/2019 ELLIS COUNTY - Maypearl ISD - 2004 Texas School Survey of Drug and Alcohol Use
http://slidepdf.com/reader/full/ellis-county-maypearl-isd-2004-texas-school-survey-of-drug-and-alcohol 81/90
MaypearlSpring 2004
The FREQ Procedure
DANGEROUS FOR KIDS TO USE ECSTASY
q30g Frequency Percent
___________________________________Very 286.4014 87.84Somewhat 19.29141 5.92Not very 1.907208 0.58Not at all 3.117664 0.96Don't know 15.34405 4.71
Frequency Missing = 33.938278523
DANGEROUS FOR KIDS TO USE STEROIDS
q30h Frequency Percent___________________________________Very 256.1619 77.45Somewhat 39.54902 11.96Not very 13.01009 3.93
Not at all 6.839288 2.07Don't know 15.19817 4.59
Frequency Missing = 29.241573405
DANGEROUS FOR KIDS TO USE HEROIN
q30i Frequency Percent___________________________________Very 294.384 89.29Somewhat 15.23268 4.62Not very 2.814416 0.85Not at all 4.170752 1.27Don't know 13.092 3.97
Frequency Missing = 30.306149541
DAYS SKIPPED SINCE SEPTEMBER
q31a Frequency Percent_________________________________None 274.7857 82.171-3 days 51.36833 15.364-9 days 6.176394 1.8510+ days 2.081257 0.62
Frequency Missing = 25.588332694
The frequencies have been weighted so that theanalysis reflects the distribution of students by grade
level in the district
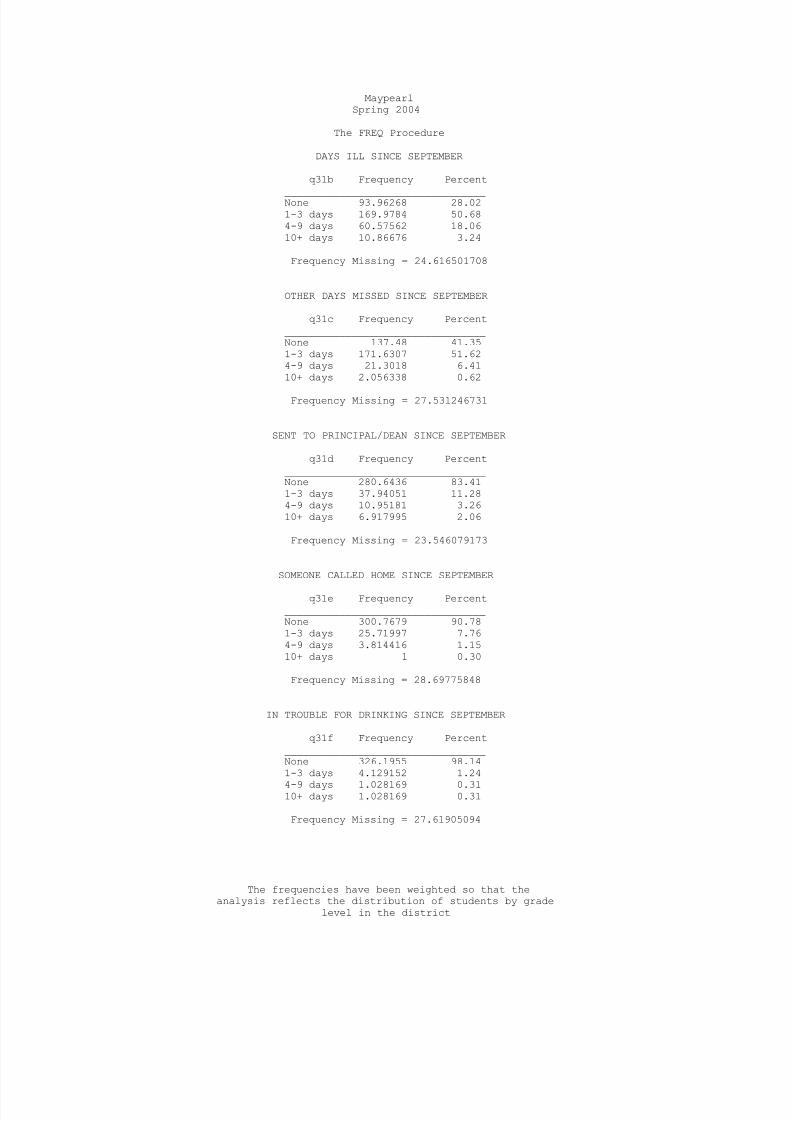
8/14/2019 ELLIS COUNTY - Maypearl ISD - 2004 Texas School Survey of Drug and Alcohol Use
http://slidepdf.com/reader/full/ellis-county-maypearl-isd-2004-texas-school-survey-of-drug-and-alcohol 82/90
MaypearlSpring 2004
The FREQ Procedure
DAYS ILL SINCE SEPTEMBER
q31b Frequency Percent
_________________________________None 93.96268 28.021-3 days 169.9784 50.684-9 days 60.57562 18.0610+ days 10.86676 3.24
Frequency Missing = 24.616501708
OTHER DAYS MISSED SINCE SEPTEMBER
q31c Frequency Percent_________________________________None 137.48 41.351-3 days 171.6307 51.624-9 days 21.3018 6.4110+ days 2.056338 0.62
Frequency Missing = 27.531246731
SENT TO PRINCIPAL/DEAN SINCE SEPTEMBER
q31d Frequency Percent_________________________________None 280.6436 83.411-3 days 37.94051 11.284-9 days 10.95181 3.2610+ days 6.917995 2.06
Frequency Missing = 23.546079173
SOMEONE CALLED HOME SINCE SEPTEMBER
q31e Frequency Percent
_________________________________None 300.7679 90.781-3 days 25.71997 7.764-9 days 3.814416 1.1510+ days 1 0.30
Frequency Missing = 28.69775848
IN TROUBLE FOR DRINKING SINCE SEPTEMBER
q31f Frequency Percent_________________________________None 326.1955 98.141-3 days 4.129152 1.24
4-9 days 1.028169 0.3110+ days 1.028169 0.31
Frequency Missing = 27.61905094
The frequencies have been weighted so that theanalysis reflects the distribution of students by grade
level in the district

8/14/2019 ELLIS COUNTY - Maypearl ISD - 2004 Texas School Survey of Drug and Alcohol Use
http://slidepdf.com/reader/full/ellis-county-maypearl-isd-2004-texas-school-survey-of-drug-and-alcohol 83/90
MaypearlSpring 2004
The FREQ Procedure
IN TROUBLE FOR DRUG USE SINCE SEPTEMBER
q31g Frequency Percent
_________________________________None 326.2499 98.751-3 days 3.109426 0.944-9 days 1.036407 0.31
Frequency Missing = 29.604265394
TROUBLE WITH FRIENDS BECAUSE OF DRINKING
q32a Frequency Percent__________________________________None 307.2368 94.051-3 times 18.39764 5.634-9 times 1.028169 0.31
Frequency Missing = 33.33742453
DRIVEN A CAR AFTER A GOOD BIT TO DRINK
q32b Frequency Percent__________________________________None 296.9165 91.491-3 times 17.31135 5.334-9 times 5.131544 1.5810+ times 5.157321 1.59
Frequency Missing = 35.483304334
CRITICIZED BY DATE BECAUSE OF DRINKING
q32c Frequency Percent
__________________________________None 299.9119 93.381-3 times 16.26654 5.064-9 times 2.921292 0.9110+ times 2.064576 0.64
Frequency Missing = 38.835688768
TROUBLE WITH POLICE BECAUSE OF DRINKING
q32d Frequency Percent__________________________________None 308.0129 96.141-3 times 8.266543 2.584-9 times 1 0.3110+ times 3.092745 0.97
Frequency Missing = 39.62778206
The frequencies have been weighted so that theanalysis reflects the distribution of students by grade
level in the district

8/14/2019 ELLIS COUNTY - Maypearl ISD - 2004 Texas School Survey of Drug and Alcohol Use
http://slidepdf.com/reader/full/ellis-county-maypearl-isd-2004-texas-school-survey-of-drug-and-alcohol 84/90
MaypearlSpring 2004
The FREQ Procedure
TROUBLE WITH FRIENDS BECAUSE OF DRUG USE
q32e Frequency Percent
__________________________________None 288.0172 91.921-3 times 20.28232 6.474-9 times 4.008191 1.2810+ times 1.028169 0.33
Frequency Missing = 46.664142286
DRIVEN A CAR WHILE HIGH FROM DRUGS
q32f Frequency Percent__________________________________None 289.8643 92.501-3 times 13.38161 4.274-9 times 4.943615 1.5810+ times 5.165559 1.65
Frequency Missing = 46.644865522
CRITICIZED BY DATE BECAUSE OF DRUG USE
q32g Frequency Percent__________________________________None 293.2807 93.221-3 times 15.31053 4.874-9 times 0.985915 0.3110+ times 5.028122 1.60
Frequency Missing = 45.394752189
TROUBLE WITH POLICE BECAUSE OF DRUG USE
q32h Frequency Percent
__________________________________None 313.9849 97.141-3 times 7.221039 2.234-9 times 1.036407 0.3210+ times 1 0.31
Frequency Missing = 36.757682267
CLASS DAYS DRUNK ON ALCOHOL SINCE SEPT
q33a Frequency Percent_________________________________None 306.3106 92.431-3 days 21.05188 6.35
4-9 days 1.971831 0.6010+ days 2.056338 0.62
Frequency Missing = 28.609300128
The frequencies have been weighted so that theanalysis reflects the distribution of students by grade
level in the district

8/14/2019 ELLIS COUNTY - Maypearl ISD - 2004 Texas School Survey of Drug and Alcohol Use
http://slidepdf.com/reader/full/ellis-county-maypearl-isd-2004-texas-school-survey-of-drug-and-alcohol 85/90
MaypearlSpring 2004
The FREQ Procedure
CLASS DAYS HIGH ON MARIJUANA SINCE SEPT
q33b Frequency Percent
_________________________________None 299.8251 91.601-3 days 14.18723 4.334-9 days 3 0.9210+ days 10.31378 3.15
Frequency Missing = 32.673876264
CLASS DAYS HIGH ON INHALANTS SINCE SEPT
q33c Frequency Percent_________________________________None 318.414 97.861-3 days 2.850823 0.884-9 days 2.036407 0.6310+ days 2.064576 0.63
Frequency Missing = 34.634171975
CLASS DAYS HIGH ON OTHER DRUG(S)
q33d Frequency Percent_________________________________None 315.0347 95.351-3 days 10.28821 3.114-9 days 3.014085 0.9110+ days 2.064576 0.62
Frequency Missing = 29.598465891
ALCOHOL USE AT PARTIES THIS SCHOOL YEAR
q34a Frequency Percent
_________________________________________Never 134.9749 40.74Seldom 38.14368 11.51Half the time 18.18414 5.49Most of the time 38.43959 11.60Always 39.12874 11.81Don't know 10.12845 3.06Didn't attend 52.32334 15.79
Frequency Missing = 28.677173431
The frequencies have been weighted so that theanalysis reflects the distribution of students by grade
level in the district

8/14/2019 ELLIS COUNTY - Maypearl ISD - 2004 Texas School Survey of Drug and Alcohol Use
http://slidepdf.com/reader/full/ellis-county-maypearl-isd-2004-texas-school-survey-of-drug-and-alcohol 86/90
MaypearlSpring 2004
The FREQ Procedure
DRUG USE AT PARTIES THIS SCHOOL YEAR
q34b Frequency Percent
_________________________________________Never 167.3704 50.52Seldom 28.305 8.54Half the time 13.19872 3.98Most of the time 32.55401 9.83Always 21.44294 6.47Don't know 13.07791 3.95Didn't attend 55.34567 16.71
Frequency Missing = 28.705342445
SOUGHT HELP FOR DRUG/ALCOHOL PROBLEM
q35 Frequency Percent___________________________________No 275.5293 93.50
Yes 19.14183 6.50
Frequency Missing = 65.328884603
WOULD SEEK HELP FROM SCHOOL COUNSELOR
q36a Frequency Percent___________________________________No 205.525 64.10Yes 115.1268 35.90
Frequency Missing = 39.34821187
WOULD SEEK HELP OUTSIDE OF SCHOOL
q36b Frequency Percent___________________________________No 230.5091 72.31Yes 88.26108 27.69
Frequency Missing = 41.229800042
WOULD SEEK HELP FROM OTHER COUNSELOR
q36c Frequency Percent___________________________________No 197.0668 62.67Yes 117.3893 37.33
Frequency Missing = 45.543882264
The frequencies have been weighted so that theanalysis reflects the distribution of students by grade
level in the district

8/14/2019 ELLIS COUNTY - Maypearl ISD - 2004 Texas School Survey of Drug and Alcohol Use
http://slidepdf.com/reader/full/ellis-county-maypearl-isd-2004-texas-school-survey-of-drug-and-alcohol 87/90
MaypearlSpring 2004
The FREQ Procedure
WOULD SEEK HELP FROM PARENTS
q36d Frequency Percent
___________________________________No 135.3882 42.74Yes 181.3928 57.26
Frequency Missing = 43.218965805
WOULD SEEK HELP FROM A MEDICAL DOCTOR
q36e Frequency Percent___________________________________No 170.7882 54.82Yes 140.769 45.18
Frequency Missing = 48.44285211
WOULD SEEK HELP FROM FRIENDS q36f Frequency Percent___________________________________No 67.69539 21.30Yes 250.142 78.70
Frequency Missing = 42.162627777
WOULD SEEK HELP FROM ANOTHER ADULT
q36g Frequency Percent___________________________________No 129.4873 40.52Yes 190.0442 59.48
Frequency Missing = 40.468471892
WOULD NOT SEEK HELP
q36h Frequency Percent___________________________________No 262.3642 84.49Yes 48.17624 15.51
Frequency Missing = 49.459532745
DRUG/ALCOHOL INFO--HEALTH CLASS
q37a Frequency Percent___________________________________
No 158.1544 58.84Yes 110.6375 41.16
Frequency Missing = 91.208118342
The frequencies have been weighted so that theanalysis reflects the distribution of students by grade
level in the district

8/14/2019 ELLIS COUNTY - Maypearl ISD - 2004 Texas School Survey of Drug and Alcohol Use
http://slidepdf.com/reader/full/ellis-county-maypearl-isd-2004-texas-school-survey-of-drug-and-alcohol 88/90
MaypearlSpring 2004
The FREQ Procedure
DRUG/ALCOHOL INFO--ASSEMBLY PROGRAM
q37b Frequency Percent
___________________________________No 118.7476 45.30Yes 143.4014 54.70
Frequency Missing = 97.851034664
DRUG/ALCOHOL INFO--GUIDANCE COUNSELOR
q37c Frequency Percent___________________________________No 222.3926 85.45Yes 37.86905 14.55
Frequency Missing = 99.738311711
DRUG/ALCOHOL INFO--SCIENCE CLASS q37d Frequency Percent___________________________________No 213.3981 82.40Yes 45.56669 17.60
Frequency Missing = 101.03521668
DRUG/ALCOHOL INFO--SOCIAL STUDIES CLASS
q37e Frequency Percent___________________________________No 235.9567 90.72Yes 24.13919 9.28
Frequency Missing = 99.904122421
DRUG/ALCOHOL INFO--DRUG RAP SESSION
q37f Frequency Percent___________________________________No 220.2858 87.46Yes 31.58432 12.54
Frequency Missing = 108.12985692
DRUG/ALCOHOL INFO--INVITED SCHOOL GUEST
q37g Frequency Percent___________________________________
No 186.4799 71.71Yes 73.57953 28.29
Frequency Missing = 99.940529543
The frequencies have been weighted so that theanalysis reflects the distribution of students by grade
level in the district

8/14/2019 ELLIS COUNTY - Maypearl ISD - 2004 Texas School Survey of Drug and Alcohol Use
http://slidepdf.com/reader/full/ellis-county-maypearl-isd-2004-texas-school-survey-of-drug-and-alcohol 89/90
MaypearlSpring 2004
The FREQ Procedure
DRUG/ALCOHOL INFO--OTHER SCHOOL SOURCE
q37h Frequency Percent
___________________________________No 185.3333 71.89Yes 72.47414 28.11
Frequency Missing = 102.19258486
PARENTS FEEL ABOUT KIDS SMOKING CIGARET
q38a Frequency Percent__________________________________________Strong disapprove 242.9714 74.83Mild disapprove 31.35195 9.66Neither 22.35809 6.89Mildly approve 5.064576 1.56Strongly approve 4.041552 1.24Don't know 18.88973 5.82
Frequency Missing = 35.322685881
PARENTS FEEL ABOUT KIDS DRINKING BEER
q38b Frequency Percent__________________________________________Strong disapprove 217.3392 67.35Mild disapprove 42.71841 13.24Neither 30.64131 9.50Mildly approve 8.050445 2.49Strongly approve 4.041552 1.25Don't know 19.89797 6.17
Frequency Missing = 37.311150606
PARENTS FEEL ABOUT KIDS USING MARIJUANA
q38c Frequency Percent__________________________________________Strong disapprove 271.6299 84.42Mild disapprove 17.1707 5.34Neither 10.03002 3.12Mildly approve 3.022323 0.94Strongly approve 4.041552 1.26Don't know 15.87565 4.93
Frequency Missing = 38.229893834
PURCHASED LOTTERY TICKET IN PAST YEAR
q39 Frequency Percent___________________________________No 267.0414 80.78Yes 63.52578 19.22
Frequency Missing = 29.432859601
The frequencies have been weighted so that theanalysis reflects the distribution of students by grade
level in the district

8/14/2019 ELLIS COUNTY - Maypearl ISD - 2004 Texas School Survey of Drug and Alcohol Use
http://slidepdf.com/reader/full/ellis-county-maypearl-isd-2004-texas-school-survey-of-drug-and-alcohol 90/90
MaypearlSpring 2004
The FREQ Procedure
NON-LOTTERY GAMBLING IN PAST YEAR
q40 Frequency Percent
___________________________________No 226.6688 68.35Yes 104.9796 31.65
Frequency Missing = 28.35160283
MONEY SPENT ON GAMBLING IN PAST YEAR
q41 Frequency Percent___________________________________$0 219.1221 66.09$1 - $10 67.33011 20.31$11 - $50 24.2144 7.30$51 - $100 8.055637 2.43$100+ 12.84493 3.87
Frequency Missing = 28.432859601