Embed Size (px)
Citation preview
858.458.0223 [email protected]
Elgar TerraSAS 1kW-1MW
• Simulate dynamic irradiance and temperature ranging from a clear day to cloud cover conditions
• Ramp the voltage, temperature or irradiance level over a programmed time interval
• Readback of voltage, current, irradiance level and temperature setting
• Tests for inverter Maximum Power Point Tracking (MPPT)
• Provides programmable I-V curves for PV Inverter testing
• Simulates different types of solar cell material
• Multi-Channel, Up to 1MW
Programmable Solar Array Simulator
Why power supply is critical for PV simulations Many solar inverters generate AC ripple on their DC input, which is connected to the photovoltaic array. For single phase inverters, the frequency of this ripple is twice the line frequency (120 Hz for US models). The simulator’s power supplies must not supress this ripple as a function of their regulation loop. An increasing number of inverters (and virtually all micro-inverters) accurately measure amplitude and phase of the ripple voltage and current to quickly track the MPP of the array. This approach allows tracking the MPP at a much higher speed when compared to conventional dithering techniques (also called perturbate-and-observe). Faster tracking of the MPP results in a much higher overall efficiency in cloudy conditions, where the irradiance is constantly changing. It is likely that all solar inverters will use this approach in the near future, since end users are very sensitive to the overall efficiency of their solar energy installations.
To satisfy this requirement, the PV simulator must be capable of reproducing the voltage / current behavior of a solar array at the ripple frequency. Most standard switching power supplies employ very large output capacitors and inductors in their output circuits and are unable to deliver the required performance - regardless of the response speed of the I/V curve controller.
Elgar’s line of PV simulators are based on high speed versions of our standard products, where output capacitors and other speed-limiting components have been adjusted. This results in a speed improvement of 10 times or better. Proprietary features built into the PV controller hardware and firmware, combined with our high speed power supplies, deliver the required performance. This technology was extensively tested on micro-inverters and is ready to test the next generation of inverters.
Strengths of using DSP signal processingOur technology avoids using linear amplifiers, which are fast but bulky and inefficient. The required performance is delivered by high speed switching power supplies and advanced DSP signal processing techniques. Competitors data sheets mentions that speed requirements may not be met in some conditions, “...depending also on the type of MPP tracking principles”. An additional linear module is required to satisfy the new requirements. Some competitor’s power supplies specifications say that it uses “...innovative IGBT and transformer technology”. Our power supplies use Power MOSFETs, which typically switch ten times as fast as the most recent IGBTs. Higher switching frequency translates to smaller output capacitors and inductors - which is the key to a successful high speed power supply design.
Product OverviewThe Elgar TerraSAS System, (TSAS) provides an easily programmable means of simulating the characteristic behavior of a PV array. The system provides a turn-key approach to testing the maximum peak power tracking (MPPT) characteristics for grid-tied inverters and DC charge controllers. The ability to simulate virtually any fill factor or solar cell material allows the customer to validate the MPPT algorithm with a power source. Hardware control is accomplished by an application running on the local controller that communicates directly to the PV simulator using RS422, which operate as a dedicated IV curve generation processor. The local Graphical User Interface (GUI) is accomplished via another application that provides all of the user controls to the TerraSAS system. Imbedded in the application is the Ethernet (LAN) parser for remote communication and control. All of the
80-1000 V
480
115 208 400
1
AMETEK Programmable Power 9250 Brown Deer Road San Diego, CA 92121-2267 USA
www.ProgrammablePower.com
functions available locally through the controller are also available remotely.
Description As shown in the rack drawing, the TerraSAS consists of programmable DC power supplies, a rack mounted controller, keyboard and LCD display with control software and GUI interface, output isolation and polarity reversing relays and a unique PV simulation engine that controls the power supply. This combination of hardware allows the TerraSAS to simulate most test protocols or combination of events that a solar installation will be subjected to. Power supplies are available in 1-15KW increments to simulate arrays up to 1MW.
The included software, as displayed below, allows modeling of a PV panel without an extensive knowledge of solar array parameters. The only parameters required for a simulation are the open circuit voltage and short circuit current. The slope of the VI curve can then be modified by the peak power parameters, Vmpp and Impp. Changes to these parameters will allow the shape of the VI curve to be adapted to any fill factor between 0.5 and 1. Once an IV curve has been generated, changes to the irradiation level or temperature can be changed on the fly so that the behavior
of a grid tied inverter can be tested under realistic conditions for cloud shadowing and panel temperature rise. Long term weather simulations can be run to determine the amount of energy delivered in a given situation. Inverters can be optimized for real MPP search modes, because shadowing and temperature changes can be simulated realistically.
The PV simulation software allows definition of key parameters like Voc, Isc, Vmpp and Isc at 25 °C and 1000W/m2, so that the resulting VI curve is calculated according to a standard solar cell model.
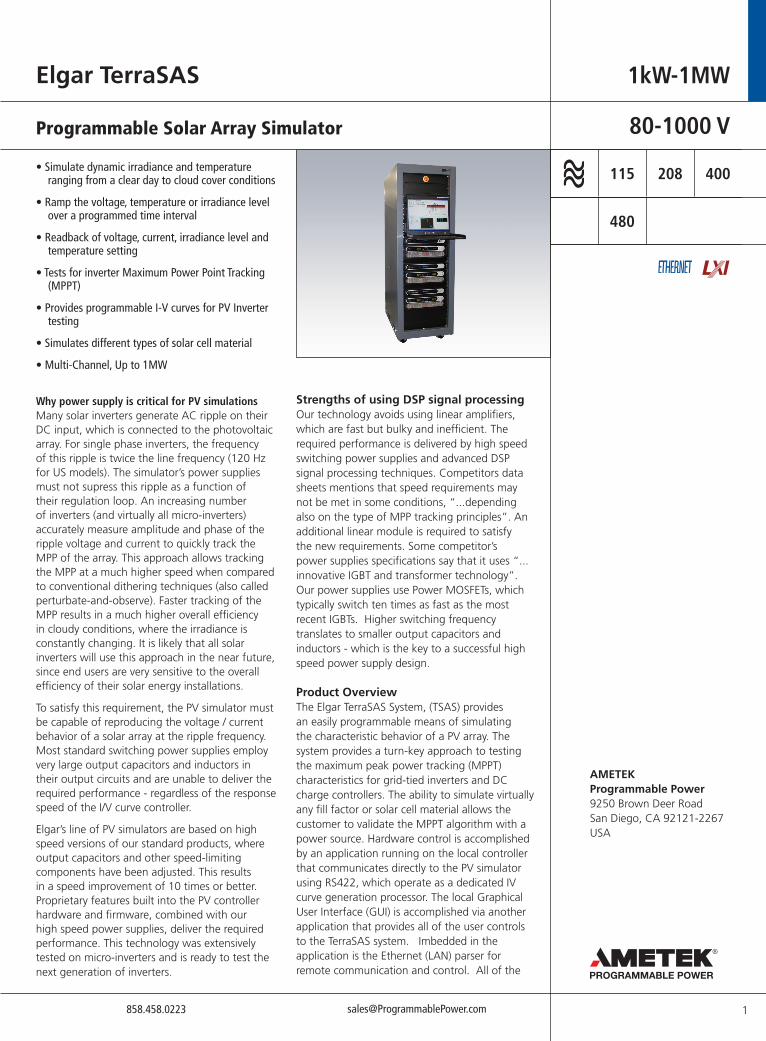
The PV simulator has the ability to simulate ideal IV curves as well as irregular characteristics for peak power tracking that result when solar panels with different output characteristics are paralleled as shown on the following two graphs below. With the simulator programmed for different values of irradiance or temperature, the characteristic “multiple hump” IV curve will result. By programming the changes in irradiance and temperature in a table, dynamic simulation of compressed time profiles of a 24 hour day can be run in a loop to simulate the day and night periods for extended periods of time.
Dynamic simulation showing changes in Irradiance and Temperature over time
Elgar TerraSAS
2

858.458.0223 [email protected]
TerraSAS
IV Curve Control Interface : Parameters are programmable through sliding scale or direct input of value
Control Displays
The graphic above shows the GUI interface displays. The entered set of IV curves is displayed as soon as the parameters are entered. The actual measured data is then overlaid on the screen so that the operating point can be viewed in real time. The display times can be set from minutes to days to allow for long term testing.
Programmable ParametersSet a specified irradiance level Set a specified temperature value Set a specified voltage level Set a specified current level Set a specified temperature coefficient
Ramp of voltage, temperature or irradiance level over a programmed time interval Readback of voltage, current, irradiance level, and temperature setting Programmable calibration of system
Curve FormulaThe PV curves for the simulator are derived from the formula shown below.
Io as a function of Vo: Io=Isc (1-C1 (exp (V/(C2 x Voc))-1)) C1=(1-(Imp/Isc)) (exp(-Vmp/(C2 x Voc))) C2=((Vmp/Voc)-1)/(ln(1-Imp/Isc))
Where the Reference Irradiance conditions for the simulated arrays is 1000W/m2 and the Reference Array Temperature is 25°C
The simulated PV arrays are provided in terms of array fill factor, Maximum Power Point Voltage and Maximum Power Point Power. The curves generated are based on the Sandia Labs simplified PV Array model defining the relationship between
these values and other parameters as provided below:
Where:
3
www.ProgrammablePower.com
1kW-1MW TerraSAS - Specifications
Where: β Array temperature Coefficient, %/°C T= Cell temperature, °C V= Voltage, V I= Current, A FF= Fill FactorSubscripts:Ref= Reference (i.e., at reference or rated conditions) MP= Maximum Power OC= Open Circuit SC= Short Circuit
DC Output ConnectionsThe output connections will use finger safe, pressure type connectors or terminal blocks of suitable ampacity on the rear I/O panel depending on output current requirements.
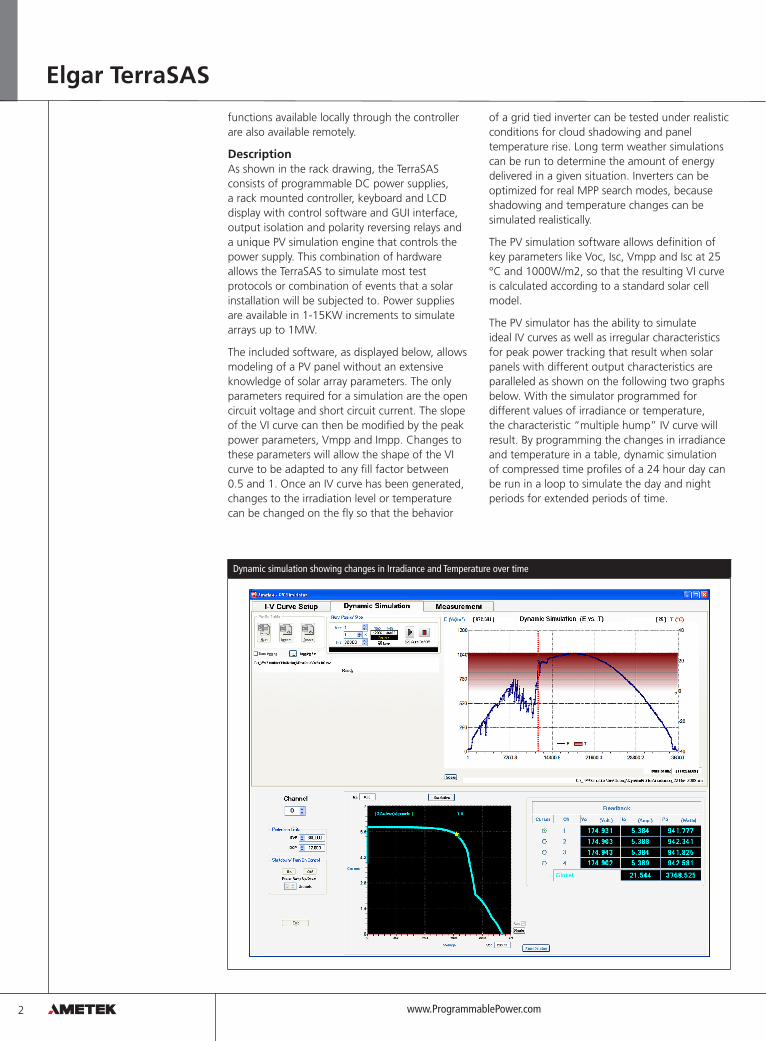
“Multiple Hump” IV CurveUtilizing data gathered from the Solar Advisor Model (SAM) data base, the TerraSAS allows the user to model systems made up of two or more subsystems. For example, a PV system that consists of three arrays with different orientations, thus creating a “Multiple Hump” as shown below.
SafetyThe system includes a shutdown function that will disable the output with an open interlock contact. In the event of an open interlock, the PV simulator chassis will program down the DC output and open the output relays, and provides complete qalvamic isolation
The benefit of simulators is simply that they offer the ability to test and invert without reliance on a real array and can simulate PV behaviors that a real array cannot be easily manipulated to do.
This assumes that the PV simulator can behave like a real panel of course.
Characteristic “multiple hump” IV curve results when three PV profiles are added
4

858.458.0223 [email protected]
Specifications
AC Power AC Input Voltage: 115V (for DCS) 208VAC three phase Std, 400VAC and 480VAC three phase are optional (Input current depends on power rating)
DC Output Open circuit voltage, Voc: 0 - 1000VDC Short circuit current, Isc: 0 – 1000AMaximum output power at MPP: 1MW(Lower voltage ranges will provide proportionately higher currents) 1-6 channel output, consult factory for additional channels.
Programmable Parameters Irradiance level: 0 to 2000 W/m²Temperature: -40 to 90°CTemperature Coefficient: 0 to -65,000 mV/°CSimulation Times: 0 to 65,000 secondsIsolation relay and polarity relay closure
Accuracy Voltage Readback: 0.2% of rated max voltageCurrent Readback: 0.5% of max current
Programming Interface Ethernet with RJ-45 connector / LAN
AC Input Connections Finger safe, pressure type connectors three phase AC four wire plus safety ground stud AC input circuit breaker
DC Output Connections Finger safe, pressure type connectors positive and negative
Safety The output isolation relay operates as a disconnect relay in the event of a malfunction or an open interlock contact
Output Voltage and Current Ranges
Power (MPP) 1 kW 5 kW 10 kW 15 kW RMS P-P DC Leakage Current
Voc
80V Isc=12.5 Isc=83A Isc=167A Isc=250A 20 mV 100 mV
600Voc Isc=1.6A Isc=8A Isc=16A Isc=25A 60 mV 350 mV 335mA
1000Voc N/A Isc=5A Isc=10A N/A <1mA
MMPT
Scalable (MPPT) 1000W to 1.0MW
Response to MPPT Up to 120Hz
Current Slew Rate 3msec/A
Control Loop Sampling Rate 1usec / 10kHz
TerraSAS - Specifications
Programmable Setpoints
Voc 0-Rated output voltage
Fill Factor 0.5 to 0.95
Vmp 0-Voc
Imp 0-Isc
ISC 0-Rated output current
Over Voltage Protection (OVP) 0.1% to 110% of Voc Max
Static and Dynamic Programmable PV Array Parameters
Irradiance Level 0-2,000W/m2
Temperature -100 to +100*C
Voltage Level 0-600/1,000V 80V - Consult factory for other voltages
Current level to rated output current 0-Rated Output (see MPP Chart)
Voltage Temperature Coefficient 0 to -2% / *C
Arbitrary VI Curve Up to 4096 data points
VI Curve Set Point Accuracy
Voltage <0.1%, FS
Current <0.5%, FS
Programming Resolution
Programming Resolution <0.002% of FS
Voltage / Current <0.002% of FS
5
www.ProgrammablePower.com
1kW-1MW TerraSAS
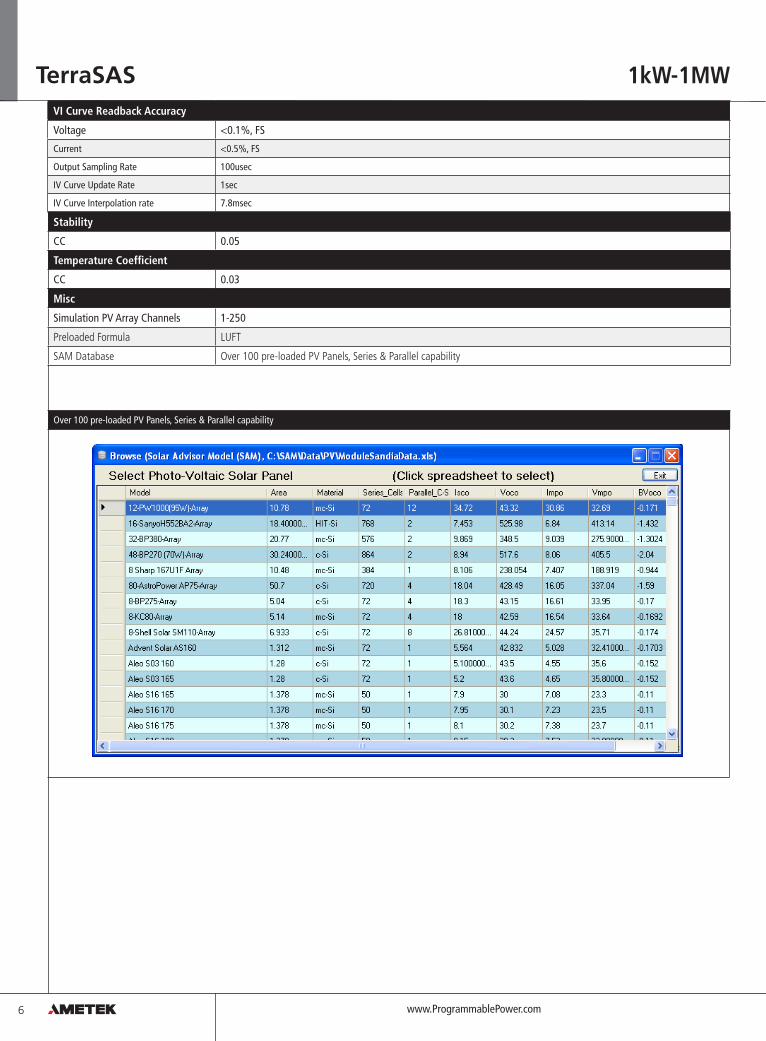
Over 100 pre-loaded PV Panels, Series & Parallel capability
VI Curve Readback Accuracy
Voltage <0.1%, FS
Current <0.5%, FS
Output Sampling Rate 100usec
IV Curve Update Rate 1sec
IV Curve Interpolation rate 7.8msec
Stability
CC 0.05
Temperature Coefficient
CC 0.03
Misc
Simulation PV Array Channels 1-250
Preloaded Formula LUFT
SAM Database Over 100 pre-loaded PV Panels, Series & Parallel capability
6