Embed Size (px)
Citation preview

ELECTRONIC TOLL AND TRAFFIC MANAGEMENT
PROJECT
Research No. Z-01-02
Task 31a
Wireless, Solar Powered Tag Reader
Final Report
Prepared for: New York State Department of Transportation
Prepared by: Rensselaer Polytechnic Institute
Polytechnic University of New York University Mark IV Industries
North Carolina State University Annese & Associates
Center for Infrastructure, Transportation and the Environment
Technical Report No: 10‐05
December 2010

RensselaerPolytechnicInstitute ii
DISCLAIMER
This report was funded in part through grant(s) from the Federal Highway
Administration, United States Department of Transportation, under the State Planning
and Research Program, Section 505 of Title 23, U.S. Code. The contents of this report do
not necessarily reflect the official views or policy of the United States Department of
Transportation, the Federal Highway Administration or the New York State Department
of Transportation. This report does not constitute a standard, specification, regulation,
product endorsement, or an endorsement of manufacturers.

RensselaerPolytechnicInstitute iii
1. Report No. SPR#: C-xx-xx
2. Government Accession No.
3. Recipient's Catalog No.
4. Title and Subtitle Electronic Toll and Traffic Management: Wireless, Solar Powered E-ZPass Tag Reader Project - Final Report
5. Report Date December 2010 6. Performing Organization
Code 7. Author(s) William A. Wallace, Jeffrey M. Wojtowicz, Earl E. Lee, Bryan, Bertoli, George List, Alixandria Demers, Isaac Isukapati, John Falcocchio, Raman Patel, Paul Manuel, Wiemin He and Christopher Body
8. Performing Organization
Report No.
9. Performing Organization Name and Address Rensselaer Polytechnic Institute 110 Eighth St. Troy, NY 12180
10. Work Unit No. 11. Contract or Grant No.Z-01-02
12. Sponsoring Agency Name and Address NYS Department of Transportation 50 Wolf Road Albany, New York 12232
13. Type of Report and Period Covered Final Report
14. Sponsoring Agency Code
15. Supplementary Notes Project funded in part with funds from the Federal Highway Administration.
16. Abstract The Electronic Toll and Traffic Management (ETTM) project was a $1.1 million effort sponsored by the Federal Highway Administration (FHWA) and the New York State Department of Transportation (NYSDOT). It began in June 2005 with the goal of using wireless technology to enhance the observability of the transportation network to improve management of the system. Another goal of the ETTM project was to develop and test wireless, solar-powered tag readers, and provide real-time travel time information. These new detectors will be available for use in areas where power or communications infrastructure do not exist or for temporary areas where additional monitoring is desired like arterials, work zones or planned special events.
17. Key Words ETTM, wireless, solar powered E-ZPass tag reader, RFID, travel time, arterial data collection, work zone, planned special events
18. Distribution Statement No Restrictions
19. Security Classif. (of this report) Unclassified
20. Security Classif. (of this page)Unclassified
21. No. of Pages
22. Price
Form DOT F 1700.7 (8-72)

TableofContents iv
Table of Contents
1 INTRODUCTION ............................................................................................................ 1
2 APPROACH AND METHODOLOGY ................................................................................. 2
2.1 Task 22: Preliminary Design of Experiments for the ETTM Device 2
2.2 Task 23: Create First Prototype E‐ZPass Reader 2
2.3 Task 24: Test and Enhance the New Tag Reader 3
2.4 Task 25: Fabricate Five Additional Tag Readers 4
2.5 Task 26: Finalize the Field Experiment Plan 4
2.6 Task 27: Prepare the Experiment 6
2.7 Task 28: Conduct the Experiment 6
2.8 Task 29: Assess the Results 9
2.9 Task 29a: Data Quality Assessment 10
2.10 Task 30: Investigate Data Fusion Methodologies 11
3 FINDINGS AND CONCLUSIONS .................................................................................... 12
3.1 Task 31b: Prepare the Evaluation Report 13
4 REFERENCES ............................................................................................................... 14

Task 31 – Electronic Toll and Traffic Management Project Final Report 1
1 Introduction Radio frequency identification (RFID) technology has been proposed as a means of observing
traffic as part of an automatic vehicle identification (AVI) system. To date, many of the
deployments of the technology have been using fixed installations, typically on freeways. Some
examples of these deployments include the TRANSMIT system in New York and New Jersey and
the FasTrak™ system in California. This project provided a demonstration of RFID tag reader
technology, more specifically E‐ZPass toll tag technology, for collecting link travel times where
permanent installations were not practical. For example, the technology could be used for
traffic management on local arterials, during special events or through work zones.
This Electronic Toll and Traffic Management (ETTM) project was initiated in August 2005 and
completed in December 2010. This project was conducted as part of the Advanced Traveler
Information System (ATIS) Implementation and Integration project. The project was led by
Rensselaer Polytechnic Institute (RPI) with support from Mark IV Industries, Annese and
Associates, North Carolina State University (NCSU) and Polytechnic Institute of New York
University. The work was funded by the New York State Department of Transportation
(NYSDOT) and the Federal Highway Administration (FHWA).
As part of this project the team designed, built and deployed six prototype wireless, solar
powered E‐ZPass tag readers. Between July 2007 and early January 2008 the tag readers were
deployed in the Capital District Intelligent Transportation System (ITS) Testbed in North
Greenbush, NY and at a planned special event in Syracuse, NY during the New York State Fair.
The North Greenbush, NY deployment served as a system test on an arterial while the NYS Fair
deployment served as a real‐world deployment of this technology at a planned special event
and through a work zone.
As stated in the work scope, the goals were to:
Develop a preliminary field experiment plan;
Create a prototype of the wireless, solar powered tag reader;
Test and enhance the prototype tag reader;
Build five additional prototype tag readers;
Finalize the field experiment plan;
Prepare the experiment;
Conduct the experiment;
Perform a data quality assessment for the two main components of the project;
Assess the results collected during the data collection;
Create methodology for fusing various types of transportation data.
Task 31 – Electronic Toll and Traffic Management Project Final Report 2
The following sections of this report summarize the findings from the various task reports that
were conducted as part of this project; more detailed information can be found in the specific
task report. The report is organized as follows. Section 2 presents the project approach and
methodology including summaries of Tasks 22 through 30 and Section 3 provides findings and
conclusions; this Task 31a Report and supplement Task 31b Evaluation Report comprise the
Final Report for the Electronic Toll and Traffic Management project.
2 Approach and Methodology The ETTM project began with Task 22 and was concluded with a final report as part of Task 31.
Tasks 22 through 25 focused on the design, construction and initial testing of the prototype
unit. Tasks 26 through 29 dealt with the field testing of the devices. Task 30 focused on
creating a data fusion methodology for various types of traffic data; a case study from the
deployment at the NYS Fair is presented. A summary of each task is provided below in
chronological order.
2.1 Task 22: Preliminary Design of Experiments for the ETTM Device The objective of the Task 22 report was to present a preliminary field experiment design for the
wireless, solar powered tag reader project (1). This report presented a preliminary field
experiment plan based on the data obtained from the ATIS project. As part of this plan,
locations were identified where possible tag readers could be deployed for various
experiments. During this phase of the project it was expected that a number of the pocket PC
devices that were deployed during the ATIS project would be also used as in‐vehicle data
sources to provide data that can be compared to that collected by the tag readers. However,
due to contractual delays on the project it was not feasible to do this.
This task was completed in August 2005.
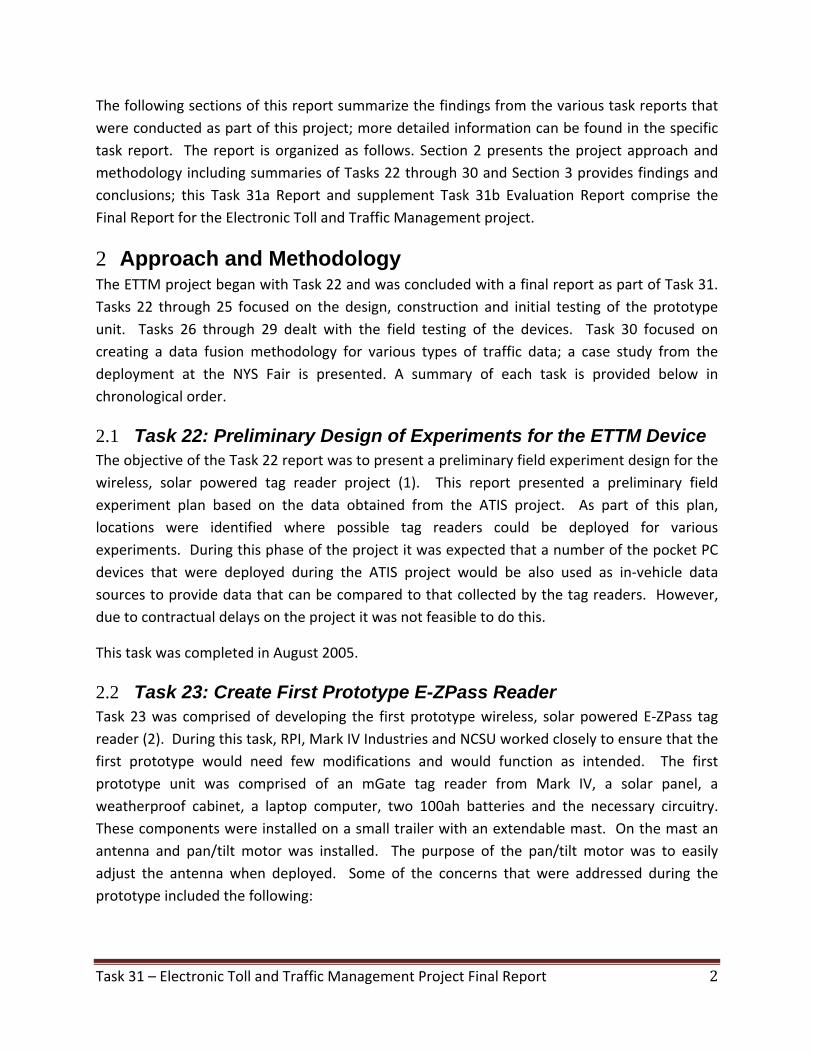
2.2 Task 23: Create First Prototype E-ZPass Reader Task 23 was comprised of developing the first prototype wireless, solar powered E‐ZPass tag
reader (2). During this task, RPI, Mark IV Industries and NCSU worked closely to ensure that the
first prototype would need few modifications and would function as intended. The first
prototype unit was comprised of an mGate tag reader from Mark IV, a solar panel, a
weatherproof cabinet, a laptop computer, two 100ah batteries and the necessary circuitry.
These components were installed on a small trailer with an extendable mast. On the mast an
antenna and pan/tilt motor was installed. The purpose of the pan/tilt motor was to easily
adjust the antenna when deployed. Some of the concerns that were addressed during the
prototype included the following:

Task 31 – Electronic Toll and Traffic Management Project Final Report 3
Power consumption of the device,
Power components of the system,
Communication devices,
Method of field installation, and
Data processing including which data items to transmit and
how to securely encrypt the data.
The prototype was capable of working in a typical field deployment
situation under favorable weather conditions; it was not a field‐
hardened device.
Although this task was delayed due to contracting issues RPI and
Mark IV began exploring various options in March 2006. In July 2006 the components of the
first prototype were delivered to RPI from Mark IV. During this time RPI was able to secure a
trailer with a mast. In July 2006 the trailer was modified to accommodate the components for
this project. Once the prototype was built the team spent several weeks doing controlled
testing in parking lots. On August 31, 2006 a workshop was held with the project partners. The
purpose of this workshop was to demonstrate the first prototype and make sure everyone
agreed to the design. For the first prototype the device that was used to process the tag reads
was a standard laptop computer. The team noted that they were working with Annese and
Associates to change the platform to a pocket PC. The pocket PC would encrypt the tag data
and upload it to a central server.
2.3 Task 24: Test and Enhance the New Tag Reader
The Task 24 report served as the product development report on the creation of the wireless
solar powered tag readers. This report documented the development process, its associated
lessons learned, and the enhancements made to the reader during initial testing (3).
The report discussed the hardware and software components found in
the prototype design as well as alternatives that were considered. For
the original prototype design the following sections were covered:
Solar mGate components, including,
o mGate reader,
o Power components, and
o Enclosure;
Field mounting options, including,
o Pole mounted options, and
o Trailer mounted options;
Figure 1 First prototype unit
Figure 2 mGate reader

Task 31 – Electronic Toll and Traffic Management Project Final Report 4
Hardware & software issues.
The Task 24 report is intended for general distribution. However, some information relevant to
the device’s design is the proprietary information of Mark IV Industries and is not releasable to
the general public. All proprietary information is contained in a separate report with
distribution approval required by NYS DOT and Mark IV Industries.
When the testing and reader enhancements were completed, a meeting with the NYSDOT
project manager was held. The purpose of this meeting was to get consent to fabricate the five
additional tag readers (Task 25).
This task began in September 2006 and enhancements to the prototype were completed by
December 2006. The report was submitted in August 2007. The reason for this delay was the
development of the data encryption software for the pocket PC (PPC) platform. This software
was under development from October 2006 until the Spring of 2007.
2.4 Task 25: Fabricate Five Additional Tag Readers
The purpose of this task was to build five additional wireless, solar powered tag readers that
were identical to the enhanced tag reader delivered as part of Task 24 (4). Since the changes
resulting from Task 23 were minimal the team decided to build the five additional tag readers
simultaneously with the enhancements to the first tag reader. On January 2, 2007 the NYSDOT
project manager met with the RPI project manager to see the five completed tag readers. The
NYSDOT project manager was satisfied with the devices and deemed the task complete.
2.5 Task 26: Finalize the Field Experiment Plan
The main objective of the Task 26 report was to finalize the field experiment plan that was set
forth in Task 22 (5). Since the prototype reader has been built and tested, the Task 22 field
experiment plan needed to be updated based on the actual operating characteristics of the tag
reader.
On August 31, 2006 a meeting was held at the RPI Technology Park, to discuss possible
deployment options for the tag readers. This meeting was held on the same day as the Task 23
workshop that presented the first working prototype device. The purpose of the workshop was
to engage the stakeholders in discussion on where to deploy the tag readers in the ITS Testbed
along Route 4.

Task 31 – Electronic Toll and Traffic Management Project Final Report 5
Figure 3 Proposed deployment locations
In May 2007 discussions and field visits were made to the proposed locations. Based on these
discussions and visits, the sites were modified so the trailer would be deployed in a location
that allowed for reliable data collection while also ensuring safety alongside the roadway. The
map shown in Figure 3 represents the locations the team agreed to deploy five of the tag
readers. The north‐south road to the right of the picture is Route 4 and the north‐south road to
the left is I‐787. At each one of the red circles the team planned on deploying one reader that
would capture one lane of traffic in a side‐fire application. For vehicles equipped with E‐ZPass
the through movements on Route 4 north and southbound can be captured as well as the
turning movements into the RPI Tech Park (location #1). It was decided that the sixth reader
would not be deployed initially and served as a backup if needed.
The travel times could be monitored for the vehicles traveling between the following pairs of readers:
- Reader 1 to Reader 5 (Jordan Road to Route 4 northbound) - Reader 1 to Reader 3 (Jordan Road to Route 4 southbound) - Reader 2 to Reader 3 (Route 4 southbound) - Reader 2 to Reader 1 (Route 4 southbound to Jordan Road) - Reader 4 to Reader 5 (Route 4 northbound) - Reader 4 to Reader 1 (Route 4 northbound to Jordan Road)

Task 31 – Electronic Toll and Traffic Management Project Final Report 6
Due to safety considerations the trailer mounted deployment option was not feasible at three
of the locations (numbers 3, 4 and 5 above). At these locations a sign mounted antenna was
constructed.
2.6 Task 27: Prepare the Experiment
The objective of this report was to explain the process whereby the wireless solar powered tag
reader field experiment was prepared and the lessons learned during the process. The Task 26
report outlined the anticipated deployment plan; this report describes the actual deployment
of the readers. This report includes information on both the NYS Route 4 deployments in North
Greenbush, NY and the deployments that were made at the NYS Fair in Syracuse, NY (6).
In June and July of 2007 the wireless solar powered E‐ZPass tag readers were deployed along
NYS Route 4 and Jordan Road in North Greenbush, NY. These locations were selected as part of
the Task 26 effort. In mid August 2007 the readers were then transported and deployed near
Syracuse, NY during the NYS Fair. Upon completion of data collection at the NYS Fair, the six
readers were again redeployed in North Greenbush, NY until January 2008. The task report
discusses in detail each of these deployments.
During the installations the team continued to learn a great deal about the devices and how
they should be placed for optimal performance. There were a number of issues that had to be
resolved dealing with the site deployments of the readers. Besides choosing locations that
were ideal in terms of measuring travel times, the team also had to take into account safety
issues such as the devices proximity to the road and how to obtain permission to park the
devices on private property.
2.7 Task 28: Conduct the Experiment
The Task 28 report focused on conducting the experiment. This task report was done as part of
a combined Task 28 and 29 report because of the overlap between the two tasks (7). As part of
this task the movement of tagged equipped vehicles through the testbed area was monitored
and the performance of the wireless solar powered tag readers was documented. These
deployments served mainly as a system evaluation, whereas the testing in late August 2007 at
the NYS Fair served as a deployment at a real work zone and special event for monitoring travel
times. With the Route 4 testing the team was fortunate enough to have the readers deployed
during all types of weather conditions such as hot humid days, severe rain and wind as well as
snow and ice.
Traditionally, antennas for tag readers are installed directly over the travel lane (overhead). As
part of this project, the reader’s antenna was installed at the side of the road, in a side‐fire
configuration. In most of the installations the reader was deployed on the shoulder of the road,

Task 31 – Electronic Toll and Traffic Management Project Final Report 7
resulting in the traffic from only one lane being captured. In one case it was possible to deploy
the reader on a center median island and capture traffic in both directions (Photos of these
sites can be seen in (6)).
It is important to note that this device being tested
was a prototype and was not field hardened. Most all
of the components that comprise the system were
found to be durable during the field evaluation.
There were a few failures due to condensation
damage to the coaxial components but these were
relatively rare and with the proper weatherproofing
were eliminated. The device also performed very well
in icy and snowy conditions.
The most problematic component of the system was
the communication device. The Pocket PC (PPC) that
was used claimed to be one of the more advanced
devices on the market at the time. However, the PPC
produced most of the failures while the system was
deployed. The team was fortunate to have the ability
to view the web application and see the last tag transaction for each of the readers. If there
were no recent tag reads then the team could go to the field and reset the necessary devices.
The primary failures with the PPC included Bluetooth instability between the PPC and Bluetooth
serial adapter, insufficient operating memory and in a few cases, random failures with the
custom encryption software.
Since the PPC did not have any ports that would allow for a hard wired connection to the
mGate reader it was necessary to use an AIRCable Serial Bluetooth adapter. This device was
unique in that the RS232 cable from the mGate reader was plugged into it and the device
transmitted the output data to the PPC via Bluetooth. The communications between the PPC,
Bluetooth device and mGate reader would sometimes terminate at random, with no
predictability as to when this might occur. In some cases the devices would stay connected for
over 200 hours, while in other cases they would disassociate after a few tag transactions or in
some cases not connect at all. Since there was no way to log each type of failure only an
estimate could be made. It is estimated that the Bluetooth failures were at least half of the
total failures of the device.
When the system was originally designed it was not built to power any type of communication
device. This was because the original plan was to test the tag reader and its components and
Figure 4 Deployed tag reader along NYS Route
4 in North Greenbush

Task 31 – Electronic Toll and Traffic Management Project Final Report 8
see how well it would function when powered by a solar panel. The team then decided to push
the envelope and see how it would function in a 24/7 environment while providing power to
the PPC and Bluetooth adapter. The system was able to power all the components for much of
the study even during cloudy days. The period from late November until mid January in the
Capital District Region of New York State proved to be the most problematic for the solar
components. This was because it was the time leading to and following the shortest day of the
year. Moreover, many of the days had no sunshine. Because of the weather the solar panel
could not provide enough power to run the device and charge the batteries. It should be noted
once again that the system was not designed to power the PPC and Bluetooth device, just the
mGate reader. This extra power consumption was the main reason for the power failures.
On average the devices would operate for 38 hours before shutting down, again in most cases
this was due to the PPC reliability.
Figure 5 Average number of failures per device per month
The bar chart in Figure 5 shows how the average number of failures per month relates to the
various components within the system. It is obvious that the PPC related failures were most
prevalent, comprising approximately 50% of the failures each month. The chart also indicates
that the most failures occurred in July 2007 when the initial testing was taking place. This was
because the team was still learning how to optimally deploy the devices. Additionally, the chart
indicates that in December and January there were a large number of solar panel and battery
failures; these failures were related to the lack of sunshine to charge the system. The original
intent of the project was to test the mGate reader during favorable weather conditions (not the

Task 31 – Electronic Toll and Traffic Management Project Final Report 9
communication components). When the team had the opportunity to continue testing through
the winter months it was anticipated that the solar components would not perform as well as
they did in the summer and fall. If it were possible to improve the reliability of the PPC and
associated software the number of failures per device would likely be less than five per month.
2.8 Task 29: Assess the Results The Task 29 report focused on assessing the results from the experiment. This task report was
done as part of a combined Task 28 and 29 report because of the overlap between the two
tasks (7). Few projects have been able to study arterial travel times using AVI equipment; tag
readers are rarely deployed this way. This project not only provided an opportunity to study the
AVI system performance, but it allowed these findings to be compared with an earlier project at
the same location where an AVL experiment was performed. The task report provides a
detailed travel time analysis for both the North Greenbush and Syracuse, NY deployments.
In studying the data it was found that estimating reader to reader travel times for arterials is
not be as easy as for freeways. On arterials people may pass one reader then stop at an
intermediate point (i.e. home, work, store, etc) before continuing on past another reader. On
freeways, the stopping opportunities do not exist, so the travel times are more uniform unless
incidents occur; so analysis and prediction/estimation is relatively straightforward; but not so
for arterials.
Incident detection and characterization will also be more difficult with AVI systems. Since with
AVI systems the whole trajectory will not be known, it will be difficult to distinguish between
vehicles that are delayed due to incidents and those that have simply made roadside stops. It
will also be difficult to tell exactly where the incident has occurred (if one has) because the only
information available will be travel times between AVI readers. In contrast, with an AVL system,
it will be easy to spot vehicles that have made a roadside stop and distinguish them from ones
involved in or affected by incidents. It will also be easier to see where the incident has occurred
because it will be possible to see the AVL vehicles that have been stopped by the incident.
Additionally, the trends in the percentiles for the reader to reader travel time density functions
suggest the following:
The 10th percentile values are likely to be very consistent as will the 50th percentile
values; but the 95th percentile values will vary dramatically;
The mean will vary widely since it is affected by, and is very sensitive to, the long travel
times;
Reader to reader performance metrics predicated on ratios to the mean will be difficult
to use;

Task 31 – Electronic Toll and Traffic Management Project Final Report 10
It will be better to use metrics predicated on the 50th percentile or ratios to the free
flow travel times, or travel times deduced from the speed limits; such as the ratio of the
95th percentile travel time to the free flow travel time.
Not all of the movements will have the same trends and relationships. Some reader to reader
pairs will show very stable values, as with right turns where the impacts of signal timing or
congestion is likely to be low.
It may be that the 95th percentile will not be the best metric to use as an indicator of travel time
reliability. A lower percentile, like the 10th or 50th, might be better. All of the percentiles are
affected when there are incidents; but the lower percentiles seem to be affected only when
there are incidents, whereas the 95th percentile has a lot of volatility, caused by other factors.
While the 95th percentile value does vary, in many cases, the overall trends can still be used to
provide guidance to travelers about what travel times to expect. Based on the plots of the
travel times, one can make statements like: half of the travelers for this reader to reader pair
need X minutes, so allowing that much time will be fine if you are someone who drives faster
than about half of the population; but if you want to be sure you are not late, you should allow
Y minutes. You are likely to be quite early, but you will not be late.
2.9 Task 29a: Data Quality Assessment
Following lessons learned in the Advanced Traveler Information (ATIS) project, the team added
Task 29a to the project. This task dealt with the process of cleaning and validating the data
collected during the ETTM project. The data that was assessed came from the six wireless solar
powered E‐ZPass tag readers when they were deployed as part of the testing identified in the
previous sections of this report (8).
Before proceeding with any data analysis it was necessary to study the data and ensure the
records were ‘clean’ and valid. For this project the utilization of the data is to estimate both the
travel times between pairs of readers and the efficiency of the readers. The data cleaning was
performed for both the North Greenbush and Syracuse deployments.
In this task report the data structure was identified. During the cleaning process redundant and
irrelevant fields were removed. Then the data was checked for formatting errors, none were
found. Test tag reads, duplicate tag reads and multiple records were then removed.
After eliminating errors in the data, 99.1% and 98.7% of the records for North Greenbush and
Syracuse respectively were found to be valid and reliable data points.

Task 31 – Electronic Toll and Traffic Management Project Final Report 11
2.10 Task 30: Investigate Data Fusion Methodologies
The objective of the research in Task 30 was to propose a data fusion methodology that
provides more accurate and reliable link travel times to support the implementation of real‐
time transportation management strategies (9). This report focused on transportation
management for traffic congestion of passenger vehicles on road infrastructure, which included
highways, arterials and local roads. The indicator of performance used was link travel times,
where a link is defined as the length between consecutive ramps on a highway, and the length
between consecutive signalized or major intersections on an arterial or local road. The
technologies used include fixed, mobile and portable sensors.
Sample data were collected from a middle‐size urban metropolitan network; the Syracuse, NY
area during the NYS Fair. Data from passenger vehicles were collected from five different types
of sensors: inductive loops, pneumatic tubes, passive array acoustics, RFID tag readers and
probe vehicles with GPS technology. Traffic data was collected under normal conditions, during
a special event, and through a work zone.
The Task 30 report provides a description of the different types of sensors, an explanation of
the characteristics of each of the traffic variables, the methodology developed to perform the
Multi‐Sensor Data Fusion and the methodology developed for the estimation and prediction of
link travel times.
In addition to offering a data fusion methodology this report made the following conclusions:
Data obtained from different sensors not only provide different measures of traffic, but
differ on their reliability, accuracy, completeness, penetration, recording time intervals
and spatial configuration. Despite these differences they all provide data on the traffic
conditions, each of them with their own strengths and weaknesses. These data sources
used in concert are complementary and provide a more complete picture of the
network traffic conditions than any individual sensor.
Traffic variables describe the characteristics of traffic flow. Traffic variables have
different characteristics depending on the type of road, time of day, and day of the
week. Besides the characteristics of each type of road such as capacity, speed limits, and
presence of signals and intersections, other factors influence the behavior of the traffic
flow. Commuting times; weather conditions such as rain, fog, and snow; construction
zones; special events; and incidents are some of the factors that have an effect on the
traffic flow characteristics.
No data collected from a single source can be assumed to be ground truth. Travel times
from volume and speed have less variability and register measurements for every time
period, but sometimes fail to detect peaks and tend to be underestimates. Travel times

Task 31 – Electronic Toll and Traffic Management Project Final Report 12
from RFID tag readers have several missing values and have greater variability, and tend
to overestimate the measurements.
The data fusion methodology showed flexibility to work with data sources of different
reliability and with different variability. The proposed fusion technique demonstrates its
complexity to represent successful changes in traffic patterns; and recognizing incidents
and estimating their magnitude reasonably well.
This task began shortly after the commencement of the project in 2005 and finished in
December of 2010.
3 Findings and Conclusions This project which involved designing, building and testing prototype wireless, solar powered E‐
ZPass tag readers was a success. This type of device is of value to state agencies that are in
need of monitoring travel times at locations where traditional practices are not feasible. This
technology will provide a great data source for arterials, work zones and planned special
events. However, it is important to note that in order for this technology to work it is necessary
to have a high percentage of E‐ZPass toll tag transponders deployed in the traffic stream.
Currently, there are fourteen states that use E‐ZPass technology, they can be seen in Figure 6.
In conclusion, these wireless, solar powered
tag readers do work. They function well under
a wide variety of environmental conditions
and capture passing tag equipped vehicles. A
field hardened device would make the system
more reliable, and a larger solar panel would
ensure that the system continues to function
on winter days when there is little sun and
cloud cover; but those are design
improvement details. The technology is sound,
functional, and useful.
Moreover, the data from the detectors is very useful. The data can estimate travel times,
identify incidents, monitor travel time reliability, etc. The data are not as valuable as that
provided by AVL equipped vehicles, where the entire vehicle trajectories can be observed.
However, the AVI systems are better than point detectors where the status of the network can
only be observed at the instrumented locations, and travel times are difficult if not impossible
to estimate.
Figure 6 States which use E‐ZPass technology (purple)

Task 31 – Electronic Toll and Traffic Management Project Final Report 13
3.1 Task 31b: Prepare the Evaluation Report This task was conducted by researchers at Polytechnic Institute of New York University (10).
The evaluation team monitored progress with the project since it began in August 2005.
Following the data collection and the data analysis for the project report was drafted to
evaluate the processes used during the project. The report evaluates the project as a whole and
discusses issues such as the contracting process, the team partnerships, project management
and the business case for a wireless, solar powered tag reader.

Task 31 – Electronic Toll and Traffic Management Project Final Report 14
4 References (1) E. Lee and Wojtowicz, J. Task 22: Preliminary Design of the Experiments for the ETTM
Device. Technical Report 05‐06. Center for Infrastructure and Transportation Studies,
Department of Civil and Environmental Engineering, Rensselaer Polytechnic Institute,
August 2005.
(2) Wojtowicz, J. Task 23: Create the Wireless, Solar Powered E‐ZPass Tag Reader
Workshop. Technical Report 06‐04. Center for Infrastructure and Transportation
Studies, Department of Civil and Environmental Engineering, Rensselaer Polytechnic
Institute, September 2005.
(3) E. Lee and Wojtowicz, J. Task 24: Test and Enhance the New Tag Reader. Technical
Report 07‐02. Center for Infrastructure and Transportation Studies, Department of Civil
and Environmental Engineering, Rensselaer Polytechnic Institute, August 2007.
(4) Wojtowicz, J. Task 25: Demonstration: Fabricate Five Additional Tag Readers – Meeting
Minutes. Technical Report 07‐01. Center for Infrastructure and Transportation Studies,
Department of Civil and Environmental Engineering, Rensselaer Polytechnic Institute,
January 2007.
(5) Wojtowicz, J. Task 26: Finalize the Field Experiment Plan. Technical Report 07‐06.
Center for Infrastructure and Transportation Studies, Department of Civil and
Environmental Engineering, Rensselaer Polytechnic Institute, June 2007.
(6) Wojtowicz, J. Task 27: Prepare the Experiment. Technical Report 08‐04. Center for
Infrastructure and Transportation Studies, Department of Civil and Environmental
Engineering, Rensselaer Polytechnic Institute, October 2008.
(7) Wojtowicz, J., Wallace, W., Murrugarra, R., List, G., Isukapati, I. and Demers, A. Tasks
28 & 29: Conduct the Experiments and Assess the Results. Technical Report 10‐07.
Center for Infrastructure, Transportation and the Environment, Department of Civil and
Environmental Engineering, Rensselaer Polytechnic Institute, November 2010.
(8) Murrugarra, R., Wallace, W. and Wojtowicz, J. Task 29a: Data Quality Assessment.
Technical Report 08‐07. Center for Infrastructure and Transportation Studies,
Department of Civil and Environmental Engineering, Rensselaer Polytechnic Institute,
November 2008.
(9) Murrugarra, R., Wallace, W. and Wojtowicz, J. Task 30: Data Fusion Methodology.
Technical Report 10‐06. Center for Infrastructure, Transportation and the Environment,
Department of Civil and Environmental Engineering, Rensselaer Polytechnic Institute,
November 2010.
(10) Falcocchio, J. and Patel, R. Task 31b: Electronic Toll and Traffic Management Project
Evaluation Report. Urban ITS Center at Polytechnic Institute of New York University.
December 2009.