Embed Size (px)
Citation preview

S1
Electronic Supplementary Information (ESI)
A Ratiometric Fluorescent Probe for Detecting Hypochlorite
in Endoplasmic ReticulumJi-Ting Hou,‡ac Hyeong Seok Kim,‡d Chong Duan,‡b Myung Sun Ji,d Shan Wang,*ac Lintao Zeng,*b Wen Xiu Ren*ef Jong Seung Kim,*d
a Hubei Collaboration Innovation Center for Biomass Conversion and Utilization, School of Chemistry and Materials Science, Hubei Engineering University, Xiaogan 432000, PR China. E-mail: [email protected]. (S. Wang)b School of Chemistry and Chemical Engineering, Tianjin University of Technology, Tianjin 300384, PR China. E-mail: [email protected]. (L. Zeng)c College of Chemistry and Chemical Engineering, Xinyang Normal University, Xinyang 464000, PR China. d Department of Chemistry, Korea University, Seoul 02841, Korea. E-mail: [email protected] (J. S. Kim)e Department of Radiology, the Affiliated Hospital of Southwest Medical University, Luzhou 646000, P. R. China. E-mail: [email protected] Nuclear Medicine and Molecular Imaging Key Laboratory of Sichuan Province, Luzhou, 646000, P. R. China.
Contents Experimental section S2-5
Figure S1 S6 Figure S2 S6 Figure S3 S7 Figure S4 S7 Figure S5 S8 Figure S6 S8
Figure S7 S9Figure S8 S9NMR and MS copies of various compounds S10 -13
Electronic Supplementary Material (ESI) for ChemComm.This journal is © The Royal Society of Chemistry 2019

S2
Experimental Section General remarks for experimental 1H NMR, 13C NMR spectra were measured on a Bruker Avance 400 MHz spectrometer and a 600 MHz NMR spectrometer (JEOL ECZ600R/S3) equipped with a 14.09 T superconducting magnet and a 5.0 mm 600MHz broadband Z-gradient high resolution ROYAL probe (JEOL RESONANCE Inc., Japan). Proton Chemical shifts of NMR spectra were given in ppm relative to internals reference TMS (1H, 0.00 ppm). Mass spectra were measured on a HP-1100 LC-MS spectrometer. UV-vis spectra were recorded on Hitachi UV-3310 spectrometer. Fluorescence spectra were recorded on a Hitachi FL-4500 fluorimeter. Confocal microscopy fluorescence images were acquired on a Nikon A1 laser-scanning confocal microscope with ×100 objective lens. The pH values were determined by a PHS-3C pH meter, which was purchased from the Shanghai Yoke Instrument Co., Ltd. The solvents used for UV-vis and fluorescence measurements were of HPLC grade. Unless otherwise noted, materials were obtained from commercial suppliers and were used without further purification. All the solvents were dried according to the standard methods prior to use. All of the solvents were either HPLC or spectroscopic grade in the optical spectroscopic studies.
Fluorescence analysis.Stock solution of the probe (1 mM) was prepared in HPLC grade DMF. Stock solutions of analytes (5 mM) were prepared in twice-distilled water. For spectral measurements, the probe was diluted to 10 µM with 10 mM PBS solution containing 50% DMF. 2.0 mL probe solution was placed in a quartz cell of 1 cm optical path length each time. All spectroscopic experiments were carried out at room temperature.
Cytotoxicity assayThe cytotoxicity of ER-ClO in HeLa cells was determined by using the Cell Counting Kit-8 (CCK-8, a commercially available cell viability dye). HeLa cells were seeded in a 96-well plate with a density of 5000 cells per well (Corning) and incubated at 37 °C in a humidified incubator with 5% CO2 and 95% air. After cell attachment for 24 h, the plate was then washed with 100 μL/well PBS, and these cells were incubated with various concentrations of ER-ClO (1.25, 2.5, 5, 7.5, 10 and 12.5 μM) for 24 h at the same condition. After that, the cells were washed with serum-free DMEM once, and then 100 μL serum-free DMEM containing 10% CCK-8 was added to each well and incubated for 1 h. The absorbance was measured at 450 nm on a plate reader. Cell viability rate was calculated according to the equation:
0
0
Cell viability rate 100%S
A AA A
Where A is the absorbance of the experimental group, AS is the absorbance of the control group (DMSO was used as the control), and A0 is the absorbance of the blank group (no cells).
Imaging of cells. Cells (Perking Union Medical College, China) were cultured in Dulbecco’s modified Eagle’s medium (DMEM), supplemented with 10% fetal bovine serum (Invitrogen Corp., Carlsbad, CA) and penicillin (100 units/mL)-streptomycin (100 μg/mL) liquid (Invitrogen Corp., Carlsbad, CA) at 37 °C in a humidified incubator containing 5% CO2 in air. The cells were incubated for 2 days

S3
before dye loading on an uncoated 35 mm diameter glass-bottomed dish (D110100, Matsunami, Japan). Then, the cells were incubated with ER-ClO (10 µM) and DMEM containing 10% FBS at 37 °C for 30 min, then washed twice with PBS, and mounted on the microscope stage. Fluorescence images were captured using a Nikon A1 laser-scanning confocal microscope. For the detection of exogenous ClO− and photostability, HeLa cells were incubated with ER-ClO (10 µM) at 37 °C for 30 min, washed twice with PBS, and then different concentrations of ClO− was added for laser-scanning confocal microscopy measurement. By mediating the yellow channel images (λex = 405 nm, λem = 425–475 nm) with the related red channel image (λex =488 nm, λem = 552–617 nm) at the same area of HeLa cells, the ratiometric fluorescence images for ClO− were determined.
Co-localization imaging of cells. Commercially available mitochondria specific staining dyes (ER-Tracker Red and ER-Tracker Blue-White DPX) was used for co-localization study. Cells were co-incubated with 10 μM ER-ClO (ER-ClO in the presence of ClO−) and 200 nM ER-Tracker at 37 °C for 30 min. and then the set of cells was used for confocal laser-scanning microscopy measurement.

S4
Preparation and Characterization of 1Ethanolamine (1.22 g, 20 mmol) and TEA (10.1 g, 100 mmol) were dissolved in CH2Cl2. Then a solution of p-toluenesulfonyl chloride (9.5 g, 50 mmol) in CH2Cl2 (20 mL) was added slowly over a period of 30 min under vigorous stirring at 0°C. After the addition is completed, the solution was stirred overnight at room temperature, and then the solvent was removed. The resulting oil was purified by silica gel using hexane/CH2Cl2 = 1/4 as eluent, giving 1 as a white solid (6.2 g, 84%).1H NMR (400 MHz, CDCl3): δ 7.79 – 7.72 (m, 2H), 7.73 – 7.66 (m, 2H), 7.36 (d, J = 8.0 Hz, 2H), 7.30 (d, J = 8.0 Hz, 2H), 4.83 (t, J = 6.2 Hz, 1H), 4.05 (t, J = 4.8 Hz, 2H ), 3.28 – 3.19 (m, 2H), 2.46 (s, 3H), 2.43 (s, 3H). ESI-MS: m/z 370.10 [M + H]+: (calcd 370.08).
Preparation and Characterization of 2Compound 1 (3.9 g, 10 mmol) was dissolved in DMF (10 mL), and NaN3 (420 mg, 7.5 mmol) was added. The mixture was stirred until the solution became clear. Water was added and the mixture was extracted with EtOAc, washed with brine and dried with anhydrous Na2SO4. After removal of the solvent under reduced pressure by evaporation, the crude product was purified by silica column chromatography with hexane/ EtOAc = 8/1 as the eluent, giving 2 as a white solid (1.6 g, 66.7%). 1H NMR (600 MHz, CDCl3): δ 7.89 – 7.56 (m, 2H), 7.32 (d, J = 7.9 Hz, 2H), 4.80 (t, J = 6.2 Hz, 1H), 3.40 (t, J = 5.6 Hz, 2H), 3.10 (td, J = 6.4, 5.3 Hz, 2H), 2.42 (s, 3H). ESI-MS: m/z 241.01 [M + H]+: (calcd 241.08).
Preparation and Characterization of 4To a solution of compound 3[1] (255 mg, 1.0 mmol) and 2 (264 mg, 1.1 mmol) in THF/H2O (10 mL/10 mL) was added CuI (380 mg, 2.0 mmol). The mixture was stirred at 50°C for 8 h. After that, THF was removed under reduced pressure and EtOAc was added for extraction. The combined organic phase was washed with brine, and purified by column chromatography over silica gel using hexane/ EtOAc = 1/1 as eluent to afford 4 as a yellow solid (288 mg, 58.1%).1H NMR (400 MHz, CDCl3): 1H NMR (400 MHz, CDCl3) δ 10.08 (s, 1H), 8.23 (s, 1H), 7.70 (d, J = 8.3 Hz, 2H), 7.59 (s, 1H), 7.42 (d, J = 9.0 Hz, 1H), 7.30 (d, J = 8.1 Hz, 2H), 6.76 (dd, J = 9.0, 2.3 Hz, 1H), 6.57 (d, J = 2.2 Hz, 1H), 5.30 (s, 1H), 4.70 (s, 2H), 4.18 (t, J = 6.2 Hz, 2H), 3.63 (q, J = 7.1 Hz, 2H), 3.46 (q, J = 6.2 Hz, 2H), 2.42 (s, 3H), 1.30 (t, J = 7.1 Hz, 3H). 13C NMR (150 MHz, DMSO-d6) δ 187.78, 161.11, 158.70, 154.27, 146.88, 143.49, 143.36, 137.68, 133.43, 130.21, 127.03, 124.19, 114.38, 111.42, 108.65, 97.72, 49.71, 45.84, 45.50, 42.91, 21.48, 12.60. ESI-MS: m/z 496.1639 [M + H]+: (calcd 496.1649).
Preparation and Characterization of ER-ClODiaminomaleonitrile (111 mg, 0.5 mmol) and compound 4 (127 mg, 0.5 mmol) was dissolved in 20 mL of absolute ethanol containing two drops of acetate acid. The mixture was stirred at room temperature for 4 h. After that, the solvent was removed under reduced pressure and the resulted crude product was purified by column chromatography over silica gel using CH2Cl2/ MeOH as eluent to afford a red solid. The solid was further washed with cool CH2Cl2 to afford the product ER-ClO (168 mg, 57.3%).1H NMR (400 MHz, CDCl3): 1H NMR (400 MHz, DMSO-d6) δ 8.80 (s, 1H), 8.22 (s, 1H), 8.04 (s, 1H), 7.91 (s, 2H), 7.81 (t, J = 5.9 Hz, 1H), 7.63 (d, J = 8.2 Hz, 2H), 7.45 (d, J = 9.0 Hz, 1H), 7.37 (d, J = 8.0 Hz, 2H), 6.98 – 6.90 (m, 1H), 6.78 (d, J = 2.2 Hz, 1H), 4.71 (s, 2H), 4.38 (t, J = 6.1 Hz, 2H), 3.62 (q, J = 6.8 Hz, 2H), 3.15 (q, J = 6.0 Hz, 2H), 2.37 (s, 3H), 1.19
S5
(t, J = 7.0 Hz, 3H). 13C NMR (100 MHz, DMSO-d6) δ 161.41, 157.28, 152.80, 149.13, 143.70, 143.31, 142.25, 137.60, 131.41, 130.16, 126.97, 126.46, 124.06, 114.59, 114.12, 111.21, 109.41, 103.95, 97.91, 49.63, 45.66, 45.42, 42.86, 21.42, 12.57. ESI-MS: m/z 586.1985 [M + H]+: (calcd 586.1979).
Reference:1. J.-T. Hou, K.-P. Ko, H. Shi, W. X. Ren, P. Verwilst, S. Koo, J. Y. Lee, S.-G. Chi, J. S.
Kim. ACS Sens., 2017, 2, 1512−1516
S6
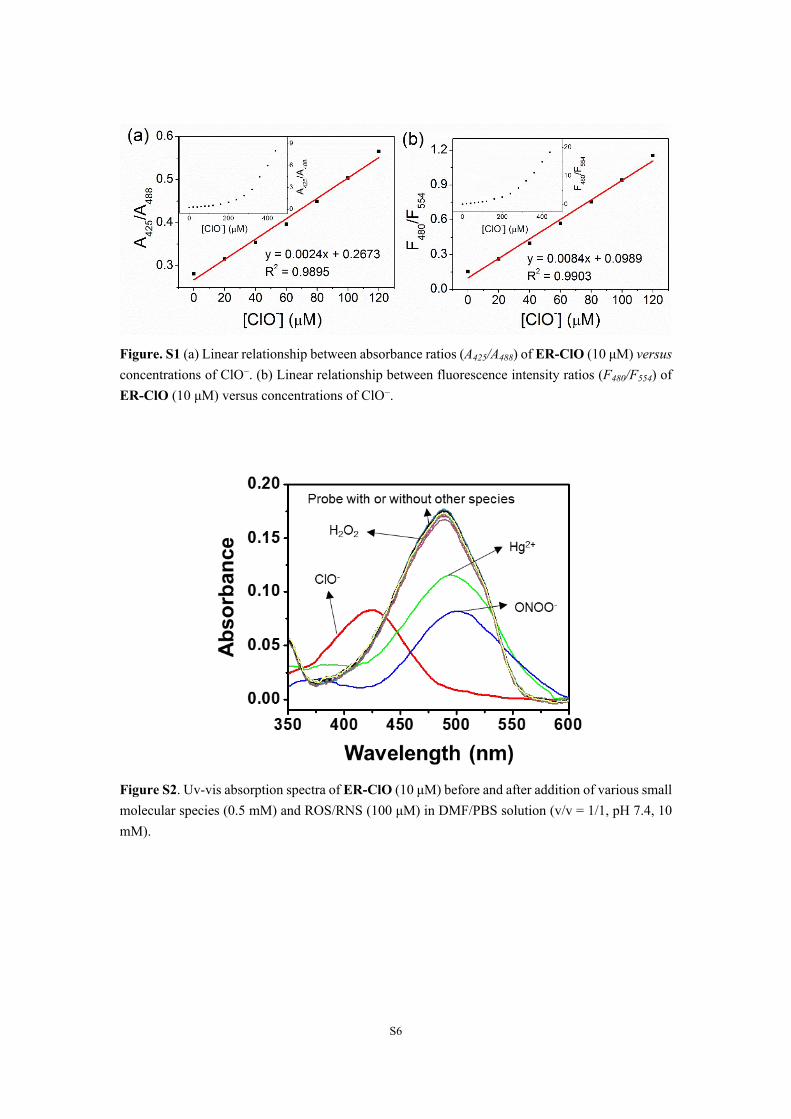
Figure. S1 (a) Linear relationship between absorbance ratios (A425/A488) of ER-ClO (10 μM) versus concentrations of ClO−. (b) Linear relationship between fluorescence intensity ratios (F480/F554) of ER-ClO (10 μM) versus concentrations of ClO−.
Figure S2. Uv-vis absorption spectra of ER-ClO (10 μM) before and after addition of various small molecular species (0.5 mM) and ROS/RNS (100 μM) in DMF/PBS solution (v/v = 1/1, pH 7.4, 10 mM).

S7
Figure S3. Emission spectra of ER-ClO (10 μM) in DMF/PBS solution (v/v = 1/1, pH 7.4, 10 mM) in the presence of various small molecular species (0.5 mM) and ROS/RNS (100 μM). (a) λex = 425 nm, slits: 2.5/2.5 nm; (b) λex = 500 nm, slits: 5/5 nm. Each spectrum was recorded after ER-ClO was incubated with ClO− for 1 min.
Figure S4. (a) Time dependent and (b) pH dependent fluorescence emission ratios (F425/F488) response of ER-ClO (10 μM) to ClO− (0.5 mM) in DMF/PBS solution (v/v = 1/1, pH 7.4, 10 mM). Each spectrum was recorded after ER-ClO was incubated with ClO− for 1 min.

S8
Figure S5. ESI spectra of ER-ClO upon addition of 10 equiv NaClO.
Figure S6 Cytotoxicity of ER-ClO. HeLa cells were incubated with ER-ClO (0–25 μM) for 24 h. Results are mean ± SD, n = 5.
ON O
COOH
NNN
NHSO
O [M+Na]+: 534.1418

S9
Figure S7. Confocal fluorescence images of three cells stained with (a, e, i) ER-ClO (10 μM) in the presence of ClO− (50 μM) (blue channel: λex = 405 nm, λem = 425 – 475 nm) and (b, f, j) 0.5 μM ERTR (red channel: λex = 543 nm, λem = 552 – 637 nm) at 37 °C for 30 min; Overlay image. (d, h, l) Intensity profiles of regions of interest (ROI) across cells. Scale bar: 10 µm. The Pearson’s coefficients were measured to be 0.88, 0.87, and 0.81, respectively.
Figure S8. Confocal fluorescence images of L929 cells stained with 0.5 μM LB (a) or MB (e) (blue channel: λex = 403 nm, λem = 425–475 nm) and (b, f) 10 μM ER-ClO (red channel: λex = 488 nm, λem
= 552–637 nm) at 37 °C for 30 min. (c, g) Overlay image. (d, h) Intensity profiles of regions of interest (ROI) across cells. Scale bar: 10 µm.

S10
1H-NMR Spectrum of 1 in CDCl3 (400 MHz):
1H-NMR Spectrum of 2 in CDCl3 (600 MHz):
1H-NMR Spectrum of 4 in CDCl3 (400 MHz):

S11
13C-NMR Spectrum of 4 in DMSO-d6 (150 MHz)
1H-NMR Spectrum of ER-ClO in DMSO-d6 (400 MHz):

S12
13C-NMR Spectrum of ER-ClO in DMSO-d6 (100 MHz):
HRMS spectra of ER-ClO:

S13
ON O
N
CNCN
NH2
NNN
NHSO
O[M+H]+: 586.1979

![Liziê D. T. Prola, Lilian Buriol, Clarissa P. Frizzo ... · 8a, 10a, 11a, and 1.0 mmol for 9a), 2-aminoacetophenone (1.0 mmol), [HMIM][TsO] (1.0 mmol) and TsOH (1.0 mmol). After](https://img.pdfslide.us/doc/110x75/5f6d314f14e48a24b56ae7a6/lizi-d-t-prola-lilian-buriol-clarissa-p-frizzo-8a-10a-11a-and-10.jpg)


![Interception of a Rh(I)-Rh(III) Dinuclear Trihydride ... · CO was bubbled through a solution of [Rh(COD){(R,R)-Ph-BPE}]BF4 (50 mg, 0.062 mmol) in CH2Cl2 (15 mL) under stirring, at](https://img.pdfslide.us/doc/110x75/5f0807fa7e708231d41ffc08/interception-of-a-rhi-rhiii-dinuclear-trihydride-co-was-bubbled-through.jpg)