Embed Size (px)
Citation preview
S1
Electronic Supplementary Information
Polymerization-Induced Self-Assembly (PISA) – Control Over the
Morphology of Nanoparticles for Drug Delivery Applications
Bunyamin Karagoza,b
, Lars Esser a,c
, Hien T. Duong,a Johan S. Basuki
a, Cyrille Boyer*
a, Thomas P.
Davis*c,d
a Australian Centre for NanoMedicine, School of Chemical Engineering, University of New South Wales,
Sydney 2052, Australia
b Istanbul Technical University Department of Chemistry, Maslak 34469 Istanbul-Turkey
c Monash Institute of Pharmaceutical Sciences, Monash University, Parkville, VIC 3052, Australia;
d
Chemistry Department, University of Warwick, Coventry, ULCV4 7AL.
*Corresponding authors: [email protected]; [email protected]
EXPERIMENTAL SECTION
Materials
Styrene (ST) was deinhibited by passing through a column of basic alumina. Oligo(ethylene glycol)
methacrylate (OEGMA) (Mn = 300 g mol-1
) and 3-vinyl benzaldehyde were used as recieved. 2,2-
Azobis(isobutyronitrile) (AIBN, Fluka, 98%) was purified by recrystallization from methanol. 4-
Cyanopentanoic acid dithiobenzoate (CPADB) was prepared according to a procedure described elsewhere.1
All the other reagents were used as purchased unless otherwise specified.
Instrumentation
1H-NMR spectra were recorded using a Bruker 300MHz spectrometer. All chemical shifts are reported in
ppm (δ) relative to tetramethylsilane, referenced to the chemical shifts of residual solvent resonances. The
molecular weight and polydispersity of the prepared polymers were measured by SEC. The eluent was
DMAc (that contained 0.03% w/v LiBr and 0.05% w/v 2,6-dibutyl-4-methylphenol (BHT)) at 50 oC (flow
rate of 1mL min−1
) with a Shimadzu modular system comprising an SIL-10AD auto-injector, a Polymer
Electronic Supplementary Material (ESI) for Polymer ChemistryThis journal is © The Royal Society of Chemistry 2013
S2
Laboratories 5.0μm bead-size guard column (50×7.5mm2) followed by four linear PL (Styragel) columns
(105, 10
4, 10
3 , and 500 Å) and an RID-10A differential refractive-index detector.
The sizes and morphologies of the block polymers were observed using a transmission electron microscopy
JEOL1400 TEM at an accelerating voltage of 100 kV. The solution of the block polymer in dispersion
medium was directly taken and diluted with methanol (2 mg mL−1
) and deposited onto copper grid
(ProSciTech). Uranyl acetate staining was applied.
DLS measurements were performed using a Malvern Zetasizer Nano Series running DTS software and using
a 4 mW He−Ne laser operating at a wavelength of 633 nm and an avalanche photodiode (APD) detector.
The scattered light was detected at an angle of 173°.
Attenuated Total Reflection-Fourier Transform Infrared Spectroscopy (ATR-FTIR) measurements were
performed using a Bruker IFS66\S Fourier transform spectrometer by averaging 128 scans with a resolution
of 4 cm-1
.
Synthesis of poly(oligo (ethyleneglycol) methacrylate) (POEGMA) macro-CTA via RAFT
polymerızatıon
POEGMA was prepared by RAFT polymerization in the presence of 4-cyanopentanoic acid dithiobenzoate
(CPADB) as RAFT agent. For this purpose, OEGMA (12 g, 4x10⁻²
mol), CPADB (0.224 g, 8x10⁻⁴
mol),
AIBN (1.64x10⁻²
g, 1x10⁻⁴
mol) and 50 mL acetonitrile were mixed in a 100 mL round bottom flask and
sealed with rubber septum. The reaction mixture was immersed into an ice-bath and saturated with nitrogen
by continuous gas flow for 30 minutes. Polymerization reaction was carried out for 8 h at 70 oC. Then the
polymerization reaction was terminated by rapid cooling and the resulting polymer was recovered by
precipitation in an 50 mL diethyl ether and petroleum spirit (boiling range of 40-60oC) mixture (1:1, v/v).
Dried POEGMA macro-CTA’s molecular weight was determined by size exclusion chromatography (SEC).
MnSEC (DMAc as mobile solvent and PST standards) of 9500 g mol-1
, PDI= 1.09 and the theoritical number
average molecular weight (Mn, NMR) was close to 11,100 g mol-1
from the conversion which was calculated
from 1H-NMR by comparing the vinyl peaks (6.05 and 5.5 ppm) to that of aliphatic proton peaks (0.93 and
0.74 ppm). The number of repeating units was also calculated from 1H-NMR of the purified polymer sample
by comparing RAFT agent’s aromatic protons appears between 7.9-7.4 ppm to that of methylene protons
adjacent to ester linkage at 4.1 ppm and was found to be 36. Resulting POEGMA was used as macro-CTA
for further block copolymer synthesis with styrene or styrene-vinyl benzaldehyde.
Polymerization kinetics study of OEGMA was done using the following procedure: OEGMA (6 g, 2x10⁻²
mol), CPADB (0.112 g, 4x10⁻⁴
mol) and AIBN (8.2x10⁻³
g, 5x10⁻⁵
mol) were dissolved in 25 mL
acetonitrile. The clear reaction mixture was then equally (5 mL each) divided into 6 vials, sealed with rubber
septum and put into an ice-bath under continuous nitrogen flow for 30 minutes. The polymerization reaction
Electronic Supplementary Material (ESI) for Polymer ChemistryThis journal is © The Royal Society of Chemistry 2013
S3
was started by immersing the flasks into an pre-heated oil bath at 70 oC. Then each reaction flask was taken
over 2 h time intervals up to 12 h and rapidly cooled in an ice-bath to terminate the polymerization.
Conversion of the monomer during the polymerization was followed by 1H-NMR spectrum of the reaction
solutions. The resulting polymers were purified by precipitating three times in 50 mL diethyl ether and
petroleum spirit mixture (1:1, v/v) and dried under vacuum at room temperature for 24 h. Obtained results
are collected in Table-1.
Preparation of core functional POEGMA-b-P(ST-co-VBA) amphiphilic block copolymer via RAFT
polymerization
Core-functional POEGMA-b-P(ST-co-VBA) block copolymer with various morphologies were synthesized
in methanol by RAFT dispersion polymerization with a molar feed ratio of ST : VBA: POEGMA : AIBN =
4750:250:1:0.5. For this purpose, POEGMA as a macro-CTA (0.222 g, 2.00 x 10⁻⁵
mol), styrene (9.89 g,
9.50 x 10⁻²
mol), VBA (0.661 g, 5.00 x 10⁻³
mol) as a functional monomer and azobisisobutyronitrile
(AIBN, 1.64 x 10⁻³
g, 1.00 x 10⁻⁵
mol) were dissolved in 13.6 mL methanol (total monomer weight = total
solvent (MeOH) weight). The reaction mixture was divided equally into eight vials to study the kinetics of
the reaction. Each vial was sealed carefully and gently purged with nitrogen for 20 minutes. The reaction
mixtures were then immersed in an oil bath at 70ºC, and vials were taken out at specific time points, 4, 8, 12,
18, 24 and 36 hours. The polymerization was terminated by placing the reaction mixture into an ice-bath for
5 minutes and exposure to air. The polymer was purified three times by dialysis in methanol using a dialysis
tube with a molecular weight cut off of 12,000 – 14,000. Morphologies and number average diameter of the
block copolymer were investigated directly from the block copolymerization dispersion solution by diluted
samples with methanol (2 mg/mL). Resulting 36 h sample was used for crosslinking study.
Preparation of core crosslinked POEGMA-b-P(ST-co-VBA) amphiphilic block copolymer
Core crosslinking of the block copolymer was achieved by reaction of aldehyde groups in the core with 1,3-
diaminopropane in methanol at room temperature. For this purpose, 2.3 x 10⁻⁴
mol 1,3-diaminopropane was
reacted to 2.3 x 10⁻⁵
mol of aldehyde group containing (36 h sample) amphiphilic polymer dispersion in
methanol and the reaction mixture was stirred for 48 h. Crosslinking was tested by dissolving a few droplets
in THF, resulting solution did not lose its cloudiness. And the obtained crosslinked sample was
characterized by FT-IR, DLS and TEM measurements.
Doxorubicin loading
In the presence of triethylamine (50 μL), 20 mg of POEGMA-b-P(ST-co-VBA) and 2 mg of DOX.HCl
were dissolved in DMSO (2 mL) and the mixture stirred at room temperature for 1 h. The mixture was first
Electronic Supplementary Material (ESI) for Polymer ChemistryThis journal is © The Royal Society of Chemistry 2013
S4
dialyzed (MWCO 3500 Da) against methanol for 24 h, and then against buffer solution for 48 h to remove
solvent, triethylamine, and free DOX. The solution absorbance at 485 nm was measured on a CARY 300
spectrophotometer (Bruker) to determine the concentration. The amount of encapsulated DOX in
nanoparticles was quantified to be ~ 5.1 wt% using a calibration curve of DOX.HCl in DMSO. The
concentration of the polymers was determined by freeze dried a known volume.
Cell culture
MCF-7 cells were grown in Dulbecco’s Modified Eagle’s Medium: Nutrient Mix F-12 (DMEM)
supplemented with 10% (v/v) Fetal Calf Serum (FCS) in a ventilated tissue culture flask T-75. The cells
were incubated at 37° C in a 5% CO2 humidified atmosphere and passaged every 2-3 days when monolayers
at around 80% confluence were formed. Cell density was determined by counting the number of viable cells
using a trypan blue dye (Sigma-Aldrich) exclusion test. For passaging and plating, cells were detached using
0.05% trypsin-EDTA (Invitrogen), stained using trypan blue dye, and loaded on the haemocytometer. All
the experiments were done in triplicate.
Cell viability
The cytotoxicity of free DOX, dextran nanoparticles, and DOX-loaded nanoparticles was tested in-vitro by a
standard Alamar Blue Assay. The assay is based on the ability of living cells to convert blue redox dye
(resazurin) into bright red resorufin which can be read in a spectrophometric reader. Nonviable cells rapidly
lose metabolic capacity and thus do not generate a colour signal. The intensity of the color is proportional to
the cell viability. The cells were seeded at10,000 cells/well for MCF-7 in 96 well tissue culture plates and
incubated for 24 h. The medium was then replaced with fresh medium containing free DOX, dextran
nanoparticles, and DOX-loaded nanoparticles over an equivalent DOX concentration range of 0.001 – 50
µM. At 72 h post drug/nanoparticle incubation, treatments were removed and fresh media was added (100
µL) followed by the addition of Alamar Blue dye (20 µL) to each well and the cells were incubated for 6 h.
Cell viability was determined as a percentage of untreated control cells, and IC50 values were calculated via
regression analysis using Microsoft Excel.
In-vitro cell uptake by flow cytometry and confocal microscopy
To examine nanoparticle uptake, MCF7 cells were seeded at a density of 2 × 10⁵ cells/well in 6-well tissue
culture plates. The cells were left to grow for 24h in DMEM media containing 10% FBS at 37 oC in 5%
CO2 atmosphere. After 24 h, doxorubicin loaded micelles were added to the wells (concentration of
0.125µM based on DOX) and the cells were incubated for 30 min, 1 h, 6h, or 24 h. Following particle
incubation, cells were rinsed twice with PBS to remove any non-uptaken nanoparticles. Cells were
Electronic Supplementary Material (ESI) for Polymer ChemistryThis journal is © The Royal Society of Chemistry 2013

S5
harvested by trypsinization and resuspended in 500 µl of PBS for flow cytometryanalysis using the
FACScanto flow cytometer (BD Biosciences). Data shown are the mean fluorescent signal for 10,000 cells.
MCF-7 cells that were not treated with nanoparticle solution were used as a control.
Electronic Supplementary Material (ESI) for Polymer ChemistryThis journal is © The Royal Society of Chemistry 2013
S6
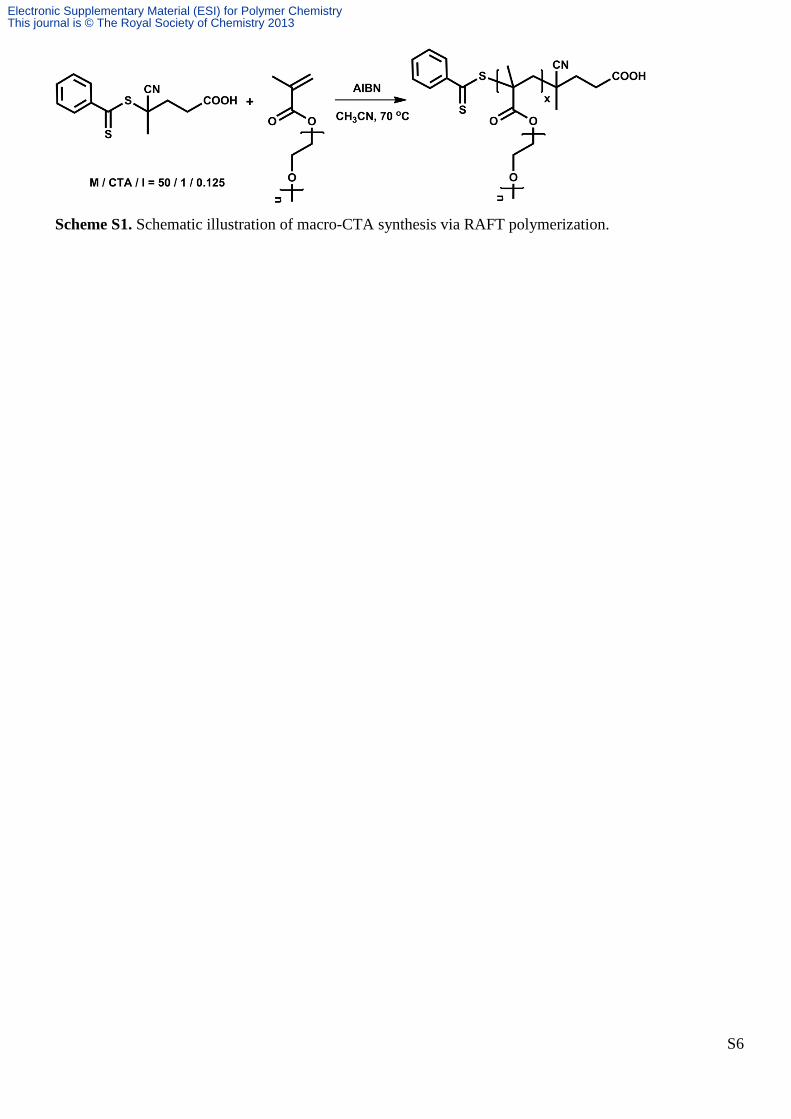
Scheme S1. Schematic illustration of macro-CTA synthesis via RAFT polymerization.
Electronic Supplementary Material (ESI) for Polymer ChemistryThis journal is © The Royal Society of Chemistry 2013
S7
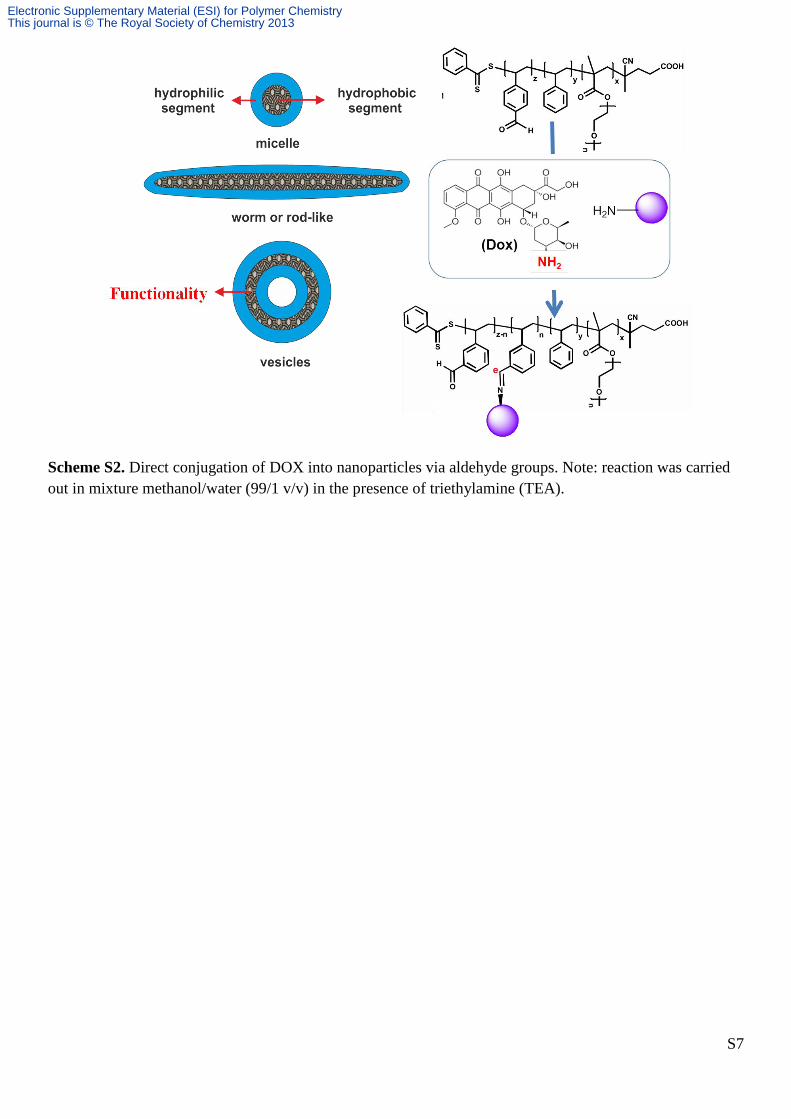
Scheme S2. Direct conjugation of DOX into nanoparticles via aldehyde groups. Note: reaction was carried
out in mixture methanol/water (99/1 v/v) in the presence of triethylamine (TEA).
Electronic Supplementary Material (ESI) for Polymer ChemistryThis journal is © The Royal Society of Chemistry 2013
S8
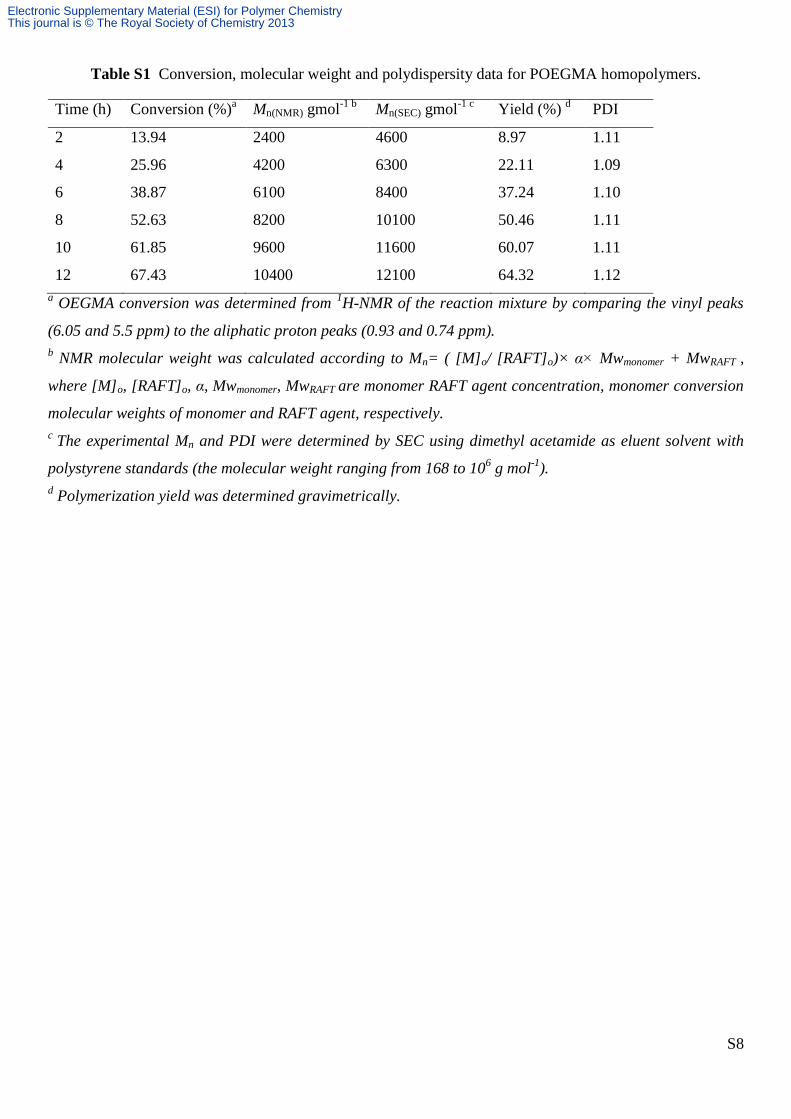
Table S1 Conversion, molecular weight and polydispersity data for POEGMA homopolymers.
Time (h) Conversion (%)a Mn(NMR) gmol
-1 b Mn(SEC) gmol
-1 c Yield (%)
d PDI
2 13.94 2400 4600 8.97 1.11
4 25.96 4200 6300 22.11 1.09
6 38.87 6100 8400 37.24 1.10
8 52.63 8200 10100 50.46 1.11
10 61.85 9600 11600 60.07 1.11
12 67.43 10400 12100 64.32 1.12
a OEGMA conversion was determined from
1H-NMR of the reaction mixture by comparing the vinyl peaks
(6.05 and 5.5 ppm) to the aliphatic proton peaks (0.93 and 0.74 ppm).
b NMR molecular weight was calculated according to Mn= ( [M]o/ [RAFT]o)× α× Mwmonomer + MwRAFT ,
where [M]o, [RAFT]o, α, Mwmonomer, MwRAFT are monomer RAFT agent concentration, monomer conversion
molecular weights of monomer and RAFT agent, respectively.
c The experimental Mn and PDI were determined by SEC using dimethyl acetamide as eluent solvent with
polystyrene standards (the molecular weight ranging from 168 to 106 g mol
-1).
d Polymerization yield was determined gravimetrically.
Electronic Supplementary Material (ESI) for Polymer ChemistryThis journal is © The Royal Society of Chemistry 2013
S9
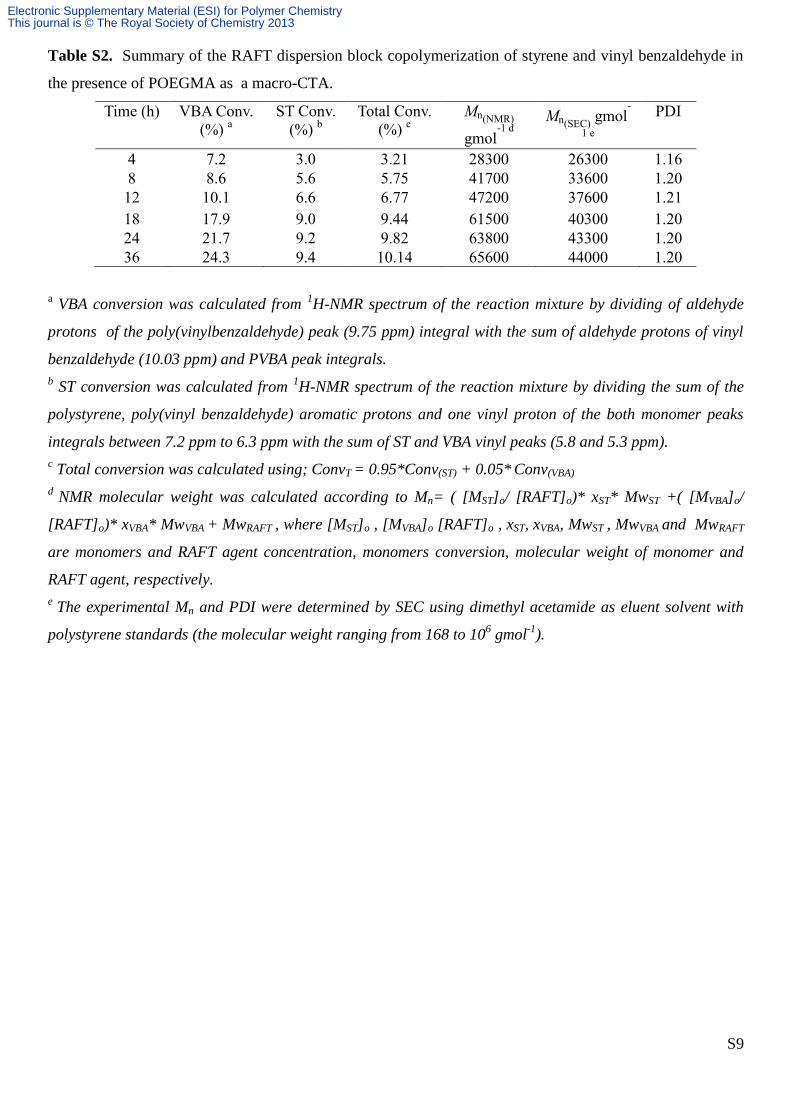
Table S2. Summary of the RAFT dispersion block copolymerization of styrene and vinyl benzaldehyde in
the presence of POEGMA as a macro-CTA.
Time (h) VBA Conv.
(%) a
ST Conv.
(%) b
Total Conv.
(%) c
Mn(NMR)
gmol-1 d
Mn(SEC) gmol
-
1 e
PDI
4 7.2 3.0 3.21 28300 26300 1.16
8 8.6 5.6 5.75 41700 33600 1.20
12 10.1 6.6 6.77 47200 37600 1.21
18 17.9 9.0 9.44 61500 40300 1.20
24 21.7 9.2 9.82 63800 43300 1.20
36 24.3 9.4 10.14 65600 44000 1.20
a VBA conversion was calculated from
1H-NMR spectrum of the reaction mixture by dividing of aldehyde
protons of the poly(vinylbenzaldehyde) peak (9.75 ppm) integral with the sum of aldehyde protons of vinyl
benzaldehyde (10.03 ppm) and PVBA peak integrals.
b ST conversion was calculated from
1H-NMR spectrum of the reaction mixture by dividing the sum of the
polystyrene, poly(vinyl benzaldehyde) aromatic protons and one vinyl proton of the both monomer peaks
integrals between 7.2 ppm to 6.3 ppm with the sum of ST and VBA vinyl peaks (5.8 and 5.3 ppm).
c Total conversion was calculated using; ConvT = 0.95*Conv(ST) + 0.05*
Conv(VBA)
d NMR molecular weight was calculated according to Mn= ( [MST]o/ [RAFT]o)* xST* MwST +( [MVBA]o/
[RAFT]o)* xVBA* MwVBA + MwRAFT , where [MST]o , [MVBA]o [RAFT]o , xST, xVBA, MwST , MwVBA and MwRAFT
are monomers and RAFT agent concentration, monomers conversion, molecular weight of monomer and
RAFT agent, respectively.
e The experimental Mn and PDI were determined by SEC using dimethyl acetamide as eluent solvent with
polystyrene standards (the molecular weight ranging from 168 to 106 gmol
-1).
Electronic Supplementary Material (ESI) for Polymer ChemistryThis journal is © The Royal Society of Chemistry 2013
S10
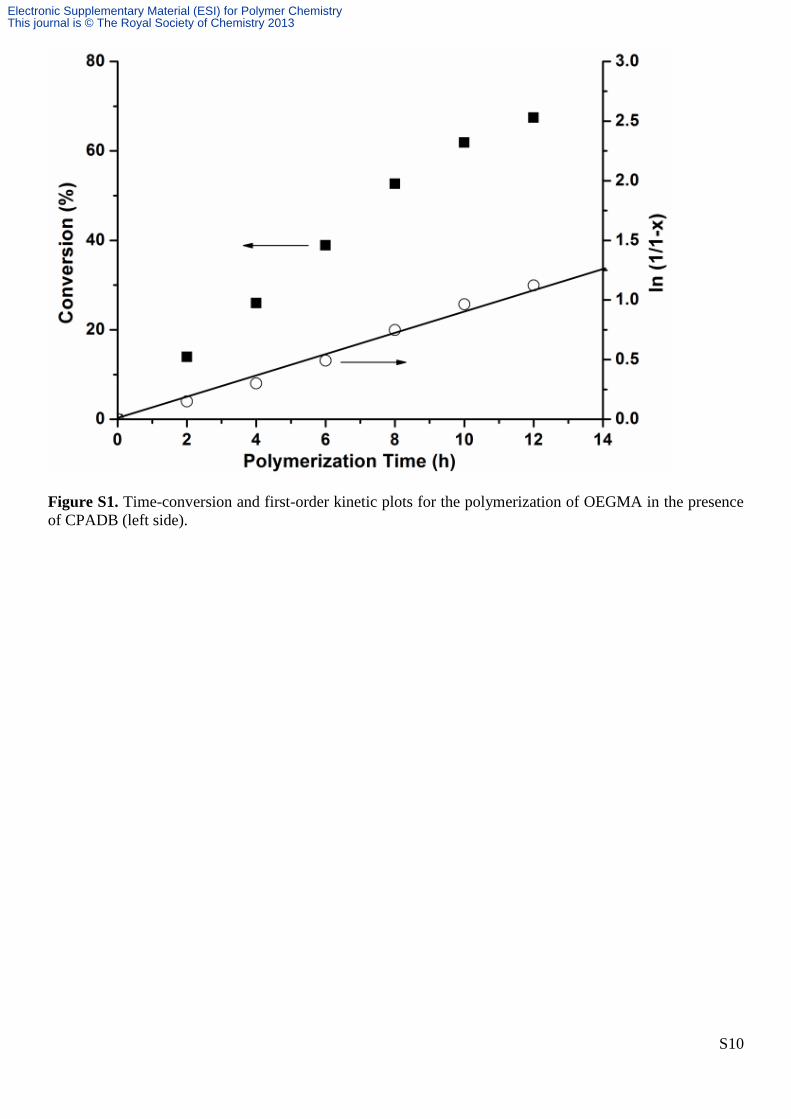
Figure S1. Time-conversion and first-order kinetic plots for the polymerization of OEGMA in the presence
of CPADB (left side).
Electronic Supplementary Material (ESI) for Polymer ChemistryThis journal is © The Royal Society of Chemistry 2013

S11
Figure S2. SEC traces of POEGMA at different polymerization times (right side).
Electronic Supplementary Material (ESI) for Polymer ChemistryThis journal is © The Royal Society of Chemistry 2013

S12
Figure S3. Additional transmission electron microscopy (TEM) pictures of different polymerization
solutions after purification by dialysis against methanol (pictures from another batch). Note: A after 4 h of
polymerization, B after 8 h of polymerization, C after 12 h of polymerization, D after 16 h of
polymerization, E after 24 h of polymerization and F after 36 h of polymerization.
Note: Uranyl acetate staining was applied for sample A, B and C.
Electronic Supplementary Material (ESI) for Polymer ChemistryThis journal is © The Royal Society of Chemistry 2013
S13
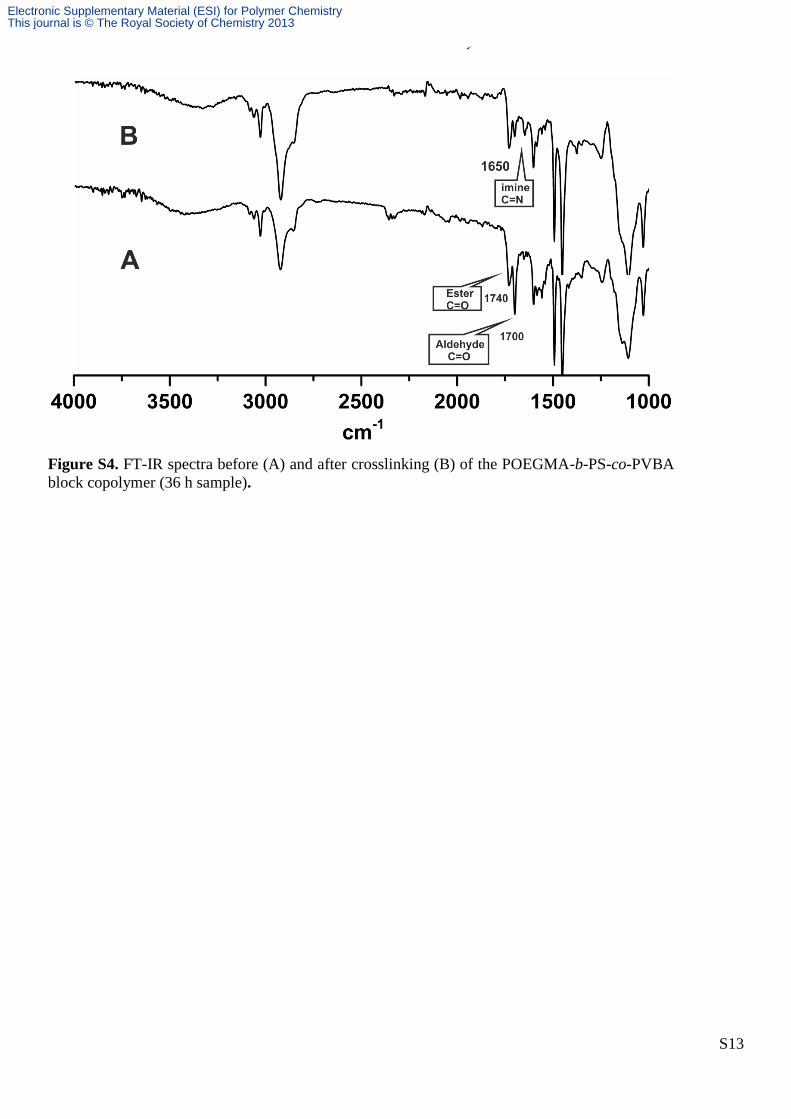
Figure S4. FT-IR spectra before (A) and after crosslinking (B) of the POEGMA-b-PS-co-PVBA
block copolymer (36 h sample).
Electronic Supplementary Material (ESI) for Polymer ChemistryThis journal is © The Royal Society of Chemistry 2013
S14
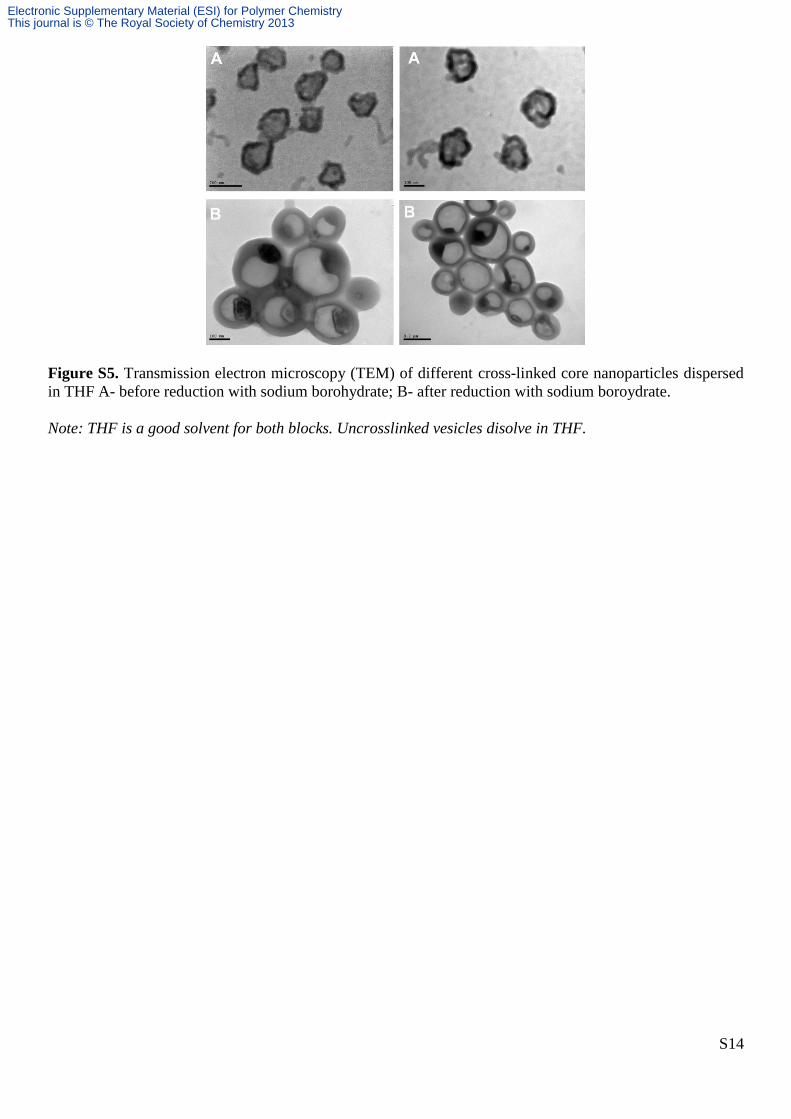
Figure S5. Transmission electron microscopy (TEM) of different cross-linked core nanoparticles dispersed
in THF A- before reduction with sodium borohydrate; B- after reduction with sodium boroydrate.
Note: THF is a good solvent for both blocks. Uncrosslinked vesicles disolve in THF.
Electronic Supplementary Material (ESI) for Polymer ChemistryThis journal is © The Royal Society of Chemistry 2013

S15
Figure S6. Examples of UV-visible absorbance spectra of DOX conjugated micelle, worm, rod-like and
micelle.
Electronic Supplementary Material (ESI) for Polymer ChemistryThis journal is © The Royal Society of Chemistry 2013
S16
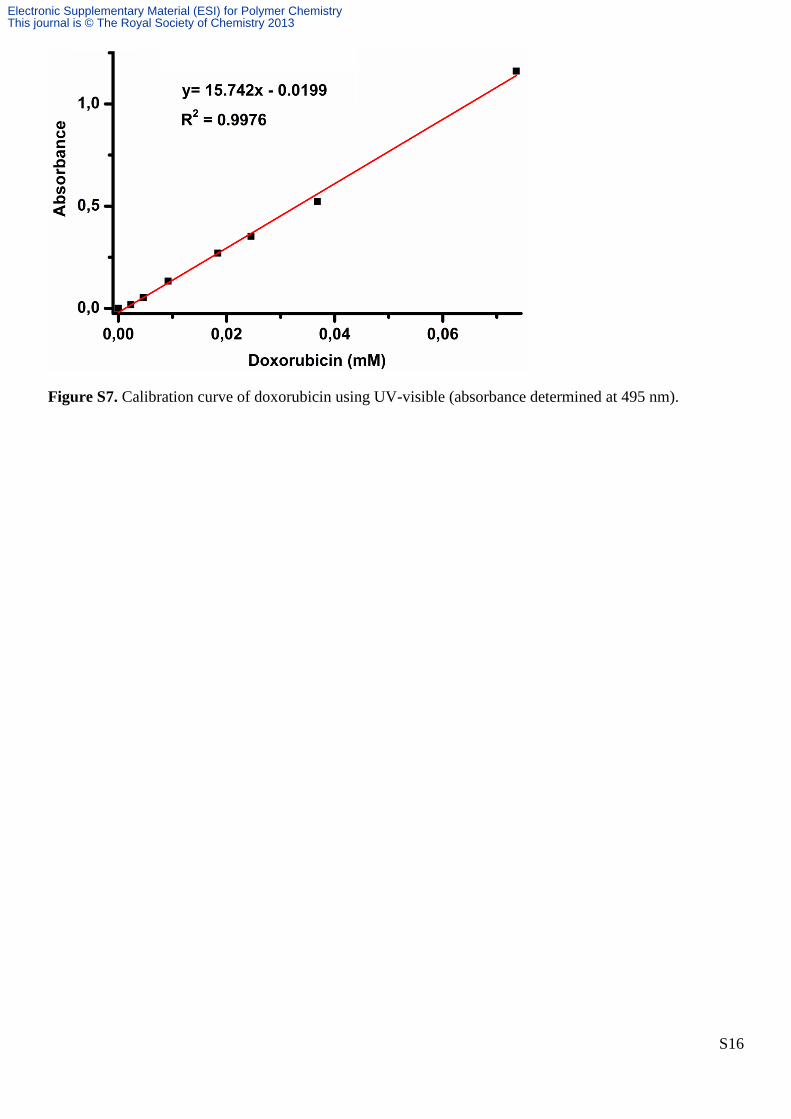
Figure S7. Calibration curve of doxorubicin using UV-visible (absorbance determined at 495 nm).
Electronic Supplementary Material (ESI) for Polymer ChemistryThis journal is © The Royal Society of Chemistry 2013
S17
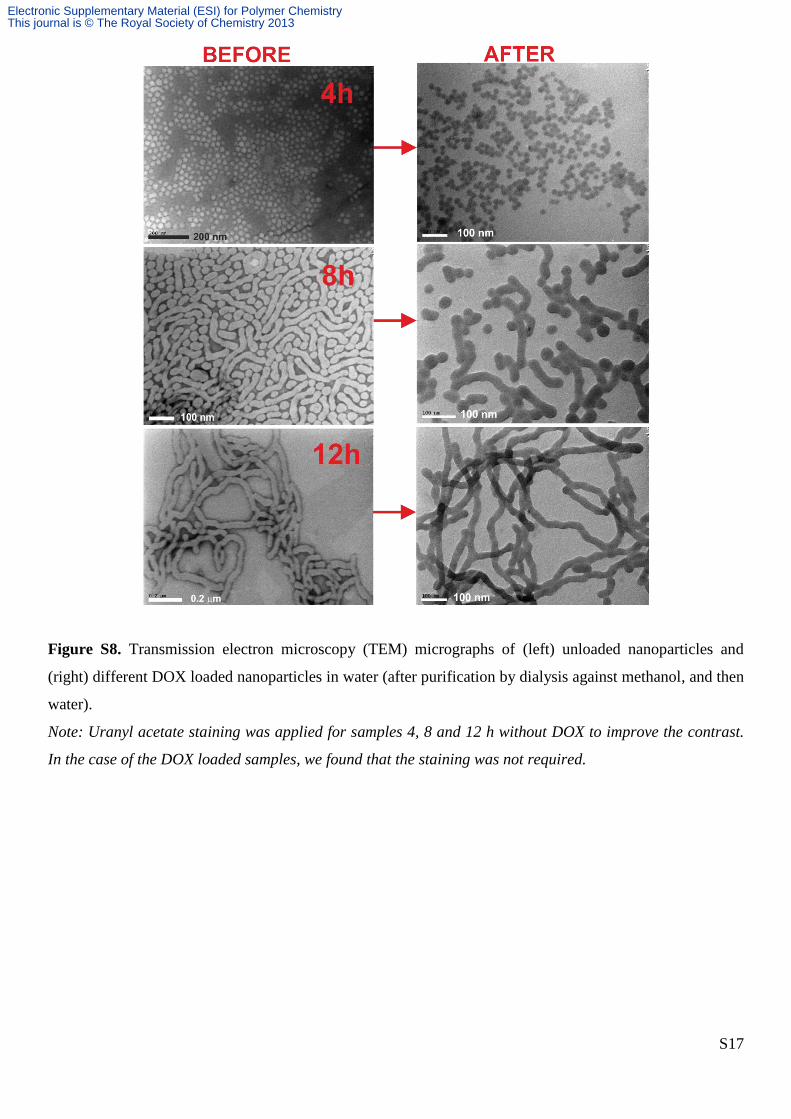
Figure S8. Transmission electron microscopy (TEM) micrographs of (left) unloaded nanoparticles and
(right) different DOX loaded nanoparticles in water (after purification by dialysis against methanol, and then
water).
Note: Uranyl acetate staining was applied for samples 4, 8 and 12 h without DOX to improve the contrast.
In the case of the DOX loaded samples, we found that the staining was not required.
Electronic Supplementary Material (ESI) for Polymer ChemistryThis journal is © The Royal Society of Chemistry 2013

S18
Figure S9. Cell uptake of different nanoparticle morphologies using MCF-7 breast cancer cells using flow
cytometry at different time points (1 h, 5 h and 24 h).
Electronic Supplementary Material (ESI) for Polymer ChemistryThis journal is © The Royal Society of Chemistry 2013
S19
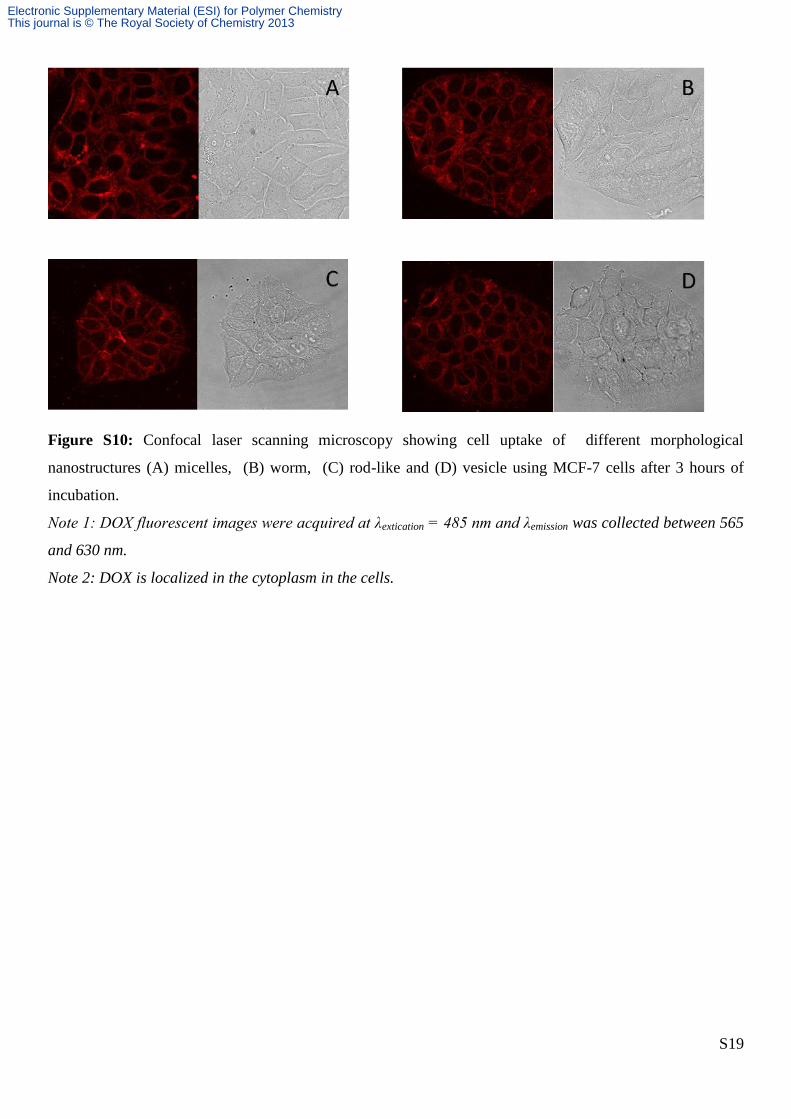
Figure S10: Confocal laser scanning microscopy showing cell uptake of different morphological
nanostructures (A) micelles, (B) worm, (C) rod-like and (D) vesicle using MCF-7 cells after 3 hours of
incubation.
Note 1: DOX fluorescent images were acquired at λextication = 485 nm and λemission was collected between 565
and 630 nm.
Note 2: DOX is localized in the cytoplasm in the cells.
Electronic Supplementary Material (ESI) for Polymer ChemistryThis journal is © The Royal Society of Chemistry 2013
S20
0 20 40 60 80 100
0
20
40
60
80
100 Vesicle
Micelle
Rod-like
Worm
Cum
ula
tive D
OX
rele
ase (
%)
Incubation Time (h)
0 20 40 60 80 100
0
20
40
60
80
100 Vesicle
Micelle
Rod-like
Worm
Cu
mu
lative
DO
X r
ele
ase
(%
)
Incubation Time (h)
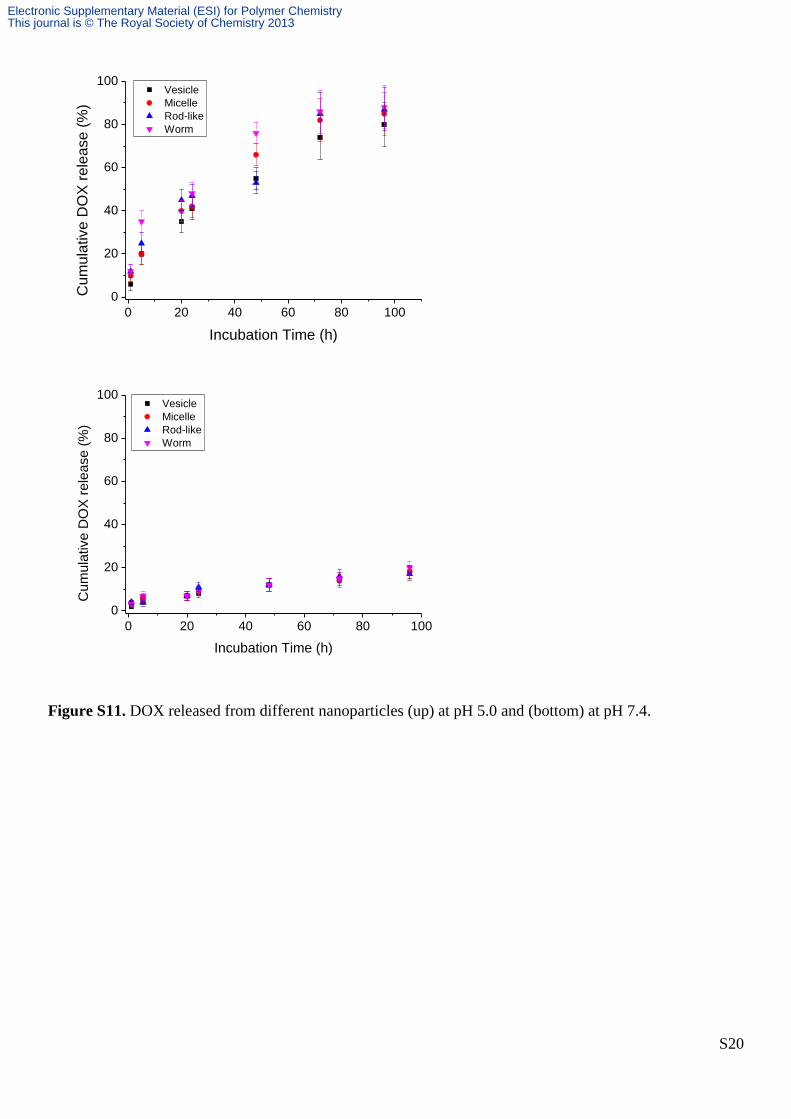
Figure S11. DOX released from different nanoparticles (up) at pH 5.0 and (bottom) at pH 7.4.
Electronic Supplementary Material (ESI) for Polymer ChemistryThis journal is © The Royal Society of Chemistry 2013

S21
Additional References:
1- Y. Mitsukami, M. S. Donovan, A. B. Lowe, C. L. McCormick, Macromolecules, 2001, 34, 2248
Electronic Supplementary Material (ESI) for Polymer ChemistryThis journal is © The Royal Society of Chemistry 2013