Embed Size (px)
Citation preview

Electronic Supplementary Information
for
Synthesis, structure, photophysical, electrochemical properties and
antibacterial activity of brominated BODIPYs
Dijo Prasannana, Darpan Raghavb, Subramaniam Sujathaa, Haritha Hareendrakrishna kumara, Krishnan Rathinasamyb*and Chellaiah Arunkumara*
aBioinorganic Materials Research Laboratory, Department of Chemistry, National Institute of Technology Calicut, Kozhikode, Kerala, India - 673 601; E-mail: [email protected] of Biotechnology, National Institute of Technology Calicut, Kozhikode, Kerala, India - 673 601; E-mail: [email protected]
Contents
Figure S1. 1H NMR spectrum of 5-(4-Methylphenyl)dipyrromethane.
Figure S2.1H NMR spectrum of 5-(4-tert-Butylphenyl) dipyrromethane.
Figure S3. 1H NMR spectrum of 5-(4-N,N'-Dimethylaminophenyl) dipyrromethane.
Figure S4. 1H NMR spectrum of compound, 1a.
Figure S5. 1H NMR spectrum of compound, 1b.
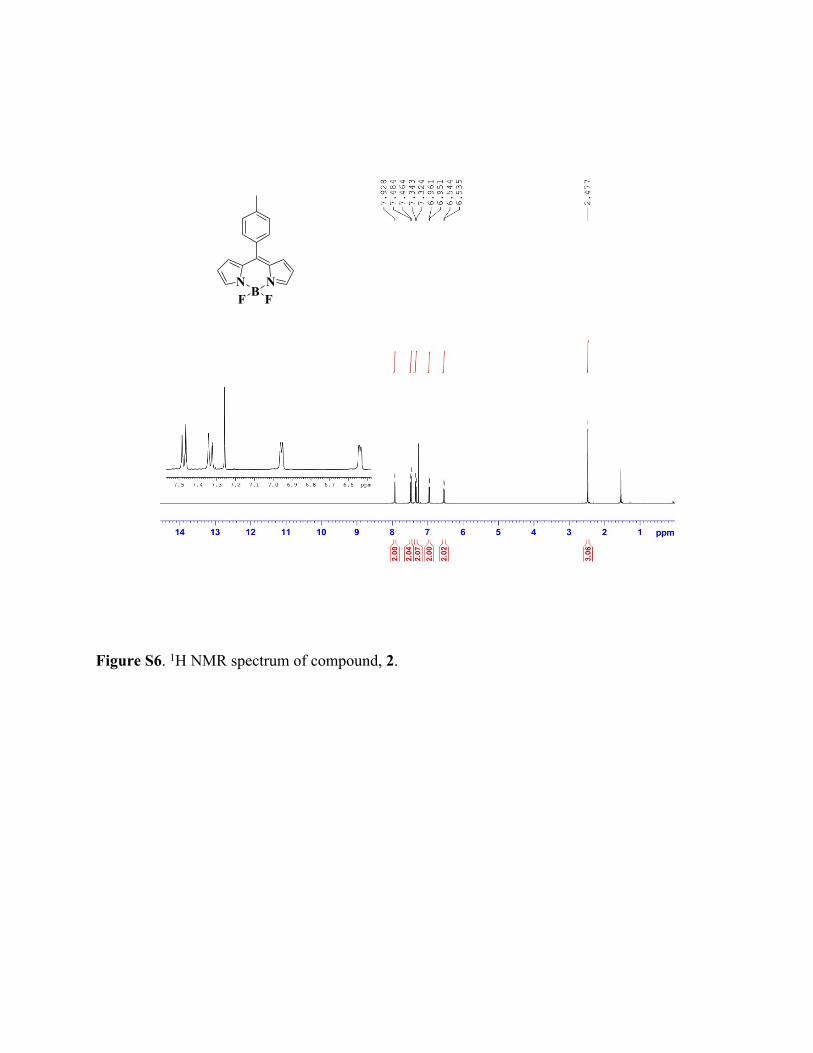
Figure S6. 1H NMR spectrum of compound, 2.
Figure S7.1H NMR spectrum of compound, 2a.
Figure S8.1H NMR spectrum of compound, 2b.
Figure S9.1H NMR spectrum of compound, 3.
Figure S10.1H NMR spectrum of compound, 3a.
Figure S11. 1H NMR spectrum of compound, 3b.
Figure S12. 1H NMR spectrum of compound, 4.
Figure S13. 1H NMR spectrum of compound, 4a.
Figure S14. 1H NMR spectrum of compound, 4b.
Electronic Supplementary Material (ESI) for RSC Advances.This journal is © The Royal Society of Chemistry 2016
Figure S15. 1H NMR spectrum of compound, 5b.
Figure S16. 13C NMR spectrum of compound, 1a.
Figure S17. 13C NMR spectrum of compound, 1b.
Figure S18. 13C NMR spectrum of compound, 2a.
Figure S19. 13C NMR spectrum of compound, 2b.
Figure S20. 13C NMR spectrum of compound, 3a.
Figure S21. 13C NMR spectrum of compound, 3b.
Figure S22. 13C NMR spectrum of compound, 4a.
Figure S23. 13C NMR spectrum of compound, 4b.
Figure S24. 13C NMR spectrum of compound, 5b.
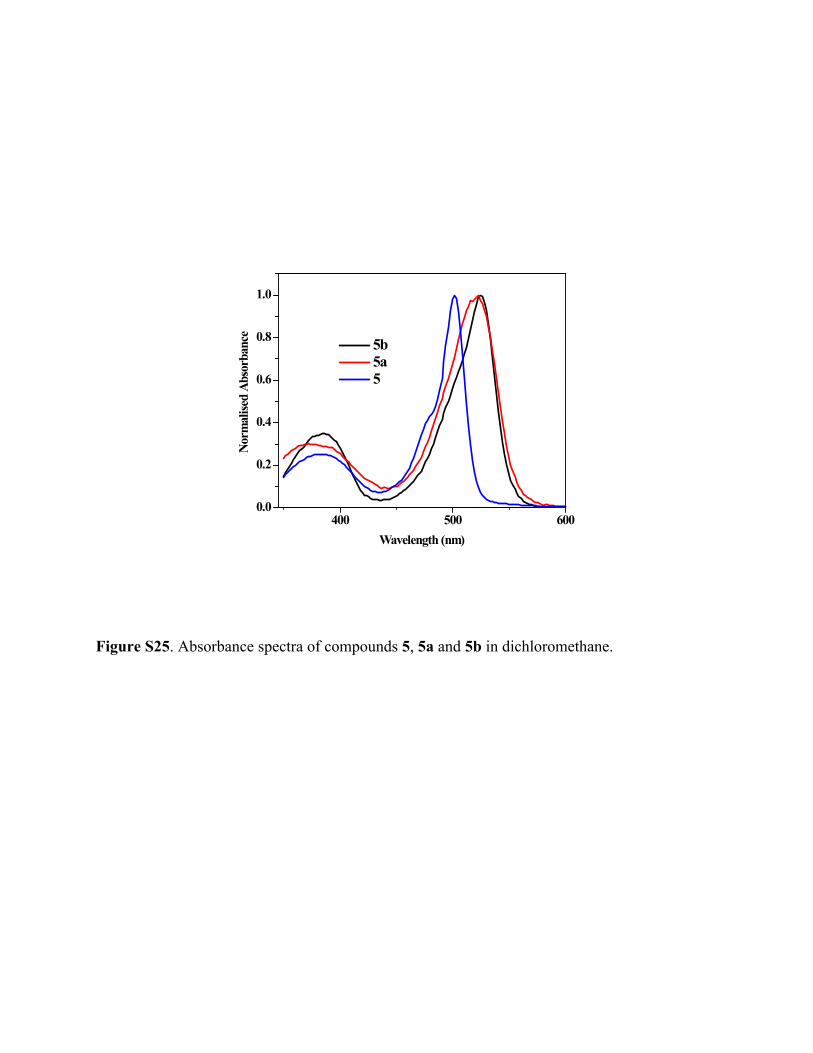
Figure S25. Absorbance spectra of compounds 5, 5a and 5b in dichloromethane.
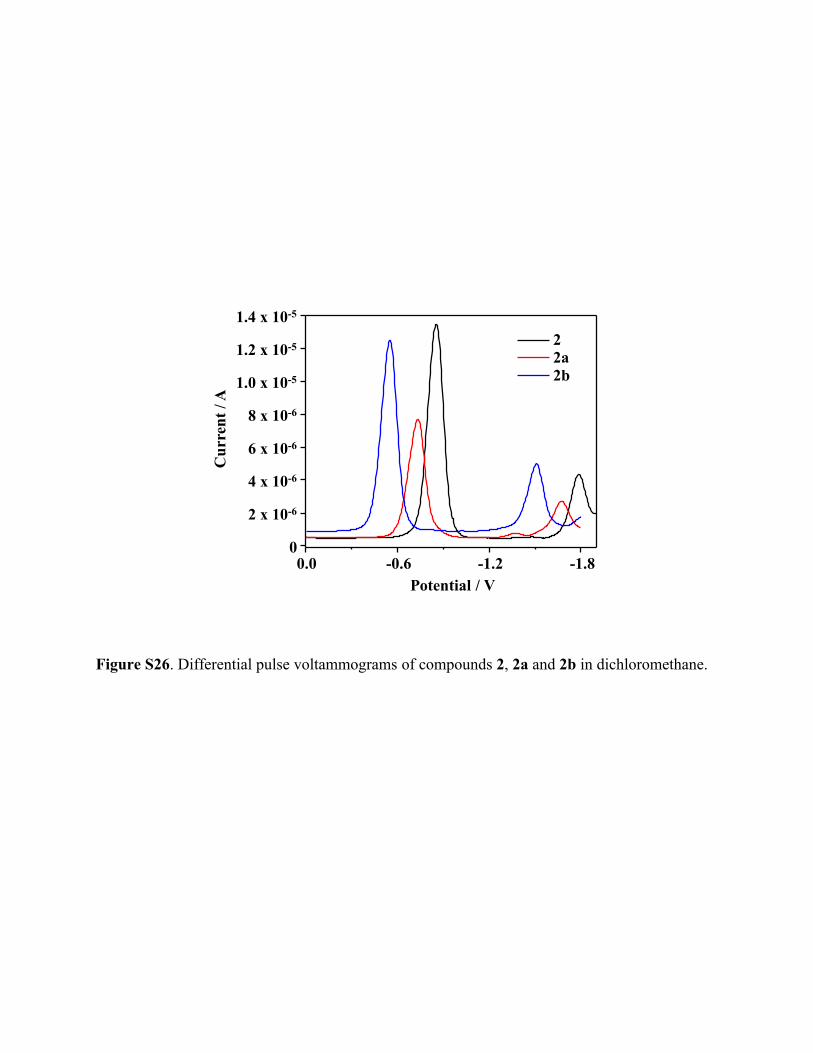
Figure S26. Differential pulse voltammograms of compounds 2, 2a and 2b in dichloromethane.
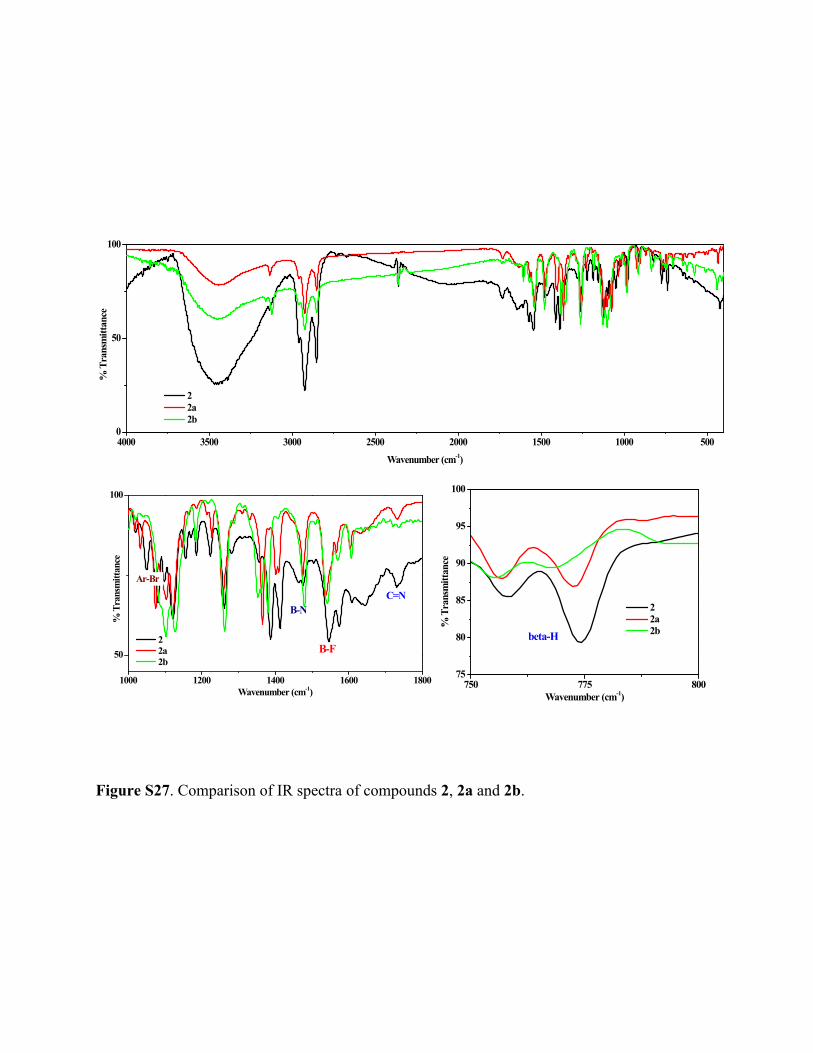
Figure S27. Comparison of IR spectra of compounds 2, 2a and 2b.
Figure S28. Plot of change in absorbance of DPBF vs. irradiation time in the presence of 1, 1a
and 1b.
Figure S29. Photo-images of BODIPYs in CH2Cl2 under (a) UV and (b) visible light.
Figure S30. Mass spectrum of compound 1a.
Figure S31. Mass spectrum of compound 1b.
Figure S32. Mass spectrum of compound 2a.
Figure S33. Mass spectrum of compound 2b.
Figure S34. Mass spectrum of compound 3a.
Figure S35. Mass spectrum of compound 3b.
Figure S36. Mass spectrum of compound 4a.
Figure S37. Mass spectrum of compound 4b.
Figure S38. Mass spectrum of compound 5a.
Figure S39. Mass spectrum of compound 5b.
Table S1. Solvatochromic data for compounds, 1-5.
Table S2. Distances (in Å) for different types of interactions in BODIPYs, 1, 2, 2a, 3, 5 and 5b.
Table S3. Comparison of IC50 values of different BODIPYs against BS and EC.

Figure S1. 1H NMR spectrum of 5-(4-Methylphenyl) dipyrromethane.

Figure S2.1H NMR spectrum of 5-(4-tert-Butylphenyl) dipyrromethane.

Figure S3. 1H NMR spectrum of 5-(4-N,N'-Dimethylaminophenyl) dipyrromethane.
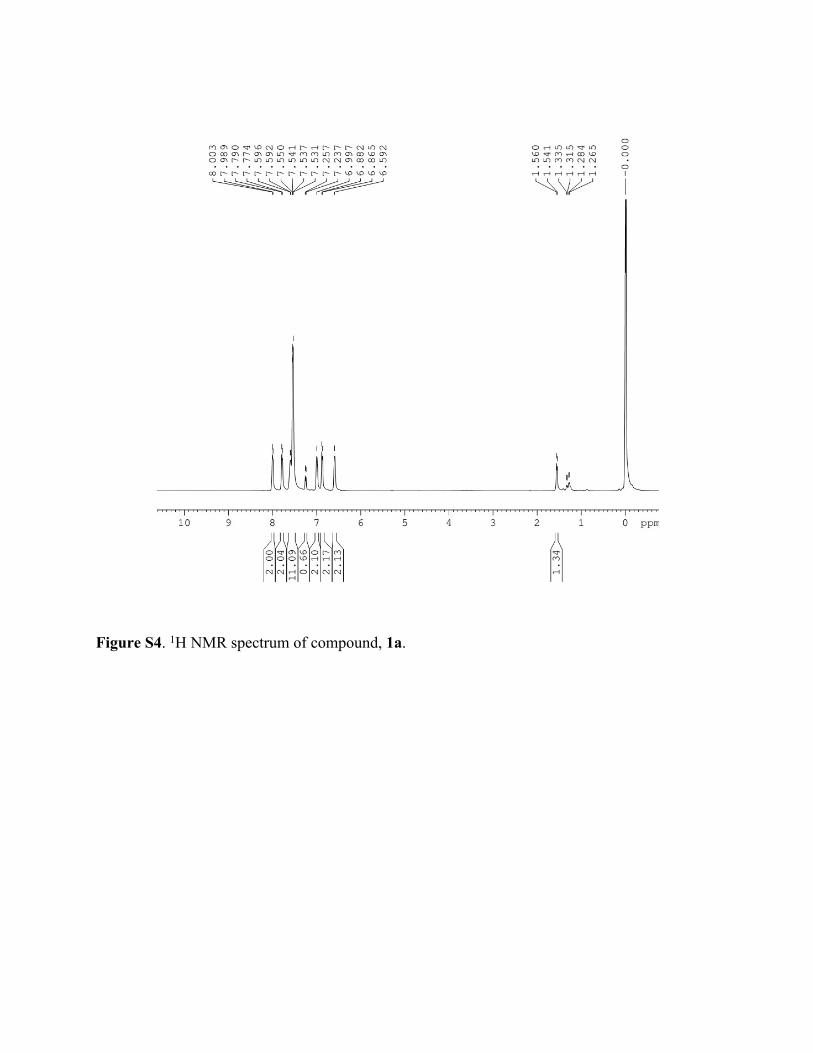
Figure S4. 1H NMR spectrum of compound, 1a.

*
Figure S5. 1H NMR spectrum of compound, 1b.
NNBF F
Figure S6. 1H NMR spectrum of compound, 2.
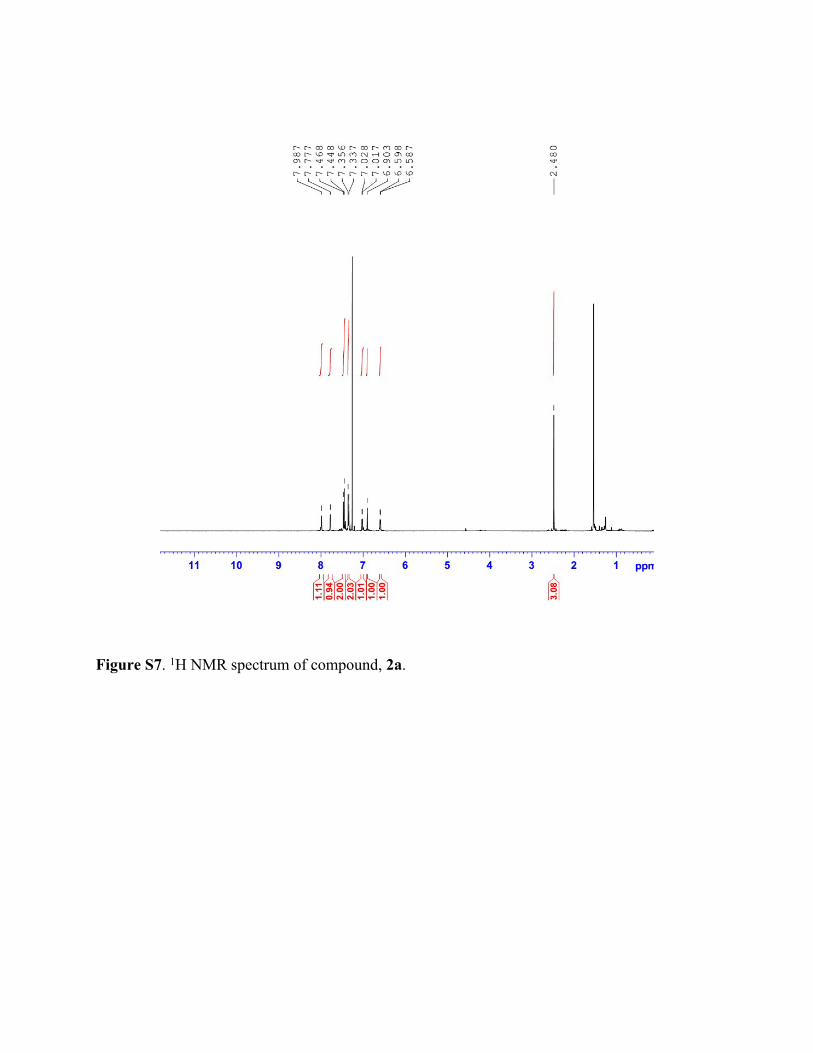
Figure S7. 1H NMR spectrum of compound, 2a.

Figure S8. 1H NMR spectrum of compound, 2b.

NNBF F
Figure S9. 1H NMR spectrum of compound, 3.

Figure S10. 1H NMR spectrum of compound, 3a.

*
* *
Figure S11. 1H NMR spectrum of compound, 3b.
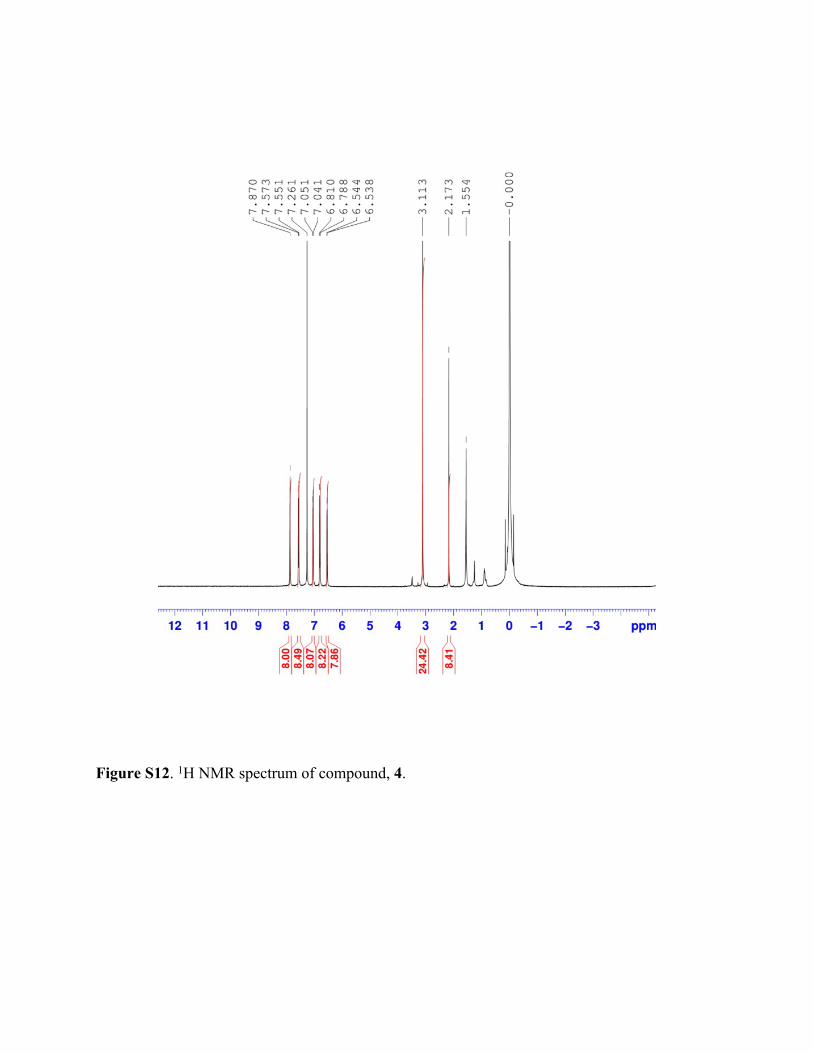
Figure S12. 1H NMR spectrum of compound, 4.
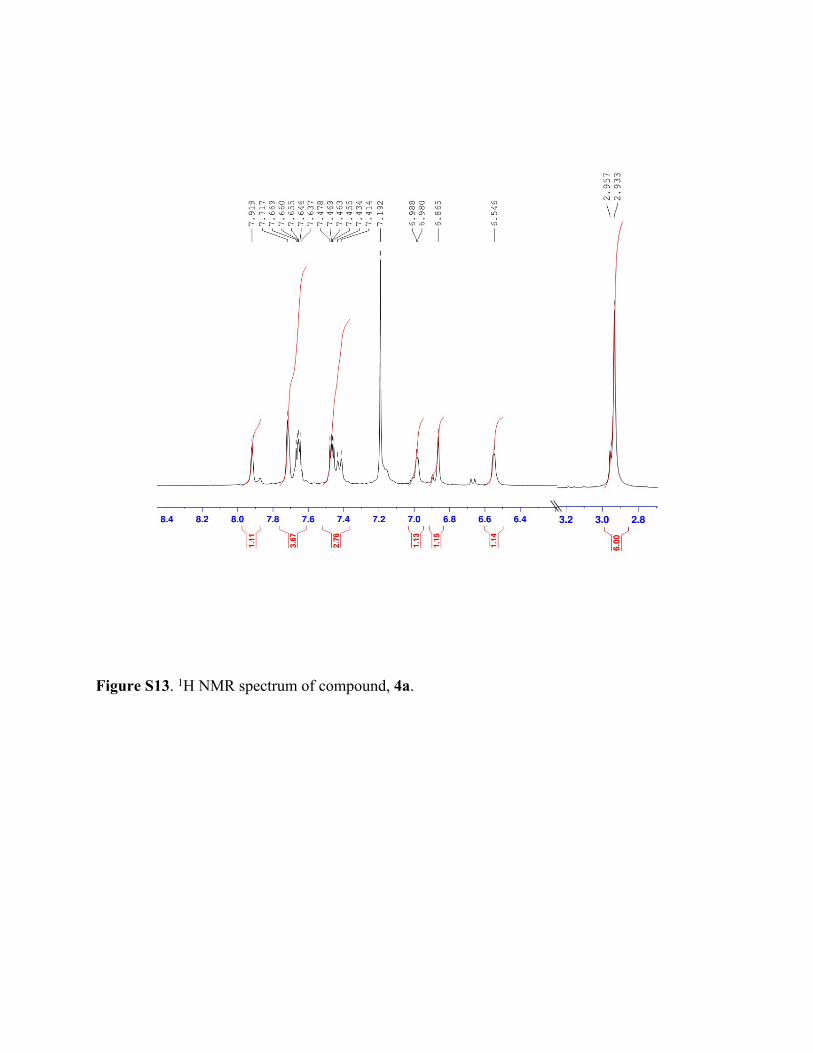
Figure S13. 1H NMR spectrum of compound, 4a.

*
*
Figure S14. 1H NMR spectrum of compound, 4b.

Figure S15. 1H NMR spectrum of compound, 5b.
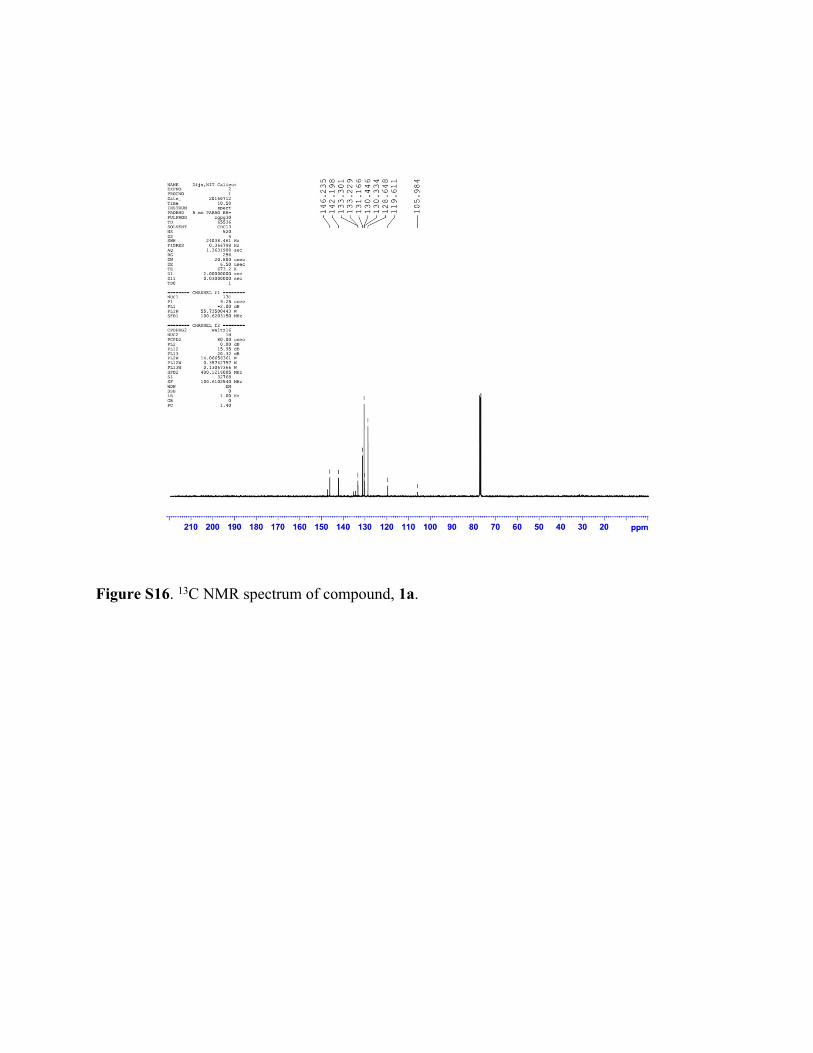
Figure S16. 13C NMR spectrum of compound, 1a.

Figure S17. 13C NMR spectrum of compound, 1b.

Figure S18. 13C NMR spectrum of compound, 2a.
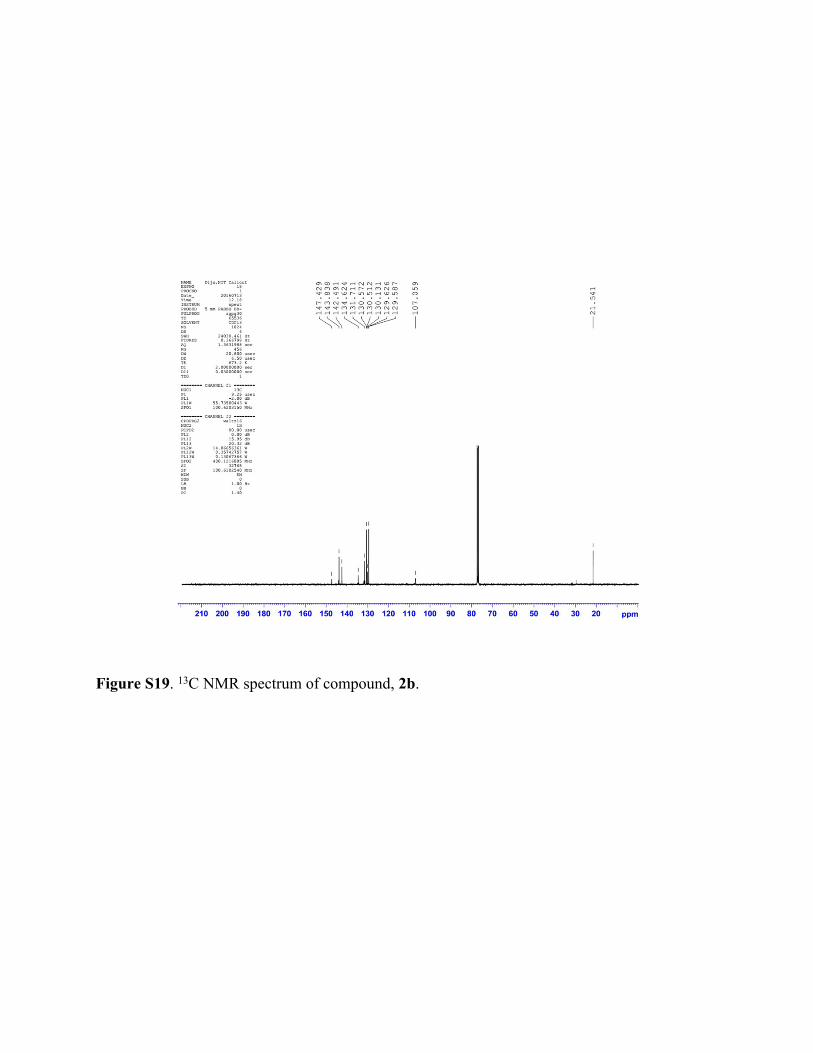
Figure S19. 13C NMR spectrum of compound, 2b.

Figure S20. 13C NMR spectrum of compound, 3a.

Figure S21. 13C NMR spectrum of compound, 3b.

Figure S22. 13C NMR spectrum of compound, 4a.

Figure S23. 13C NMR spectrum of compound, 4b.
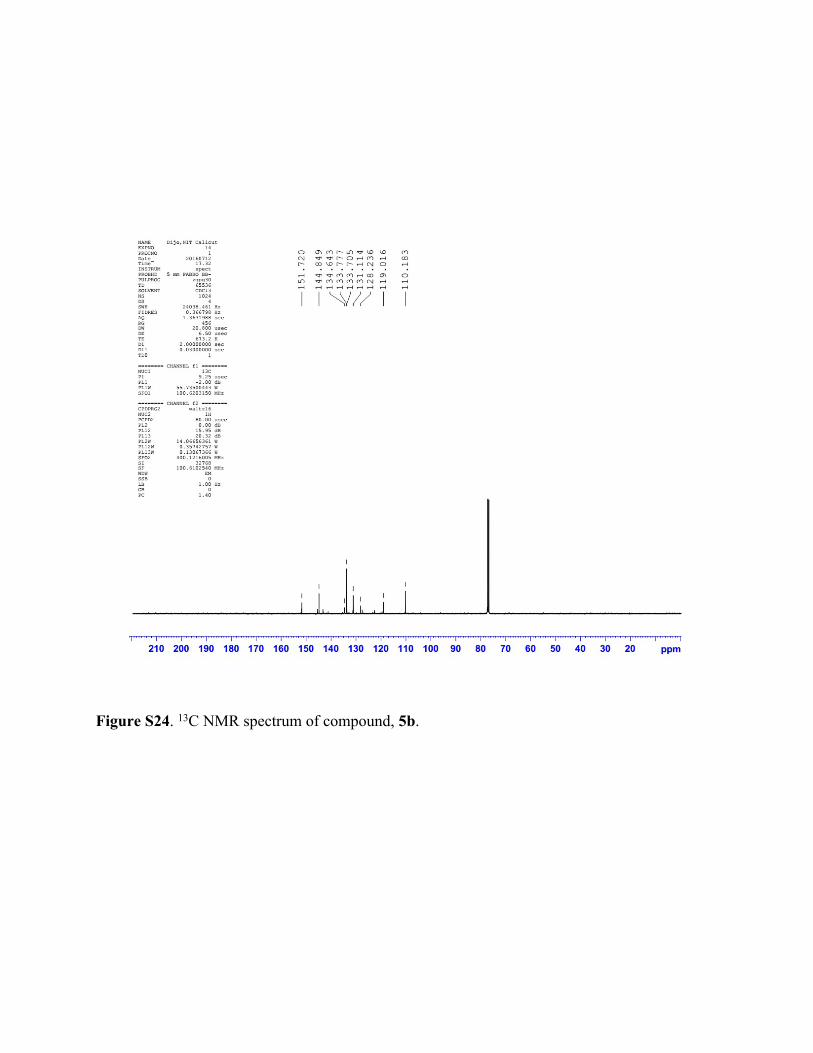
Figure S24. 13C NMR spectrum of compound, 5b.
400 500 6000.0
0.2
0.4
0.6
0.8
1.0
No
rmal
ised
Abso
rban
ce
Wavelength (nm)
5b 5a 5
Figure S25. Absorbance spectra of compounds 5, 5a and 5b in dichloromethane.
0.0 -0.6 -1.2 -1.8 0
2 x 10⁻⁶
4 x 10⁻⁶
6 x 10⁻⁶
8 x 10⁻⁶
1.0 x 10⁻⁵
1.2 x 10⁻⁵
1.4 x 10⁻⁵
Cur
rent
/ A
Potential / V
2 2a 2b
Figure S26. Differential pulse voltammograms of compounds 2, 2a and 2b in dichloromethane.
4000 3500 3000 2500 2000 1500 1000 5000
50
100
% T
rans
mitt
ance
Wavenumber (cm-1)
2 2a 2b
1000 1200 1400 1600 1800
50
100
Ar-Br
B-F
C=NB-N
% T
rans
mitt
ance
Wavenumber (cm-1)
2 2a 2b
750 775 80075
80
85
90
95
100
beta-H
% T
rans
mitt
ance
Wavenumber (cm-1)
2 2a 2b
Figure S27. Comparison of IR spectra of compounds 2, 2a and 2b.

Figure S28.Plot of change in absorbance of DPBF vs. irradiation time in the presence of 1, 1a and 1b.

1 1a 1b 2 2a 2b 3 3a 3b 4 4a 4b 5 5a 5b
(a)
1 1a 1b 2 2a 2b 3 3a 3b 4 4a 4b 5 5a 5b
(b)
Figure S29. Photo-images of BODIPYs in CH2Cl2under (a) UV and (b) visible light.
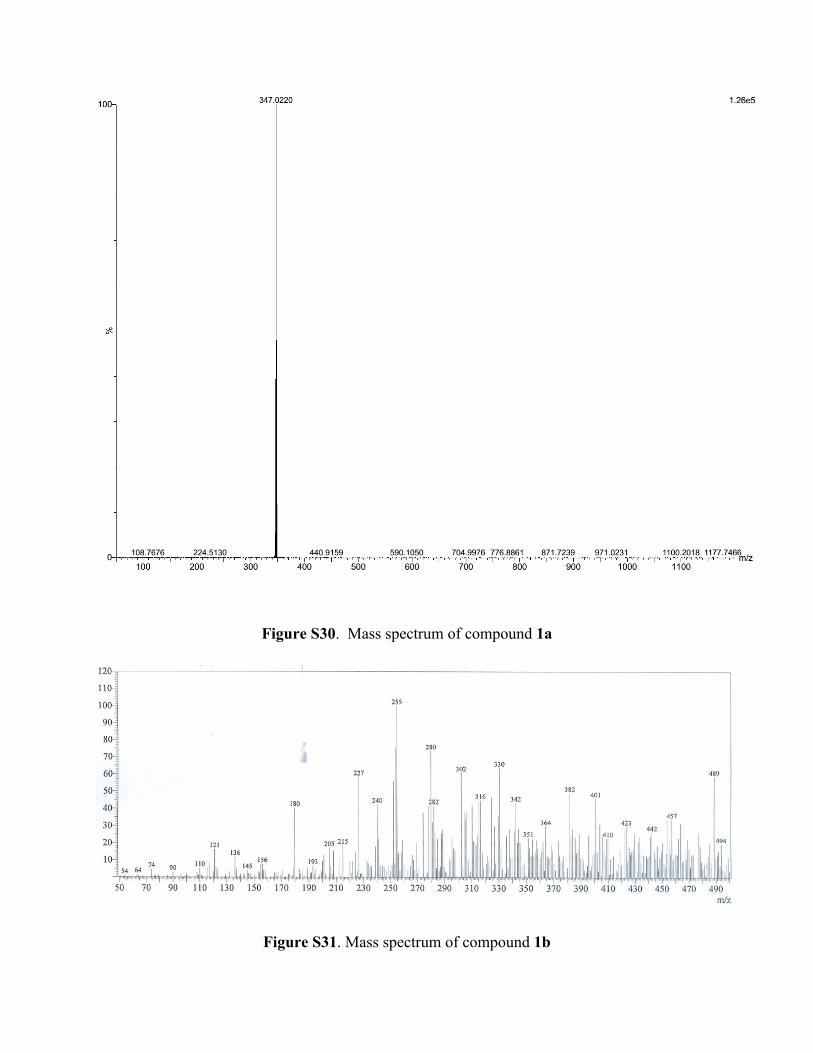
Figure S30. Mass spectrum of compound 1a
Figure S31. Mass spectrum of compound 1b

Figure S32. Mass spectrum of compound 2a

Figure S33. Mass spectrum of compound 2b
Figure S34. Mass spectrum of compound 3a

Figure S35. Mass spectrum of compound 3b

Figure S36. Mass spectrum of compound 4a
Figure S37. Mass spectrum of compound 4b

Figure S38. Mass spectrum of compound 5a
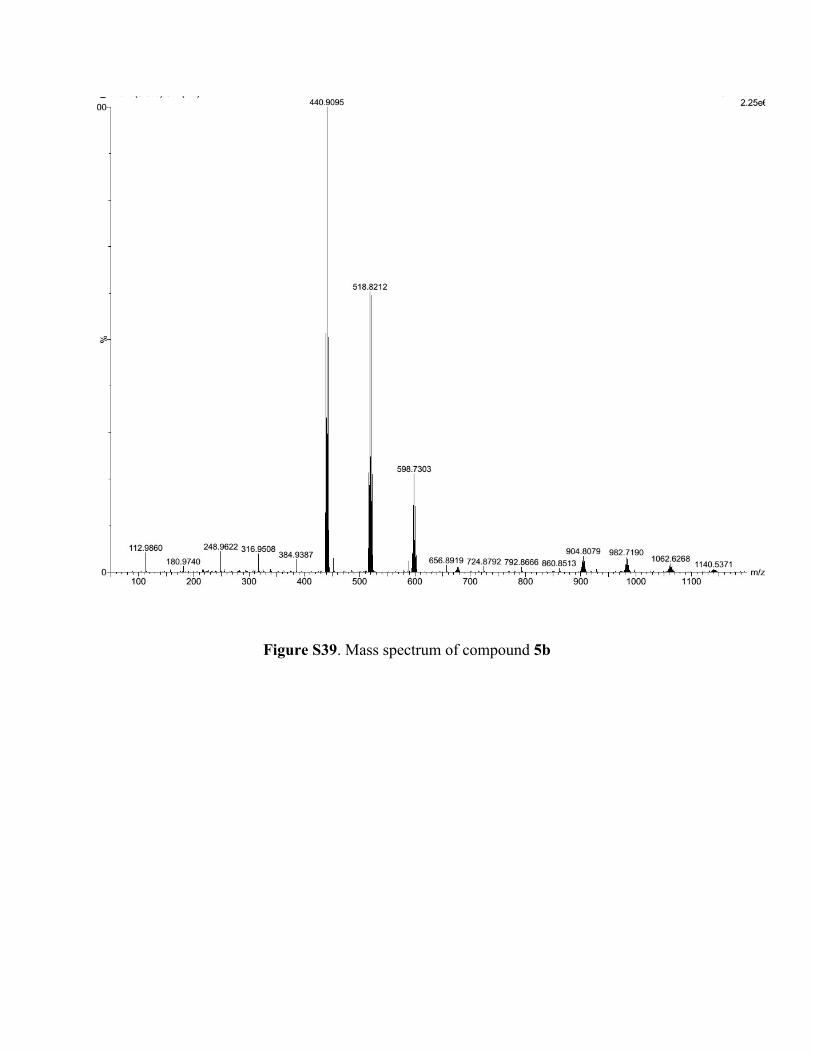
Figure S39. Mass spectrum of compound 5b

Table S1.Solvatochromic data for compounds, 1-5.
Compound Solvent λmax(n
m)λem(n
m)
Stokes shift,
∆max (cm-1)
Compound Solvent λmax(n
m)λem(n
m)
Stokes shift,
∆max (cm-1)MeOH 497 514 665 MeOH 539 560 696MeCN 496 513 668 MeCN 538 560 730THF 499 516 660 THF 542 562 6571i
Toluene 501 522 810
3b
Toluene 544 564 652MeOH 512 537 909 MeOH 488 - -MeCN 511 537 947 MeCN 483 - -THF 515 540 899 THF 492 543 18681ai
Toluene 521 543 778
4
Toluene 498 626 4068MeOH 533 556 776 MeOH 514 546 1140MeCN 531 557 879 MeCN 516 549 1165THF 535 558 770 THF 516 549 11651bi
Toluene 540 565 819
4a
Toluene 521 613 2881MeOH 496 511 573 MeOH 531 559 943MeCN 495 510 594 MeCN 528 559 1050THF 498 512 549 THF 532 547 5152
Toluene 501 518 655
4b
Toluene 536 608.5 2236MeOH 511 535 878 MeOH 493 508 599MeCN 509 536 989 MeCN 493 508 599THF 513 537 871 THF 495 510 5942a
Toluene 518 540 787
5
Toluene 501 518 655MeOH 532 555 779 MeOH 507 536 1067MeCN 530 555 849 MeCN 510 535 916THF 533 557 808 THF 512 539 9782b
Toluene 538 560 730
5a
Toluene 519 545 919MeOH 495 512 671 MeOH 490 521 1214MeCN 495 512 671 MeCN 504 516 461THF 499 515 623 THF 507 526 7123
Toluene 501 520 729
5b
Toluene 512 532 734MeOH 511 535 878MeCN 510 536 951THF 514 538 8683a
Toluene 518 541 820iAbsorption of 1, 1a and 1b in toluene (X.-F. Zhangand X. Yang, J. Phys. Chem. B., 2013, 117, 5533-5539) and photophysical properties of 1, 1a and 1b in acetonitrile, methanol and toluene at room temperature at λex= 494, 493 and 501 nm respectively (M. Baruahet al., J. Org. Chem.,2005, 70, 4152-4157).

Table S2. Distances (in Å) for different types of interactions in BODIPYs, 1, 2, 2a, 3, 5 and 5b.
Interactioni 1ii 2ii 2aii 3ii 5ii 5bii
C(Pyr)∙∙∙C(Ph) 3.298 (2) - - - 3.370 (2) -C(Pyr)∙∙∙C(Pyr) 3.348-3.398 (3) - 3.386 - - -N-B∙∙∙C(Ph) 3.748 (2) - - - - -N-B∙∙∙H(Ph) 3.022 - - - 3.072 (2) -N-B∙∙∙H(Sol) 2.968 (2) - - - 2.754 (2) 3.098 (2)N-B∙∙∙H(Pyr) 3.100 - 3.042 (2) - - -B-F∙∙∙H(Ph) 2.623-2.654 (3) 2.554 (2) 2.631 (2) 2.533-2.578 (4) 2.638 (2) -B-F∙∙∙H(Me) - 2.602 (2) - - - -B-F∙∙∙H(Sol) 2.407 (2) - - - 1.942 (2) -B-F∙∙∙H(Hydroxy) - - - - - 1.988 (2)B-F∙∙∙H(Pyr) 2.348-2.562 (5) - 2.359-2.640 (4) - - 2.484 (2)B-F∙∙∙O(Sol) - - - - 2.838 (2) -B-F∙∙∙O(Hydroxy) - - - - - 2.731 (2)B-F∙∙∙C(Ph) 2.982 (2) - - - - 3.147 (2)B-F∙∙∙C(Pyr) 3.120 (2) - - - - -N-B∙∙∙O(Sol) - - - - 3.501 (2) -(Hydroxy)O∙∙∙O(Sol) - - - - 2.627- 2.791 (4) -
(Hydroxy)H∙∙∙O(Sol) - - - - 1.818 (2) -
(Sol)H∙∙∙O(Hydroxy) - - - - 1.878 (2) -
(Hydroxy)H∙∙∙H(Sol) - - - - 2.272-2.395 (4) -
(Pyr)H∙∙∙H(Pyr) - 2.338 - - - -
(Sol)H∙∙∙C(Ph) - - - - 2.597 (2) -
(Ph)H∙∙∙C(Pyr) - - - - - 2.757 (2)
(Ph)H∙∙∙C(Ph) 2.818 (2) - - - - -
(Pyr)H∙∙∙C(Ph) 2.754-2.886 (4) 2.865 (2) - - - -
(Pyr)Br∙∙∙C(Ph) - - 3.449 (2) - - -
(Ph)Br∙∙∙C(Pyr) - - - - - 3.361 (2)(Ph)Br∙∙∙H(Pyr) - - - - - 2.946 (2)(Pyr)N∙∙∙H(Ph) 2.737 - - - - -iDifferent types. iiValue in parenthesis gives the number of interactions present in the molecule.

Table S3. Comparison of IC50 values of different BODIPYs against BS and EC.
Compound IC50 in BS (µM) IC50 in EC (µM) Compound IC50 in BS (µM) IC50 in EC (µM)1 27 - 3b 12 -1a 21 34 4 18 381b 20 34 4a 10 412 36 - 4b 6 342a 10 22 5 18 172b 13 38 5a 10 253 - - 5b 5 263a 8 - - - -