Embed Size (px)
Citation preview

1
Electronic Supplementary Information
Mapping the Ultrafast Vibrational Dynamics of all-Trans and 13-Cis Retinal Isomerization in
Anabaena Sensory Rhodopsin
Partha Pratim Roy,a Youshitoka Kato,b Rei Abe-Yoshizumi,b, c Elisa Pieri,d Nicolas Ferré,d Hideki Kandorib,c and Tiago Buckup*,a
aPhysikalisch-Chemisches Institut, Ruprecht-Karls Universität Heidelberg, D-69210, Heidelberg, Germany
bDepartment of Life Science and Applied Chemistry, Nagoya Institute of Technology, Showa-ku, Nagoya 466-8555, Japan
cOptoBioTechnology Research Center, Nagoya Institute of Technology, Showa-ku, Nagoya 466-8555, Japan
dAix-Marseille Univ, CNRS, ICR, Marseille, France
*Email: [email protected]
Electronic Supplementary Material (ESI) for Physical Chemistry Chemical Physics.This journal is © the Owner Societies 2018
2
Section I: Theoretical CalculationsTable S1: Constant-pH molecular dynamics simulations (CpHMD)1 of ASR, with either AT or 13C retinal, have been performed for 30 ns. Briefly, the ASR models have been built using the 1XIO structure available in the Protein Data Bank. Only the protein structure, the retinal chromophore and the crystallographic water molecules have been kept. The 58-66 missing loop, as well as missing hydrogen atoms, have been added before to embed the protein inside a membrane bilayer model, essentially made of 1-palmitoyl-2-oleoyl-sn-glycero-3-phosphoethanolamine molecules, water molecules and Na+ + Cl- counterions, using the CHARMM-GUI web server.2 After the release of bad contacts (energy minimization, heating at 300K, equilibration), the full system has been studied at different pH values with CpHMD using the ff14sb Amber forcefield for the protein3, TIP3P for the water molecules,4 lipid175 for the membrane and parameters for retinal derived by Hayashi et al.6 Only the pH=7 results are reported below.
AT isomer 13C isomer
Mean value Standard deviation Mean value Standard deviation
C13=C14 1.413 Å 0.030 Å 1.413 Å 0.029 Å
C12-C13-C14-C15 191.6° 7.3° 11.7° 7.2°
C11-C12-C13-C14 176.3° 6.9° 176.3° 6.6°
C13-C14-C15-N 177.1° 6.9° 189.5° 6.5°
3
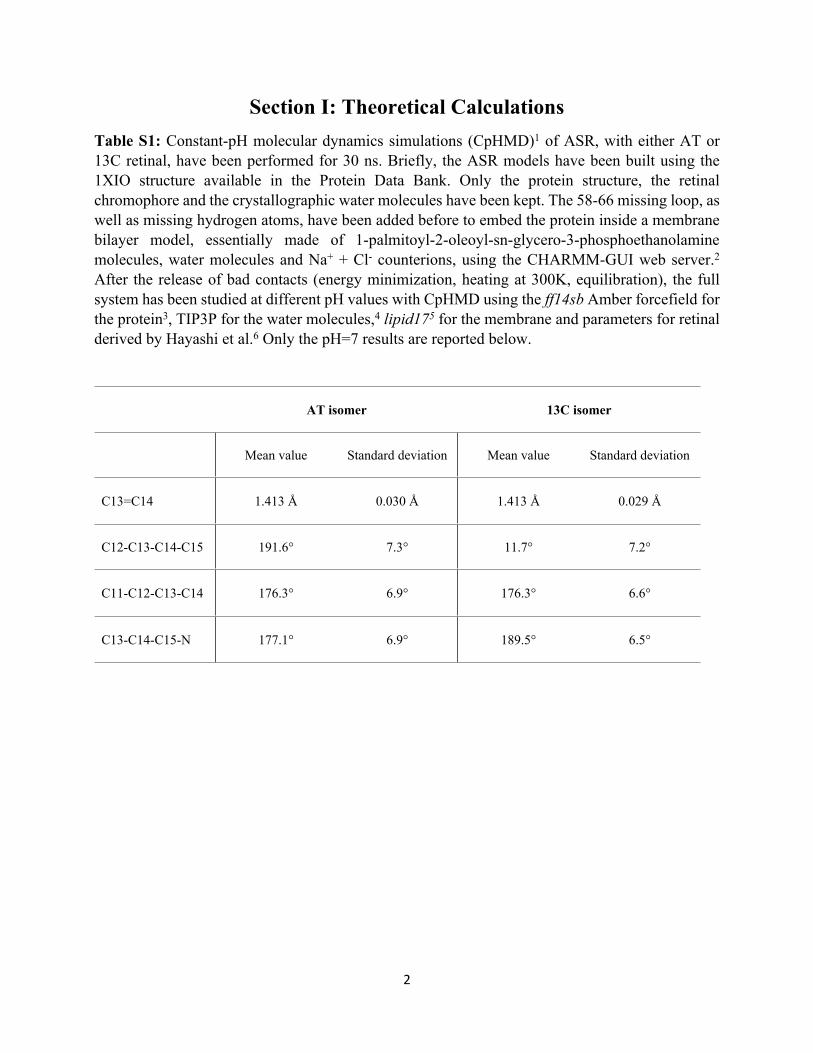
Section II: Experimental Details
Figure S1: Schematic description of experimental set-up used for pump- degenerate four wave mixing (pump-DFWM) experiment. Delay (T) between actinic pulse (green line) and DFWM pulses (red lines) was controlled by mechanical delay stage. The delay between pump/stokes and probe (τ) was controlled by a piezo motor which is required for rapid scan. Genearated homo-dyne signal (orange line) was spectrally resolved. The signal was divided by a dichroic beam-splitter (DBS) and detected in a photo-multiplier tube (PMT) after passing through a narrow band filter (NBF) of ±10 nm band width. Here, CPA: Chirped Pulse Amplifier, nc-OPA: non-collinear-optical parametric amplifier.
4
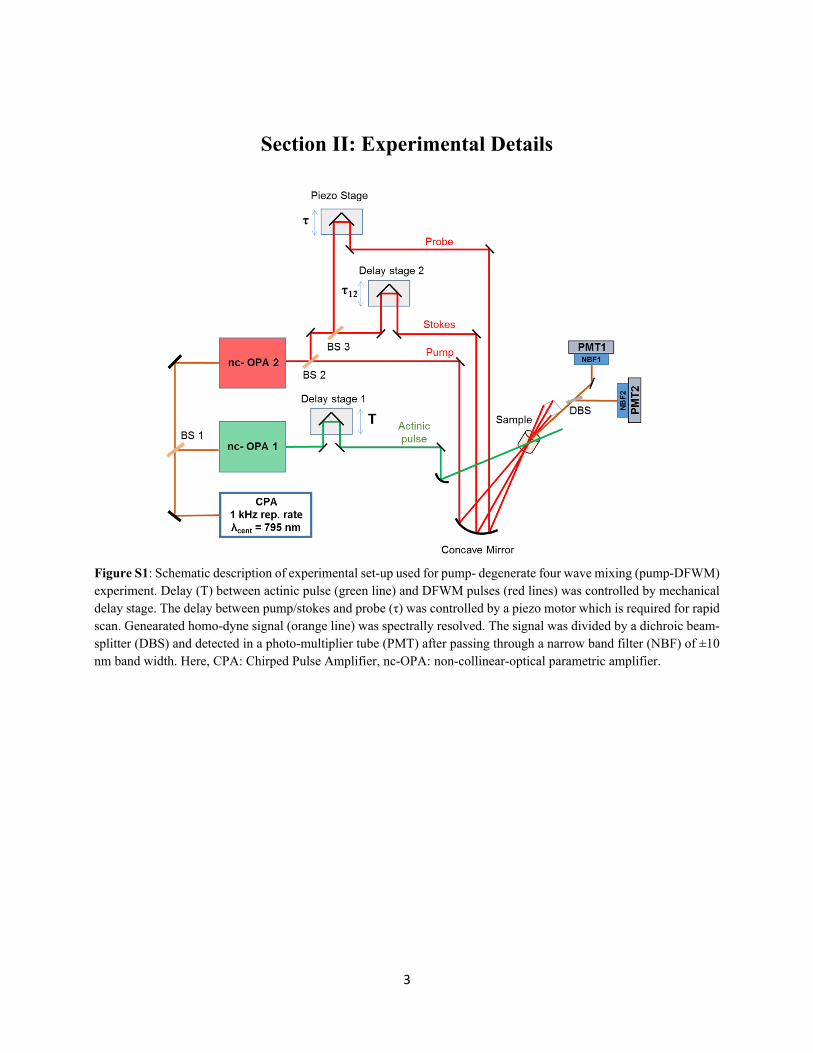
Figure S2: Schematic description of experimental set-up used for pump-impulsive vibrational spectroscopy (pump-IVS) experiment. Delay (T) between actinic pulse (green line) and push (red line) was controlled by mechanical delay stage. The delay between push and probe (τ) was controlled by a piezo which is required for rapid scan. A synchronized mechanical chopper was used to chop each second push pulse. Probe was detected in a grating based photo-diode array (PDA). Here, CPA: Chirped Pulse Amplifier, nc-OPA: non-collinear-optical parametric amplifier.
5
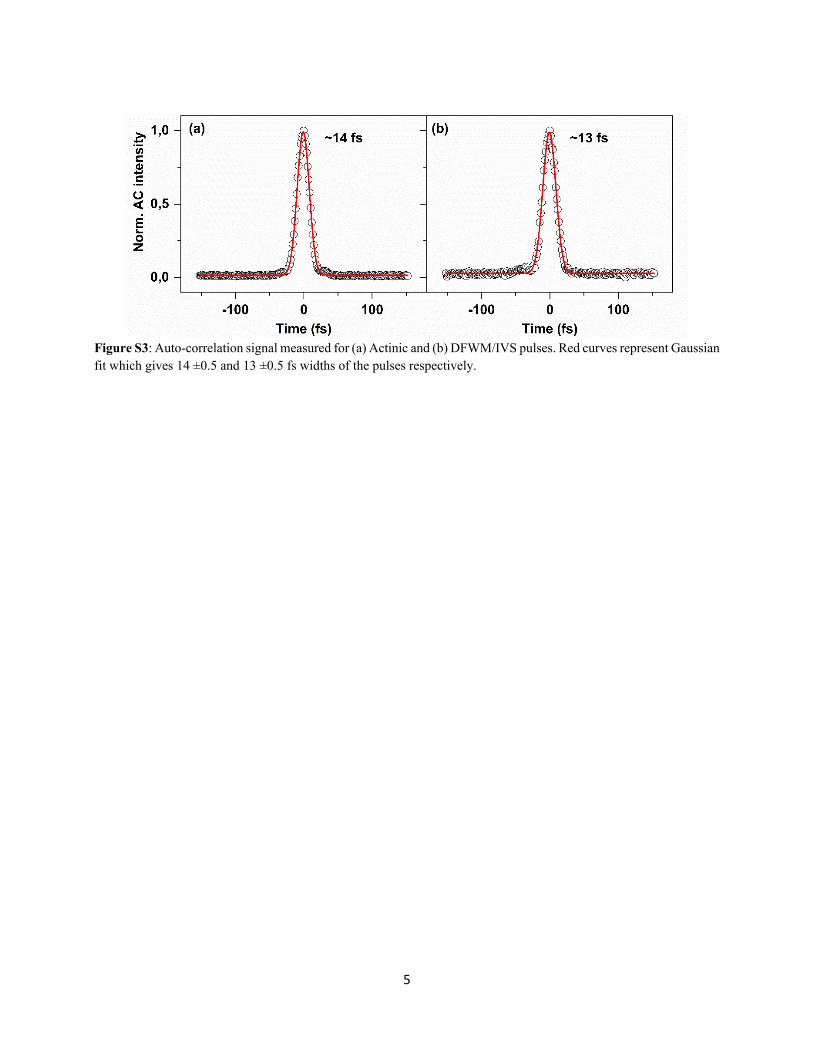
Figure S3: Auto-correlation signal measured for (a) Actinic and (b) DFWM/IVS pulses. Red curves represent Gaussian fit which gives 14 ±0.5 and 13 ±0.5 fs widths of the pulses respectively.
6
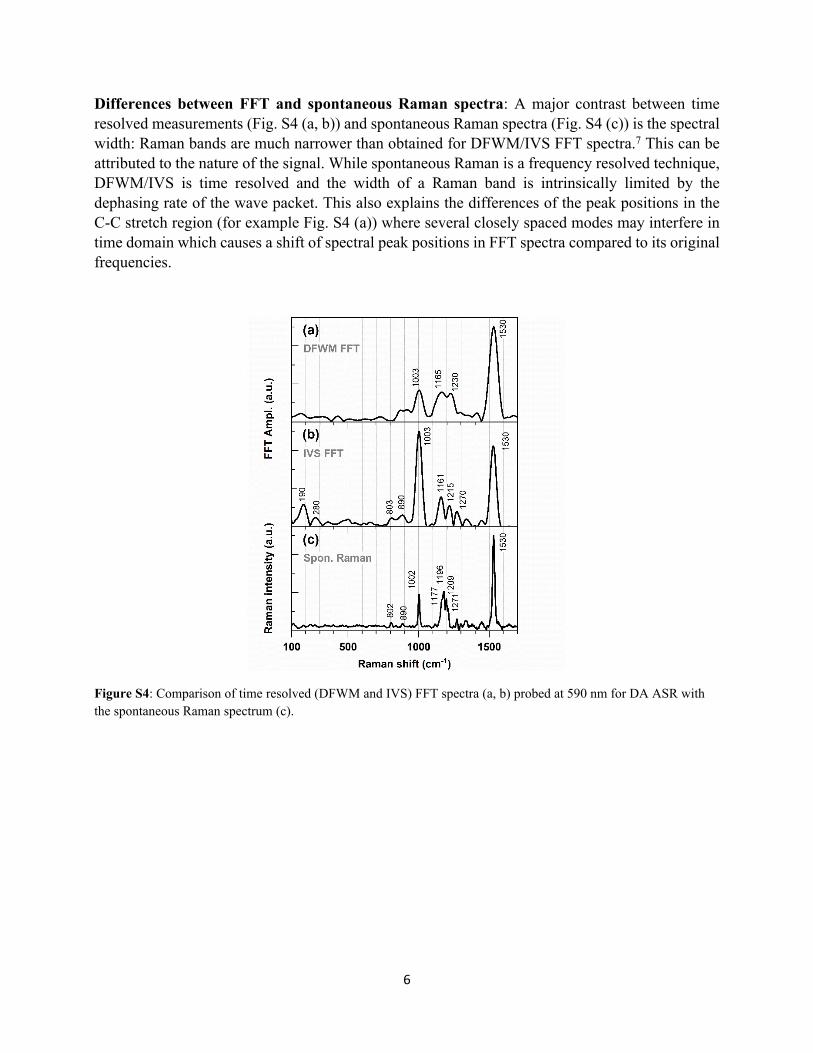
Differences between FFT and spontaneous Raman spectra: A major contrast between time resolved measurements (Fig. S4 (a, b)) and spontaneous Raman spectra (Fig. S4 (c)) is the spectral width: Raman bands are much narrower than obtained for DFWM/IVS FFT spectra.7 This can be attributed to the nature of the signal. While spontaneous Raman is a frequency resolved technique, DFWM/IVS is time resolved and the width of a Raman band is intrinsically limited by the dephasing rate of the wave packet. This also explains the differences of the peak positions in the C-C stretch region (for example Fig. S4 (a)) where several closely spaced modes may interfere in time domain which causes a shift of spectral peak positions in FFT spectra compared to its original frequencies.
Figure S4: Comparison of time resolved (DFWM and IVS) FFT spectra (a, b) probed at 590 nm for DA ASR with the spontaneous Raman spectrum (c).
7
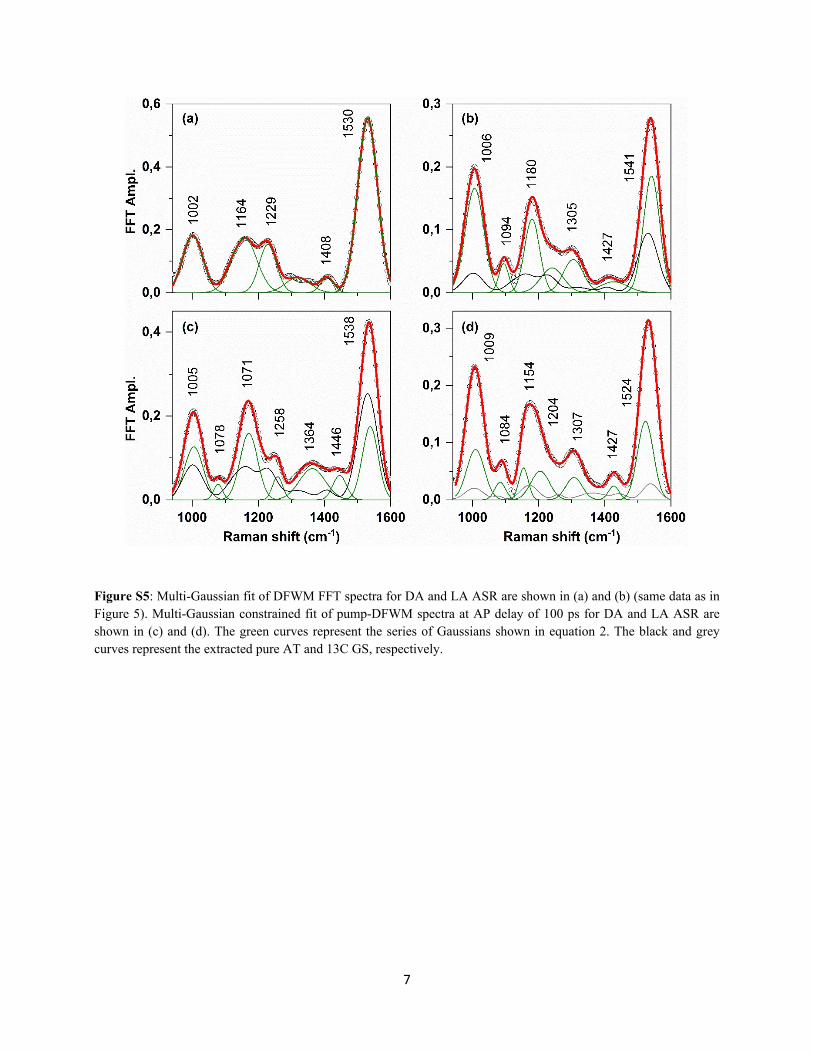
Figure S5: Multi-Gaussian fit of DFWM FFT spectra for DA and LA ASR are shown in (a) and (b) (same data as in Figure 5). Multi-Gaussian constrained fit of pump-DFWM spectra at AP delay of 100 ps for DA and LA ASR are shown in (c) and (d). The green curves represent the series of Gaussians shown in equation 2. The black and grey curves represent the extracted pure AT and 13C GS, respectively.
8
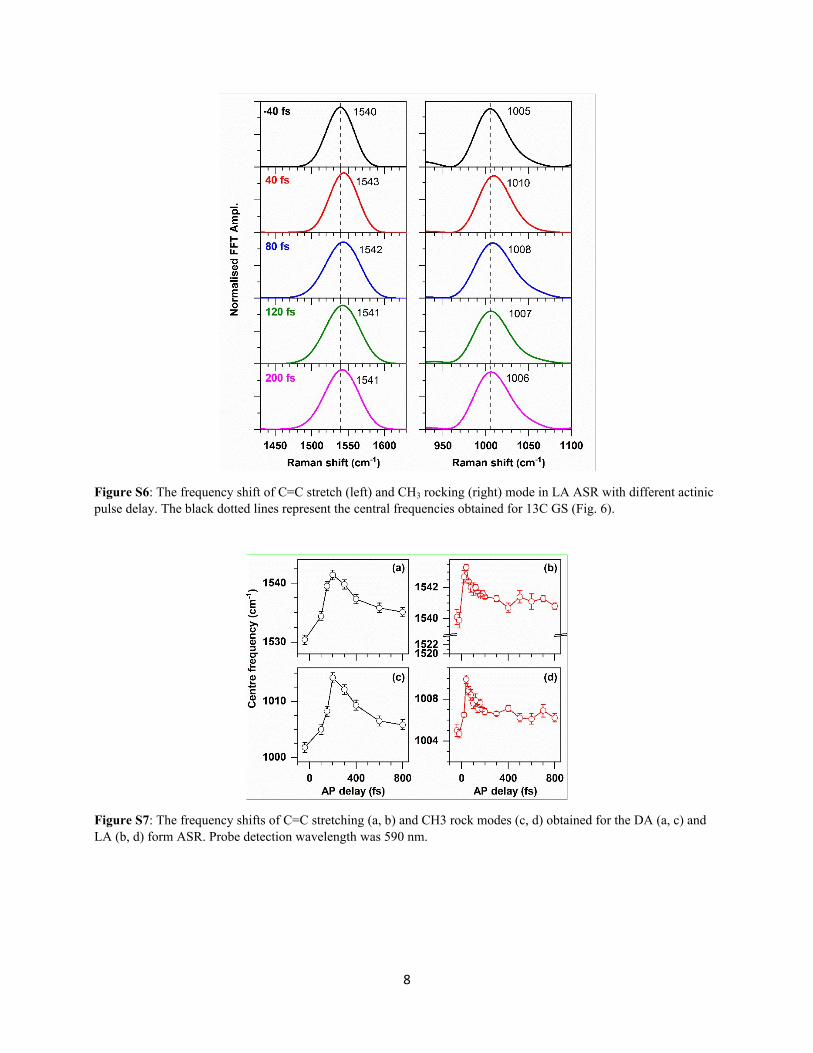
Figure S6: The frequency shift of C=C stretch (left) and CH3 rocking (right) mode in LA ASR with different actinic pulse delay. The black dotted lines represent the central frequencies obtained for 13C GS (Fig. 6).
Figure S7: The frequency shifts of C=C stretching (a, b) and CH3 rock modes (c, d) obtained for the DA (a, c) and LA (b, d) form ASR. Probe detection wavelength was 590 nm.
9
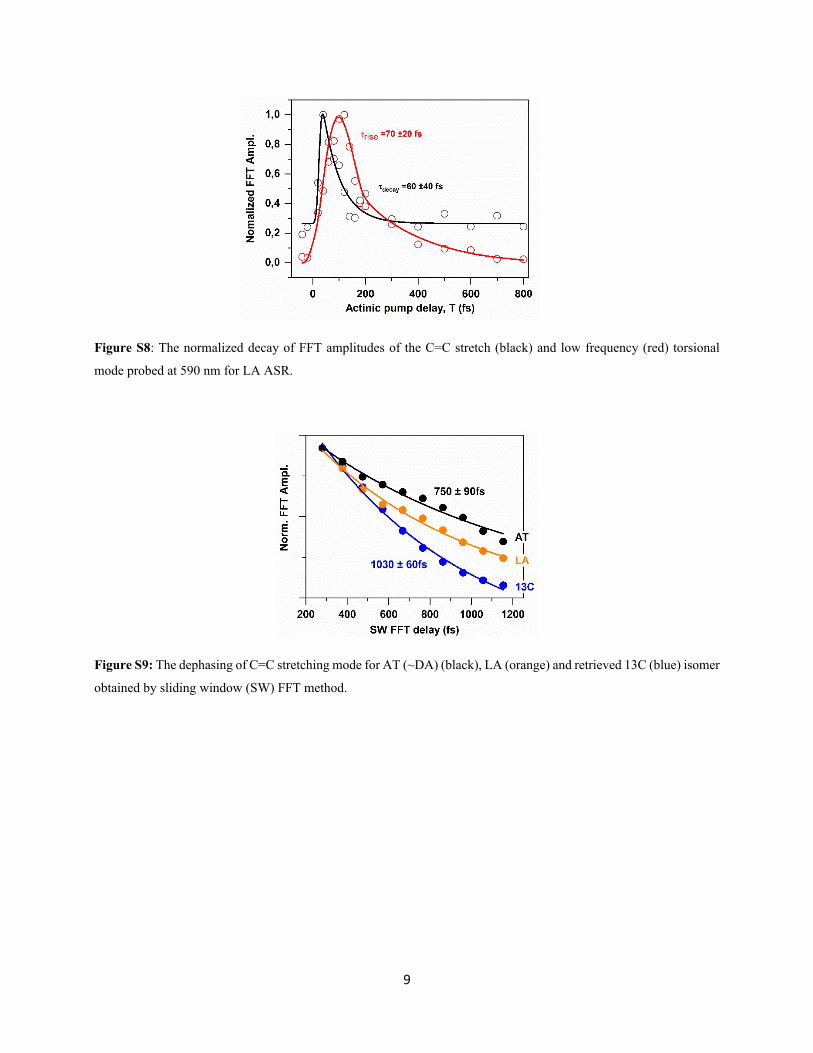
Figure S8: The normalized decay of FFT amplitudes of the C=C stretch (black) and low frequency (red) torsional
mode probed at 590 nm for LA ASR.
Figure S9: The dephasing of C=C stretching mode for AT (~DA) (black), LA (orange) and retrieved 13C (blue) isomer
obtained by sliding window (SW) FFT method.
10
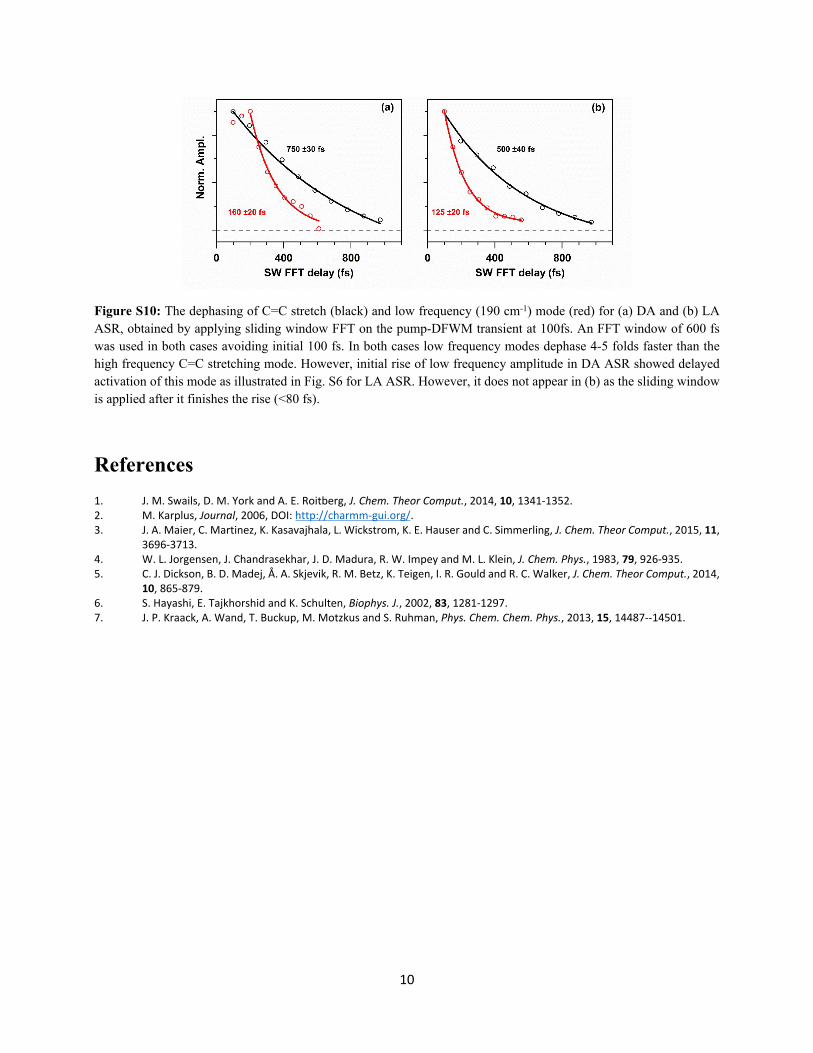
Figure S10: The dephasing of C=C stretch (black) and low frequency (190 cm-1) mode (red) for (a) DA and (b) LA ASR, obtained by applying sliding window FFT on the pump-DFWM transient at 100fs. An FFT window of 600 fs was used in both cases avoiding initial 100 fs. In both cases low frequency modes dephase 4-5 folds faster than the high frequency C=C stretching mode. However, initial rise of low frequency amplitude in DA ASR showed delayed activation of this mode as illustrated in Fig. S6 for LA ASR. However, it does not appear in (b) as the sliding window is applied after it finishes the rise (<80 fs).
References1. J. M. Swails, D. M. York and A. E. Roitberg, J. Chem. Theor Comput., 2014, 10, 1341-1352.2. M. Karplus, Journal, 2006, DOI: http://charmm-gui.org/.3. J. A. Maier, C. Martinez, K. Kasavajhala, L. Wickstrom, K. E. Hauser and C. Simmerling, J. Chem. Theor Comput., 2015, 11,
3696-3713.4. W. L. Jorgensen, J. Chandrasekhar, J. D. Madura, R. W. Impey and M. L. Klein, J. Chem. Phys., 1983, 79, 926-935.5. C. J. Dickson, B. D. Madej, Å. A. Skjevik, R. M. Betz, K. Teigen, I. R. Gould and R. C. Walker, J. Chem. Theor Comput., 2014,
10, 865-879.6. S. Hayashi, E. Tajkhorshid and K. Schulten, Biophys. J., 2002, 83, 1281-1297.7. J. P. Kraack, A. Wand, T. Buckup, M. Motzkus and S. Ruhman, Phys. Chem. Chem. Phys., 2013, 15, 14487--14501.

![ANABAENA BERGII OSTENF. [F. MINOR (KISSELEV) KOSSINSK.] …serbiosoc.org.rs/arch_old/VOL61/SVESKA 4/39 Cvijan.pdf · 2015. 1. 13. · ANABAENA BERGII – tHe uNeXPected FIrSt record](https://img.pdfslide.us/doc/110x75/611ec3012662cd578b58eed5/anabaena-bergii-ostenf-f-minor-kisselev-kossinsk-439-cvijanpdf-2015.jpg)