Embed Size (px)
Citation preview
S-1
Biomimetically Crystallized Protease-Resistant Zinc Phosphate
decorated with Gold Atomic Clusters for Bio-Imaging
Anushree Dutta,a Deepanjalee Dutta,b Pallab Sanpui,b Arun Chattopadhyaya,b*
aDepartment of Chemistry and bCentre for Nanotechnology, Indian Institute of Technology
Guwahati, Guwahati, Assam, India -781039
Email: [email protected]
Electronic Supplementary Information
Electronic Supplementary Material (ESI) for Chemical Communications.This journal is © The Royal Society of Chemistry 2017
S-2
1. Experimental Section
1.1. Materials
Gold(III) chloride solution (30 wt %, HCl, Sigma Aldrich, USA), bovine serum albumin (BSA,
Sisco Research Laboratories Pvt. Ltd., India), sodium hydroxide (Merck, India), proteinase K
(Sigma Aldrich, USA), zinc acetate dihydrate (Merck, India), sodium dihydrogen phosphate
dihydrate (NaH2PO4.2H2O), Merck, India), di-Sodium hydrogen phosphate dihydrate
(Na2HPO4.2H2O, Merck, India), 3-(4,5-dimethylthiazol-2-yl)-2,5-diphenyltetrazolium bromide
(MTT, Himedia, India) and sinapinic acid (Sigma-Aldrich USA) were purchased and used as
received without further purification. Milli-Q grade water (18.2 MΩ cm, Millipore) was used
for all experimental work.
Cell Culture Studies: Human cervical carcinoma cells, (HeLa) for cellular study were acquired
from the National Centre for Cell Sciences (NCCS), Pune, India. HeLa cells were cultured in
Dulbecco’s modified Eagle’s medium (DMEM) supplemented with 10% (v/v) fetal bovine
serum (PAA Laboratories, Austria), L-glutamine (4mM), penicillin (50 units/mL),
streptomycin (50 mg/mL, Sigma-Aldrich) and maintained in 5% CO2 humidified incubator at
37 °C.
1.2. Synthesis of BSA stabilised gold nanoclusters (BSA-Au-NCs):
The synthesis of BSA stabilised Au nanoclusters was carried out following a report by Xie et
al.1 An aqueous solution of HAuCl4 (2.5 mL, 10 mM) was added dropwise to an aqueous
solution of BSA (2.5 mL, 50 mg/mL) under vigorous stirring at 37 °C. After stirring for 3
minutes, freshly made NaOH solution (350 L, 1M) was introduced to the reaction mixture
and pH adjusted to ~12. The reaction was allowed to proceed under this condition for 12 h
at 37 °C which resulted in the appearance of deep brown color solution, ensuring the
completion of reaction.

S-3
1.3. Preparation of Phosphate Buffer (pH=7.4) :
The phosphate buffer solution of pH=7.4 was made by mixing 18 mL of NaH2PO4 (0.02M,
monobasic) and 82 mL of Na2HPO4 (0.02M, dibasic) stock solutions. The resulting solution
was mixed thoroughly and pH was tested to be 7.4. The final volume of the solution was
then adjusted to 200 mL.
1.4. Proteolytic digestion of BSA-Au-NCs:
The proteolytic digestion was carried out in phosphate buffer pH=7.4 by proteinase K at 37
°C.2 In a 3 mL fluorescence cuvette, 100 L of as synthesized BSA-Au-NC dispersion was
added to 2.3 mL phosphate buffer at 37 °C. After 5 minutes of incubation at 37 °C,
proteinase K (100 L, 0.8 mg/mL) was added and the mixture was further incubated for 90
min. The proteolytic process was monitored by recording the time dependent emission
spectra of BSA-Au-NC at an excitation wavelength of 500 nm. It may be mentioned here that
protease treatment was carried out for 90 min because experimental results demonstrated
very minute drop in PL intensity beyond 90 min of incubation, reaching a saturation at the
end of 120 min. (Fig. S2) Control experiment, without the addition of proteinase K under
similar experimental conditions, was also carried out and no change in luminescence
intensity was observed. Proteinase K, a serine protease is known to cleave BSA into 313
fragments at the C-terminal site generating peptide fragments bearing free carboxylic group
and amine group.
1.5. Formation of Au-NC decorated zinc phosphate nanocrystal (Au-NC-Zn3(PO4)2):
Following proteolytic digestion of BSA-Au-NCs, the temperature of digested Au-NC
suspension was then fixed at 27 °C. This was then followed by addition of zinc acetate
S-4
solution (300 L, 68.3 mM) to the digested Au-NC dispersion. In brief, to 2.5 mL digested
Au-NC dispersion, 50 L of zinc acetate solution was added successively and the emission
spectra recorded simultaneously at an interval of 1 min each. This led to gradual recovery
of fluorescence which reached a saturation in emission maxima after final addition of 300
L, [Zn2+] = 68 mM. Immediately, after addition of zinc acetate salt solution, white
suspension of zinc phosphate appeared which on standing for ~ 1 h settled down to form
light brown powder of Au NC decorated with zinc phosphate (Au-NC-Zn3(PO4)2). The
powder so obtained was dried under vacuum for further characterization.
1.6. Synthesis of zinc phosphate hydrate:
A 6 mL of 100 mM Zn(NO3)2.6H2O solution was added to 20 mL Milli-Q water. This is
followed by dropwise addition of 5 mL of 100 mM Na3PO4.12H2O solution under constant
stirring at 27 °C. The mixture was stirred for 6 h and the resultant white precipitate was
collected by centrifugation and finally redispersed in 20 mL Milli-Q water.
2. Characterization
UV-vis spectra were recorded using Perkin Elmer Lambda 750 UV-vis spectrophotometer.
Fluorescence studies were carried out in HORIBA Jobin Yvon FluoroMax-4
spectrofluorimeter. FT-IR spectra were recorded in Perkin Elmer Spectrophotometer
(Model- spectrum one) in the range 450-4000 cm-1 for solid samples using KBr pellet
method. The solid samples for FTIR were prepared by drying the samples (aqueous
dispersion) in dessicator overnight. Matrix assisted laser desorption ionization (MALDI-TOF)
spectra for the samples were obtained using Applied Bio systems 4800 Plus MALDI TOF/TOF
analyser employing sinapinic acid as the matrix. Particle size and morphologies of all
S-5
samples were obtained using JEOL JEM 2100 transmission electron microscope (TEM),
operating at maximum operating voltage of 200 kV. Sample preparation for TEM was done
by drop casting 7 μL of colloidal dispersion on the carbon coated copper grid and which was
allowed to air dry. Powder X-ray diffraction (PXRD) data of as synthesized Au NC-Zn3(PO4)2
was acquired using a Bruker AXS D8 Advance x-ray diffractometer with CuKα1 radiation (λ~
1.54060 Å), under 40 kV and 40 mA operating condition. Field emission scanning electron
microscopy (FESEM) was carried out in a IGMA, Carl Zeiss FESEM. For sample preparation,
15 L dispersion of Au NC decorated zinc phosphate nanocomposite was drop-casted on a
pre-cleaned glass slide (wrapped with an aluminium foil), dried overnight in vacuum and
further double coated with a gold film before sample mounting using SC7620 “Mini”,
Polaron Sputter Coater, Quorum Technologies, Newhaven, England.
Brunauer−Emmett−Teller (BET) surface area and Barrett-Joyner-Halenda (BJH) average pore
width of the samples were analysed using Beckman-Coulter SA 3100 N2 adsorption-
desorption analyzer by degassing the samples at 80 °C for 3 h. Zinc and gold ion
concentrations in the samples was determined using atomic absorption spectrometer
(Varian, AA240, Netherlands). Size distribution analysis based on dynamic light scattering
(DLS) and surface zeta potential was done using Zetasizer Nano ZS90 instrument (MODEL
NO. ZEN3690, MALVERN), operating with red He–Ne gas laser (λ = 633 nm) at a temperature
of 25 °C.
S-6
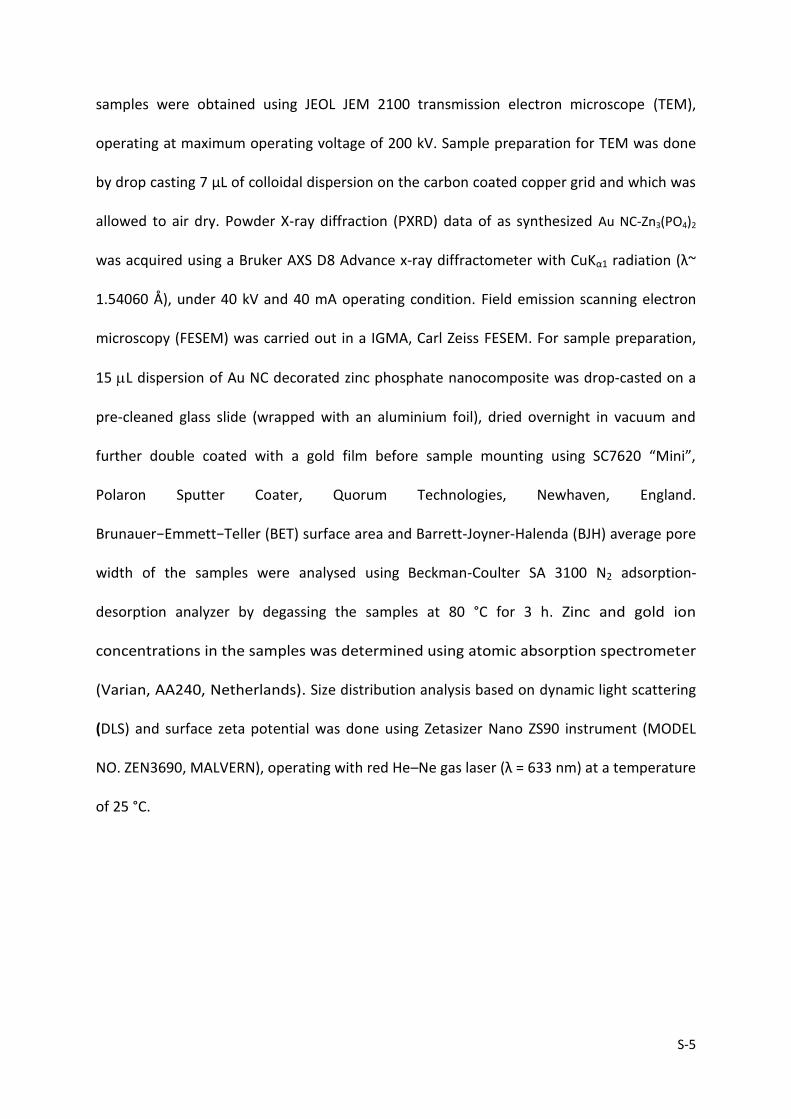
Fig. S1. TEM image of as synthesized BSA stabilised Au NC at (A) low and (B) high magnification.
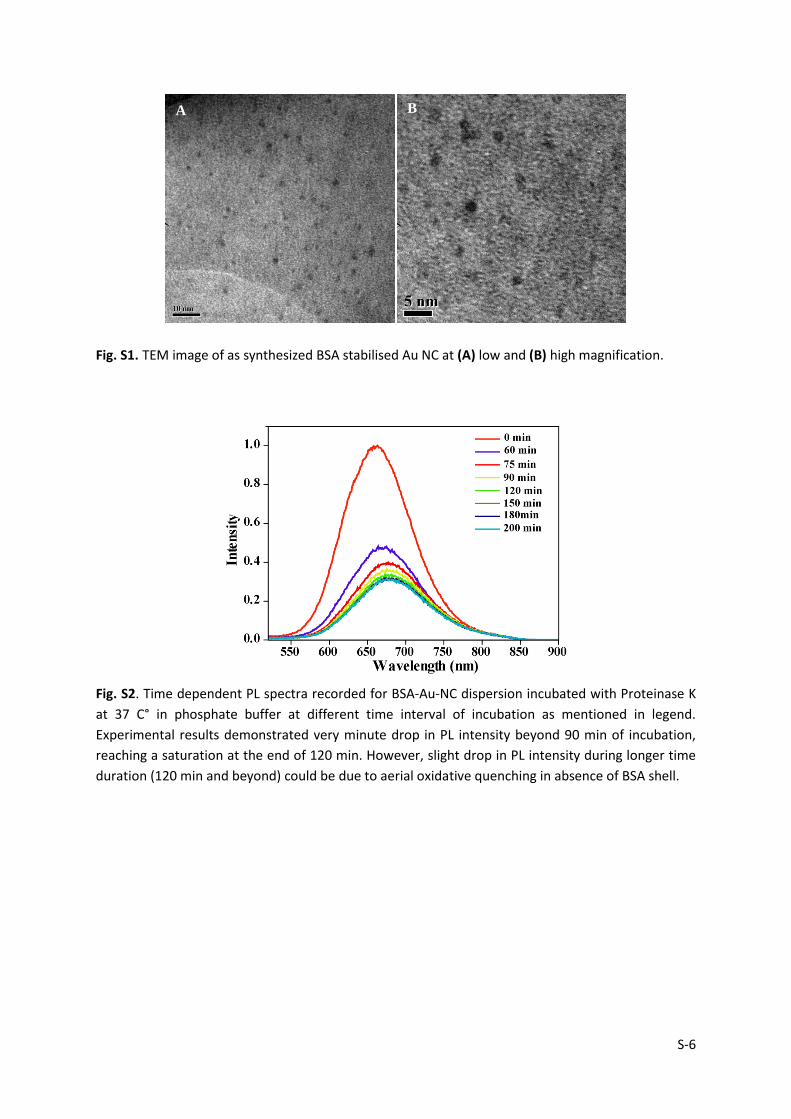
Fig. S2. Time dependent PL spectra recorded for BSA-Au-NC dispersion incubated with Proteinase K
at 37 C° in phosphate buffer at different time interval of incubation as mentioned in legend.
Experimental results demonstrated very minute drop in PL intensity beyond 90 min of incubation,
reaching a saturation at the end of 120 min. However, slight drop in PL intensity during longer time
duration (120 min and beyond) could be due to aerial oxidative quenching in absence of BSA shell.
A B

S-7
Fig. S3. Matrix-assisted laser desorption ionization – time of flight (MALDI-TOF) mass spectra of (a)
BSA only, (b) BSA-Au-NC only, (c) BSA-Au-NC after digestion with Proteinase K and (d) zinc acetate
treated digested BSA-Au-NC (Au-NC-Zn3(PO4)2).
Time–resolved photoluminescence study
Fig. S4. Photoluminescence lifetime decay curve of (A) as synthesized BSA-Au-NC (red), fitted (green
line); BSA Au NC treated with proteinase K for 90 min (grey), fitted (pink line); (B) liquid dispersion of
Au-NC-Zn3(PO4)2, fitted line (white) and (C) solid powder of Au-NC- Zn3(PO4)2, fitted line (white).
A C B

S-8
Table S1. Decay parameters of BSA-Au-NC before digestion and following digestion, when
excited with laser at 375 nm.
Discussions: The BSA-Au-NC underwent a drop in fluorescence lifetime from 1.50 μs to 0.99
μs (Fig. S4A) upon proteolytic digestion, whereas zinc acetate addition led to increase in the
average lifetime to 1.19 μs and 1.22 μs as recorded for liquid dispersion (Au-NC-Zn3(PO4)2)
(Fig. S4B) and that for solid powder (Fig. S4C) respectively. Decay parameters of the BSA-Au-
NC, digested NC and Au-NC-Zn3(PO4)2 (liquid dispersion and solid powder) are tabulated in
Table S1. Decay curves were fitted using tri-exponential fit function achieving χ2 ~ 1. We
then report the intensity-averaged lifetime (τav) as tabulated in Table S1 using the equation
as below,
where, αi and τi are the pre-exponential factors and excited-state luminescence decay time
of the i-th species, respectively.
Sample A1 (%) τ (ns) A2(%) τ (ns) A3(%) τ (ns) τav(μs)
BSA-Au-
NC
0.93 5.71 5.93 205.59 93.14 1 1512.4 1.50
Digested BSA-Au- NC
1.61 2.88 9.65 135.47 88.73 1004.3 0.99
Au-NC- Zn3(PO4)2
(liquid)
1.56 4.68 115.07 226.45 83.36 1229.5 1.19
Au-NC- Zn3(PO4)2
(solid)
4.89 25 337.65 250.68 57.46 1343 1.22
iii
iii
2
av
S-9
3.1 UV-Vis Study:
BSA Au NC showed a characteristic absorption peak at ~ 280 nm attributed to the aromatic
ring of tryptophan group in BSA (Fig. 1C (a)). The absorption increased following proteolytic
digestion of BSA-Au-NC as seen in Fig. 1C (b). This is possibly due to change in the
microenvironment surrounding the NC core upon digestion. The aromatic group of
the tryptophan moiety, buried inside the hydrophobic environment in the protein
was thus exposed to more polar aqueous environment, resulting in increase in
extinction.3 Further, the peak nearly disappeared upon zinc acetate addition (Fig.
1C(c)). This might be due to complexation between oppositely charged zinc ion and
protein fragments (containing tryptophan residues) thus stabilising the Au NC core.
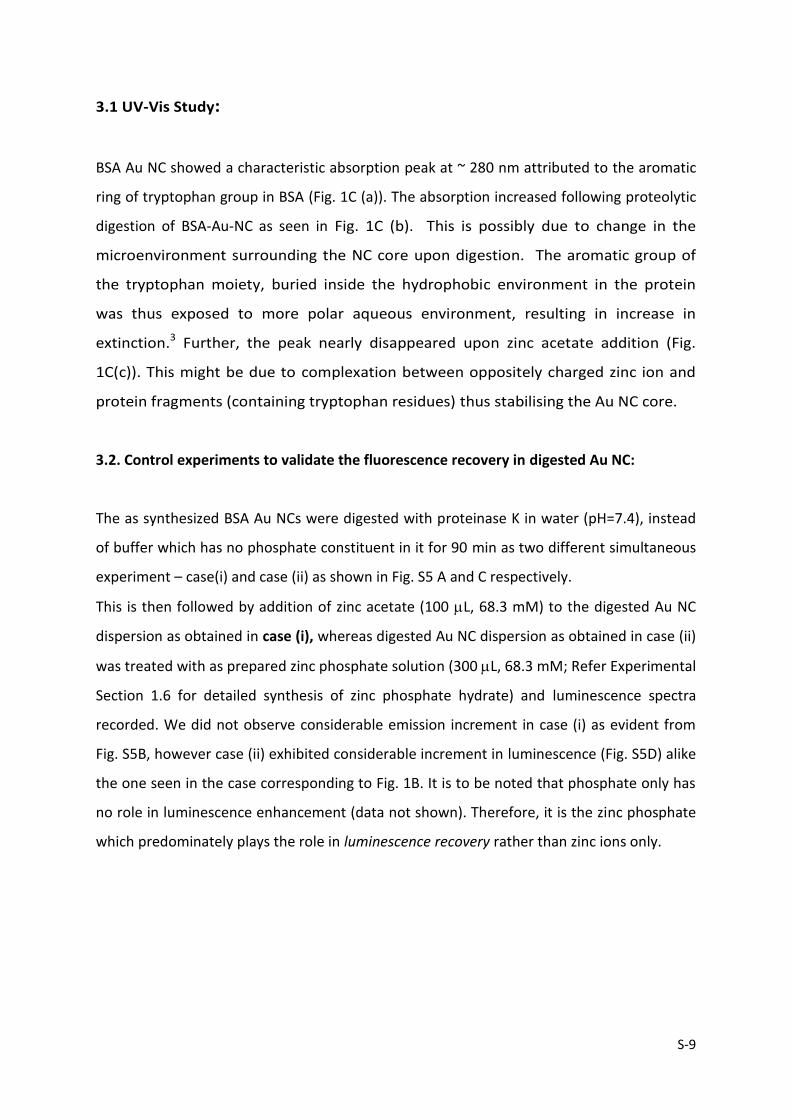
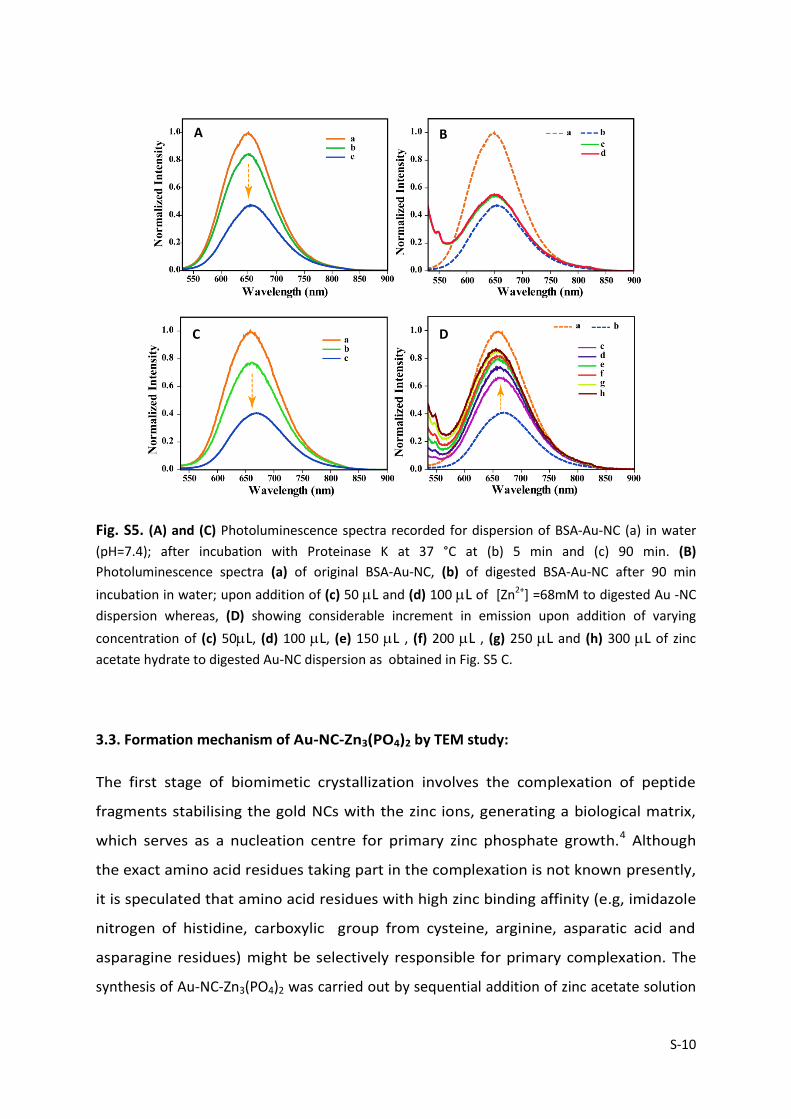
3.2. Control experiments to validate the fluorescence recovery in digested Au NC:
The as synthesized BSA Au NCs were digested with proteinase K in water (pH=7.4), instead
of buffer which has no phosphate constituent in it for 90 min as two different simultaneous
experiment – case(i) and case (ii) as shown in Fig. S5 A and C respectively.
This is then followed by addition of zinc acetate (100 L, 68.3 mM) to the digested Au NC
dispersion as obtained in case (i), whereas digested Au NC dispersion as obtained in case (ii)
was treated with as prepared zinc phosphate solution (300 L, 68.3 mM; Refer Experimental
Section 1.6 for detailed synthesis of zinc phosphate hydrate) and luminescence spectra
recorded. We did not observe considerable emission increment in case (i) as evident from
Fig. S5B, however case (ii) exhibited considerable increment in luminescence (Fig. S5D) alike
the one seen in the case corresponding to Fig. 1B. It is to be noted that phosphate only has
no role in luminescence enhancement (data not shown). Therefore, it is the zinc phosphate
which predominately plays the role in luminescence recovery rather than zinc ions only.
S-10
Fig. S5. (A) and (C) Photoluminescence spectra recorded for dispersion of BSA-Au-NC (a) in water
(pH=7.4); after incubation with Proteinase K at 37 °C at (b) 5 min and (c) 90 min. (B)
Photoluminescence spectra (a) of original BSA-Au-NC, (b) of digested BSA-Au-NC after 90 min
incubation in water; upon addition of (c) 50 L and (d) 100 L of [Zn2+] =68mM to digested Au -NC
dispersion whereas, (D) showing considerable increment in emission upon addition of varying
concentration of (c) 50L, (d) 100 L, (e) 150 L , (f) 200 L , (g) 250 L and (h) 300 L of zinc
acetate hydrate to digested Au-NC dispersion as obtained in Fig. S5 C.
3.3. Formation mechanism of Au-NC-Zn3(PO4)2 by TEM study:
The first stage of biomimetic crystallization involves the complexation of peptide
fragments stabilising the gold NCs with the zinc ions, generating a biological matrix,
which serves as a nucleation centre for primary zinc phosphate growth.4 Although
the exact amino acid residues taking part in the complexation is not known presently,
it is speculated that amino acid residues with high zinc binding affinity (e.g, imidazole
nitrogen of histidine, carboxylic group from cysteine, arginine, asparatic acid and
asparagine residues) might be selectively responsible for primary complexation. The
synthesis of Au-NC-Zn3(PO4)2 was carried out by sequential addition of zinc acetate solution
A
D C
B

S-11
(300 L, 68.3 mM) to digested Au-NC dispersion as previously discussed. The growth was
monitored by extracting aliquots at different time of [Zn2+] addition and probing them
through transmission electron microscopy studies. Initial addition of [Zn2+], (100 L, 68.3
mM) to the digested Au-NC in phosphate buffer induced a metal mediated irregular
crosslinking via electrostatic and coordinative interaction with the protein fragments
stabilising the Au-NC cores. This is evident from the TEM image Fig. 2B recorded after
initial addition of 100 L (68 mM) zinc acetate solution at 4 min of reaction time. This
led to partial emission recovery as depicted from Fig. 1B. Further, successive addition
of zinc acetate i.e, 200 L (68.3 mM) led to additional increase in emission intensity
indicative of further reaction of zinc ion with the peptide fragments stabilising the
Au-NC cores. TEM image obtained at this stage (8 min) of reaction represented an
intermediate metastable phase (no characteristic SAED pattern seen, Fig. S6) with the
same surface morphology (Fig. 2D) as that seen in the initial stage. It was further
observed that the size of the structures increased with time and concentration of the
zinc salt. This stage marked the first step towards the transformation from
amorphous into the thermodynamically stable crystalline phase. This is in accordance
with the Ostwald’s rule5 where a least stable (amorphous) state transformed through
an intermediate metastable state by small loss of free energy, before reaching the
thermodynamically stable state. At this stage, appearance of white cloudy suspension
was observed due to increasing zinc ion concentration in the medium. Hence, final
addition of 300 L of [Zn2+]=68.3 mM lead to a supersaturated state during which
thermodynamically stable zinc phosphate decorated with Au-NCs was formed that
precipitated out within 20 min of reaction time. TEM image in Fig. 2E (manuscript) clearly
depicted the final morphology of as synthesized Au-NC embedded zinc phosphate
taken at 20 min of reaction time. The degree of supersaturation is governed by the
metal induced nucleation rate which leads to precipitation. Thus overall process
represents a fast transition from amorphous to crystalline state in solution within 20
minutes of reaction time at 27 °C.6
S-12
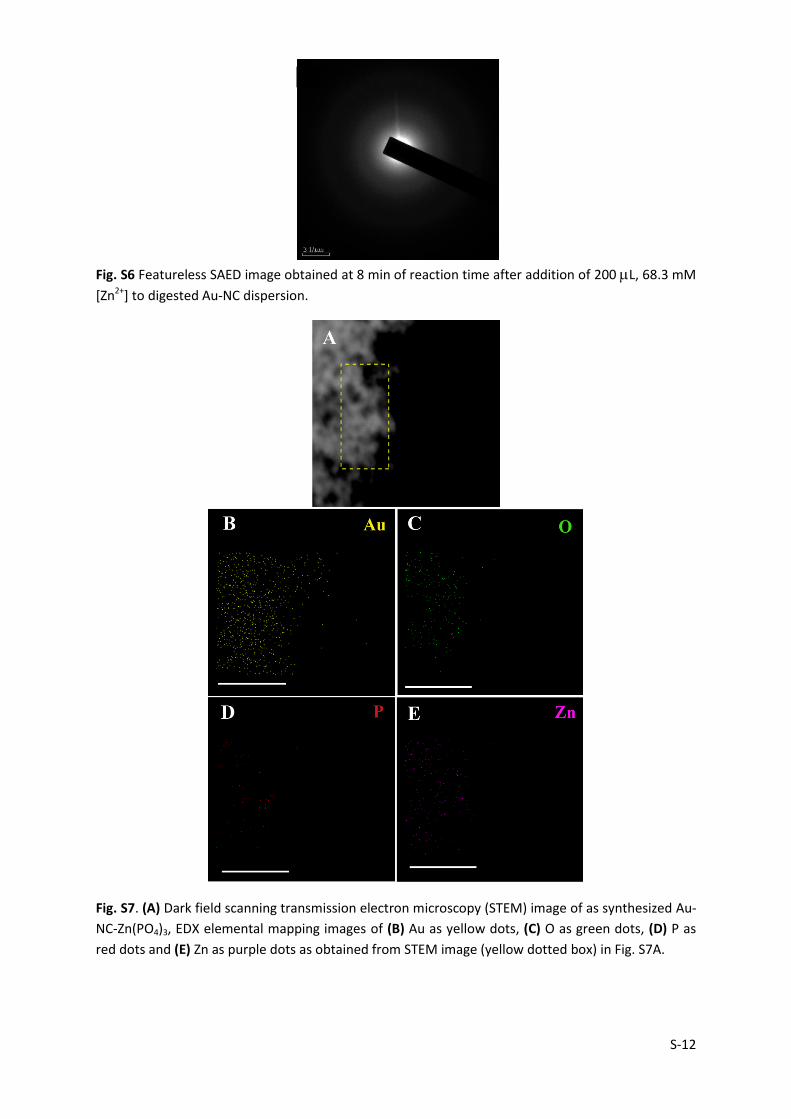
Fig. S6 Featureless SAED image obtained at 8 min of reaction time after addition of 200 L, 68.3 mM
[Zn2+] to digested Au-NC dispersion.
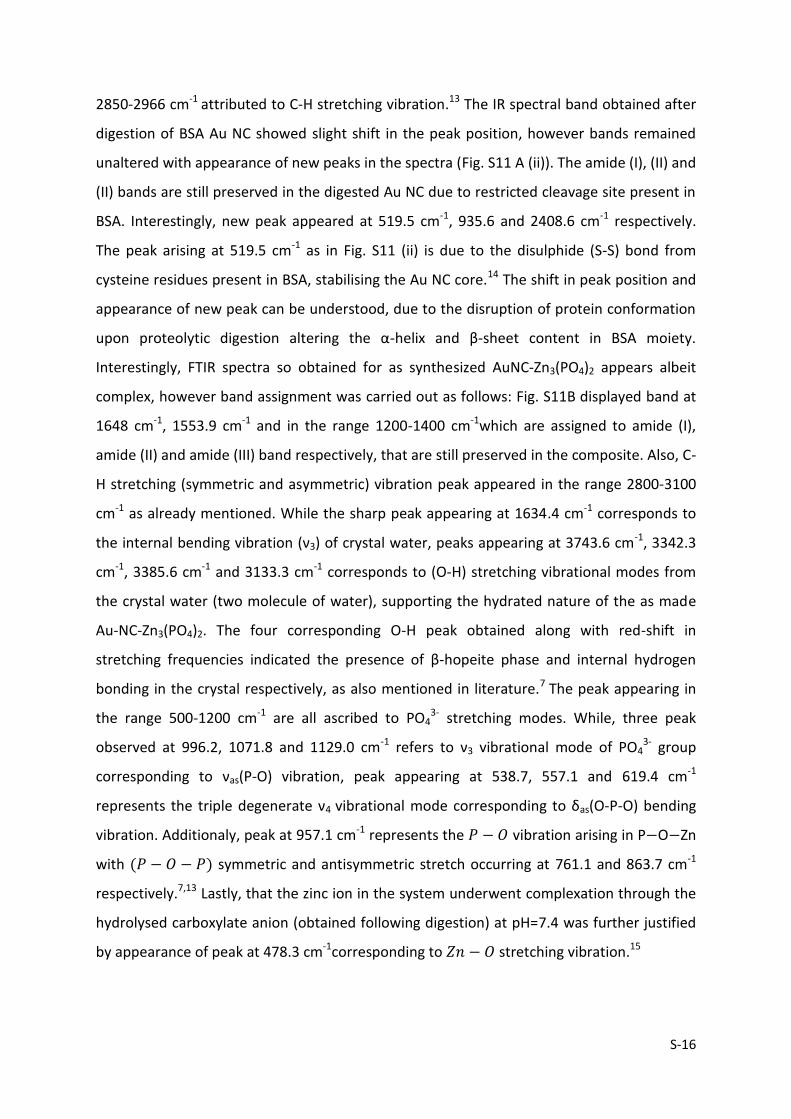
Fig. S7. (A) Dark field scanning transmission electron microscopy (STEM) image of as synthesized Au-
NC-Zn(PO4)3, EDX elemental mapping images of (B) Au as yellow dots, (C) O as green dots, (D) P as
red dots and (E) Zn as purple dots as obtained from STEM image (yellow dotted box) in Fig. S7A.

S-13
Fig. S8. (A) SAED pattern of as synthesized Au-NC-Zn3(PO4)2 , (B) HRTEM image of as synthesized Au-
NC-Zn3(PO4)2 showing lattice plane corresponding to zinc phosphate; Inset: IFFT image representing
the lattice spacing corresponding to hopeite (321) plane, and (C) Powder X-ray diffraction pattern of
Au-NC-Zn3(PO4)2.
3.4. Thermogravimetric and Differential Scanning Calorimetric Analysis :
The first endothermic region from 79 – 120 ℃, can be attributed to loss of physisorbed
water at an early stage from 79 – 100 °C followed by first dehydration step forming unstable
trihydrate intermediate (due to loss of first crystal water molecule) confirming the existence
of β-hopeite phase (Fig. S9). Although no clear gradation was seen for the water loss in TGA
curve, a slight drop down at 230 ℃ marked the complete loss of second water molecule
reaching the dihydrate state followed by loss of the rest crystal water.7 A weak transition at
375 °C in the TGA curve marked the start of decomposition of peptide fragments from BSA
moiety and phosphate groups followed by sharp transition in the temperature range 520-
579 °C indicating complete decomposition due to carbonization of organic-inorganic
moieties at that temperature range.8,9 Further, DSC thermogram of Zn3(PO4)2.4H2O
0.27 nm
(321)

S-14
polycrystal, clearly distinguished the four step water loss which matched with the
characteristic thermogram of β-hopeite. The onset temperature of thermal decomposition
appeared at 121 ℃ (Fig. S10) as evident from DSC thermogram with a broad endothermic
peak appearing at 162 ℃ due to loss of one water molecule, corresponding to an unstable
trihydrate structure. This was followed by a sharp peak at 184 ℃, corresponding to loss of
second molecule of water. Finally the dihydrate to anhydrous state transition was confirmed
by appearance of two peak at 223℃ and 265℃ (Fig. S10) featuring the β-hopeite phase,
which is mostly favoured at lower reaction temperature (< 30 ℃).7
Fig. S9. Thermogravimetric analysis of Au-NC-Zn3(PO4)2.

S-15
Fig. S10. Differential scanning calorimetry thermogram of Au-NC-Zn3(PO4)2.
3.5. FTIR analysis:
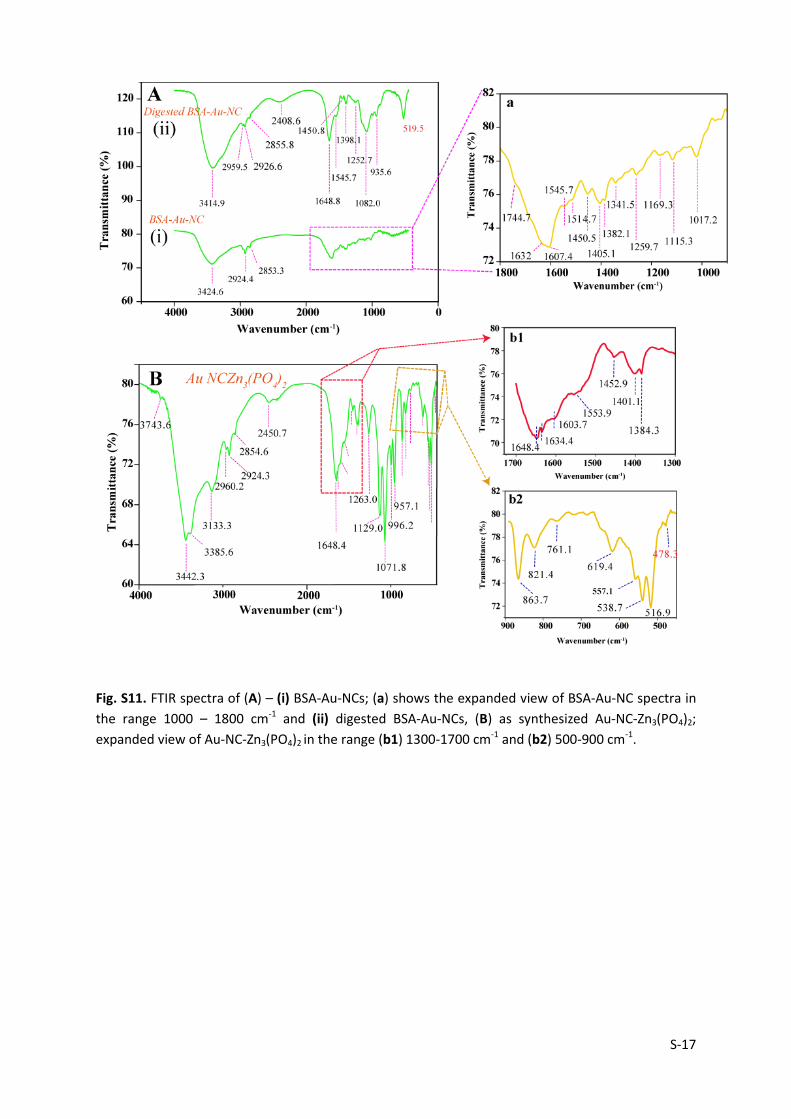
BSA-Au-NC shows characteristic band at 1632 cm-1 (amide I), arising due to 𝐶 = 𝑂
stretching vibration along with out of plane 𝐶 − 𝑁 stretching vibration. (Fig. S11 A) Band at
1545 cm-1 (amide II) corresponds to out- of-phase combination of 𝑁 − 𝐻 in plane bend
combined with 𝐶 − 𝑁 stretching vibration. The peak in the range 1200-1400 cm-1 (amide III)
is attributed to in-phase combination of 𝑁 − 𝐻 bend and 𝐶 − 𝑁 stretching vibration (1259.7
cm-1) with minor contribution from 𝐶 − 𝑂 in-plane bending.10 The band appearing at 1744.7
cm-1 corresponds to 𝐶 = 𝑂 stretch of COOH group of amino acids. The band at 1405.1 cm-1
and 1607 cm-1 can be assigned to the symmetric stretching mode str in COO- group and
aromatic (𝐶 = 𝐶) bond respectively,11,12 whereas band at 1450.5 cm-1 can be ascribed to CH2
bending mode of the alkyl chain in amino acid. (See enlarged view - from a select region in
pink dotted box of Fig. S11 A(i)) While the peak appearing at 1169.7 cm-1 is assigned to
𝐶 − 𝑂 stretch due to tyrosine residues,12 a broad band seen in the range 500-850 cm-1 and
1000-1120 cm-1 is due to N-H bending modes of primary amide. A broad band appearing at
3424.6 cm-1 is ascribed to O-H and N-H stretching vibrations along with peaks in the range
S-16
2850-2966 cm-1 attributed to C-H stretching vibration.13 The IR spectral band obtained after
digestion of BSA Au NC showed slight shift in the peak position, however bands remained
unaltered with appearance of new peaks in the spectra (Fig. S11 A (ii)). The amide (I), (II) and
(II) bands are still preserved in the digested Au NC due to restricted cleavage site present in
BSA. Interestingly, new peak appeared at 519.5 cm-1, 935.6 and 2408.6 cm-1 respectively.
The peak arising at 519.5 cm-1 as in Fig. S11 (ii) is due to the disulphide (S-S) bond from
cysteine residues present in BSA, stabilising the Au NC core.14 The shift in peak position and
appearance of new peak can be understood, due to the disruption of protein conformation
upon proteolytic digestion altering the α-helix and β-sheet content in BSA moiety.
Interestingly, FTIR spectra so obtained for as synthesized AuNC-Zn3(PO4)2 appears albeit
complex, however band assignment was carried out as follows: Fig. S11B displayed band at
1648 cm-1, 1553.9 cm-1 and in the range 1200-1400 cm-1which are assigned to amide (I),
amide (II) and amide (III) band respectively, that are still preserved in the composite. Also, C-
H stretching (symmetric and asymmetric) vibration peak appeared in the range 2800-3100
cm-1 as already mentioned. While the sharp peak appearing at 1634.4 cm-1 corresponds to
the internal bending vibration (ν3) of crystal water, peaks appearing at 3743.6 cm-1, 3342.3
cm-1, 3385.6 cm-1 and 3133.3 cm-1 corresponds to (O-H) stretching vibrational modes from
the crystal water (two molecule of water), supporting the hydrated nature of the as made
Au-NC-Zn3(PO4)2. The four corresponding O-H peak obtained along with red-shift in
stretching frequencies indicated the presence of β-hopeite phase and internal hydrogen
bonding in the crystal respectively, as also mentioned in literature.7 The peak appearing in
the range 500-1200 cm-1 are all ascribed to PO43- stretching modes. While, three peak
observed at 996.2, 1071.8 and 1129.0 cm-1 refers to ν3 vibrational mode of PO43- group
corresponding to νas(P-O) vibration, peak appearing at 538.7, 557.1 and 619.4 cm-1
represents the triple degenerate ν4 vibrational mode corresponding to δas(O-P-O) bending
vibration. Additionaly, peak at 957.1 cm-1 represents the 𝑃 − 𝑂 vibration arising in P−O−Zn
with (𝑃 − 𝑂 − 𝑃) symmetric and antisymmetric stretch occurring at 761.1 and 863.7 cm-1
respectively.7,13 Lastly, that the zinc ion in the system underwent complexation through the
hydrolysed carboxylate anion (obtained following digestion) at pH=7.4 was further justified
by appearance of peak at 478.3 cm-1corresponding to 𝑍𝑛 − 𝑂 stretching vibration.15
S-17
Fig. S11. FTIR spectra of (A) – (i) BSA-Au-NCs; (a) shows the expanded view of BSA-Au-NC spectra in
the range 1000 – 1800 cm-1 and (ii) digested BSA-Au-NCs, (B) as synthesized Au-NC-Zn3(PO4)2;
expanded view of Au-NC-Zn3(PO4)2 in the range (b1) 1300-1700 cm-1 and (b2) 500-900 cm-1.
S-18
3.6. Control experiments validating role of peptide fragments as structure directing agent.
Case (i) Native BSA-Au-NC dispersion (5 mg/mL, 100 L) was taken in phosphate
buffer (2.3 mL) solution, and then zinc acetate (300 L, 69.3 mM) were added to the buffer
mixture at 37 °C successively (Refer experimental section 1.5) and mixed rapidly. In this
case, the Au-NC seems to remain scattered in the zinc acetate-phosphate buffer matrix with
undefined morphology as revealed from TEM image Fig. S12A. In addition, no characteristic
SAED features (Fig. S12B) corresponding to zinc phosphate formation were seen.
Case (ii) 100 L (50 mg/mL) native BSA solution in 2.3 mL phosphate buffer medium
was mixed and then digested with proteinase K at 37 °C for 90 min. This was then followed
by sequential addition of zinc acetate salt solution (300 L 68.3 mM). Fig. S12C shows the
TEM image of the zinc phosphate obtained by digestion of native BSA in phosphate buffer,
which is similar to the one obtained from digestion of BSA-Au-NC (Fig. 2E). Fig. S12D is the
magnified view from a select region of Fig. S12C.
Case (iii) Zn2+ ions (300 L, 69.3 mM) were added successively to the phosphate
buffer solution (2.3 mL) at 37 °C and mixed rapidly. Interestingly, in this case, micron sized
and star shaped structures with plated wings were formed as revealed from FESEM images
(Fig. S12E). Fig. S12F is the magnified view of star shaped zinc phosphate nanostructure. XRD
analysis of the same evidenced the formation of orthorhombic zinc phosphate tetrahydrate
in situ.
Hence, the peptide fragments bearing specific amino acids plays important role in
directing the size and morphology of the zinc phosphate from micrometer to nanometer
size range. Plausibly, the structure directing property of amine moieties might arise from the
coulombic attraction between the positively charged amine moieties e.g., histidine16 (system
pH= 6.26) present in the peptide fragments and negatively charged phosphate group. Also,
contribution from metal – amino acid coordination and hydrogen bond cannot be neglected.
B C A D

S-19
Fig. S12. (A) Low magnification TEM image (Inset: High magnification image from select region of
(A)) and (B) SAED image (scale size = 2 nm-1) of 300 L zinc acetate dihydrate (68.3 mM) treated
BSA-Au-NC in phosphate buffer (pH=7.4), (C) TEM image of zinc phosphate (Zn3(PO4)2) obtained after
300 L zinc acetate dihydrate (68.3 mM) treated digested BSA solution at 37 °C for 90 min, (D) high
magnification image from select region of (C), (E) FESEM image of Zn3(PO4)2 obtained by treating
phosphate buffer solution (pH=7.4) with 300 L, [Zn2+] = 68mM showing star shaped structure and
(F) High magnification image of Zn3(PO4)2 from a select region of (E).
C D
A B
E F

S-20
Fig. S13. DLS-based particle size distribution obtained for (a) BSA-Au-NC (red curve), (b) digested
BSA-Au-NC (green curve) and (c) Au-NC- Zn3(PO4)2 (blue curve).
Table S2. Particle size (hydrodynamic diameter) distribution and the corresponding zeta-potential of
BSA-Au-NC, digested BSA-Au-NC and Au-NC- Zn3(PO4)2.
Fig. S14. (A) N2 adsorption and desorption isotherms and (B) differential pore volume against pore
diameter plot obtained from N2 gas desorption isotherm of as synthesized Au-NC- Zn3(PO4)2.
Table S3. Specific surface area, specific pore volume and pore size distribution of Au-NC- Zn3(PO4)2.
Sample Hydrodynamic diameter (d.nm)
Zeta potential (mV)
BSA-Au-NC 10.7±1.5 - 40.7±1.4
Digested Au-NC 6.6±0.8 −
Au-NC- Zn3(PO4)2 503.75±54 - 19.6±1.4
Sample Surface Area (m
2/g)
Pore size distribution (nm)
Pore volume (cc/g)
Au-NC-Zn3(PO4)2 6.394 2-17 0.015

S-21
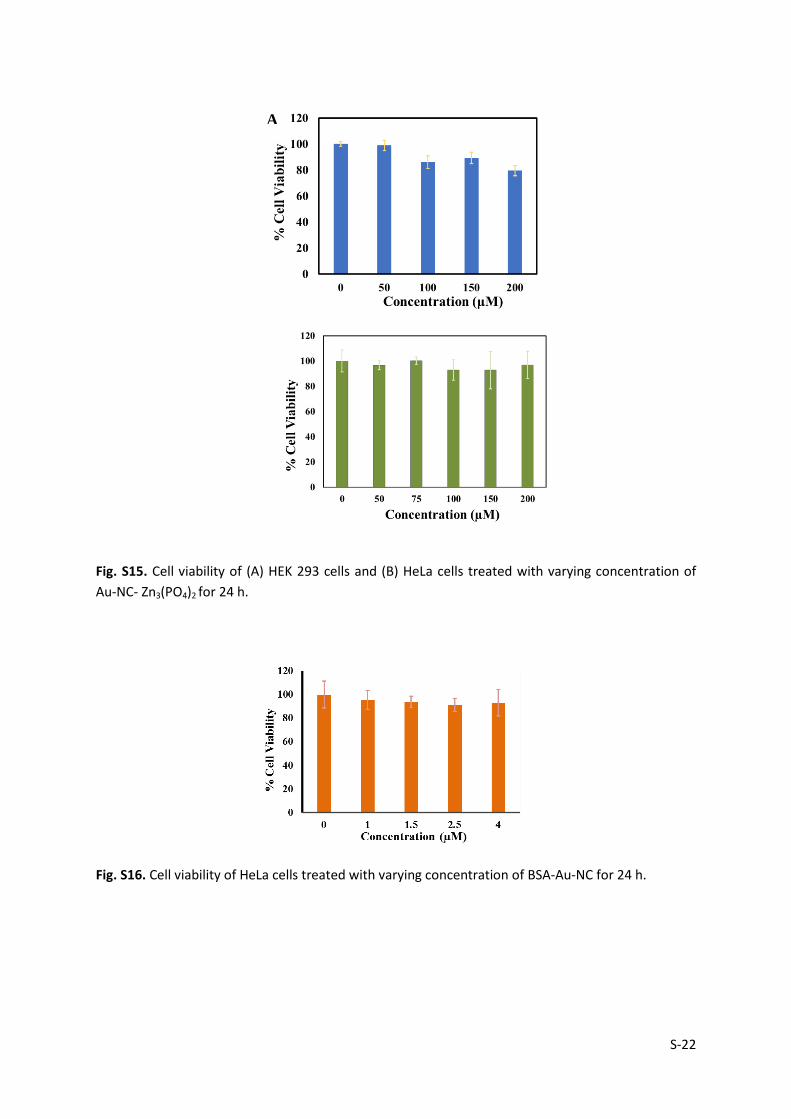
3.7. Cell viability assay:
Cell viability assay was carried out by seeding HeLa cells (5 × 10³ cells/well) in a 96 well
microplate and grown in DMEM medium under 5% CO2 humidified incubator overnight.
Then cells were treated with varying concentrations of BSA-Au-NC (1−4.9 μM with respect
to gold) and Au-NC-Zn3(PO4)2 (50−200 μM, with respect to zinc). For cytotoxicity test of the
composite on normal human cell line, cell viability assay was carried out by seeding HEK 293
cells (5 × 10³ cells/ well) in a 96 well microplate and thereafter cells were treated with
varying concentration of Au-NC-Zn3(PO4)2 (50−200 μM, with respect to zinc). It may be
mentioned here that the gold and zinc contents were estimated by atomic absorption
spectroscopic (AAS) measurements. After 24 h incubation, MTT based cell viability assay was
carried out. The absorbance at 570 nm due to formazan formation in DMSO was recorded
using a TECAN microplate reader. The assay was carried out in triplicates for each
aforementioned concentration of composite. Cell viability was calculated as follow:
where A570 corresponds to absorbance of formazan and A690 arises due to background
interference.
100)(
)(%
690570
690570
cellscontrolofAA
cellstreatedofAAcellviable
S-22
Fig. S15. Cell viability of (A) HEK 293 cells and (B) HeLa cells treated with varying concentration of
Au-NC- Zn3(PO4)2 for 24 h.
Fig. S16. Cell viability of HeLa cells treated with varying concentration of BSA-Au-NC for 24 h.
A

S-23
3.8. Confocal laser scanning microscopic (CLSM) analyses:
For confocal analyses, 1 X 10⁵ HeLa cells/well were seeded onto a microscopic coverslip
placed in a 35 mm culture plate and allowed to grow overnight. The cells were then treated
with as synthesized BSA-Au-NC (4.9 μM), digested Au-NC (4.9 μM), Au-NC-Zn3(PO4)2
composite (204.9 μM with respect to total zinc and gold present) and further incubated for
4 h in humidified atmosphere containing 5 % CO2 at 37 °C. For endocytosis inhibition
experiment, HeLa cells were first treated with 0.1% sodium azide for 10 min followed by
treatment with Au-NC-Zn3(PO4)2 nanocomposite (204.9 μM with respect to total zinc and
gold present) and then incubated under the same condition as described above. For
confocal analyses of the composite on normal human cell line, 1 × 10⁵ HEK 293 cells/well
were seeded onto a microscopic coverslip placed in a 35 mm culture plate and thereafter
treated with Au-NC-Zn3(PO4)2 composites (204.9 μM with respect to total zinc and gold
present) following above described procedure. After this, the cells were washed with PBS
and were fixed with 0.1% formaldehyde and 70% chilled ethanol. Finally the fixed cells were
mounted on a glass microscopic slide and properly sealed. The samples were then imaged
under Zeiss LSM 880 confocal microscope. (λexc = 405 nm).
3.9. Quantitative analysis of the luminescence intensity of the confocal Images
The cellular uptake of Au-NC-Zn3(PO4)2 by HeLa cells in absence and presence of 0.1 %
sodium azide (NaN3) were expressed by the mean luminescence intensity (calculated from
quantitative image analysis of CLSM images (3 different cell images) using Image J software).
To compare the amount of luminescence in respective HeLa cells incubated with (i) Au-
NC,(ii) digested Au-NC and (iii) Au-NC-Zn3(PO4)2, the confocal images so obtained in three
different cases (i-iii) were also independently analysed using Image J software (considering
at least 5 different cells). Then each HeLa cells were selected and background subtracted
corrected total cell fluorescence (CTCF) were measured using Image J software. The mean
luminescence intensity was then obtained by dividing the CTCF by cell area under
consideration. The values obtained from the measurements in each case were then
represented as mean ± standard deviation.17
S-24
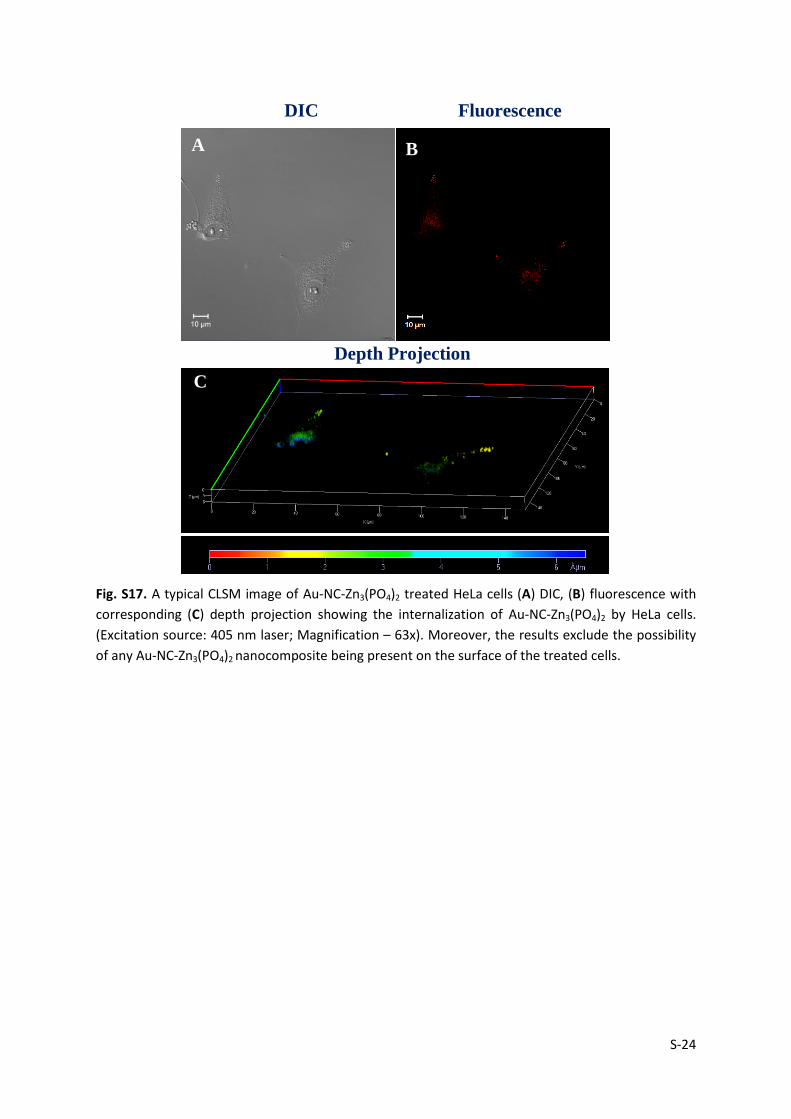
Fig. S17. A typical CLSM image of Au-NC-Zn3(PO4)2 treated HeLa cells (A) DIC, (B) fluorescence with
corresponding (C) depth projection showing the internalization of Au-NC-Zn3(PO4)2 by HeLa cells.
(Excitation source: 405 nm laser; Magnification – 63x). Moreover, the results exclude the possibility
of any Au-NC-Zn3(PO4)2 nanocomposite being present on the surface of the treated cells.
DIC Fluorescence
Fluorescence
Depth Projection
A B
C
S-25
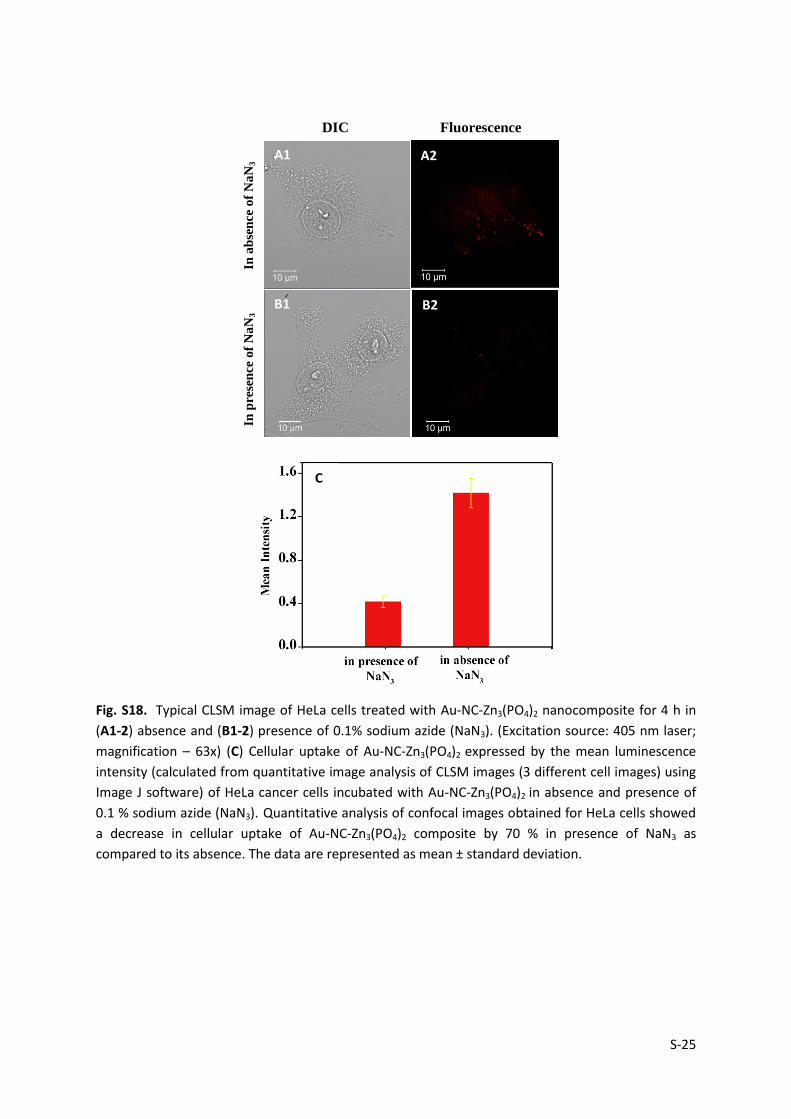
Fig. S18. Typical CLSM image of HeLa cells treated with Au-NC-Zn3(PO4)2 nanocomposite for 4 h in
(A1-2) absence and (B1-2) presence of 0.1% sodium azide (NaN3). (Excitation source: 405 nm laser;
magnification – 63x) (C) Cellular uptake of Au-NC-Zn3(PO4)2 expressed by the mean luminescence
intensity (calculated from quantitative image analysis of CLSM images (3 different cell images) using
Image J software) of HeLa cancer cells incubated with Au-NC-Zn3(PO4)2 in absence and presence of
0.1 % sodium azide (NaN3). Quantitative analysis of confocal images obtained for HeLa cells showed
a decrease in cellular uptake of Au-NC-Zn3(PO4)2 composite by 70 % in presence of NaN3 as
compared to its absence. The data are represented as mean ± standard deviation.
DIC Fluorescence
In
pre
sen
ce o
f N
aN
3
In
ab
sen
ce o
f N
aN
3
Flu
ore
scen
ce
A1 A2
B1 B2
C
S-26
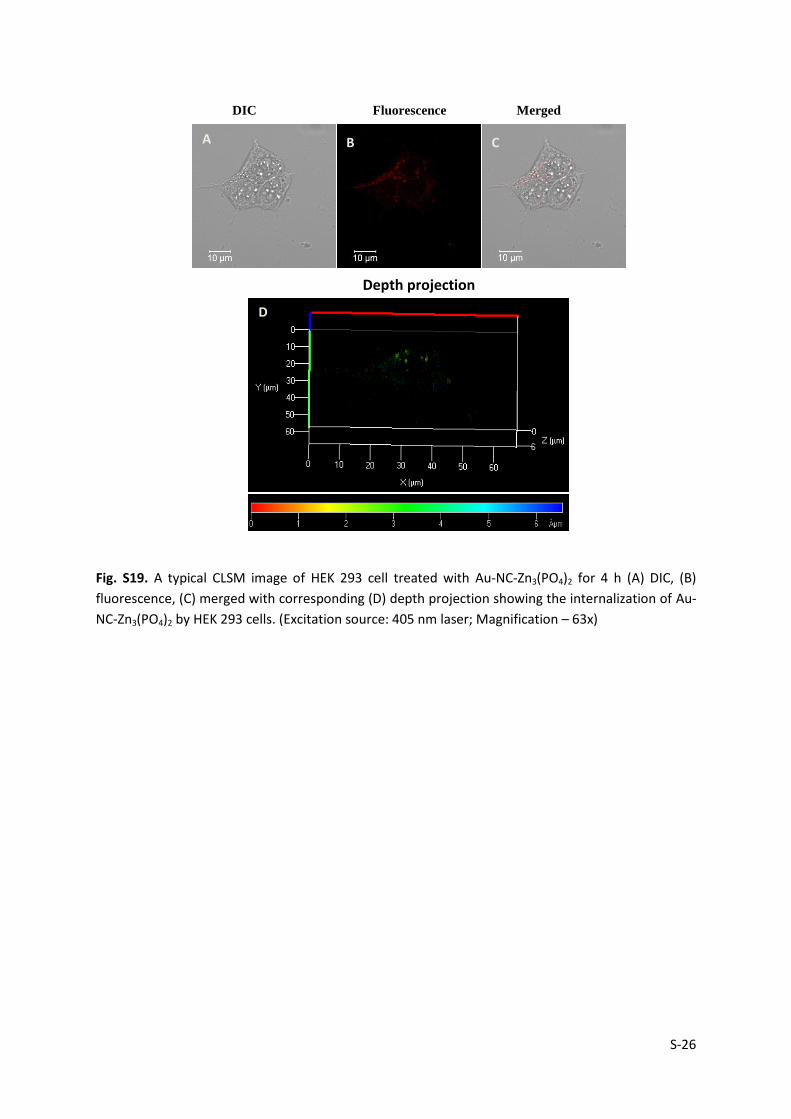
Fig. S19. A typical CLSM image of HEK 293 cell treated with Au-NC-Zn3(PO4)2 for 4 h (A) DIC, (B)
fluorescence, (C) merged with corresponding (D) depth projection showing the internalization of Au-
NC-Zn3(PO4)2 by HEK 293 cells. (Excitation source: 405 nm laser; Magnification – 63x)
A B C
D
DIC Fluorescence Merged
Depth projection
S-27
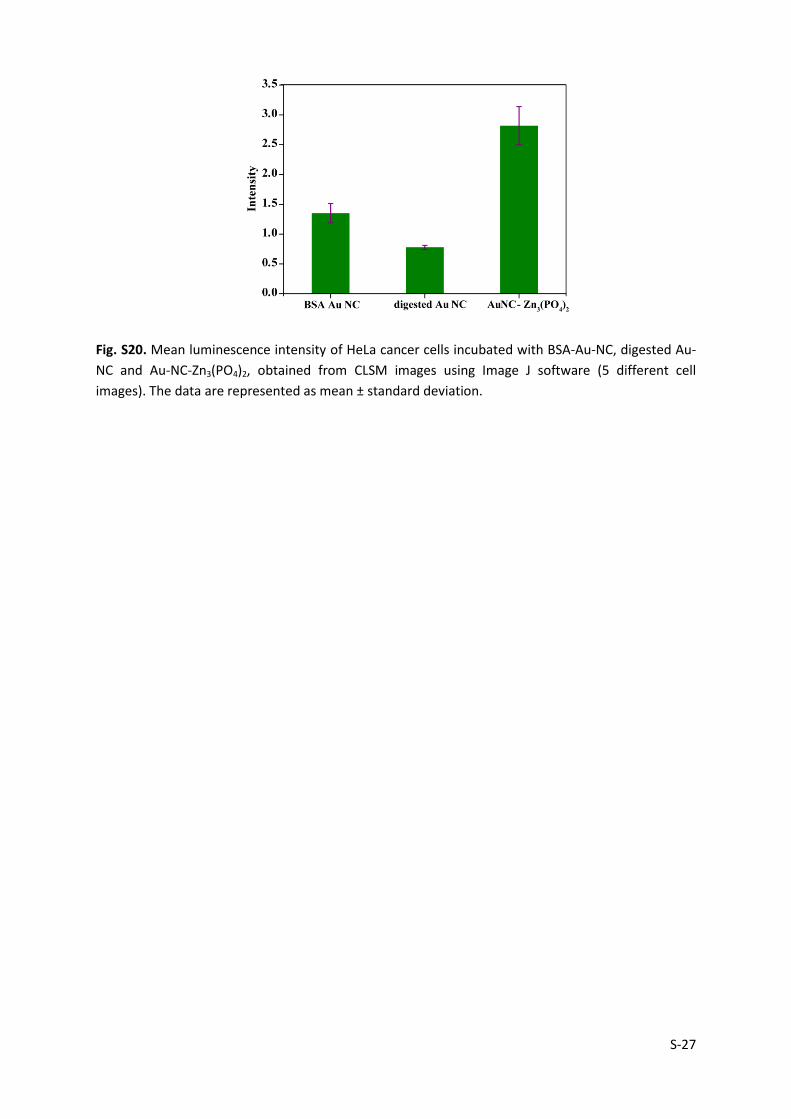
Fig. S20. Mean luminescence intensity of HeLa cancer cells incubated with BSA-Au-NC, digested Au-
NC and Au-NC-Zn3(PO4)2, obtained from CLSM images using Image J software (5 different cell
images). The data are represented as mean ± standard deviation.
S-28
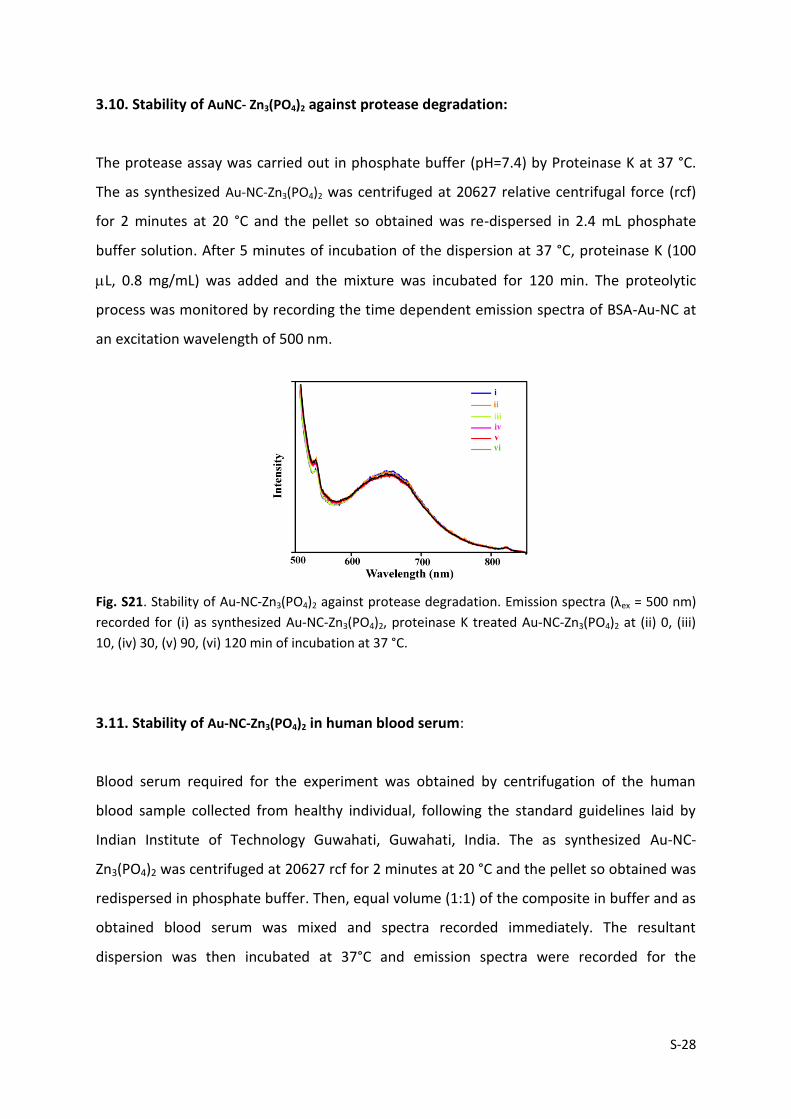
3.10. Stability of AuNC- Zn3(PO4)2 against protease degradation:
The protease assay was carried out in phosphate buffer (pH=7.4) by Proteinase K at 37 °C.
The as synthesized Au-NC-Zn3(PO4)2 was centrifuged at 20627 relative centrifugal force (rcf)
for 2 minutes at 20 °C and the pellet so obtained was re-dispersed in 2.4 mL phosphate
buffer solution. After 5 minutes of incubation of the dispersion at 37 °C, proteinase K (100
L, 0.8 mg/mL) was added and the mixture was incubated for 120 min. The proteolytic
process was monitored by recording the time dependent emission spectra of BSA-Au-NC at
an excitation wavelength of 500 nm.
Fig. S21. Stability of Au-NC-Zn3(PO4)2 against protease degradation. Emission spectra (λex = 500 nm)
recorded for (i) as synthesized Au-NC-Zn3(PO4)2, proteinase K treated Au-NC-Zn3(PO4)2 at (ii) 0, (iii)
10, (iv) 30, (v) 90, (vi) 120 min of incubation at 37 °C.
3.11. Stability of Au-NC-Zn3(PO4)2 in human blood serum:
Blood serum required for the experiment was obtained by centrifugation of the human
blood sample collected from healthy individual, following the standard guidelines laid by
Indian Institute of Technology Guwahati, Guwahati, India. The as synthesized Au-NC-
Zn3(PO4)2 was centrifuged at 20627 rcf for 2 minutes at 20 °C and the pellet so obtained was
redispersed in phosphate buffer. Then, equal volume (1:1) of the composite in buffer and as
obtained blood serum was mixed and spectra recorded immediately. The resultant
dispersion was then incubated at 37°C and emission spectra were recorded for the

S-29
composite at different time intervals at λex=500 nm. As control, emission spectra of the
blood serum only was also recorded at the same excitation.
Fig. S22. Stability of Au-NC-Zn3(PO4)2 in human blood serum. Emission (λex = 500 nm) spectra of Au-
NC-Zn3(PO4)2 in human blood serum at different intervals of time. Inset: emission spectra of human
blood serum only (λex = 500 nm).
References
1. J. Xie, Y. Zheng, J. Y. Ying, J. Am. Chem. Soc., 2009, 131, 888
2. Y. Wang, Y. Wang, F. Zhou, P. Kim, Y. Xia, Small 2012, 8, 3769.
3. J.E Bailey, G.H Beaven, D.A Chignell, W.B Gratzer, Eur. J. Biochem., 1968,7, 5.
4. R. de la Rica, A. H. Velders, J. Am. Chem. Soc. 2011, 133, 2875
5. S. Y. Chung, Y. M. Kim, J. G. Kim, Y. J. Kim, Nature Physics, 2009, 5, 68.
6. S. Bach, V. R. Celinski, M. Dietzsch, M. Panthofer, R. Bienert, F. Emmerling, J. S. auf der Gunne, W.
Tremel, J. Am. Chem. Soc., 2015, 137, 2285.
7. L. Herschke, V. Enkelmann, I.Lieberwirth, G. Wegner, Chem. Eur. J., 2004, 10, 2795.
8. K. Csach, A. Jurikova, J. Miskuf, M. Koneracka, V. Zavisova, M. Kubovcikova, P. Kopcansky, Acta
Physica Polonica A 2012, 121, 1293.
9. A. Gebregeorgi, C. Bhan, O. Wilson, D. Raghavan, J Colloid Interface Sci., 2013, 389, 31.
10. A. Barth, Biochim. Biophys. Acta, Bioenerg. 2007, 1767, 1073.
11. J. Grdadolnik, Y. Marechal, Biopolymers, 2001, 62, 40.
12. R. Mehta, R. Kumari, P.Dasa, A. K. Bhowmick, J. Mater. Chem. B, 2014, 2, 6236.
13. D. Buso, A. J. Hill, T. Colson, H. J. Whitfield, A. Patelli, P. Scopece, C. M. Doherty, P. Falcaro, Cryst.
Growth Des., 2011, 11, 5268.
14. G. Navarra, A. Tinti, M. Leone, V. Militello, A. Torreggiani, J. Inorg. Biochem., 2009, 103, 1729.
15. K.S. Babu, A.R. Reddy, C. Sujatha, V.K. Reddy, A.N. Mallika, J Adv Ceram, 2013, 3, 260.

S-30
16. D. Mekhatria, S. Rigolet, C. Janiak, A. S. Masseron, M. A. Hasnaoui, A. Bengueddach, Crystal Growth &
Design, 2011, 11, 396.
17. L. Yang, L. Shang, G. Ulrich Nienhaus, Nanoscale, 2013, 5, 1537