Embed Size (px)
Citation preview
Defence R&D Canada – Atlantic
Copy No. _____
Defence Research andDevelopment Canada
Recherche et développementpour la défense Canada
Electromagnetic Effects on Radio Frequency
Identification (RFID) Performance
DEFENCE DÉFENSE&
Contract Report
DRDC Atlantic CR 2011-070
July 2011
The scientific or technical validity of this Contract Report is entirely the responsibility of the Contractor and the contents do not necessarily have the approval or endorsement of Defence R&D Canada.
Ammar B. KoukiÉcole de technologie supérieure
Prepared by:École de technologie supérieureDepartment of Electrical Engineering1100, Notre-Dame Street West, Office A2954Montréal, QC Canada H3C 1K3 Contract Project Manager: Dr. Ammar Kouki, 514-396-8554PWGSC Contract Number: W7707-754828CSA: Dr. Nezih Mrad, Defence Scientist, 613-993-6443

This page intentionally left blank.
Electromagnetic Effects on Radio Frequency Identification (RFID) Performance
Ammar B. Kouki École de technologie supérieure Prepared By: École de technologie supérieure Department of Electrical Engineering 1100, Notre-Dame Street West, Office A2954 Montréal, QC Canada H3C 1K3
Contract Project Manager: Dr. Ammar Kouki, 514-396-8554 PWGSC Contract Number: W7707-754828 CSA: Dr. Nezih Mrad, Defence Scientist, 613-993-6443
The scientific or technical validity of this Contract Report is entirely the responsibility of the Contractor and the contents do not necessarily have the approval or endorsement of Defence R&D Canada.
Defence R&D Canada – Atlantic
Contract Report
DRDC Atlantic CR 2011-070
July 2011

Signed by
Original signed by Dr. Nezih Mrad
Dr. Nezih Mrad
Contract Scientific Authority (CSA) / Defence Scientist
Approved by
Original signed by Mr. Ken McRae
Mr. Ken McRae
Head/Air Vehicles Research Section
Approved for release by
Original signed by Ron Kuwahara for
Dr. Calvin Hyatt
DRP/Chair
© Her Majesty the Queen in Right of Canada, as represented by the Minister of National Defence, 2011
© Sa Majesté la Reine (en droit du Canada), telle que représentée par le ministre de la Défense nationale,
2011
DRDC Atlantic CR 2011-070 i
Abstract …
The goal of this study is to assess the impact of changes in the electromagnetic environment,
particularly changes related to the position and conductivity of surrounding materials, on selected
Radio Frequency Identification (RFID) systems’ performance. To this end, two different RFID
tag antennas have been modeled and their electromagnetic performance was simulated in the
presence of various materials situated at varying distances from the antenna. The first structure is
illustrative of UHF RFID antennas, i.e., an antenna operating around 1.8 GHz, while the second is
an HF antenna, operating in the 13 MHz band. Results show that both type of material used and
distance at which it is placed relative to the RFID tag affect significantly the antenna’s resonance
frequency. Further investigations are needed before a full understanding of the effect of adjacent
(host) material, tag antenna design, frequency and gain on the performance of an RFID system is
developed.
Résumé ….
La présente étude vise à évaluer l’incidence des changements dans un environnement
électromagnétique, notamment ceux associés à la position et à la conductivité des matériaux
environnants, sur les performances des systèmes d’identification par radiofréquence (RFID)
choisis. À cet effet, deux antennes d’étiquettes RFID différentes ont été modélisées, et leurs
performances électromagnétiques ont été simulées en présence de divers matériaux placés à des
distances variables de l’antenne. La première structure représente une antenne RFID UHF, qui
fonctionne à une fréquence d’environ 1,8 GHz, et la seconde structure est une antenne HF, qui
fonctionne dans la bande de 13 MHz. Selon les résultats, le type de matériau utilisé et la distance
à laquelle il est placé par rapport à l’étiquette RFID influent tous deux de façon importante sur la
fréquence de résonance de l’antenne. D’autres recherches sont nécessaires pour bien comprendre
l’effet d’un matériau adjacent (hôte), de la conception d’une antenne d’étiquette, de la fréquence
et du gain sur les performances d’un système RFID.

ii DRDC Atlantic CR 2011-070
This page intentionally left blank.
DRDC Atlantic CR 2011-070 iii
Executive summary
Electromagnetic Effects on Radio Frequency Identification (RFID) Performance
Ammar B. Kouki; DRDC Atlantic CR 2011-070; Defence R&D Canada – Atlantic; July 2011.
Introduction: Wireless technology has seen significant development in recent years and its
potential for aerospace applications has captivated the interest of several industries. Recently,
particular interest has focused on the investigation of passive Radio Frequency Identification
(RFID) tags for such applications due to their attractive characteristics that includes reduced size
and weight and no power requirements.
To fully exploit RFID technology for SHM applications, several identified issues affecting the
RFID system performance need to be addressed. This work intends to address some of these
issues, particular issues affecting or impacting tag/reader performance when subjected to an
electromagnetic/conducting environment. Being able to predict RFID system performance,
mainly range, acquisition speed and data capacity in a complex environment, provides a cost
effective decision making on the implementation of the technology.
Results: Electromagnetic analyses illustrated the significant impact on an RFID system
performance when placing conducting material in the vicinity of an RFID tag. These observations
were common to both UHF tags as well as HF tags. For UHF tags, the impact on performance
was visible in terms of a change in the radiation pattern, antenna gain and the input impedance.
For HF tags, the impact was observed in terms of a wide range of variation in the resonance
frequency and input impedance. These results seem to corroborate the experience by some
researchers in the field.
Significance: With the increase in the use of Passive RFID tags, this effort provides advanced
understanding of the use of passive UHF and HF RFID tags near conductive and non-conductive
host materials.
Future plans: Conduct further investigations on the optimized material and tag distance to be
used to provide optimum performance of the RFID system. Additionally, further investigation,
including experimental validation, is required in order to establish clear guidelines on the usage of
RFID tags near conducting surfaces.
iv DRDC Atlantic CR 2011-070
Sommaire ...
Electromagnetic Effects on RFID Performance
Ammar B. Kouki. DRDC Atlantic CR 2011-070, R & D pour la défense Canada – Atlantique, juillet 2011.
Introduction : La technologie sans fil a connu un développement important ces dernières années,
et son potentiel pour les applications aérospatiales a capté l’intérêt de plusieurs industries. Depuis
peu, un intérêt particulier a porté sur l’étude des étiquettes d’identification par radiofréquence
(RFID) passives pour de telles applications en raison de leurs caractéristiques attrayantes qui
comprennent une taille et un poids réduits ainsi que des besoins nuls en électricité.
Pour exploiter pleinement la technologie RFID pour les applications SHM, on doit examiner
plusieurs facteurs qui influent sur les performances des systèmes RFID. Le présent document vise
à examiner certains d’entre eux, notamment ceux qui influent sur les performances des étiquettes
ou des lecteurs d’étiquettes placés dans un environnement électromagnétique ou conducteur. La
capacité de prédiction des performances des systèmes RFID, dont la portée, la vitesse
d’acquisition et la capacité des données dans un environnement complexe, permet une prise de
décision économique sur la mise en œuvre de la technologie.
Résultats : Des analyses électromagnétiques montrent que l’insertion d’un matériau conducteur à
proximité d’une étiquette RFID a un impact important sur les performances des systèmes RFID.
Ces observations s’appliquent à la fois aux étiquettes UHF et aux étiquettes HF. Pour les
étiquettes UHF, on a noté un impact sur les performances en raison de la modification du
diagramme de rayonnement, du gain de l’antenne et de l’impédance d’entrée. Pour les
étiquettes HF, on a observé un impact en raison de la grande variation de la fréquence de
résonance et de l’impédance d’entrée. Ces résultats semblent donc confirmer l’expérience réalisée
par quelques chercheurs dans le domaine.
Portée : En raison de la hausse d’utilisation des étiquettes RFID passives, cette étude permet une
compréhension approfondie de l’utilisation des étiquettes RFID UHF et HF passives à proximité
de matériaux hôtes conducteurs et non conducteurs.
Recherches futures : Il faut réaliser d’autres études sur le meilleur matériau et la meilleure
distance de l’étiquette à utiliser pour obtenir des performances optimales du système RFID. De
plus, d’autres études, y compris une validation expérimentale, sont nécessaires pour établir des
directives claires sur l’utilisation des étiquettes RFID à proximité de surfaces conductrices.

DRDC Atlantic CR 2011-070 v
Table of contents
Abstract … ....................................................................................................................................... i
Résumé …. ....................................................................................................................................... i
Executive summary ........................................................................................................................ iii
Sommaire ..... .................................................................................................................................. iv
Table of contents ............................................................................................................................. v
List of figures ................................................................................................................................ vii
List of tables ................................................................................................................................... xi
Acknowledgements ....................................................................................................................... xii
1 Introduction ............................................................................................................................... 1
2 Methodology ............................................................................................................................. 2
3 Simulations ............................................................................................................................... 5
3.1 UHF antenna – reference structure ................................................................................ 5
3.2 UHF antenna – effect of ground plane .......................................................................... 7
3.3 HF antenna – reference structure ................................................................................... 9
3.4 HF antenna – effect of ground plane ........................................................................... 10
4 Conclusions ............................................................................................................................. 13
References . ................................................................................................................................... 14
Annex A .. UHF Antenna Results .................................................................................................. 15
A.1 Perfect Ground Plane (H = 25 mils) ............................................................................ 15
A.2 Perfect Ground Plane (H = 50 mils) ............................................................................ 16
A.3 Perfect Ground Plane (H = 100 mils) .......................................................................... 17
A.4 Titanium ground plane (H = 25 mils) .......................................................................... 18
A.5 Titanium ground plane (H = 50 mils) .......................................................................... 19
A.6 Titanium ground plane (H = 100 mils) ........................................................................ 20
A.7 Aluminum 2024 – T3 (H = 25 mils) ............................................................................ 21
A.8 Aluminum 2024 – T3 (H = 50 mils) ............................................................................ 22
A.9 Aluminum 2024 – T3 (H = 100 mils) .......................................................................... 23
A.10 Aluminum 7075 – T6 (H = 25 mils) ............................................................................ 24
A.11 Aluminum 7075 – T6 (H = 50 mils) ............................................................................ 25
A.12 Aluminum 7075 – T6 (H = 100 mils) .......................................................................... 26
A.13 Ferromagnetic material (Iron) (H = 25 mils) ............................................................... 27
A.14 Ferromagnetic material (Iron) (H = 50 mils) ............................................................... 28
A.15 Ferromagnetic material (Iron) (H = 100 mils) ............................................................. 29
A.16 Graphite (H = 25 mils) ................................................................................................ 30
A.17 Graphite (H = 50 mils) ................................................................................................ 31
vi DRDC Atlantic CR 2011-070
A.18 Graphite (H = 100 mils) .............................................................................................. 32
A.19 Thermoplastics-PVC (H = 25 mils) ............................................................................. 33
A.20 Thermoplastics-PVC (H = 50 mils) ............................................................................. 34
A.21 Thermoplastics-PVC (H = 100 mils) ........................................................................... 35
A.22 Wood (H = 25 mils) ..................................................................................................... 36
A.23 Wood (H = 50 mils) ..................................................................................................... 37
A.24 Wood (H = 100 mils) ................................................................................................... 38
A.25 Cardboards and paper (H = 25 mils) ........................................................................... 39
A.26 Cardboards and paper (H = 50 mils) ........................................................................... 40
A.27 Cardboards and paper (H = 100 mils) ......................................................................... 41
Annex B ... HF Antenna Results ..................................................................................................... 43
DRDC Atlantic CR 2011-070 vii
List of figures
Figure 1: Layout of a typical RFID antenna. ................................................................................... 2
Figure 2: Typical definition of a substrate in Momentum. .............................................................. 3
Figure 3: Geometry of the UHF dipole antenna. ............................................................................. 5
Figure 4: Input reflection coefficient of the UHF antenna in the absence of a ground plane. ......... 6
Figure 5: 3D model, radiation pattern and antenna parameters of UFH antenna @ 1.85 GHz in
the absence of a ground plane. ...................................................................................... 7
Figure 6: Detailed view of the 3D model of the UHF antenna with a material ground plane. ........ 8
Figure 7: Six turns planar inductor in free space. .......................................................................... 10
Figure 8: Magnitude and imaginary part of the coil’s input impedance. Resonance is
measured at maxim magnitude of the input impedance. ............................................. 10
Figure 9: Detailed view of the 3D model of the HF antenna with a material ground plane. ......... 11
Figure 10: Input reflection coefficient of the UHF antenna with a PEC ground plane at 25
mils. ............................................................................................................................. 15
Figure 11: 3D model, radiation pattern and antenna parameters of UFH antenna @ 1.85 GHz
with a PEC ground plane at 25 mils. ........................................................................... 15
Figure 12: Input reflection coefficient of the UHF antenna with a PEC ground plane at 50
mils. ............................................................................................................................. 16
Figure 13: 3D model, radiation pattern and antenna parameters of UFH antenna @ 1.85 GHz
with a PEC ground plane at 50 mils. ........................................................................... 16
Figure 14: Input reflection coefficient of the UHF antenna with a PEC ground plane at 100
mils. ............................................................................................................................. 17
Figure 15: 3D model, radiation pattern and antenna parameters of UFH antenna @ 1.85 GHz
with a PEC ground plane at 100 mils. ......................................................................... 17
Figure 16: Input reflection coefficient of the UHF antenna with Titanium ground plane at 25
mils. ............................................................................................................................. 18
Figure 17: 3D model, radiation pattern and antenna parameters of UFH antenna @ 1.85 GHz
with a Titanium ground plane at 25 mils. .................................................................... 18
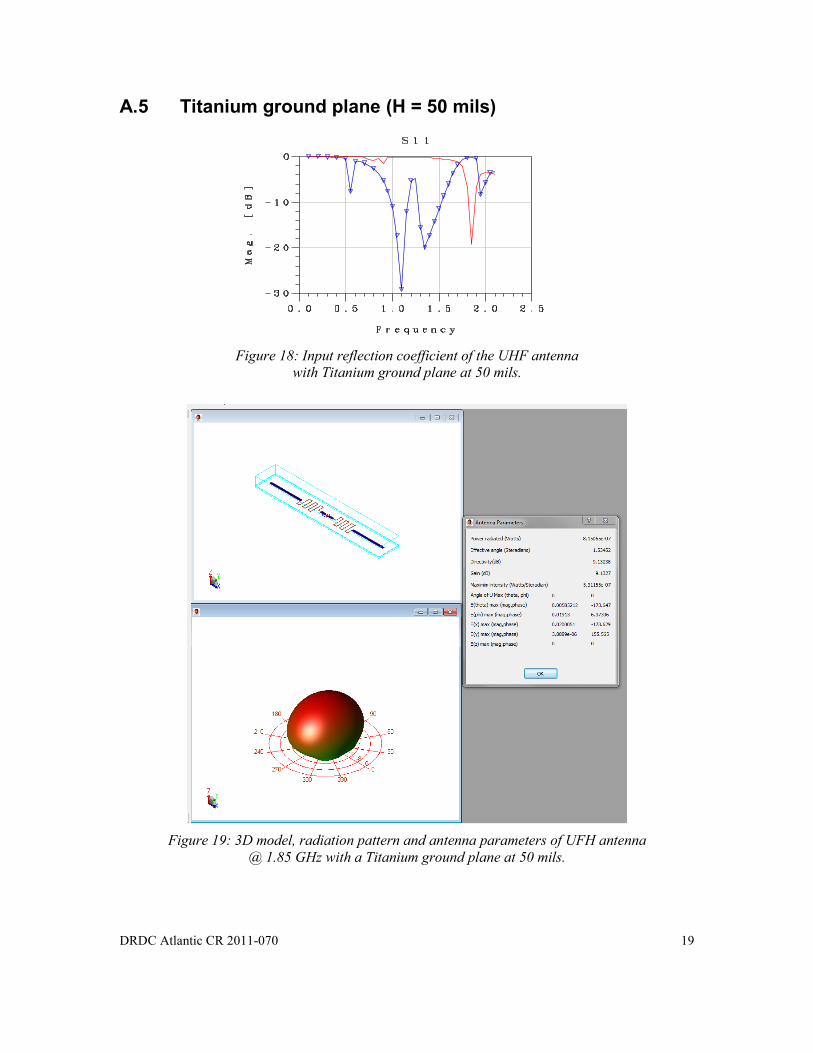
Figure 18: Input reflection coefficient of the UHF antenna with Titanium ground plane at 50
mils. ............................................................................................................................. 19
Figure 19: 3D model, radiation pattern and antenna parameters of UFH antenna @ 1.85 GHz
with a Titanium ground plane at 50 mils. .................................................................... 19
Figure 20: Input reflection coefficient of the UHF antenna with Titanium ground plane at 100
mils. ............................................................................................................................. 20
Figure 21: 3D model, radiation pattern and antenna parameters of UFH antenna @ 1.85 GHz
with a Titanium ground plane at 100 mils. .................................................................. 20
viii DRDC Atlantic CR 2011-070
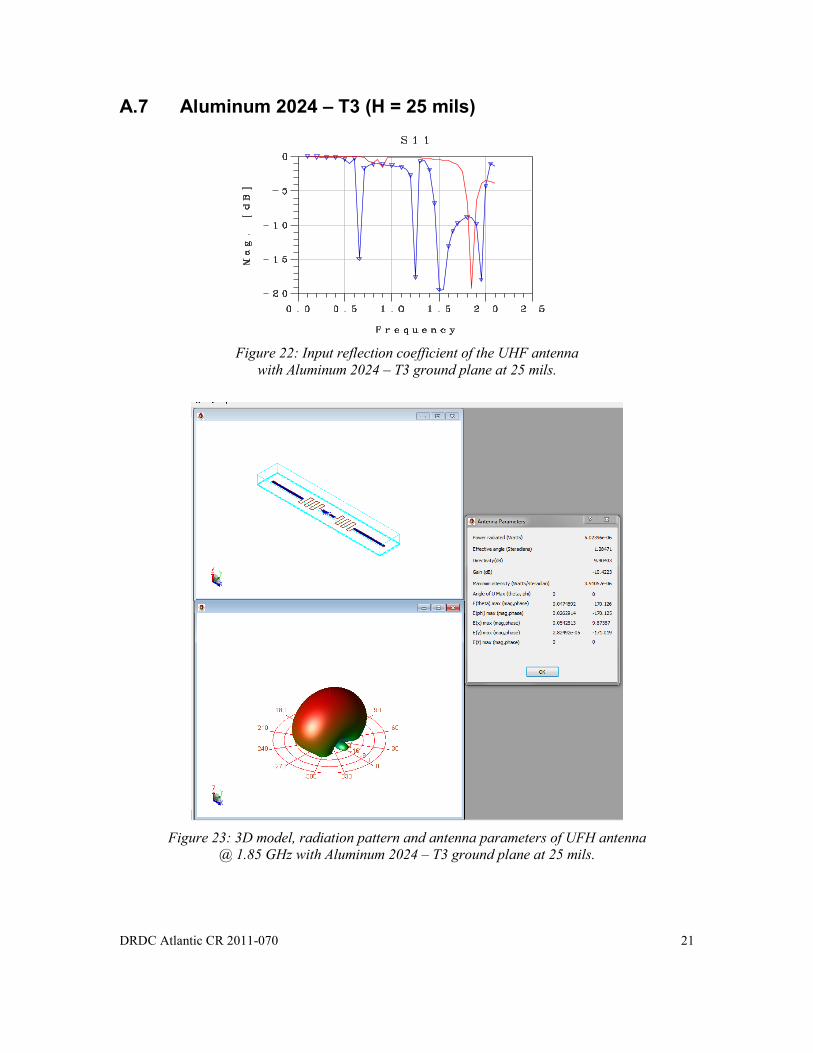
Figure 22: Input reflection coefficient of the UHF antenna with Aluminum 2024 – T3 ground
plane at 25 mils. .......................................................................................................... 21
Figure 23: 3D model, radiation pattern and antenna parameters of UFH antenna @ 1.85 GHz
with Aluminum 2024 – T3 ground plane at 25 mils. .................................................. 21
Figure 24: Input reflection coefficient of the UHF antenna with Aluminum 2024 – T3 ground
plane at 50 mils. .......................................................................................................... 22
Figure 25: 3D model, radiation pattern and antenna parameters of UFH antenna @ 1.85 GHz
with Aluminum 2024 – T3 ground plane at 50 mils. .................................................. 22
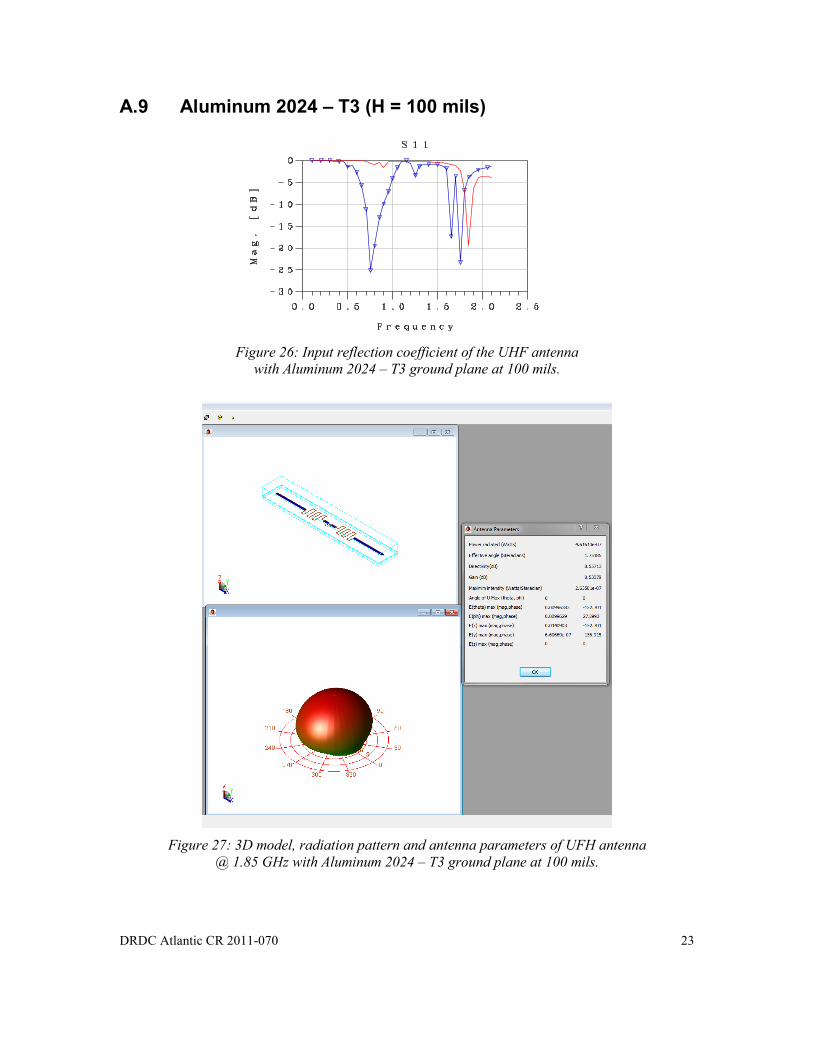
Figure 26: Input reflection coefficient of the UHF antenna with Aluminum 2024 – T3 ground
plane at 100 mils. ........................................................................................................ 23
Figure 27: 3D model, radiation pattern and antenna parameters of UFH antenna @ 1.85 GHz
with Aluminum 2024 – T3 ground plane at 100 mils. ................................................ 23
Figure 28: Input reflection coefficient of the UHF antenna with Aluminum 7075 – T6 ground
plane at 25 mils. .......................................................................................................... 24
Figure 29: 3D model, radiation pattern and antenna parameters of UFH antenna @ 1.85 GHz
with Aluminum 7075 – T6 ground plane at 25 mils. .................................................. 24
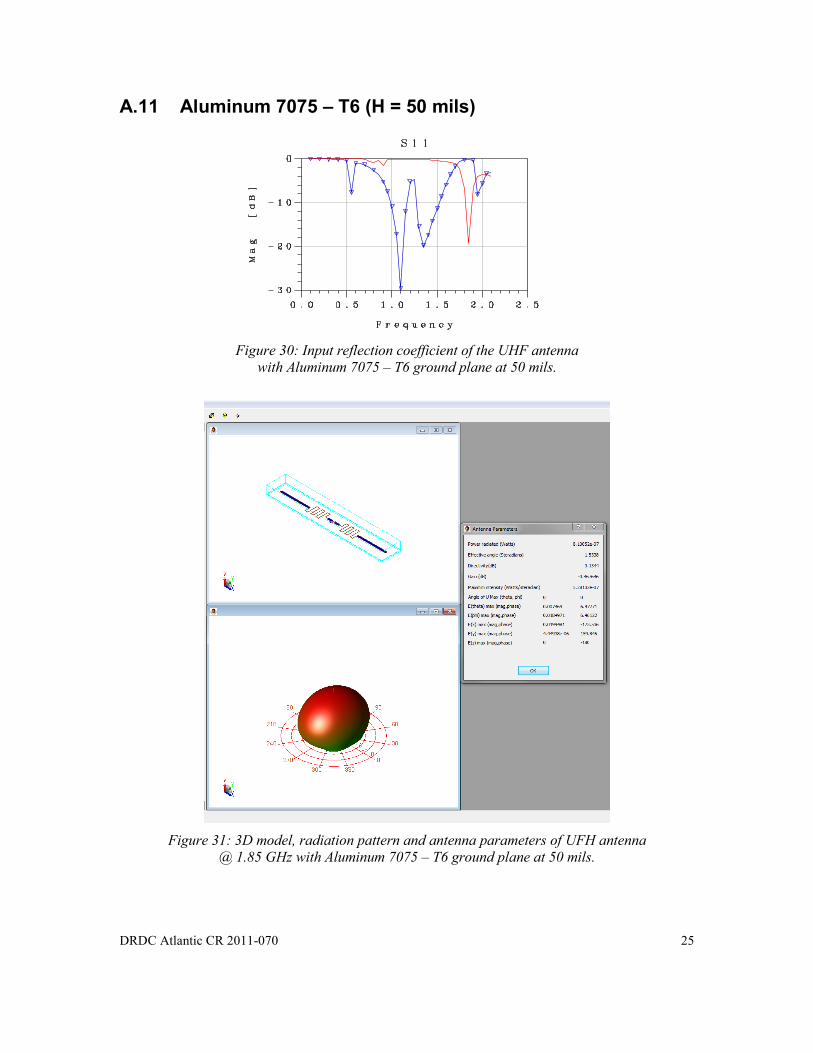
Figure 30: Input reflection coefficient of the UHF antenna with Aluminum 7075 – T6 ground
plane at 50 mils. .......................................................................................................... 25
Figure 31: 3D model, radiation pattern and antenna parameters of UFH antenna @ 1.85 GHz
with Aluminum 7075 – T6 ground plane at 50 mils. .................................................. 25
Figure 32: Input reflection coefficient of the UHF antenna with Aluminum 7075 – T6 ground
plane at 100 mils. ........................................................................................................ 26
Figure 33: 3D model, radiation pattern and antenna parameters of UFH antenna @ 1.85 GHz
with Aluminum 7075 – T6 ground plane at 100 mils. ................................................ 26
Figure 34: Input reflection coefficient of the UHF antenna with Iron ground plane at 25 mils. ... 27
Figure 35: 3D model, radiation pattern and antenna parameters of UFH antenna @ 1.85 GHz
with Iron ground plane at 25 mils. .............................................................................. 27
Figure 36: Input reflection coefficient of the UHF antenna with Iron ground plane at 50 mils. ... 28
Figure 37: 3D model, radiation pattern and antenna parameters of UFH antenna @ 1.85 GHz
with Iron ground plane at 50 mils. .............................................................................. 28
Figure 38: Input reflection coefficient of the UHF antenna with Iron ground plane at 100 mils. . 29
Figure 39: 3D model, radiation pattern and antenna parameters of UFH antenna @ 1.85 GHz
with Iron ground plane at 100 mils. ............................................................................ 29
Figure 40: Input reflection coefficient of the UHF antenna with Graphite ground plane at 25
mils. ............................................................................................................................. 30
Figure 41: 3D model, radiation pattern and antenna parameters of UFH antenna @ 1.85 GHz
with Graphite ground plane at 25 mils. ....................................................................... 30

DRDC Atlantic CR 2011-070 ix
Figure 42: Input reflection coefficient of the UHF antenna with Graphite ground plane at 50
mils. ............................................................................................................................. 31
Figure 43: 3D model, radiation pattern and antenna parameters of UFH antenna @ 1.85 GHz
with Graphite ground plane at 50 mils. ....................................................................... 31
Figure 44: Input reflection coefficient of the UHF antenna with Graphite ground plane at 100
mils. ............................................................................................................................. 32
Figure 45: 3D model, radiation pattern and antenna parameters of UFH antenna @ 1.85 GHz
with Graphite ground plane at 100 mils. ..................................................................... 32
Figure 46: Input reflection coefficient of the UHF antenna with Thermoplastics ground plane
at 25 mils. .................................................................................................................... 33
Figure 47: 3D model, radiation pattern and antenna parameters of UFH antenna @ 1.85 GHz
with Thermoplastics ground plane at 25 mils. ............................................................ 33
Figure 48: Input reflection coefficient of the UHF antenna with Thermoplastics ground plane
at 50 mils. .................................................................................................................... 34
Figure 49: 3D model, radiation pattern and antenna parameters of UFH antenna @ 1.85 GHz
with Thermoplastics ground plane at 50 mils. ............................................................ 34
Figure 50: Input reflection coefficient of the UHF antenna with Thermoplastics ground plane
at 100 mils. .................................................................................................................. 35
Figure 51: 3D model, radiation pattern and antenna parameters of UFH antenna @ 1.85 GHz
with Thermoplastics ground plane at 100 mils. .......................................................... 35
Figure 52: Input reflection coefficient of the UHF antenna with Wood ground plane at 25
mils. ............................................................................................................................. 36
Figure 53: 3D model, radiation pattern and antenna parameters of UFH antenna @ 1.85 GHz
with Wood ground plane at 25 mils. ........................................................................... 36
Figure 54: Input reflection coefficient of the UHF antenna with Wood ground plane at 50
mils. ............................................................................................................................. 37
Figure 55: 3D model, radiation pattern and antenna parameters of UFH antenna @ 1.85 GHz
with Wood ground plane at 50 mils. ........................................................................... 37
Figure 56: Input reflection coefficient of the UHF antenna with Wood ground plane at 100
mils. ............................................................................................................................. 38
Figure 57: 3D model, radiation pattern and antenna parameters of UFH antenna @ 1.85 GHz
with Wood ground plane at 100 mils. ......................................................................... 38
Figure 58: Input reflection coefficient of the UHF antenna with paper ground plane at 25
mils. ............................................................................................................................. 39
Figure 59: 3D model, radiation pattern and antenna parameters of UFH antenna @ 1.85 GHz
with paper ground plane at 25 mils. ............................................................................ 39
Figure 60: Input reflection coefficient of the UHF antenna with paper ground plane at 50
mils. ............................................................................................................................. 40
x DRDC Atlantic CR 2011-070
Figure 61: 3D model, radiation pattern and antenna parameters of UFH antenna @ 1.85 GHz
with paper ground plane at 50 mils. ............................................................................ 40
Figure 62: Input reflection coefficient of the UHF antenna with paper ground plane at 100
mils. ............................................................................................................................. 41
Figure 63: 3D model, radiation pattern and antenna parameters of UFH antenna @ 1.85 GHz
with paper ground plane at 100 mils. .......................................................................... 41
Figure 64: PEC plate at 25 mils. .................................................................................................... 43
Figure 65: PEC plate at 50 mils. .................................................................................................... 43
Figure 66: PEC plate at 100 mils. .................................................................................................. 44
Figure 67: Titanium at 25 mils. ..................................................................................................... 44
Figure 68: Titanium at 50 mils. ..................................................................................................... 45
Figure 69: Titanium at 100 mils. ................................................................................................... 45
Figure 70: Aluminum 2024 – T3 at 25 mils. ................................................................................. 46
Figure 71: Aluminum 2024 – T3 at 50 mils. ................................................................................. 46
Figure 72: Aluminum 2024 – T3 at 100 mils. ............................................................................... 47
Figure 73: Aluminum 7075 – T6 at 25 mils. ................................................................................. 47
Figure 74: Aluminum 7075 – T6 at 50 mils. ................................................................................. 48
Figure 75: Aluminum 7075 – T6 at 100 mils. ............................................................................... 48
Figure 76: Iron at 25 mils. ............................................................................................................. 49
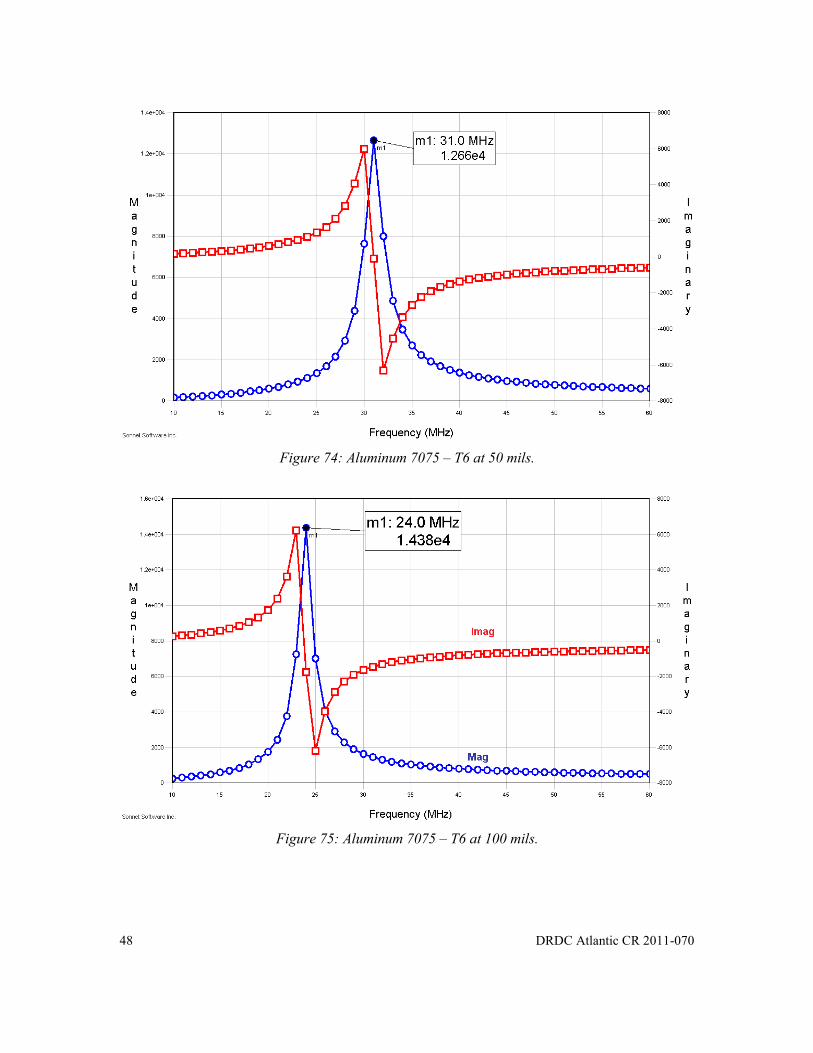
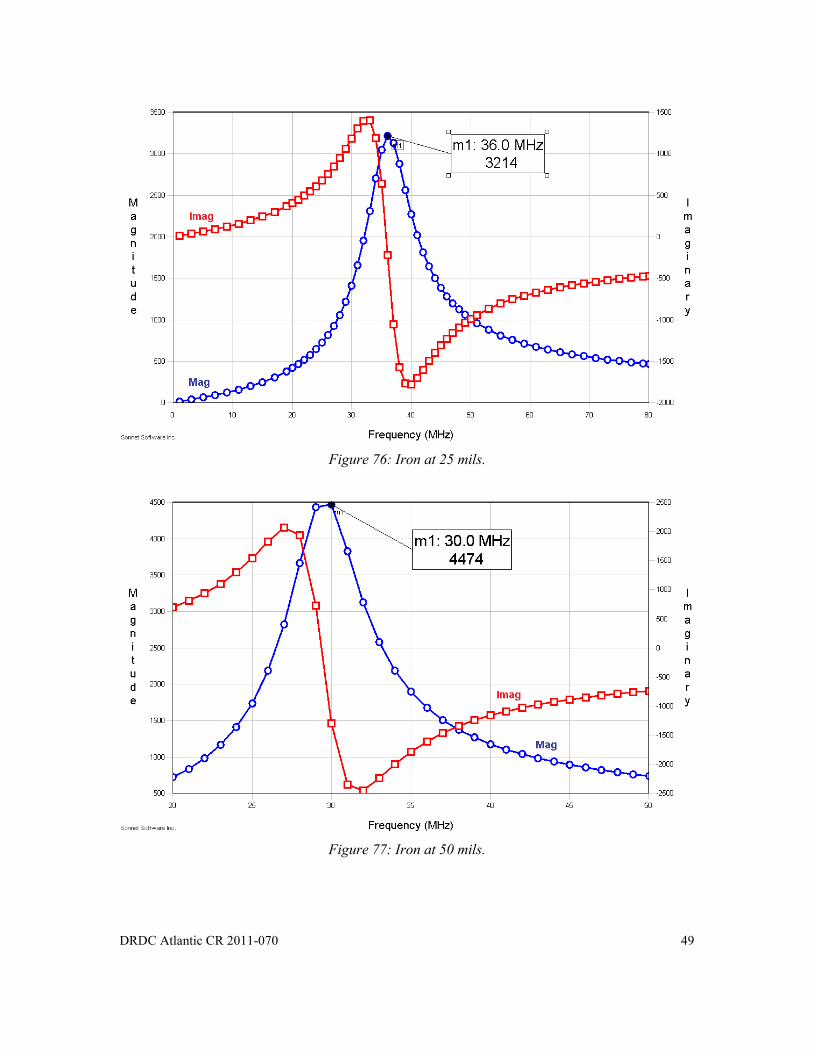
Figure 77: Iron at 50 mils. ............................................................................................................. 49
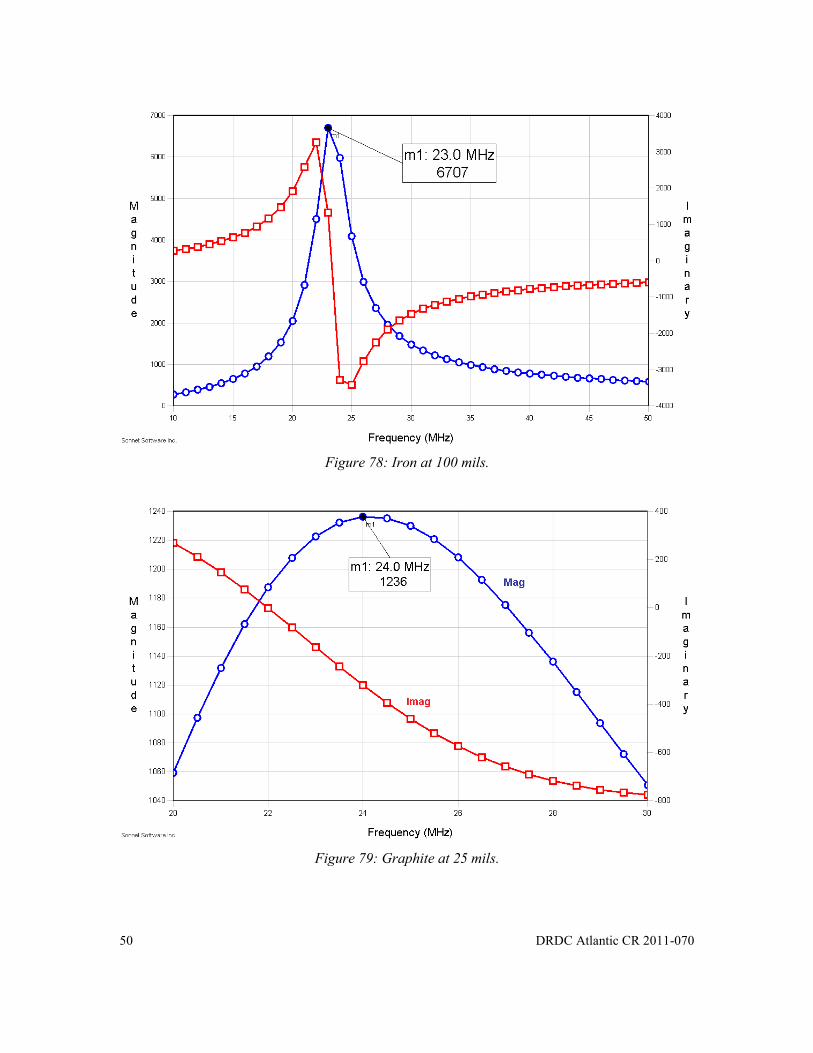
Figure 78: Iron at 100 mils. ........................................................................................................... 50
Figure 79: Graphite at 25 mils. ...................................................................................................... 50
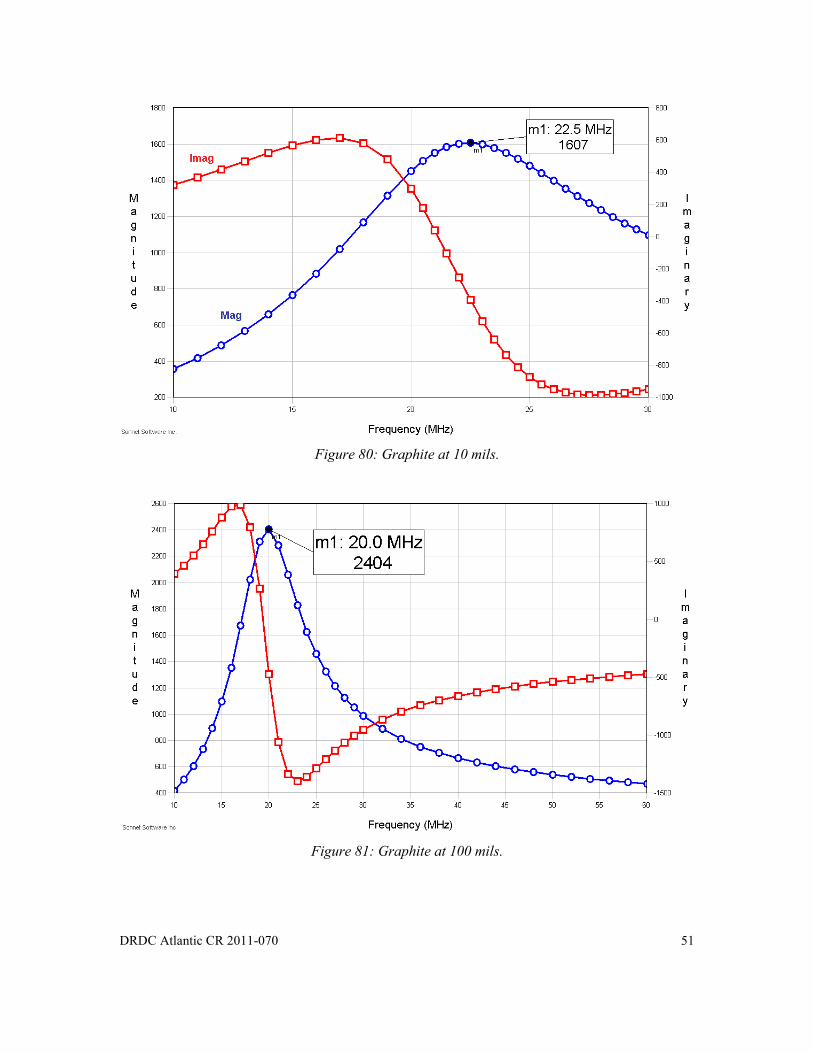
Figure 80: Graphite at 10 mils. ...................................................................................................... 51
Figure 81: Graphite at 100 mils. .................................................................................................... 51
Figure 82: Thermoplastics at 25 mils. ........................................................................................... 52
Figure 83: Thermoplastics at 50 mils. ........................................................................................... 52
Figure 84: Thermoplastics at 100 mils. ......................................................................................... 53
Figure 85: Wood at 25 mils. .......................................................................................................... 53
Figure 86: Wood at 50 mils. .......................................................................................................... 54
Figure 87: Wood at 100 mils. ........................................................................................................ 54
Figure 88: Paper at 25 mils. ........................................................................................................... 55
Figure 89: Paper at 50 mils. ........................................................................................................... 55
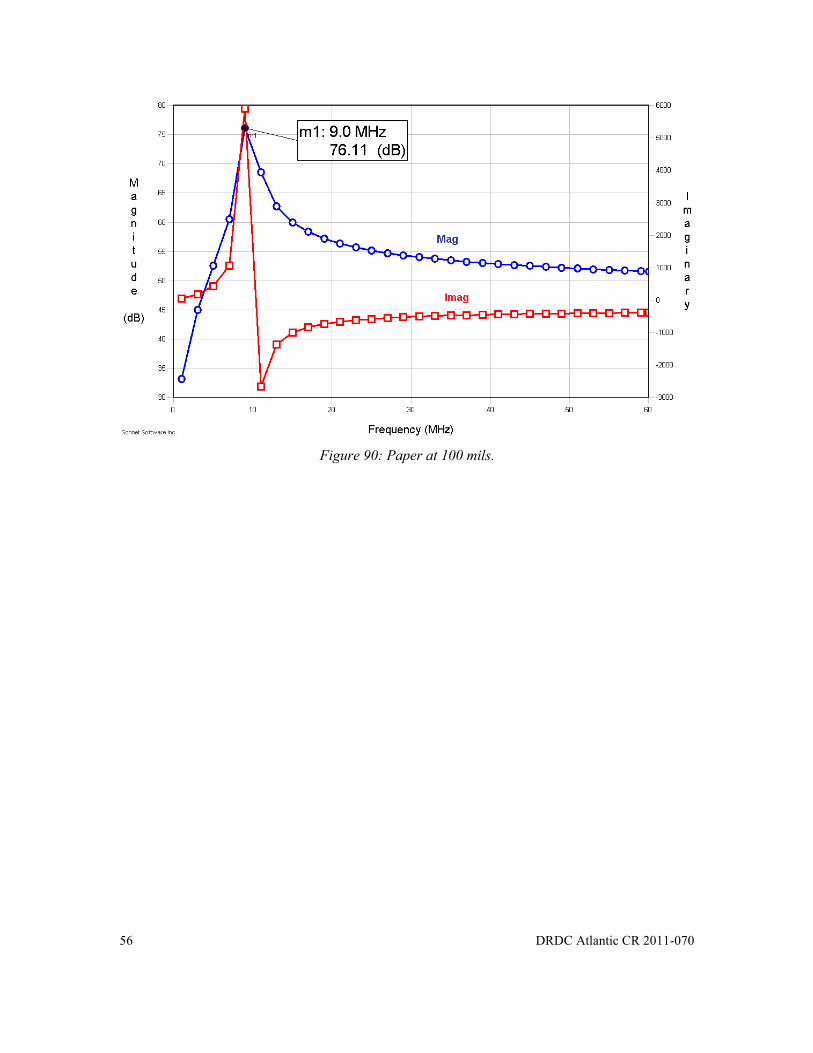
Figure 90: Paper at 100 mils. ......................................................................................................... 56

DRDC Atlantic CR 2011-070 xi
List of tables
Table 1: Characteristics of the tested materials. .............................................................................. 5
Table 2: Resonance frequency and gain of the UHF antenna vs. studied material and position. .... 9
Table 3: Resonance frequency of the HF antenna vs. studied material and position. ................... 12

xii DRDC Atlantic CR 2011-070
Acknowledgements
This work was carried out with the help of Dr. Mehdi Si Moussa and Mr. Mohamed Jemai at
LACIME lab at École de technologie supérieure.
DRDC Atlantic CR 2011-070 1
1 Introduction
Wireless technology has seen significant development in recent years and its potential for
aerospace applications has captivated the interest of several industries. Recently, particular
interest has focused on the investigation of passive Radio Frequency Identification (RFID) tags
for such applications due to their attractive characteristics that include reduced size and weight
and no power requirements.
To fully exploit RFID technology for SHM applications, several identified issues affecting the
RFID system performance need to be addressed. This project intends to address some of these
issues, particular issues affecting or impacting tag/reader performance when subjected to an
electromagnetic/conducting environment. More specifically, we investigate the impact of the
proximity of an RFID tag to a conducting surface having varying conductivity and situated at a
variable distance from the tag itself.
2 DRDC Atlantic CR 2011-070
2 Methodology
To assess the impact of the presence of a large conducting surface in the vicinity of an RFID tag,
electromagnetic simulation of the tag (its antenna) is required. This in turn requires the use of a
tool capable of simulating the antenna structure in the presence of the conducting surface. There
exists a wide variety of electromagnetic simulation tools capable of simulating various
three-dimensional structures with varying degrees of complexity in model construction as well as
varying levels of accuracy and the required computational resources (both in memory and CPU
time usage). A review of these tools and the underlining techniques is beyond the scope of the
present project; however, given that the RFID tag antennas are generally planar, and assuming
that the near-by metallic surface are locally planar, the problem can be accurately modeled and
simulated using the so-called planar electromagnetic field solvers. These solvers offer high
accuracy with low modeling complexity and reasonable simulation times. In this particular study,
we used two such tools:
Sonnet (from Sonnet Software) [1], and
Momentum, part of the Advanced Design System (ADS, from Agilent Inc.) [2].
The first step consists of model construction. The printed antenna models are defined by a layout
drawing of the antenna metallisation surface; see Figure 1, coupled with a definition of the
substrate on which the antenna is made. The substrate can be made of a single or multiple layers
each having its proper electromagnetic characteristics and its own thickness. The electromagnetic
characteristics of interest are the permittivity () and conductivity (), i.e., all materials are
considered non-magnetic, therefore, the permeability is fixed to o = 410-7
Henry/meter for all
materials. The permittivity is expressed as = ro where r is the relative permittivity and o is
the free space permittivity (o = 8.854x10⁻¹²
Farad/meter). The conductivity, , is measured in
Siemens/meter (S/m) or Siemens/centimeter (S/cm) and may be sometimes replaced by the
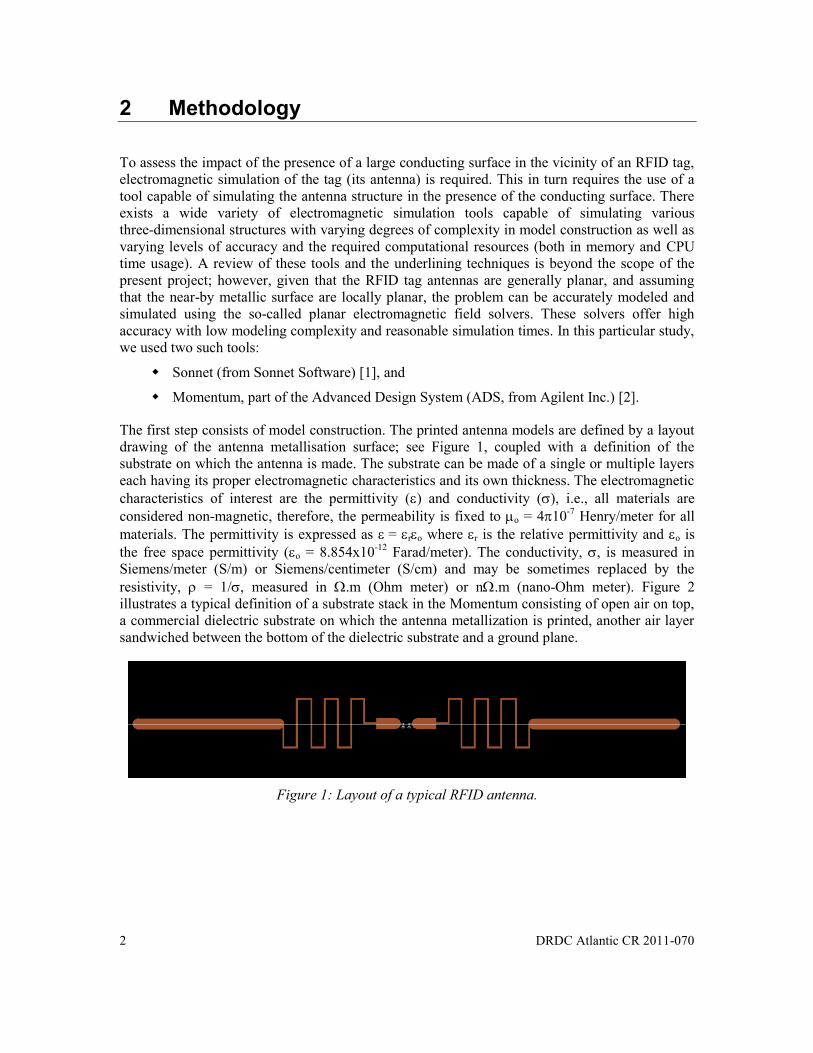
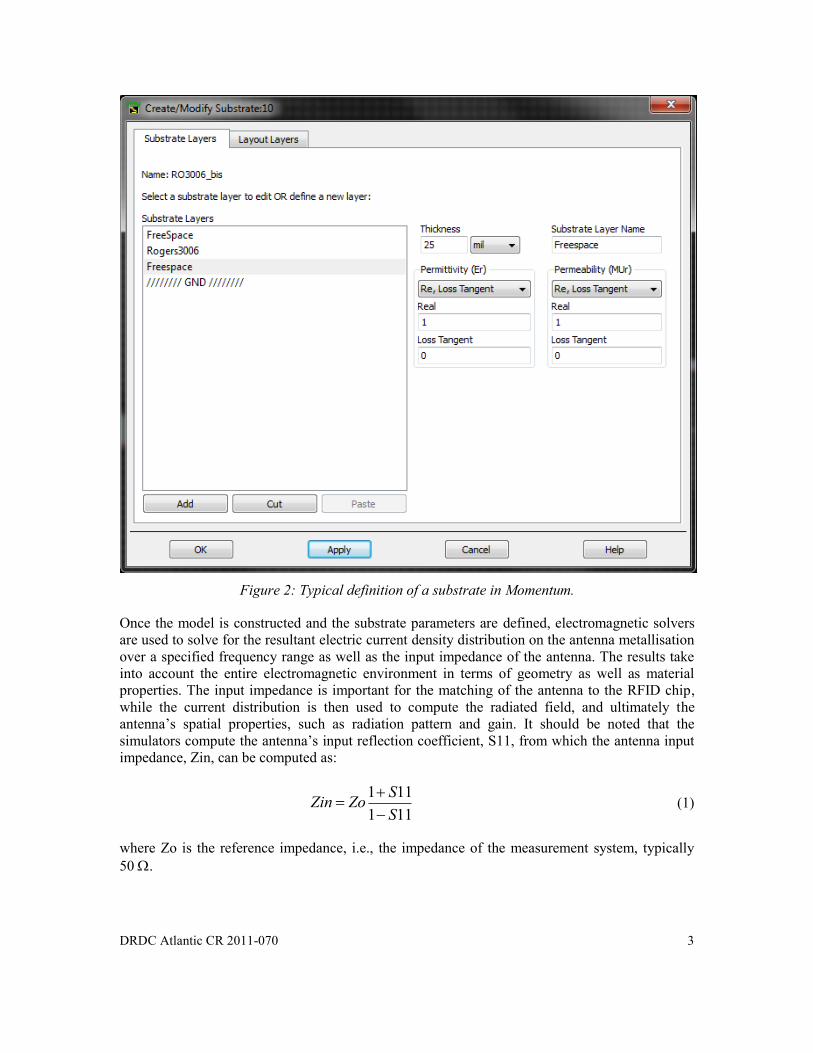
resistivity, = 1/, measured in .m (Ohm meter) or n.m (nano-Ohm meter). Figure 2
illustrates a typical definition of a substrate stack in the Momentum consisting of open air on top,
a commercial dielectric substrate on which the antenna metallization is printed, another air layer
sandwiched between the bottom of the dielectric substrate and a ground plane.
Figure 1: Layout of a typical RFID antenna.
DRDC Atlantic CR 2011-070 3
Figure 2: Typical definition of a substrate in Momentum.
Once the model is constructed and the substrate parameters are defined, electromagnetic solvers
are used to solve for the resultant electric current density distribution on the antenna metallisation
over a specified frequency range as well as the input impedance of the antenna. The results take
into account the entire electromagnetic environment in terms of geometry as well as material
properties. The input impedance is important for the matching of the antenna to the RFID chip,
while the current distribution is then used to compute the radiated field, and ultimately the
antenna’s spatial properties, such as radiation pattern and gain. It should be noted that the
simulators compute the antenna’s input reflection coefficient, S11, from which the antenna input
impedance, Zin, can be computed as:
1 11
1 11
SZin Zo
S
(1)
where Zo is the reference impedance, i.e., the impedance of the measurement system, typically
50 .
4 DRDC Atlantic CR 2011-070
The present study is limited to the above mentioned simulations and parametric results are
obtained for various configurations, as will be presented in the following sections. The impact on
the performance of the electromagnetic environment and changes in antenna parameters can be
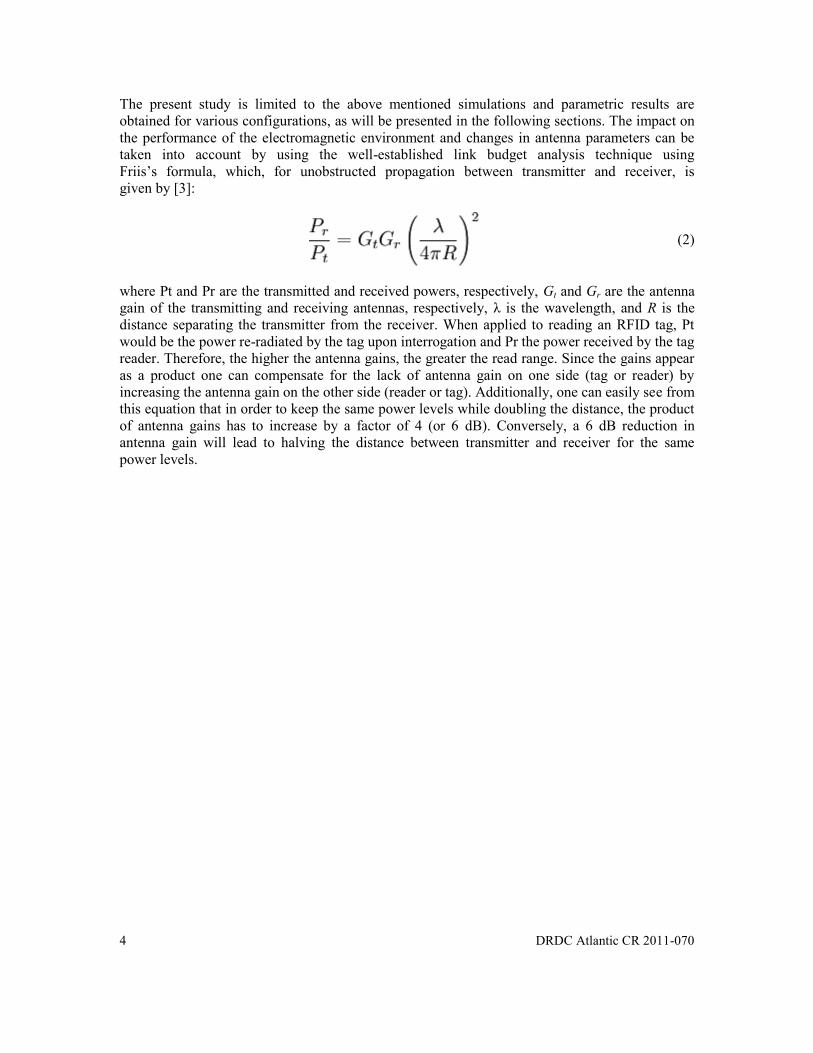
taken into account by using the well-established link budget analysis technique using
Friis’s formula, which, for unobstructed propagation between transmitter and receiver, is
given by [3]:
(2)
where Pt and Pr are the transmitted and received powers, respectively, Gt and Gr are the antenna
gain of the transmitting and receiving antennas, respectively, λ is the wavelength, and R is the
distance separating the transmitter from the receiver. When applied to reading an RFID tag, Pt
would be the power re-radiated by the tag upon interrogation and Pr the power received by the tag
reader. Therefore, the higher the antenna gains, the greater the read range. Since the gains appear
as a product one can compensate for the lack of antenna gain on one side (tag or reader) by
increasing the antenna gain on the other side (reader or tag). Additionally, one can easily see from
this equation that in order to keep the same power levels while doubling the distance, the product
of antenna gains has to increase by a factor of 4 (or 6 dB). Conversely, a 6 dB reduction in
antenna gain will lead to halving the distance between transmitter and receiver for the same
power levels.

DRDC Atlantic CR 2011-070 5
3 Simulations
Several simulations were carried out whereby a conducting surface of variable conductivity and
located at a varying distance from an RFID tag antenna was considered. Two distinct antenna
structures were considered. The first operates at ultra-high frequency (UFH dipole antenna at
~1.8 GHz) while the second operates at high frequency (HF coil antenna at ~13 MHz). For both
cases, the properties of the material placed in the vicinity of the tag were varied according to the
list in Table 1. For each material, three geometries were simulated, namely having the material at
25, 50 and 100 mils away from the antenna.
Table 1: Characteristics of the tested materials.
Material Resistivity or Conductivity
Titanium 420 nΩ. m
Aluminum 2024-T3 57.4 nΩ. m
Aluminum 7075-T6 52 nΩ. m
Ferromagnetic material (Iron) 96.1 nΩ. m
Graphite 7.837 µΩ. m
Thermoplastics (εr = 5) 10-8 S/cm
Wood (εr = 4) 3x10¹⁷ Ω. m
Cardboard and Paper (εr = 2.5) Negligible conductivity
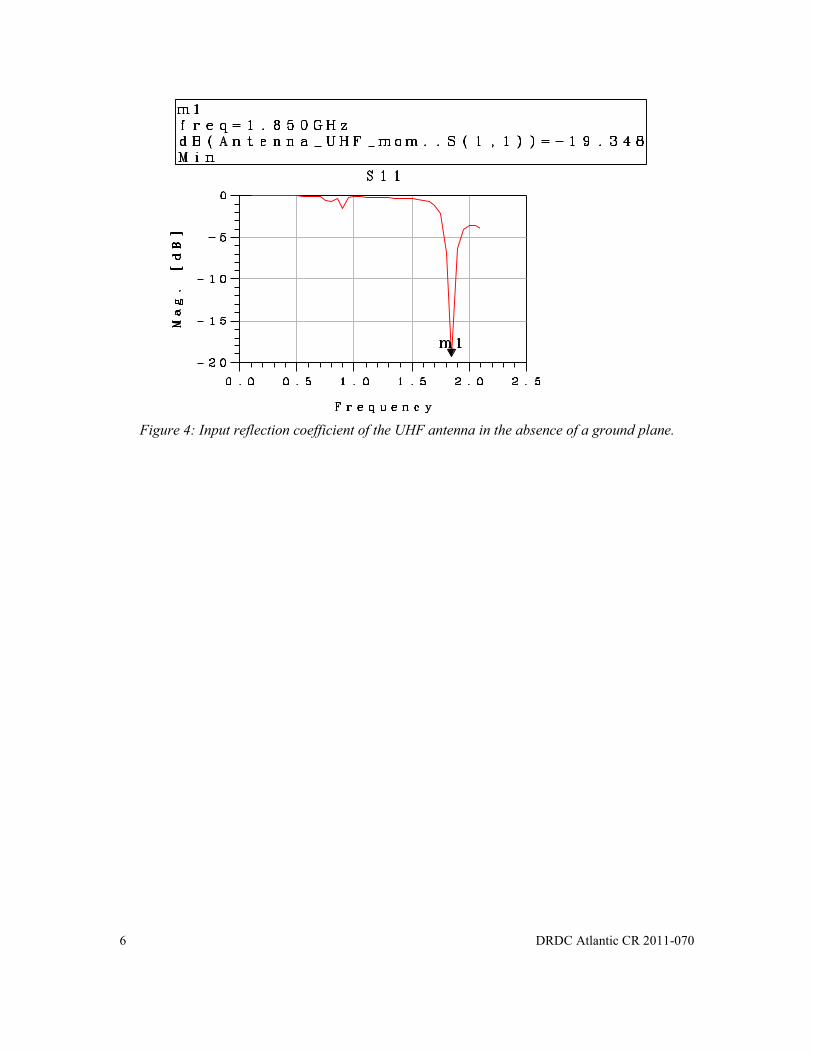
3.1 UHF antenna – reference structure Figure 3 shows the geometry of a popular RFID tag antenna dimensioned for operation at
1.8 GHz. The geometric parameters of the model are also given. The antenna was simulated on a
standard commercial substrate, Rogers 3006 with a substrate thickness of 25 mils and εr = 6.15. In
the absence of materials around this antenna, its resonant frequency was found to be 1.85 GHz
with a gain of 3.89 dB. Figure 4 shows the simulated S11 where it can be seen that antenna offers
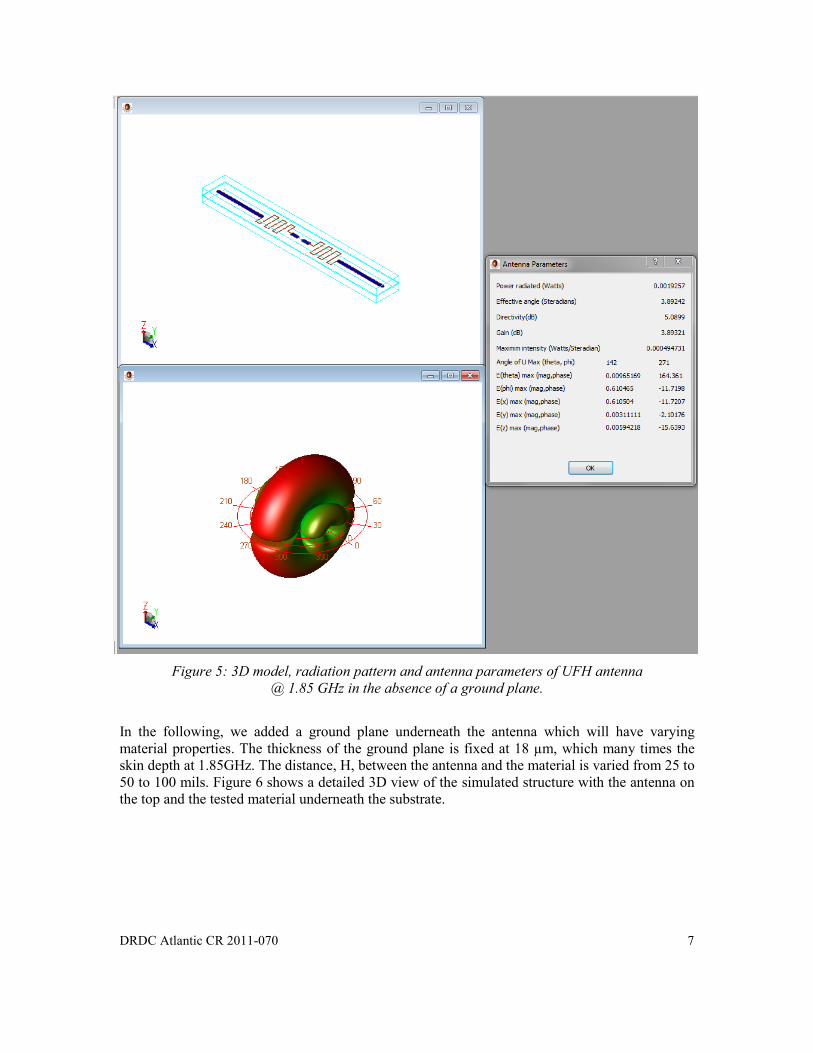
best input matching at 1.85 GHz. Figure 5 shows a 3D view of the model, the obtained radiation
pattern and antenna parameters with a gain of 3.89 dB.
Figure 3: Geometry of the UHF dipole antenna.
6 DRDC Atlantic CR 2011-070
Figure 4: Input reflection coefficient of the UHF antenna in the absence of a ground plane.
DRDC Atlantic CR 2011-070 7
Figure 5: 3D model, radiation pattern and antenna parameters of UFH antenna
@ 1.85 GHz in the absence of a ground plane.
3.2 UHF antenna – effect of ground plane In the following, we added a ground plane underneath the antenna which will have varying
material properties. The thickness of the ground plane is fixed at 18 µm, which many times the
skin depth at 1.85GHz. The distance, H, between the antenna and the material is varied from 25 to
50 to 100 mils. Figure 6 shows a detailed 3D view of the simulated structure with the antenna on
the top and the tested material underneath the substrate.

8 DRDC Atlantic CR 2011-070
Figure 6: Detailed view of the 3D model of the UHF antenna with a material ground plane.
For each combination of ground plane material and distance, an electromagnetic simulation was
carried out and the antenna’s input reflection coefficient, radiation pattern and gain were
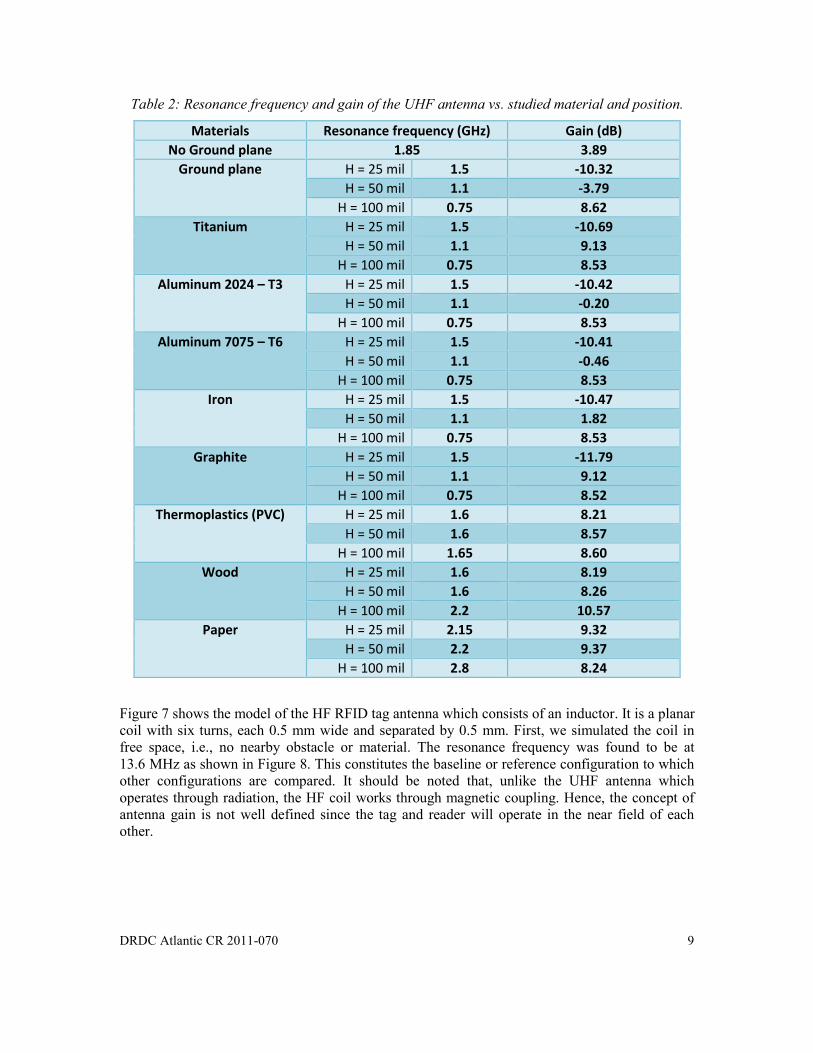
computed. The detailed results for each of these scenarios are presented in Annex A. Table 2
presents a summary of these results where the impact on the input matching, seen by a change in
the resonance frequency of the antenna, and on gain is indicated. It is clear that the presence of a
material in the vicinity of the antenna can have significant impact on its performance both by
shifting the resonance frequency and changing the gain. The impact of these variations can be
estimated using equation (2).
DRDC Atlantic CR 2011-070 9
Table 2: Resonance frequency and gain of the UHF antenna vs. studied material and position.
Materials Resonance frequency (GHz) Gain (dB)
No Ground plane 1.85 3.89
Ground plane H = 25 mil 1.5 -10.32
H = 50 mil 1.1 -3.79
H = 100 mil 0.75 8.62
Titanium H = 25 mil 1.5 -10.69
H = 50 mil 1.1 9.13
H = 100 mil 0.75 8.53
Aluminum 2024 – T3 H = 25 mil 1.5 -10.42
H = 50 mil 1.1 -0.20
H = 100 mil 0.75 8.53
Aluminum 7075 – T6 H = 25 mil 1.5 -10.41
H = 50 mil 1.1 -0.46
H = 100 mil 0.75 8.53
Iron H = 25 mil 1.5 -10.47
H = 50 mil 1.1 1.82
H = 100 mil 0.75 8.53
Graphite H = 25 mil 1.5 -11.79
H = 50 mil 1.1 9.12
H = 100 mil 0.75 8.52
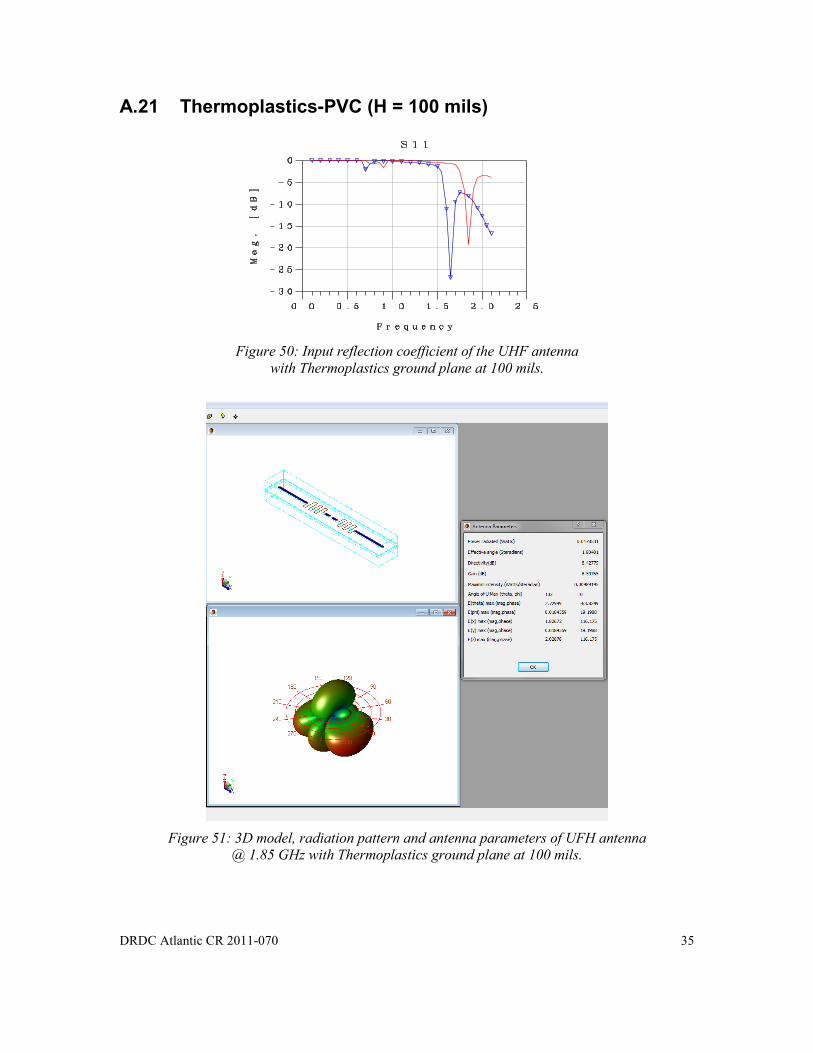
Thermoplastics (PVC) H = 25 mil 1.6 8.21
H = 50 mil 1.6 8.57
H = 100 mil 1.65 8.60
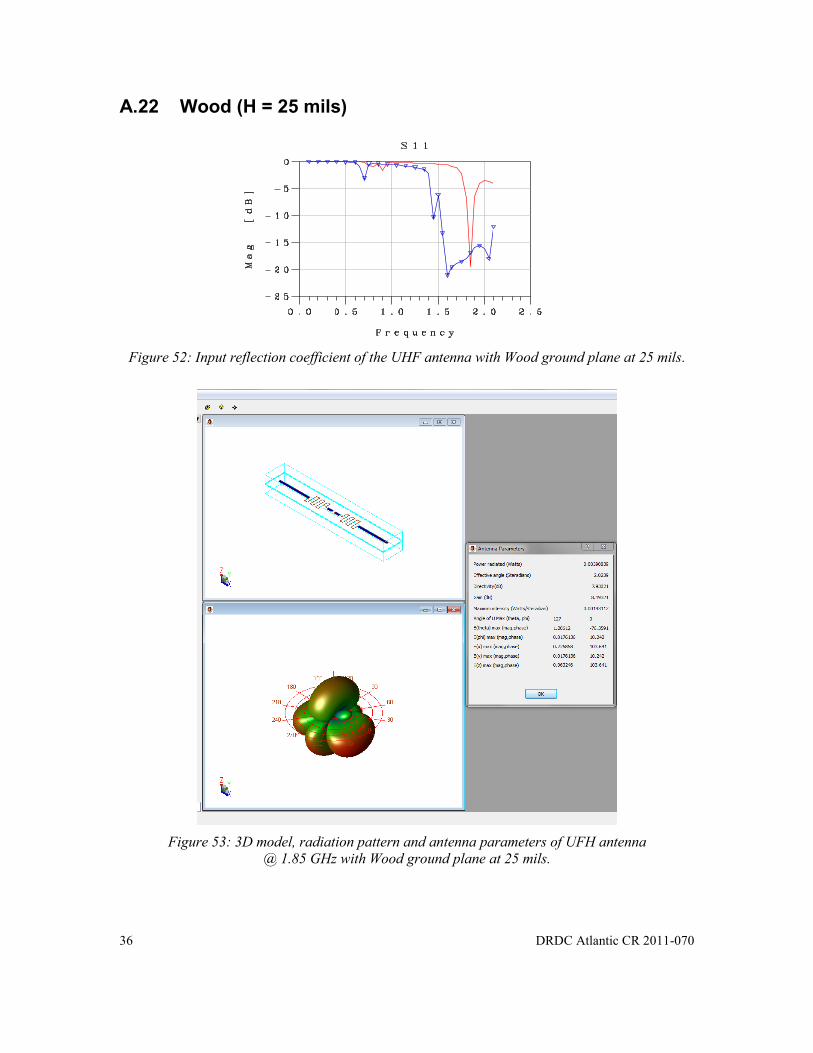
Wood H = 25 mil 1.6 8.19
H = 50 mil 1.6 8.26
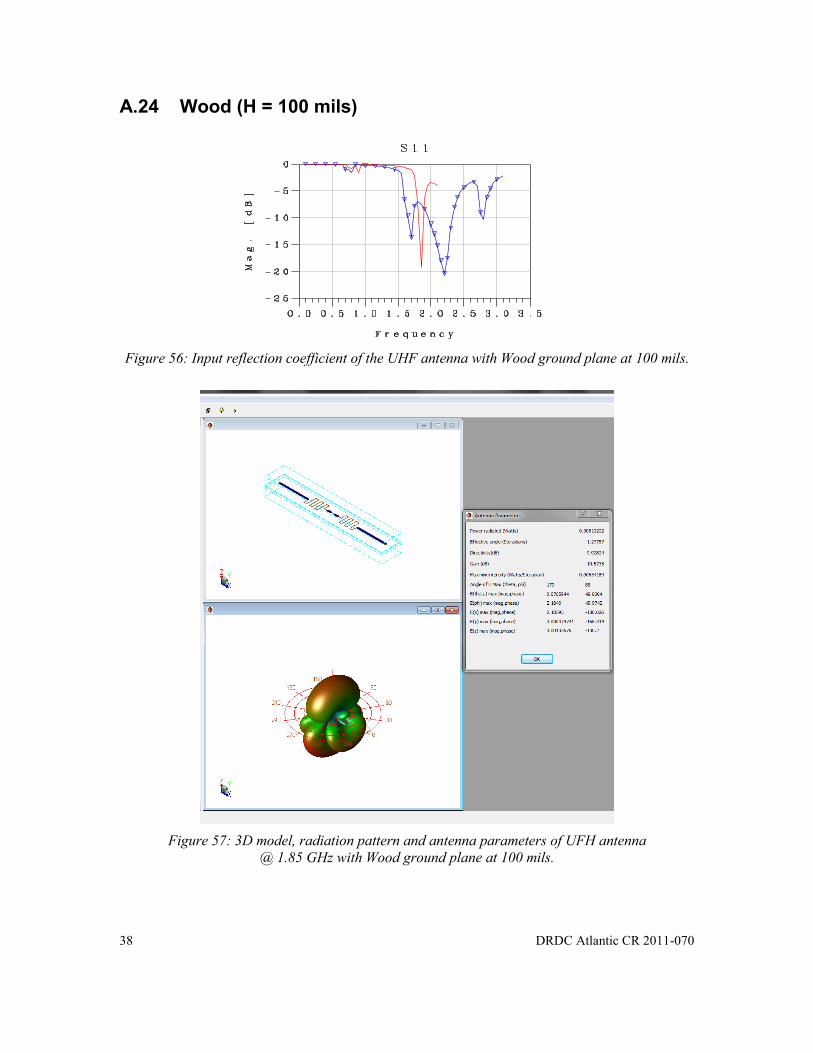
H = 100 mil 2.2 10.57
Paper H = 25 mil 2.15 9.32
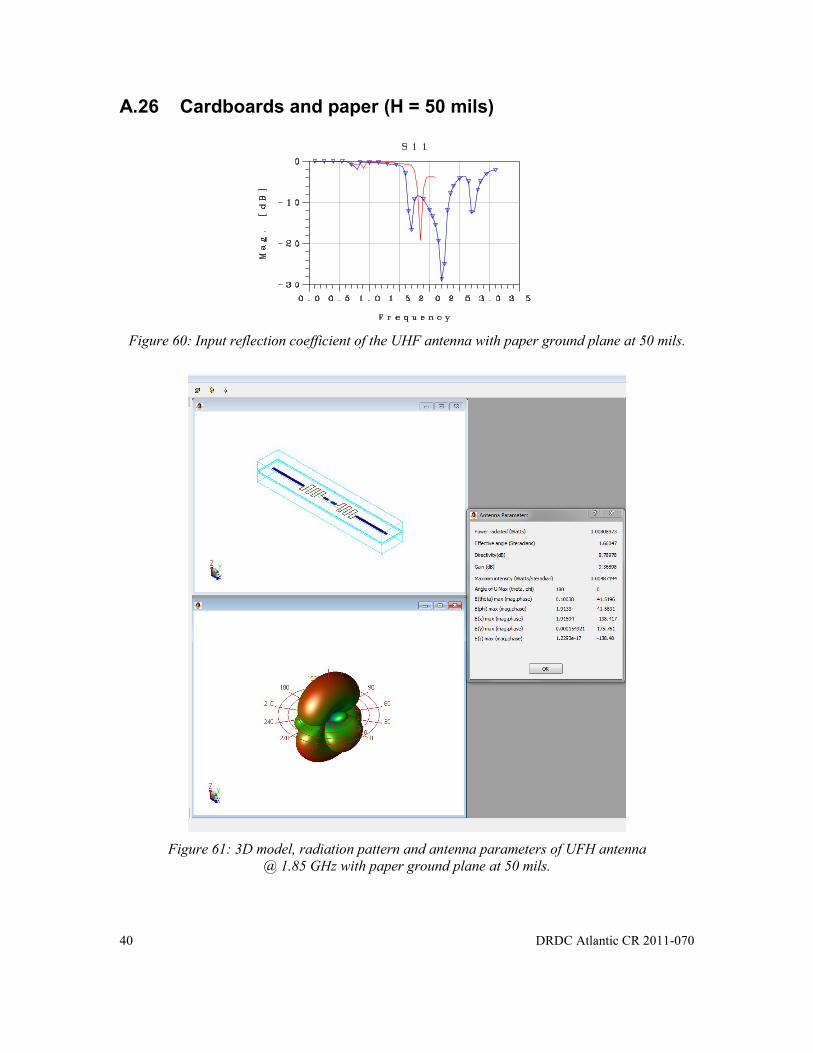
H = 50 mil 2.2 9.37
H = 100 mil 2.8 8.24
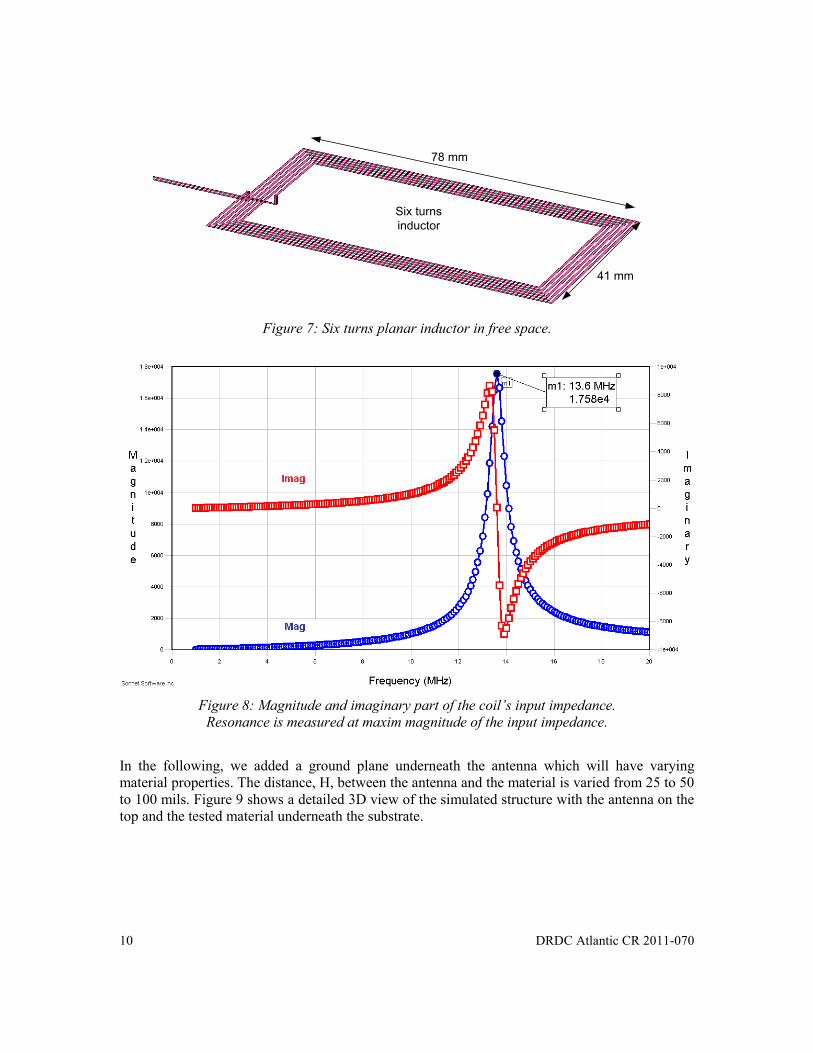
3.3 HF antenna – reference structure Figure 7 shows the model of the HF RFID tag antenna which consists of an inductor. It is a planar
coil with six turns, each 0.5 mm wide and separated by 0.5 mm. First, we simulated the coil in
free space, i.e., no nearby obstacle or material. The resonance frequency was found to be at
13.6 MHz as shown in Figure 8. This constitutes the baseline or reference configuration to which
other configurations are compared. It should be noted that, unlike the UHF antenna which
operates through radiation, the HF coil works through magnetic coupling. Hence, the concept of
antenna gain is not well defined since the tag and reader will operate in the near field of each
other.
10 DRDC Atlantic CR 2011-070
78 mm
41 mm
Six turns
inductor
Figure 7: Six turns planar inductor in free space.
Figure 8: Magnitude and imaginary part of the coil’s input impedance.
Resonance is measured at maxim magnitude of the input impedance.
3.4 HF antenna – effect of ground plane
In the following, we added a ground plane underneath the antenna which will have varying
material properties. The distance, H, between the antenna and the material is varied from 25 to 50
to 100 mils. Figure 9 shows a detailed 3D view of the simulated structure with the antenna on the
top and the tested material underneath the substrate.

DRDC Atlantic CR 2011-070 11
Inductor
PEC plate
Substrate
height
Free space
distance H
Figure 9: Detailed view of the 3D model of the HF antenna with a material ground plane.
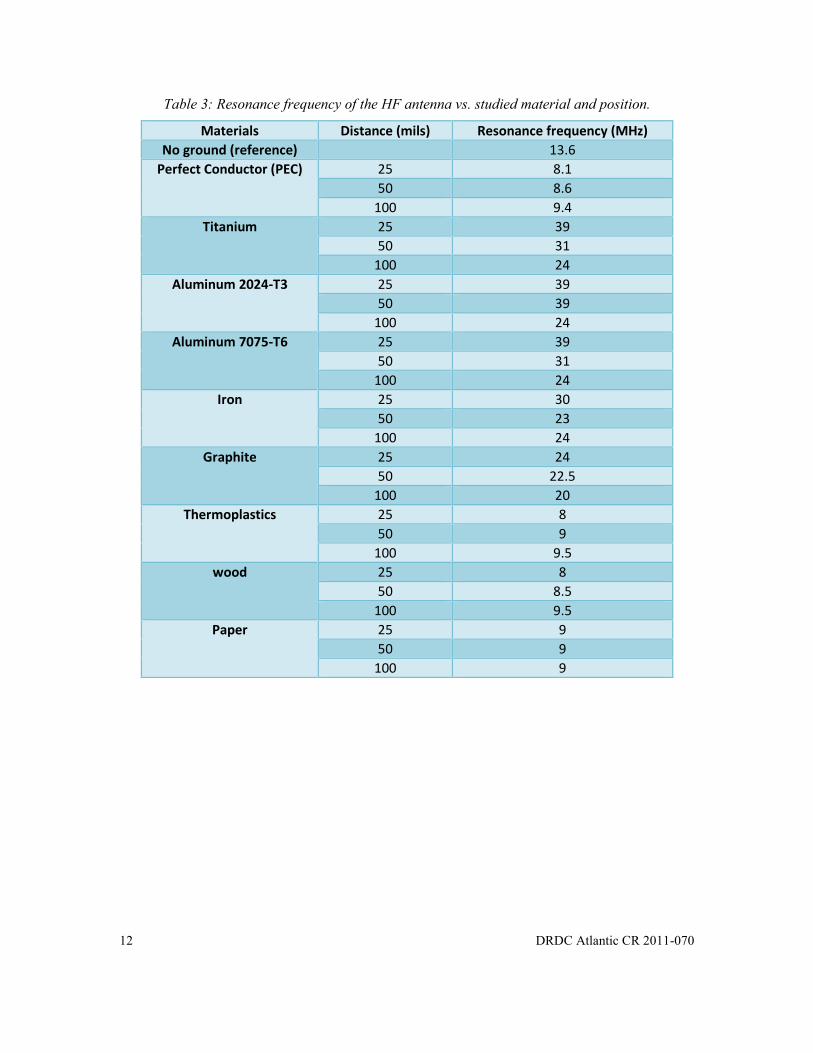
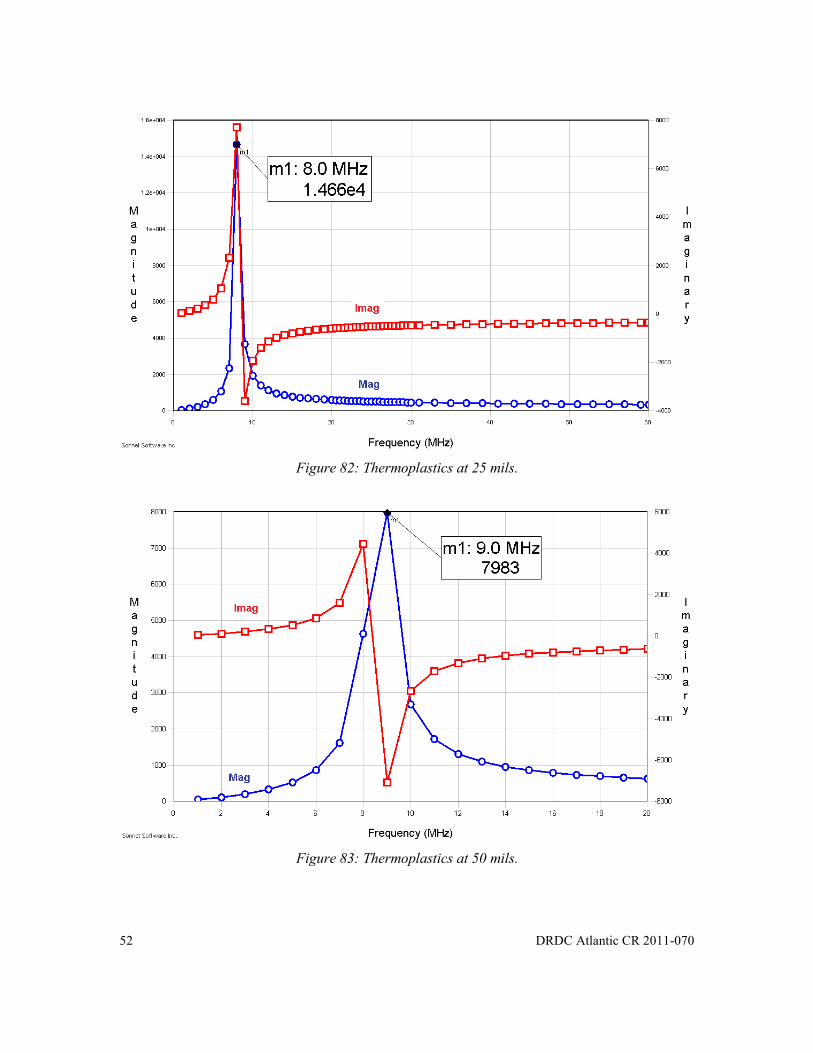
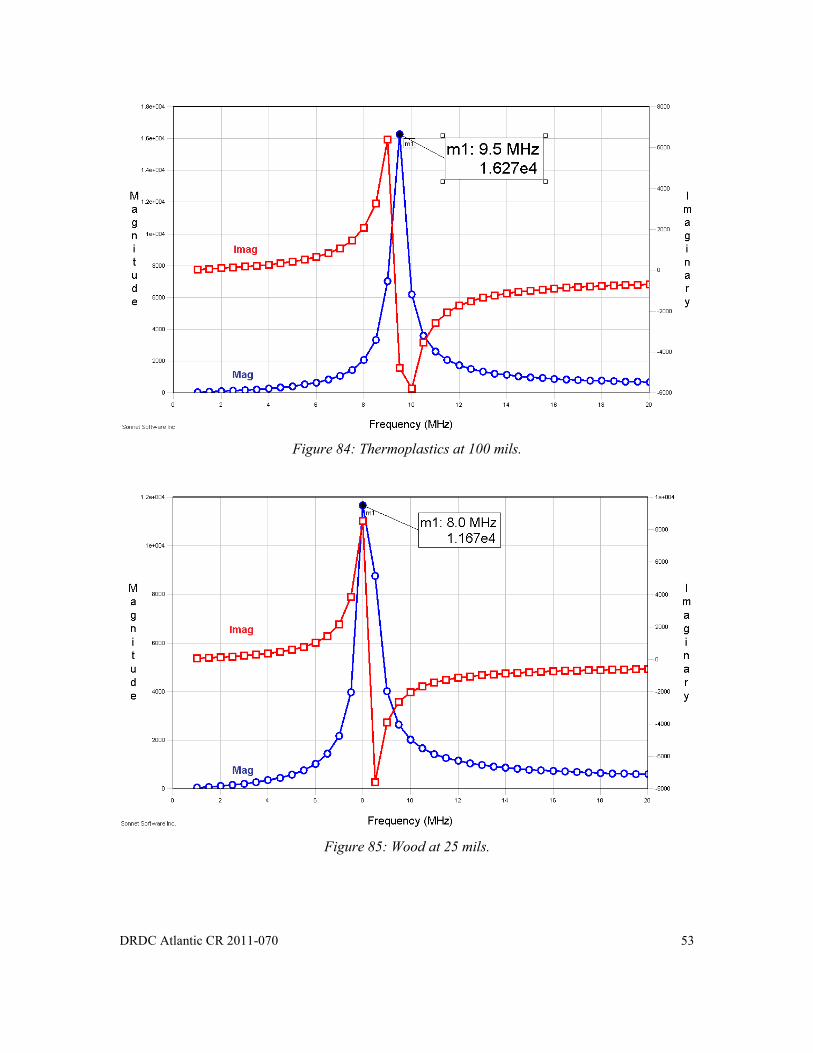
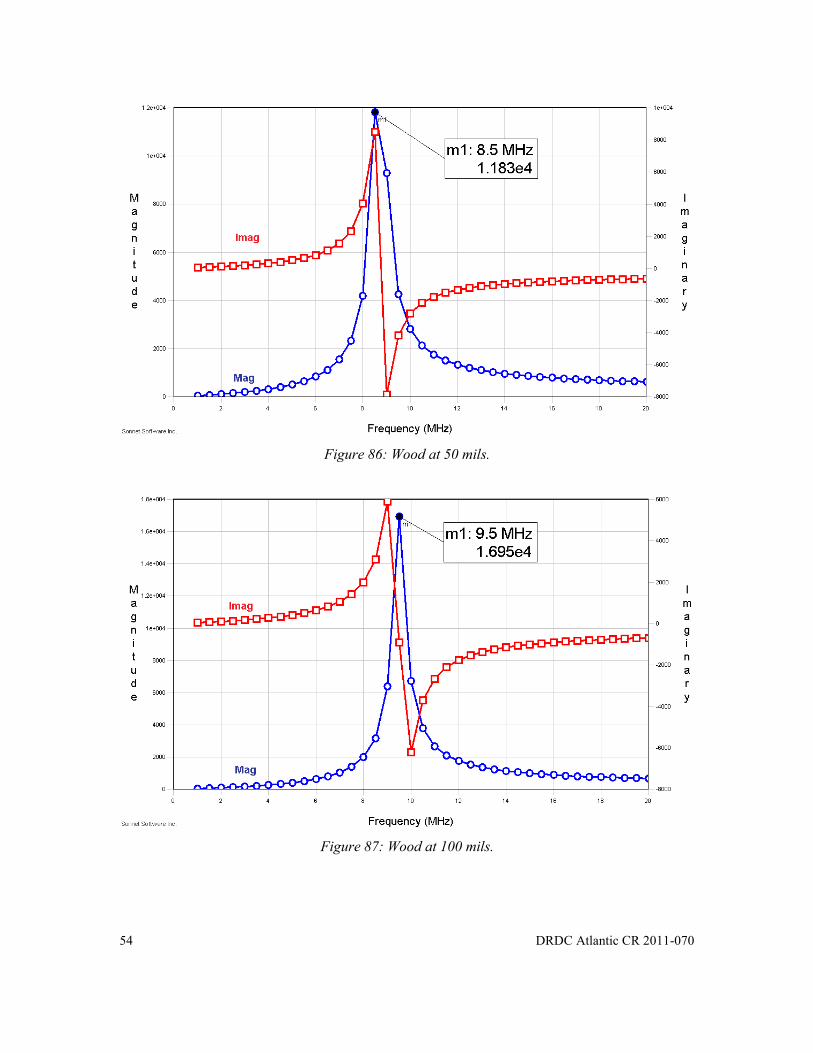
For each combination of ground plane material and distance, an electromagnetic simulation was
carried out and the antenna’s input impedance and resonance frequency were computed. The
detailed results for each of these scenarios are presented in Annex B. Table 3 presents a summary
of these results where the impact on the resonance frequency of the antenna can be seen. It is
clear that the presence of a material in the vicinity of the antenna can have significant impact on
its performance. The shift in resonance frequency means that less field strength will be radiated
away from the antenna at the desired operation frequency of 13.56MHz. It should be noted that
near field calculation, while possible, are extremely time consuming. Given the large number of
combinations, the results are limited to input impedance and resonance frequency.
12 DRDC Atlantic CR 2011-070
Table 3: Resonance frequency of the HF antenna vs. studied material and position.
Materials Distance (mils) Resonance frequency (MHz)
No ground (reference) 13.6
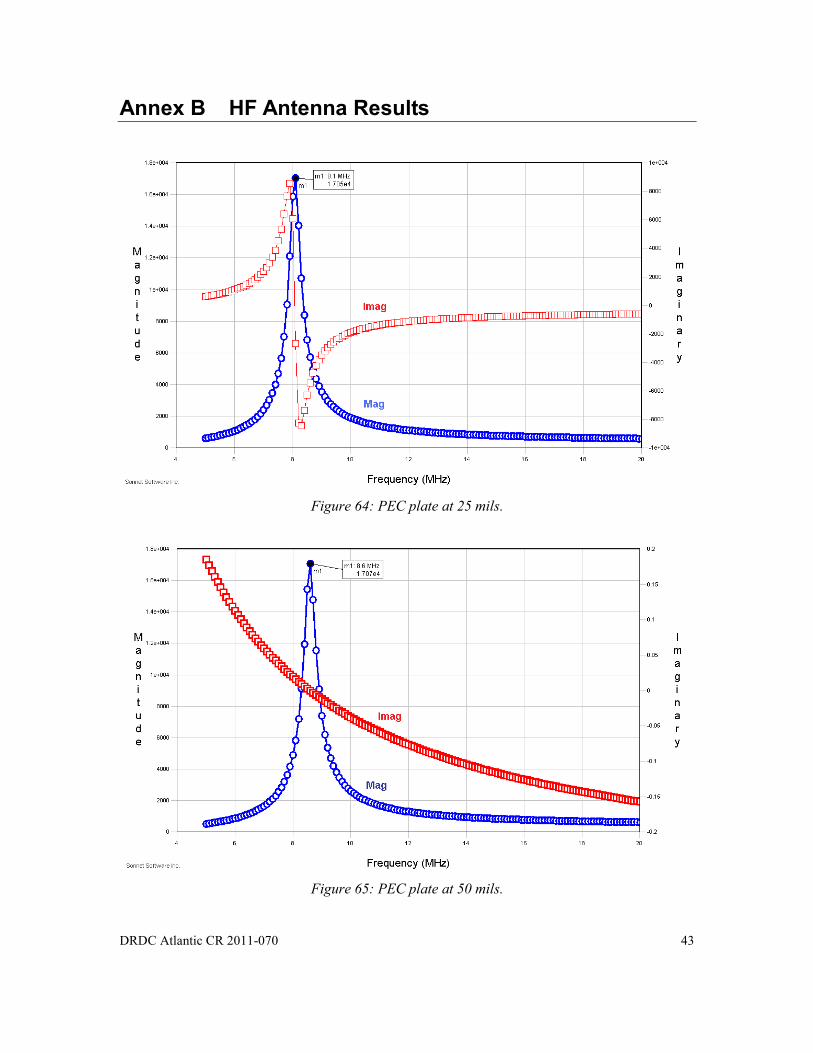
Perfect Conductor (PEC) 25 8.1
50 8.6
100 9.4
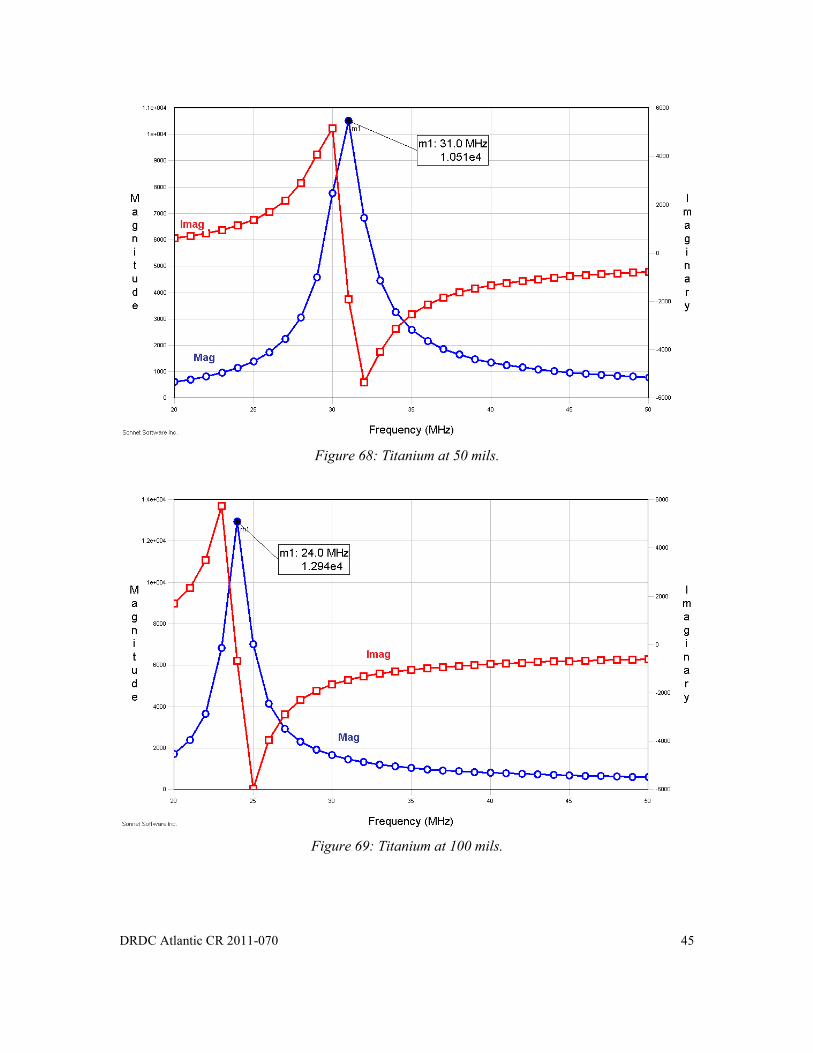
Titanium 25 39
50 31
100 24
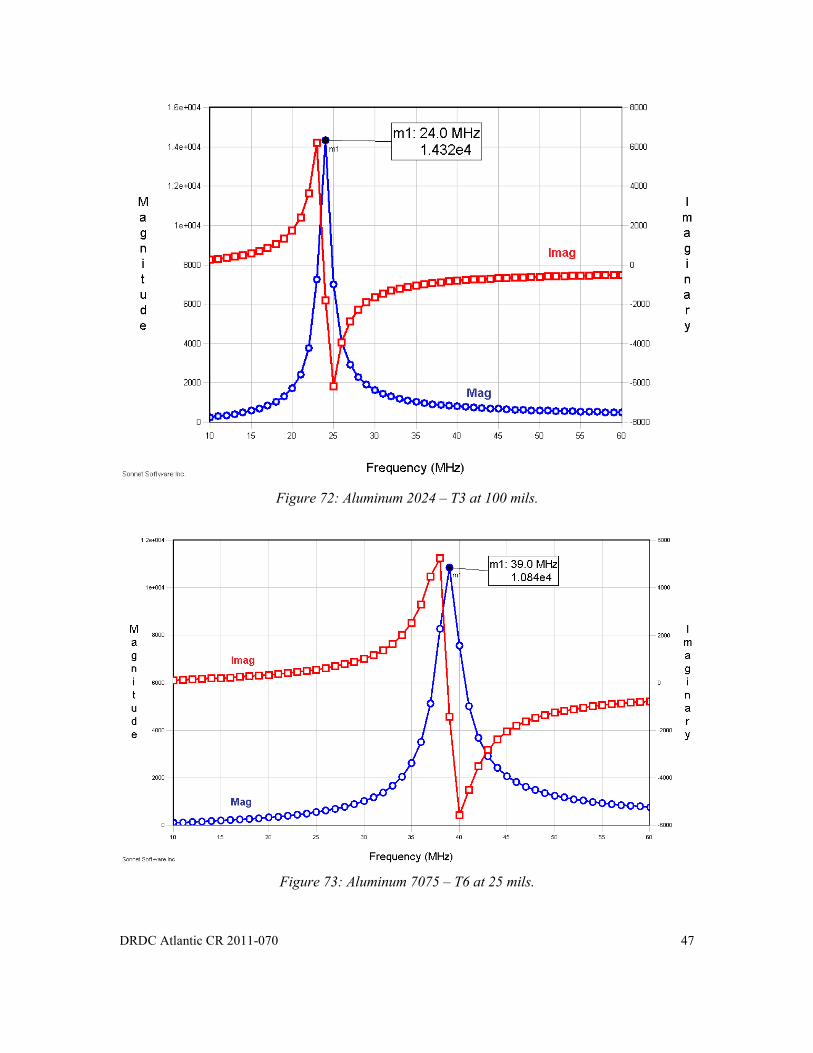
Aluminum 2024-T3 25 39
50 39
100 24
Aluminum 7075-T6 25 39
50 31
100 24
Iron 25 30
50 23
100 24
Graphite 25 24
50 22.5
100 20
Thermoplastics 25 8
50 9
100 9.5
wood 25 8
50 8.5
100 9.5
Paper 25 9
50 9
100 9

DRDC Atlantic CR 2011-070 13
4 Conclusions
The electromagnetic analyses that were carried out clearly demonstrate that there is a significant
impact associated with placing conducting material in the vicinity of an RFID tag. This
observation holds for both UHF tags as well as HF tags. For UHF tags, the impact on
performance was visible in terms of a change in the radiation pattern, antenna gain and the input
impedance. For HF tags, the impact was observed in terms of a wide range of variation in the
resonance frequency and input impedance. These results seem to corroborate the experience by
some researchers in the field. However, further investigation, including experimental validation,
is required in order to establish clear guidelines on the usage of RFID tags near conducting
surfaces. For UHF tags, where antenna gain is well defined and easily computed, the potential
impact on the read range of tags can be estimated using the results of Table 2 and equation (2).
Furthermore, this work has to be considered a preliminary study that can be elaborated further.
Given the time consuming nature of the work, we limited the study to relatively small distances
between the tag and metallic surface. It would be interesting to carry this study further to include
larger separating distances. Additionally, the UHF antenna model used was one that was readily
available in the literature. It would be equally interesting to study the behaviour of an antenna in
the more popular 915 MHz band.

14 DRDC Atlantic CR 2011-070
References .
[1] Sonnet Inc., “Sonnet Software”, 2010 Ed. Syracuse, NY, 2010.
[2] Agilent Technologies "Advanced Design System," 2009C Ed. Palo Alto California, 2009.
[3] T. Rappaport, Wireless Communications: Principles and Practice, 2nd Ed., New York:
Prentice Hall, 2001.
DRDC Atlantic CR 2011-070 15
Annex A UHF Antenna Results
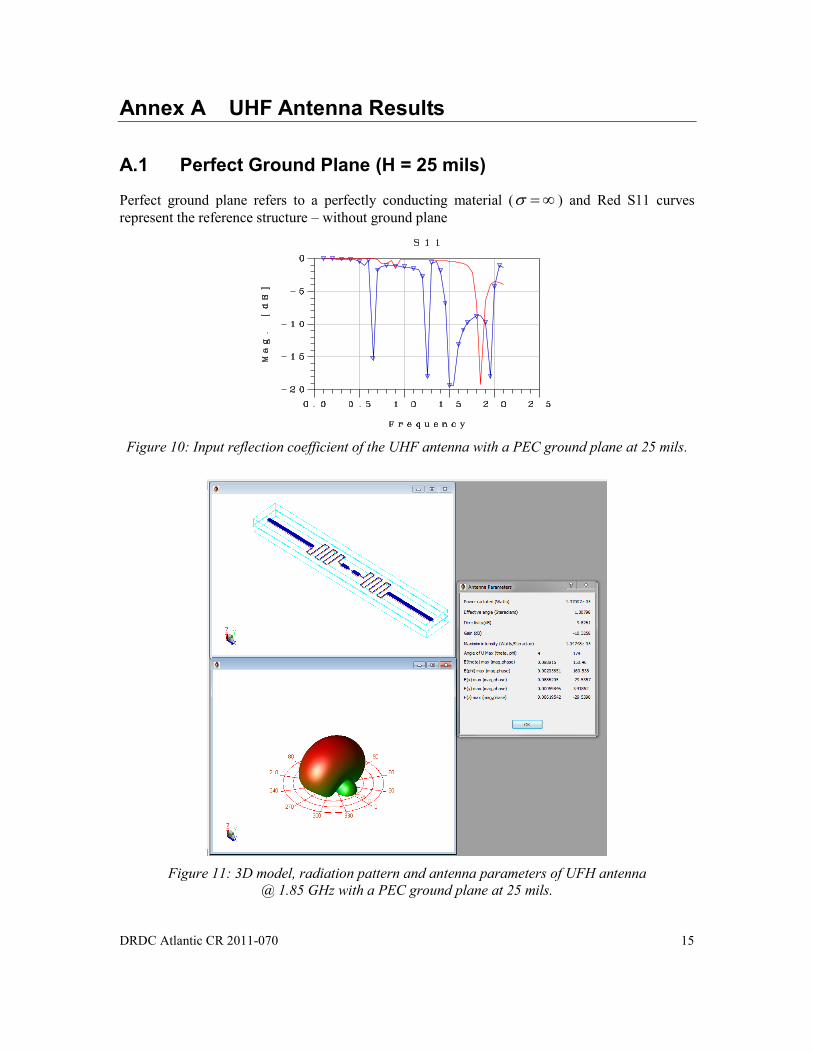
A.1 Perfect Ground Plane (H = 25 mils)
Perfect ground plane refers to a perfectly conducting material ( ) and Red S11 curves
represent the reference structure – without ground plane
Figure 10: Input reflection coefficient of the UHF antenna with a PEC ground plane at 25 mils.
Figure 11: 3D model, radiation pattern and antenna parameters of UFH antenna
@ 1.85 GHz with a PEC ground plane at 25 mils.
16 DRDC Atlantic CR 2011-070
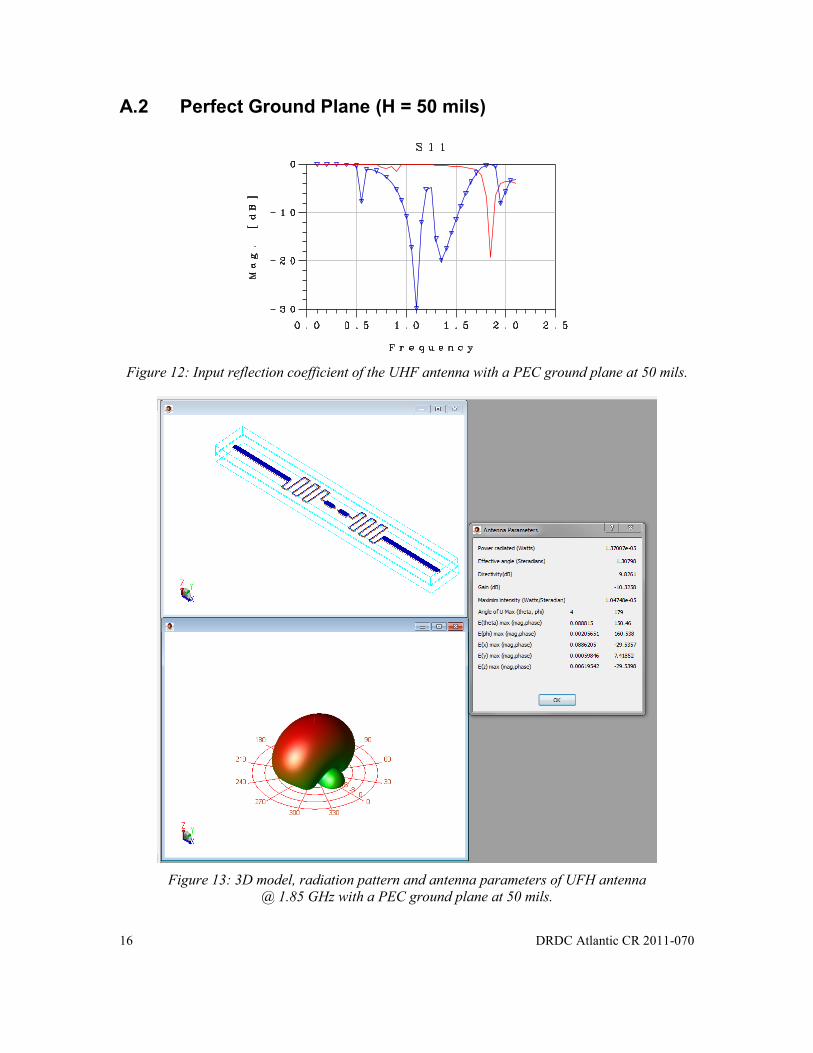
A.2 Perfect Ground Plane (H = 50 mils)
Figure 12: Input reflection coefficient of the UHF antenna with a PEC ground plane at 50 mils.
Figure 13: 3D model, radiation pattern and antenna parameters of UFH antenna
@ 1.85 GHz with a PEC ground plane at 50 mils.

DRDC Atlantic CR 2011-070 17
A.3 Perfect Ground Plane (H = 100 mils)
Figure 14: Input reflection coefficient of the UHF antenna with a PEC ground plane at 100 mils.
Figure 15: 3D model, radiation pattern and antenna parameters of UFH antenna
@ 1.85 GHz with a PEC ground plane at 100 mils.
18 DRDC Atlantic CR 2011-070
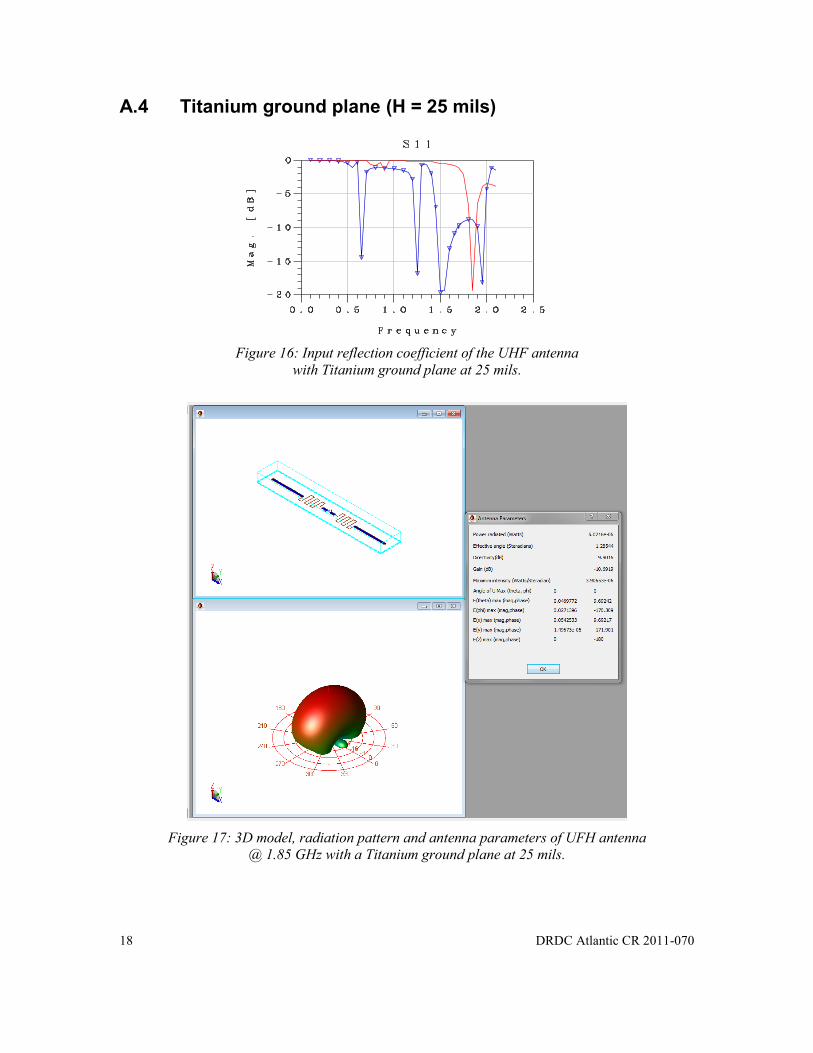
A.4 Titanium ground plane (H = 25 mils)
Figure 16: Input reflection coefficient of the UHF antenna
with Titanium ground plane at 25 mils.
Figure 17: 3D model, radiation pattern and antenna parameters of UFH antenna
@ 1.85 GHz with a Titanium ground plane at 25 mils.
DRDC Atlantic CR 2011-070 19
A.5 Titanium ground plane (H = 50 mils)
Figure 18: Input reflection coefficient of the UHF antenna
with Titanium ground plane at 50 mils.
Figure 19: 3D model, radiation pattern and antenna parameters of UFH antenna
@ 1.85 GHz with a Titanium ground plane at 50 mils.

20 DRDC Atlantic CR 2011-070
A.6 Titanium ground plane (H = 100 mils)
Figure 20: Input reflection coefficient of the UHF antenna
with Titanium ground plane at 100 mils.
Figure 21: 3D model, radiation pattern and antenna parameters of UFH antenna
@ 1.85 GHz with a Titanium ground plane at 100 mils.
DRDC Atlantic CR 2011-070 21
A.7 Aluminum 2024 – T3 (H = 25 mils)
Figure 22: Input reflection coefficient of the UHF antenna
with Aluminum 2024 – T3 ground plane at 25 mils.
Figure 23: 3D model, radiation pattern and antenna parameters of UFH antenna
@ 1.85 GHz with Aluminum 2024 – T3 ground plane at 25 mils.

22 DRDC Atlantic CR 2011-070
A.8 Aluminum 2024 – T3 (H = 50 mils)
Figure 24: Input reflection coefficient of the UHF antenna
with Aluminum 2024 – T3 ground plane at 50 mils.
Figure 25: 3D model, radiation pattern and antenna parameters of UFH antenna
@ 1.85 GHz with Aluminum 2024 – T3 ground plane at 50 mils.
DRDC Atlantic CR 2011-070 23
A.9 Aluminum 2024 – T3 (H = 100 mils)
Figure 26: Input reflection coefficient of the UHF antenna
with Aluminum 2024 – T3 ground plane at 100 mils.
Figure 27: 3D model, radiation pattern and antenna parameters of UFH antenna
@ 1.85 GHz with Aluminum 2024 – T3 ground plane at 100 mils.

24 DRDC Atlantic CR 2011-070
A.10 Aluminum 7075 – T6 (H = 25 mils)
Figure 28: Input reflection coefficient of the UHF antenna
with Aluminum 7075 – T6 ground plane at 25 mils.
Figure 29: 3D model, radiation pattern and antenna parameters of UFH antenna
@ 1.85 GHz with Aluminum 7075 – T6 ground plane at 25 mils.
DRDC Atlantic CR 2011-070 25
A.11 Aluminum 7075 – T6 (H = 50 mils)
Figure 30: Input reflection coefficient of the UHF antenna
with Aluminum 7075 – T6 ground plane at 50 mils.
Figure 31: 3D model, radiation pattern and antenna parameters of UFH antenna
@ 1.85 GHz with Aluminum 7075 – T6 ground plane at 50 mils.
26 DRDC Atlantic CR 2011-070
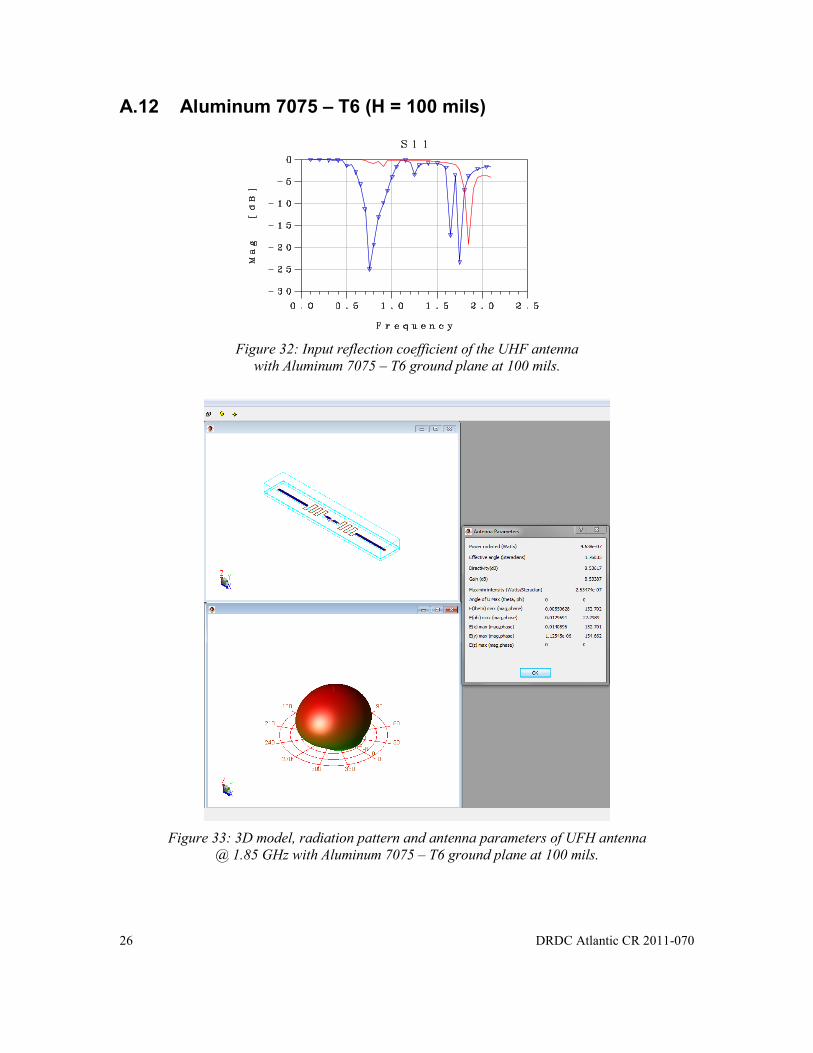
A.12 Aluminum 7075 – T6 (H = 100 mils)
Figure 32: Input reflection coefficient of the UHF antenna
with Aluminum 7075 – T6 ground plane at 100 mils.
Figure 33: 3D model, radiation pattern and antenna parameters of UFH antenna
@ 1.85 GHz with Aluminum 7075 – T6 ground plane at 100 mils.
DRDC Atlantic CR 2011-070 27
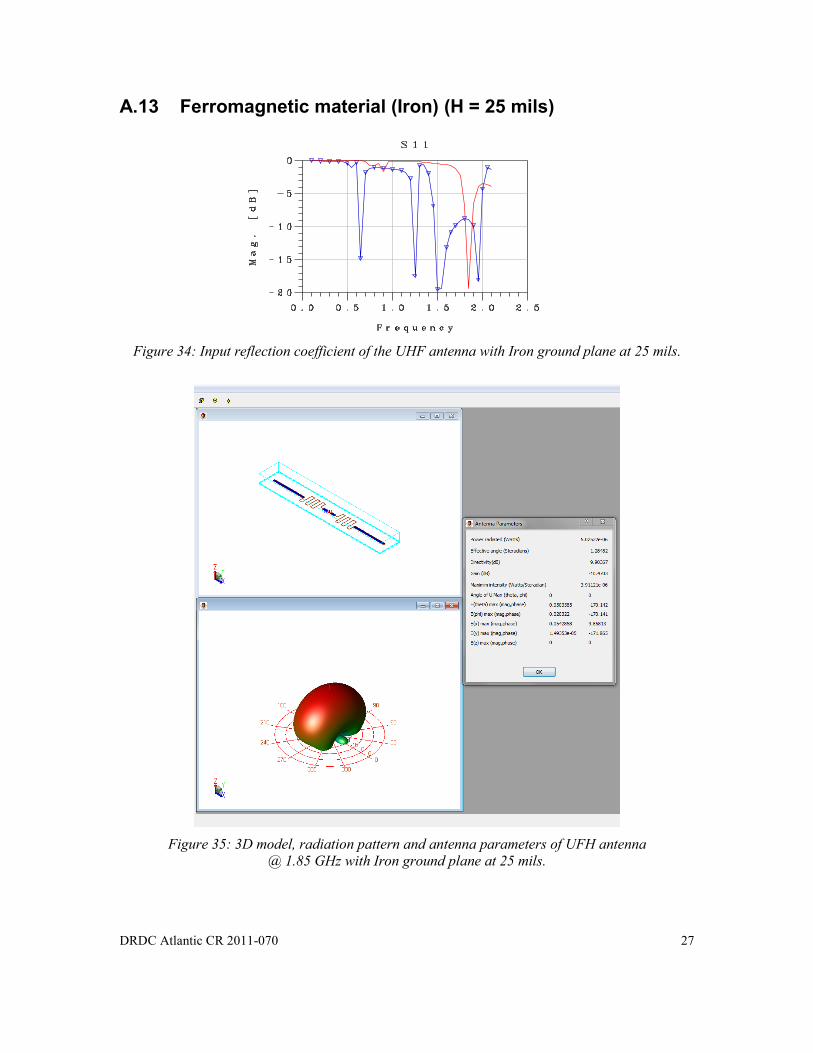
A.13 Ferromagnetic material (Iron) (H = 25 mils)
Figure 34: Input reflection coefficient of the UHF antenna with Iron ground plane at 25 mils.
Figure 35: 3D model, radiation pattern and antenna parameters of UFH antenna
@ 1.85 GHz with Iron ground plane at 25 mils.

28 DRDC Atlantic CR 2011-070
A.14 Ferromagnetic material (Iron) (H = 50 mils)
Figure 36: Input reflection coefficient of the UHF antenna with Iron ground plane at 50 mils.
Figure 37: 3D model, radiation pattern and antenna parameters of UFH antenna
@ 1.85 GHz with Iron ground plane at 50 mils.
DRDC Atlantic CR 2011-070 29
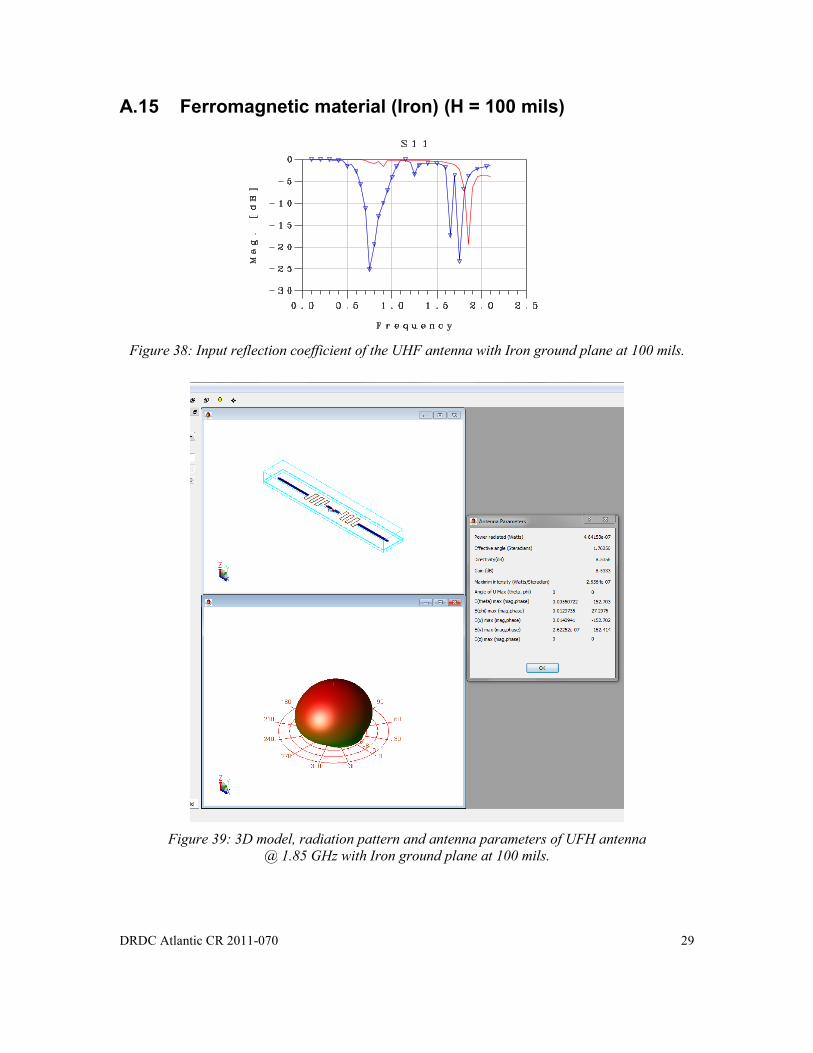
A.15 Ferromagnetic material (Iron) (H = 100 mils)
Figure 38: Input reflection coefficient of the UHF antenna with Iron ground plane at 100 mils.
Figure 39: 3D model, radiation pattern and antenna parameters of UFH antenna
@ 1.85 GHz with Iron ground plane at 100 mils.

30 DRDC Atlantic CR 2011-070
A.16 Graphite (H = 25 mils)
Figure 40: Input reflection coefficient of the UHF antenna
with Graphite ground plane at 25 mils.
Figure 41: 3D model, radiation pattern and antenna parameters of UFH antenna
@ 1.85 GHz with Graphite ground plane at 25 mils.

DRDC Atlantic CR 2011-070 31
A.17 Graphite (H = 50 mils)
Figure 42: Input reflection coefficient of the UHF antenna
with Graphite ground plane at 50 mils.
Figure 43: 3D model, radiation pattern and antenna parameters of UFH antenna
@ 1.85 GHz with Graphite ground plane at 50 mils.

32 DRDC Atlantic CR 2011-070
A.18 Graphite (H = 100 mils)
Figure 44: Input reflection coefficient of the UHF antenna
with Graphite ground plane at 100 mils.
Figure 45: 3D model, radiation pattern and antenna parameters of UFH antenna
@ 1.85 GHz with Graphite ground plane at 100 mils.
DRDC Atlantic CR 2011-070 33
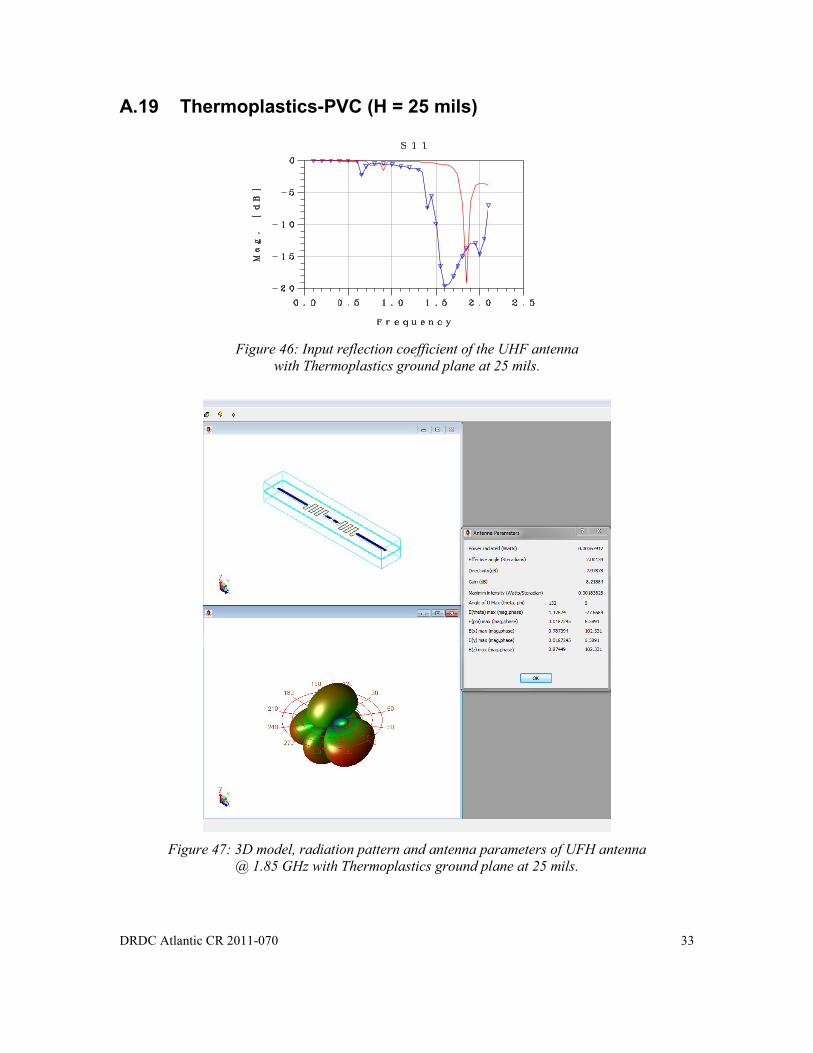
A.19 Thermoplastics-PVC (H = 25 mils)
Figure 46: Input reflection coefficient of the UHF antenna
with Thermoplastics ground plane at 25 mils.
Figure 47: 3D model, radiation pattern and antenna parameters of UFH antenna
@ 1.85 GHz with Thermoplastics ground plane at 25 mils.

34 DRDC Atlantic CR 2011-070
A.20 Thermoplastics-PVC (H = 50 mils)
Figure 48: Input reflection coefficient of the UHF antenna
with Thermoplastics ground plane at 50 mils.
Figure 49: 3D model, radiation pattern and antenna parameters of UFH antenna
@ 1.85 GHz with Thermoplastics ground plane at 50 mils.
DRDC Atlantic CR 2011-070 35
A.21 Thermoplastics-PVC (H = 100 mils)
Figure 50: Input reflection coefficient of the UHF antenna
with Thermoplastics ground plane at 100 mils.
Figure 51: 3D model, radiation pattern and antenna parameters of UFH antenna
@ 1.85 GHz with Thermoplastics ground plane at 100 mils.
36 DRDC Atlantic CR 2011-070
A.22 Wood (H = 25 mils)
Figure 52: Input reflection coefficient of the UHF antenna with Wood ground plane at 25 mils.
Figure 53: 3D model, radiation pattern and antenna parameters of UFH antenna
@ 1.85 GHz with Wood ground plane at 25 mils.

DRDC Atlantic CR 2011-070 37
A.23 Wood (H = 50 mils)
Figure 54: Input reflection coefficient of the UHF antenna with Wood ground plane at 50 mils.
Figure 55: 3D model, radiation pattern and antenna parameters of UFH antenna
@ 1.85 GHz with Wood ground plane at 50 mils.
38 DRDC Atlantic CR 2011-070
A.24 Wood (H = 100 mils)
Figure 56: Input reflection coefficient of the UHF antenna with Wood ground plane at 100 mils.
Figure 57: 3D model, radiation pattern and antenna parameters of UFH antenna
@ 1.85 GHz with Wood ground plane at 100 mils.

DRDC Atlantic CR 2011-070 39
A.25 Cardboards and paper (H = 25 mils)
Figure 58: Input reflection coefficient of the UHF antenna with paper ground plane at 25 mils.
Figure 59: 3D model, radiation pattern and antenna parameters of UFH antenna
@ 1.85 GHz with paper ground plane at 25 mils.
40 DRDC Atlantic CR 2011-070
A.26 Cardboards and paper (H = 50 mils)
Figure 60: Input reflection coefficient of the UHF antenna with paper ground plane at 50 mils.
Figure 61: 3D model, radiation pattern and antenna parameters of UFH antenna
@ 1.85 GHz with paper ground plane at 50 mils.
DRDC Atlantic CR 2011-070 41
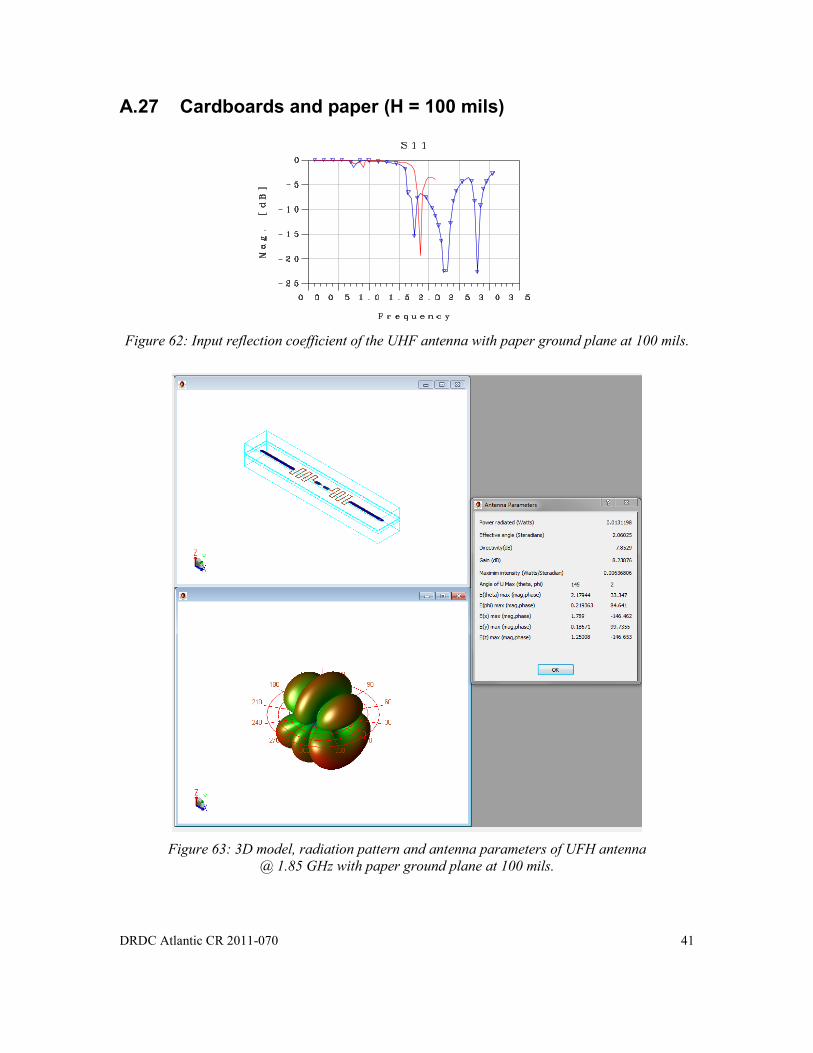
A.27 Cardboards and paper (H = 100 mils)
Figure 62: Input reflection coefficient of the UHF antenna with paper ground plane at 100 mils.
Figure 63: 3D model, radiation pattern and antenna parameters of UFH antenna
@ 1.85 GHz with paper ground plane at 100 mils.

42 DRDC Atlantic CR 2011-070
This page intentionally left blank.
DRDC Atlantic CR 2011-070 43
Annex B HF Antenna Results
Figure 64: PEC plate at 25 mils.
Figure 65: PEC plate at 50 mils.

44 DRDC Atlantic CR 2011-070
Figure 66: PEC plate at 100 mils.
Figure 67: Titanium at 25 mils.
DRDC Atlantic CR 2011-070 45
Figure 68: Titanium at 50 mils.
Figure 69: Titanium at 100 mils.

46 DRDC Atlantic CR 2011-070
Figure 70: Aluminum 2024 – T3 at 25 mils.
Figure 71: Aluminum 2024 – T3 at 50 mils.
DRDC Atlantic CR 2011-070 47
Figure 72: Aluminum 2024 – T3 at 100 mils.
Figure 73: Aluminum 7075 – T6 at 25 mils.
48 DRDC Atlantic CR 2011-070
Figure 74: Aluminum 7075 – T6 at 50 mils.
Figure 75: Aluminum 7075 – T6 at 100 mils.
DRDC Atlantic CR 2011-070 49
Figure 76: Iron at 25 mils.
Figure 77: Iron at 50 mils.
50 DRDC Atlantic CR 2011-070
Figure 78: Iron at 100 mils.
Figure 79: Graphite at 25 mils.
DRDC Atlantic CR 2011-070 51
Figure 80: Graphite at 10 mils.
Figure 81: Graphite at 100 mils.
52 DRDC Atlantic CR 2011-070
Figure 82: Thermoplastics at 25 mils.
Figure 83: Thermoplastics at 50 mils.
DRDC Atlantic CR 2011-070 53
Figure 84: Thermoplastics at 100 mils.
Figure 85: Wood at 25 mils.
54 DRDC Atlantic CR 2011-070
Figure 86: Wood at 50 mils.
Figure 87: Wood at 100 mils.
DRDC Atlantic CR 2011-070 55
Figure 88: Paper at 25 mils.
Figure 89: Paper at 50 mils.
56 DRDC Atlantic CR 2011-070
Figure 90: Paper at 100 mils.
DOCUMENT CONTROL DATA (Security classification of title, body of abstract and indexing annotation must be entered when the overall document is classified)
1. ORIGINATOR (The name and address of the organization preparing the document.
Organizations for whom the document was prepared, e.g. Centre sponsoring a
contractor's report, or tasking agency, are entered in section 8.)
École de technologie supérieure Department of Electrical Engineering 1100, Notre-Dame Street West, Office A2954 Montréal, QC Canada H3C 1K3
2. SECURITY CLASSIFICATION (Overall security classification of the document including
special warning terms if applicable.)
UNCLASSIFIED (NON-CONTROLLED GOODS) DMC A REVIEW: GCEC DECEMBER 2012
3. TITLE (The complete document title as indicated on the title page. Its classification should be indicated by the appropriate abbreviation (S, C or U)
in parentheses after the title.)
Electromagnetic Effects on Radio Frequency Identification (RFID) Performance
4. AUTHORS (last name, followed by initials – ranks, titles, etc. not to be used)
Ammar B. Kouki
5. DATE OF PUBLICATION (Month and year of publication of document.)
July 2011
6a. NO. OF PAGES
(Total containing information,
including Annexes, Appendices,
etc.)
72
6b. NO. OF REFS
(Total cited in document.)
3
7. DESCRIPTIVE NOTES (The category of the document, e.g. technical report, technical note or memorandum. If appropriate, enter the type of report,
e.g. interim, progress, summary, annual or final. Give the inclusive dates when a specific reporting period is covered.)
Contract Report
8. SPONSORING ACTIVITY (The name of the department project office or laboratory sponsoring the research and development – include address.)
Defence R&D Canada – Atlantic 9 Grove Street P.O. Box 1012 Dartmouth, Nova Scotia B2Y 3Z7
9a. PROJECT OR GRANT NO. (If appropriate, the applicable research
and development project or grant number under which the document
was written. Please specify whether project or grant.)
13pl
9b. CONTRACT NO. (If appropriate, the applicable number under
which the document was written.)
10a. ORIGINATOR'S DOCUMENT NUMBER (The official document
number by which the document is identified by the originating
activity. This number must be unique to this document.)
DRDC Atlantic CR 2011-070
10b. OTHER DOCUMENT NO(s). (Any other numbers which may be
assigned this document either by the originator or by the sponsor.)
11. DOCUMENT AVAILABILITY (Any limitations on further dissemination of the document, other than those imposed by security classification.)
Unlimited
12. DOCUMENT ANNOUNCEMENT (Any limitation to the bibliographic announcement of this document. This will normally correspond to the
Document Availability (11). However, where further distribution (beyond the audience specified in (11) is possible, a wider announcement
audience may be selected.))
Unlimited
13. ABSTRACT (A brief and factual summary of the document. It may also appear elsewhere in the body of the document itself. It is highly desirable
that the abstract of classified documents be unclassified. Each paragraph of the abstract shall begin with an indication of the security classification
of the information in the paragraph (unless the document itself is unclassified) represented as (S), (C), (R), or (U). It is not necessary to include
here abstracts in both official languages unless the text is bilingual.)
The goal of this study is to assess the impact of changes in the electromagnetic environment,
particularly changes related to the position and conductivity of surrounding materials, on
selected Radio Frequency Identification (RFID) systems’ performance. To this end, two
different RFID tag antennas have been modeled and their electromagnetic performance was
simulated in the presence of various materials situated at varying distances from the antenna.
The first structure is illustrative of UHF RFID antennas, i.e., an antenna operating around
1.8 GHz, while the second is an HF antenna, operating in the 13 MHz band. Results show that
both type of material used and distance at which it is placed relative to the RFID tag affect
significantly the antenna’s resonance frequency. Further investigations are needed before a full
understanding of the effect of adjacent (host) material, tag antenna design, frequency and gain
on the performance of an RFID system is developed.
La présente étude vise à évaluer l’incidence des changements dans un environnement
électromagnétique, notamment ceux associés à la position et à la conductivité des matériaux
environnants, sur les performances des systèmes d’identification par radiofréquence (RFID)
choisis. À cet effet, deux antennes d’étiquettes RFID différentes ont été modélisées, et leurs
performances électromagnétiques ont été simulées en présence de divers matériaux placés à des
distances variables de l’antenne. La première structure représente une antenne RFID UHF, qui
fonctionne à une fréquence d’environ 1,8 GHz, et la seconde structure est une antenne HF, qui
fonctionne dans la bande de 13 MHz. Selon les résultats, le type de matériau utilisé et la
distance à laquelle il est placé par rapport à l’étiquette RFID influent tous deux de façon
importante sur la fréquence de résonance de l’antenne. D’autres recherches sont nécessaires
pour bien comprendre l’effet d’un matériau adjacent (hôte), de la conception d’une antenne
d’étiquette, de la fréquence et du gain sur les performances d’un système RFID.
14. KEYWORDS, DESCRIPTORS or IDENTIFIERS (Technically meaningful terms or short phrases that characterize a document and could be
helpful in cataloguing the document. They should be selected so that no security classification is required. Identifiers, such as equipment model
designation, trade name, military project code name, geographic location may also be included. If possible keywords should be selected from a
published thesaurus, e.g. Thesaurus of Engineering and Scientific Terms (TEST) and that thesaurus identified. If it is not possible to select
indexing terms which are Unclassified, the classification of each should be indicated as with the title.)
RFID; electromagnetic; power; modeling; simulation

This page intentionally left blank.