Embed Size (px)
Citation preview
Journal of Minerals & Materials Characterization & Engineering, Vol. 4, No. 2, pp 75-84, 2005jmmce.org Printed in the USA. All rights reserved
75
Electrochemical Impedance Spectroscopy Of Epoxy-Coated SteelExposed To Dead Sea Water
Sami MasadehMaterials and Metallurgical Engineering Department
Al-Balqa Applied University, Al-Sult [email protected]
Abstract:
Electrochemical impedance tests were applied to steel specimens which were coated byepoxy and tested after immersion in Dead Sea water for different periods at roomtemperature and at 50C. Results taken from Nyquist and Bode plots and as were analyzedby means of software provided with the instrument. Results were presented as the valuesof capacitance and resistance (Cdl and Rct). Results show that degradation occurredafter immersion in the test solution, and were more severe at higher temperature.Specimens were examined under scanning electron microscope, and micrographs showedclear rupture and degradation in epoxy coatings.
Key words: Electrochemical impedance spectroscopy, epoxy, Dead Sea water, coatings.
INTRODUCTION
The Dead Sea lies between Jordan and Israel. Its water is unique because itcontains a number of salts with compositions different than any other sea water in theworld. The composition of Dead Sea water is as follows: 14.5% MgCl, 7.5% NaCl, 3.8%CaCl2, 0.5% MgBr2, 1.2% KCl, and rest is water. Some industrial and tourist structureslay at sea coast; severe corrosion problems encounter sea water due to high chloridescontent. In many cases, corrosion can not be controlled unless very special alloy steel isused. In this work, an investigation regarding the effectiveness of epoxy coating incorrosion control. Electrochemical impedance spectroscopy was used due to its wellknown accuracy in testing and efficiency in the evaluation of polymer coated metals andany change may come over during exposure to corrosive environments [1-6]. Besides theadvantages that can electrochemical impedance spectroscopy offer for the analysis ofadhesion of coatings at coating-metal interface as is worked by many researchers [7-13].
Experimental
Forty specimens in the form of disks having 15 mm diameter and 5 mm thicknesswere used in this work. Specimens were ground, cleaned and degreased. Epoxy primercoating were applied to specimen surfaces and they were left to dry for four hours at 23 Cas recommended by the manufacturer. Epoxy coating then were applied by means of airspraying with recommended tip range and total output pressure. Steel discs then were leftto dry at 23 C for 8 hours. Coating thickness was measured by a thickness gage meter andwas found to be about 200 micron. Two specimens were tested as soon as they were
76 Sami Masadeh Vol. 4, No. 2
immersed in testing solution and were considered as time zero. Twenty specimens wereimmersed in testing solution at room temperature, while the other twenty were immersedin the solution in a furnace at 50 C. Data were collected for specimens immersed insolution for 133 day at room temperature and at 50 C. Electrochemical impedance testswere carried out by using Autolab PGSTAT 30 provided with frequency responseanalyzer, FRA2 in the range from 1 Hz to 1 kHz to collect data with a total number of 40readings for the whole range. Data were collected by means of Frequency ResponseAnalyzer software developed by Autolab instruments and were in the form of Bode andNyquist plots. Tested specimens were washed by distilled water, and then gold coatedand examined under scanning electron microscope.
RESULTS AND DISCUSSION
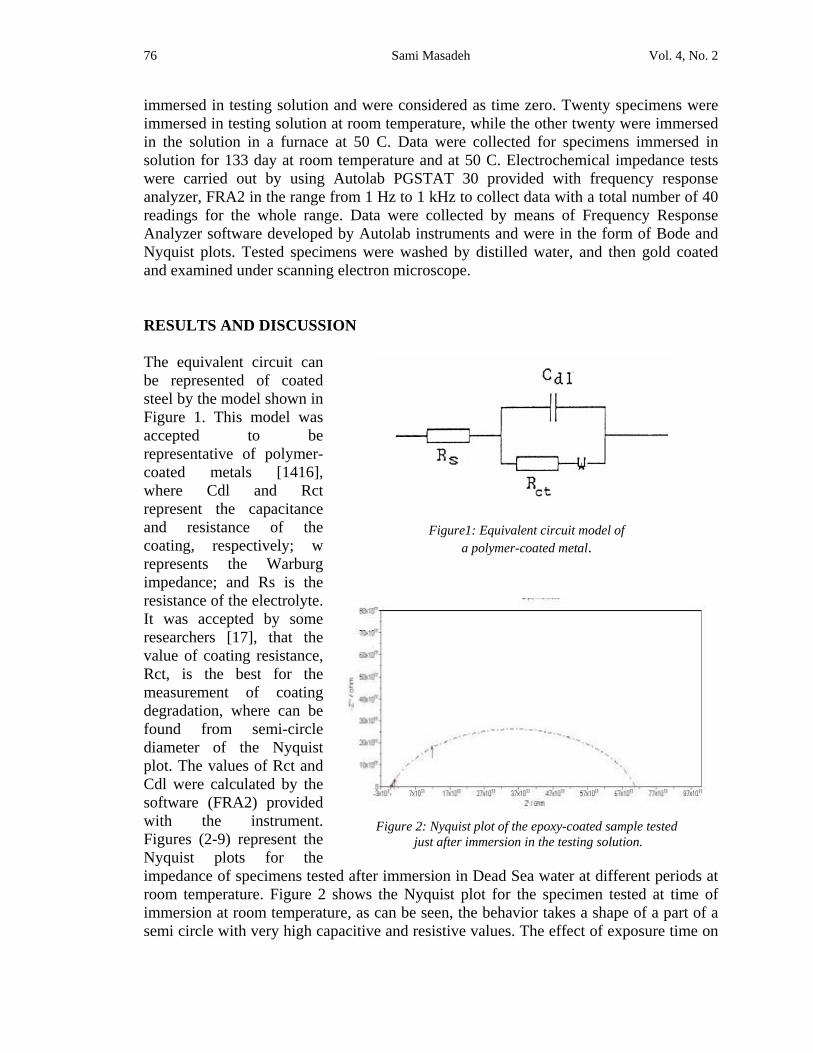
The equivalent circuit canbe represented of coatedsteel by the model shown inFigure 1. This model wasaccepted to berepresentative of polymer-coated metals [1416],where Cdl and Rctrepresent the capacitanceand resistance of thecoating, respectively; wrepresents the Warburgimpedance; and Rs is theresistance of the electrolyte.It was accepted by someresearchers [17], that thevalue of coating resistance,Rct, is the best for themeasurement of coatingdegradation, where can befound from semi-circlediameter of the Nyquistplot. The values of Rct andCdl were calculated by thesoftware (FRA2) providedwith the instrument.Figures (2-9) represent theNyquist plots for theimpedance of specimens tested after immersion in Dead Sea water at different periods atroom temperature. Figure 2 shows the Nyquist plot for the specimen tested at time ofimmersion at room temperature, as can be seen, the behavior takes a shape of a part of asemi circle with very high capacitive and resistive values. The effect of exposure time on
Figure1: Equivalent circuit model ofa polymer-coated metal.
Figure 2: Nyquist plot of the epoxy-coated sample tested just after immersion in the testing solution.
Vol. 4, No. 2. Electrochemical Impedance Spectroscopy Of Epoxy-Coated Steel 77Exposed To Dead Sea Water
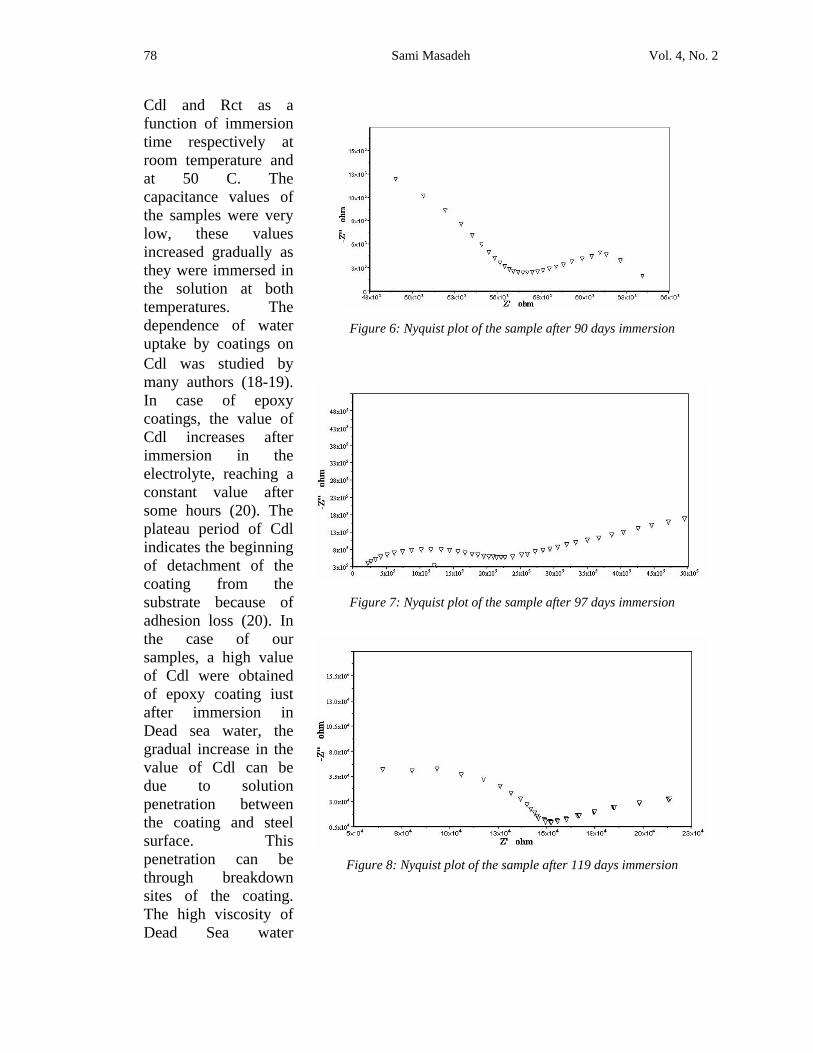
Figure 4: Nyquist plot of the sample after 23 days immersion.
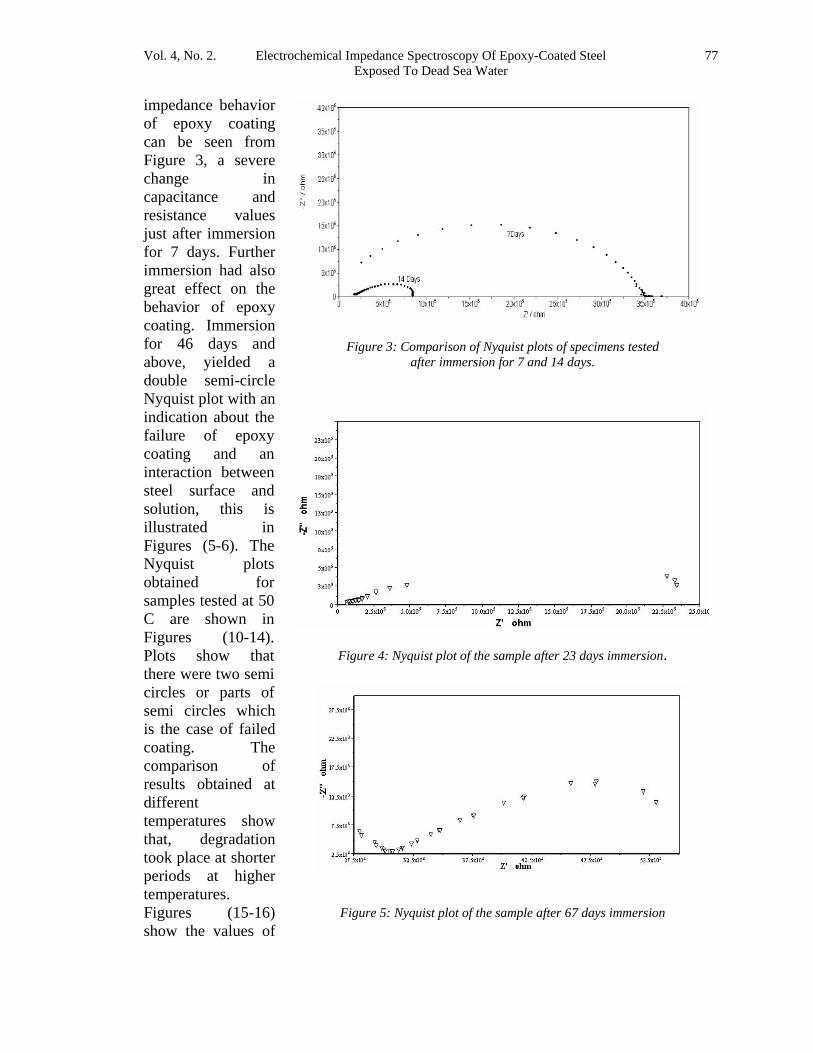
impedance behaviorof epoxy coatingcan be seen fromFigure 3, a severechange incapacitance andresistance valuesjust after immersionfor 7 days. Furtherimmersion had alsogreat effect on thebehavior of epoxycoating. Immersionfor 46 days andabove, yielded adouble semi-circleNyquist plot with anindication about thefailure of epoxycoating and aninteraction betweensteel surface andsolution, this isillustrated inFigures (5-6). TheNyquist plotsobtained forsamples tested at 50C are shown inFigures (10-14).Plots show thatthere were two semicircles or parts ofsemi circles whichis the case of failedcoating. Thecomparison ofresults obtained atdifferenttemperatures showthat, degradationtook place at shorterperiods at highertemperatures.Figures (15-16)show the values of
Figure 3: Comparison of Nyquist plots of specimens testedafter immersion for 7 and 14 days.
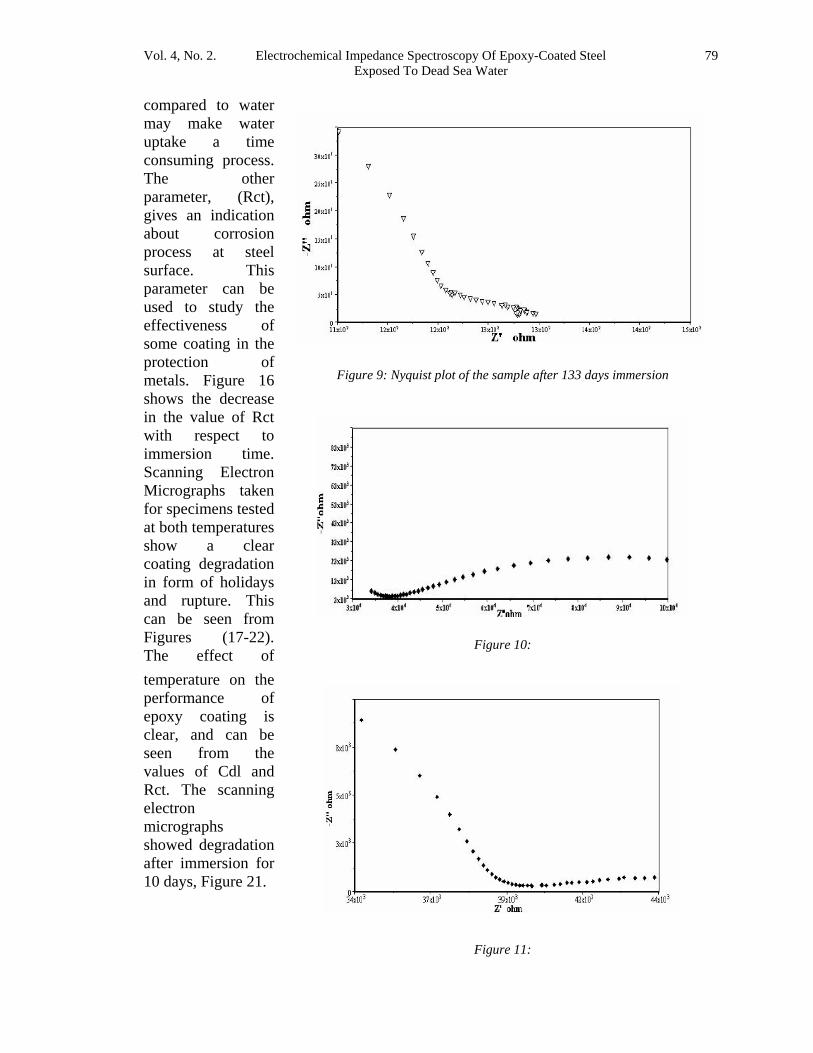
Figure 5: Nyquist plot of the sample after 67 days immersion
78 Sami Masadeh Vol. 4, No. 2
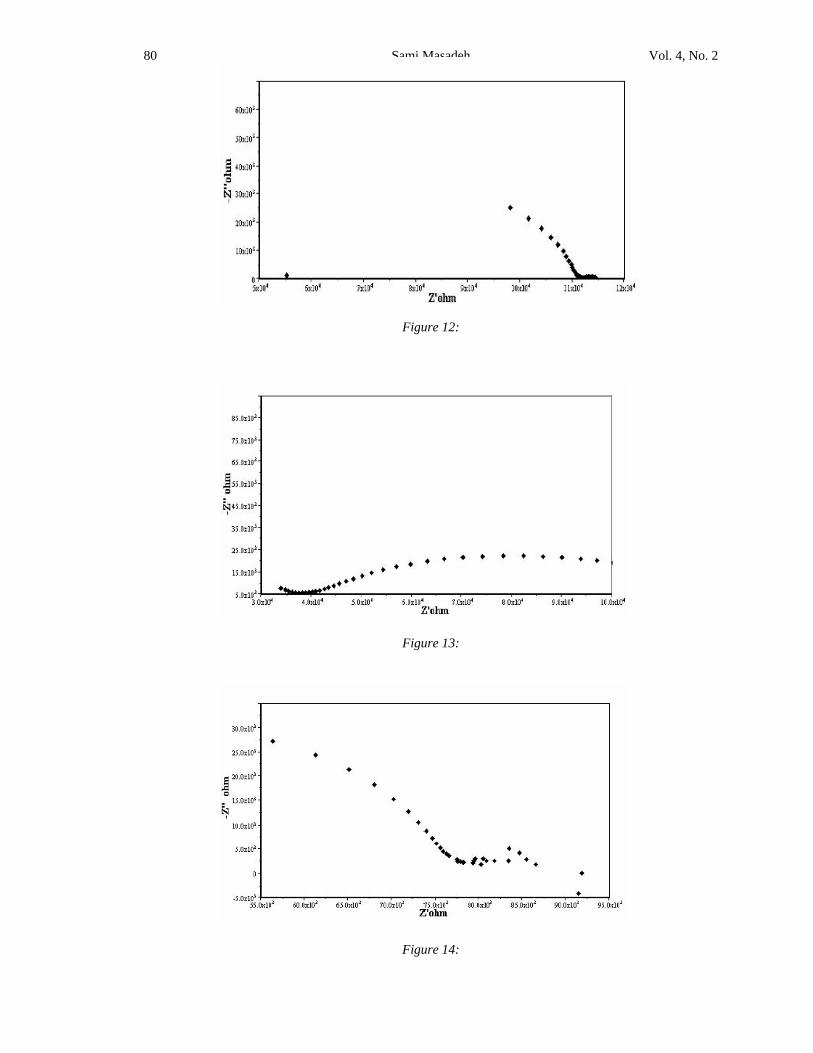
Figure 6: Nyquist plot of the sample after 90 days immersion
Figure 7: Nyquist plot of the sample after 97 days immersion
Figure 8: Nyquist plot of the sample after 119 days immersion
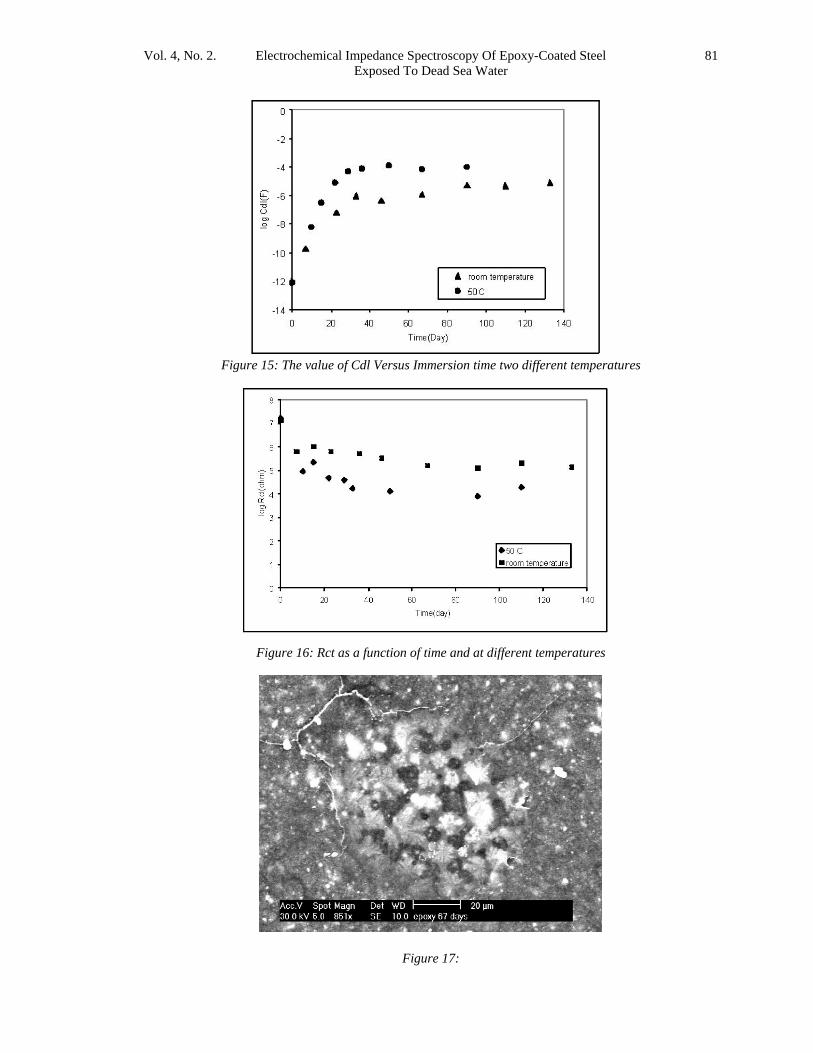
Cdl and Rct as afunction of immersiontime respectively atroom temperature andat 50 C. Thecapacitance values ofthe samples were verylow, these valuesincreased gradually asthey were immersed inthe solution at bothtemperatures. Thedependence of wateruptake by coatings onCdl was studied bymany authors (18-19).In case of epoxycoatings, the value ofCdl increases afterimmersion in theelectrolyte, reaching aconstant value aftersome hours (20). Theplateau period of Cdlindicates the beginningof detachment of thecoating from thesubstrate because ofadhesion loss (20). Inthe case of oursamples, a high valueof Cdl were obtainedof epoxy coating iustafter immersion inDead sea water, thegradual increase in thevalue of Cdl can bedue to solutionpenetration betweenthe coating and steelsurface. Thispenetration can bethrough breakdownsites of the coating.The high viscosity ofDead Sea water
Vol. 4, No. 2. Electrochemical Impedance Spectroscopy Of Epoxy-Coated Steel 79Exposed To Dead Sea Water
Figure 9: Nyquist plot of the sample after 133 days immersion
Figure 10:
Figure 11:
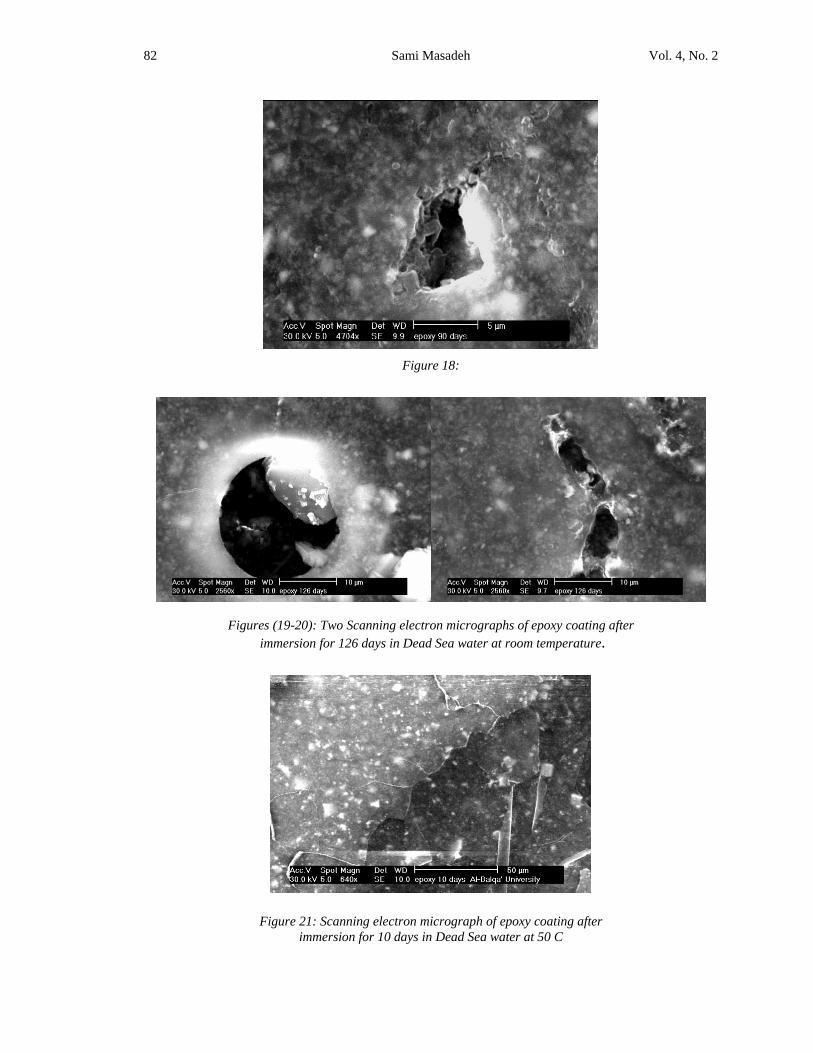
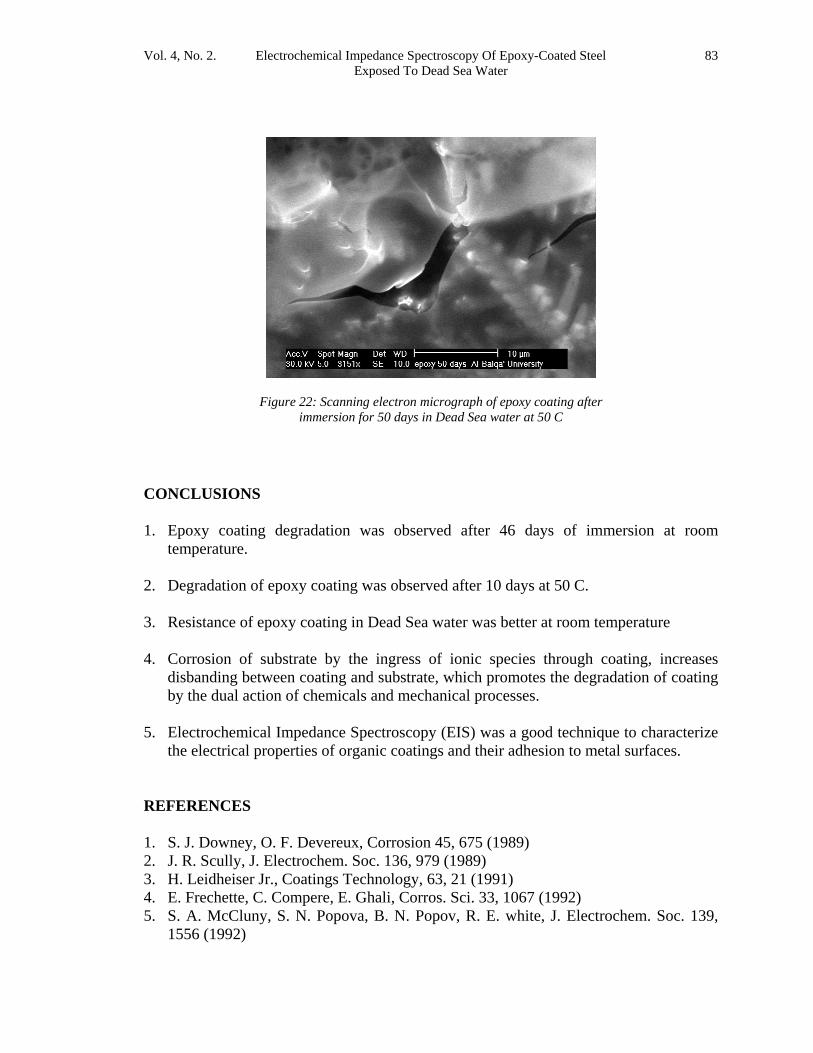
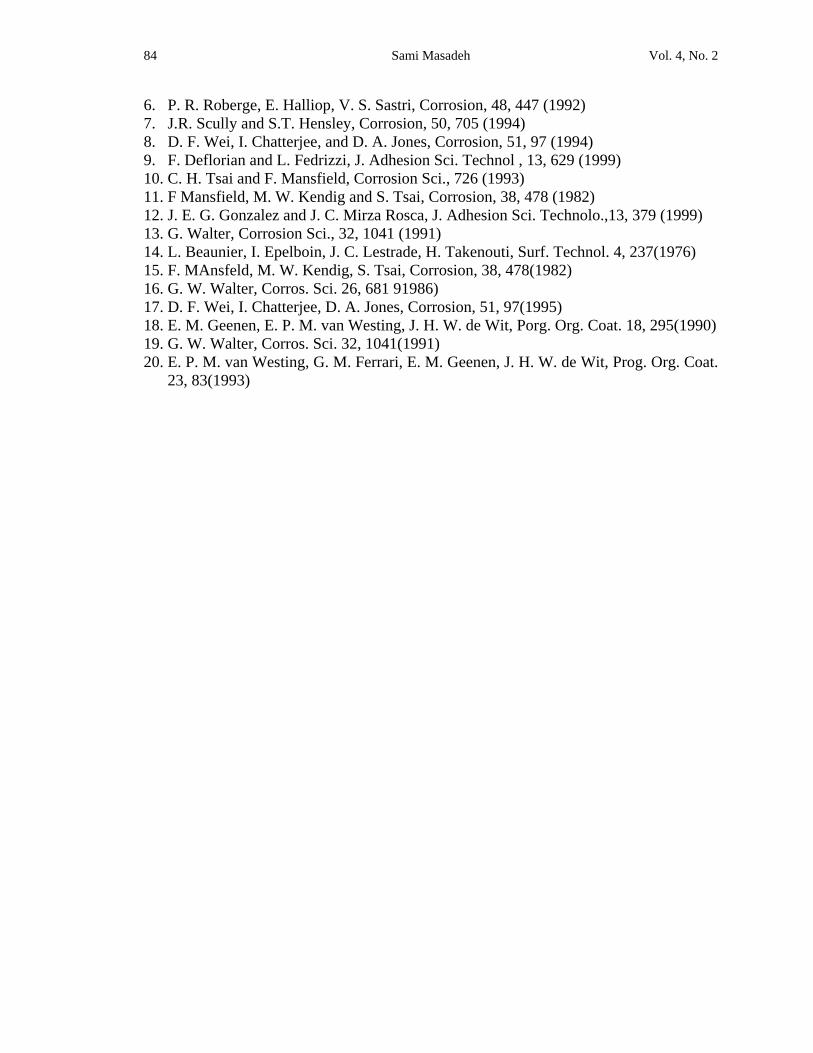
compared to watermay make wateruptake a timeconsuming process.The otherparameter, (Rct),gives an indicationabout corrosionprocess at steelsurface. Thisparameter can beused to study theeffectiveness ofsome coating in theprotection ofmetals. Figure 16shows the decreasein the value of Rctwith respect toimmersion time.Scanning ElectronMicrographs takenfor specimens testedat both temperaturesshow a clearcoating degradationin form of holidaysand rupture. Thiscan be seen fromFigures (17-22).The effect oftemperature on theperformance ofepoxy coating isclear, and can beseen from thevalues of Cdl andRct. The scanningelectronmicrographsshowed degradationafter immersion for10 days, Figure 21.
80 Sami Masadeh Vol. 4, No. 2
Figure 13:
Figure 14:
Figure 12:
Vol. 4, No. 2. Electrochemical Impedance Spectroscopy Of Epoxy-Coated Steel 81Exposed To Dead Sea Water
Figure 15: The value of Cdl Versus Immersion time two different temperatures
Figure 16: Rct as a function of time and at different temperatures
Figure 17:
82 Sami Masadeh Vol. 4, No. 2
Figure 18:
Figures (19-20): Two Scanning electron micrographs of epoxy coating after immersion for 126 days in Dead Sea water at room temperature.
Figure 21: Scanning electron micrograph of epoxy coating afterimmersion for 10 days in Dead Sea water at 50 C
Vol. 4, No. 2. Electrochemical Impedance Spectroscopy Of Epoxy-Coated Steel 83Exposed To Dead Sea Water
CONCLUSIONS
1. Epoxy coating degradation was observed after 46 days of immersion at roomtemperature.
2. Degradation of epoxy coating was observed after 10 days at 50 C.
3. Resistance of epoxy coating in Dead Sea water was better at room temperature
4. Corrosion of substrate by the ingress of ionic species through coating, increasesdisbanding between coating and substrate, which promotes the degradation of coatingby the dual action of chemicals and mechanical processes.
5. Electrochemical Impedance Spectroscopy (EIS) was a good technique to characterizethe electrical properties of organic coatings and their adhesion to metal surfaces.
REFERENCES
1. S. J. Downey, O. F. Devereux, Corrosion 45, 675 (1989)2. J. R. Scully, J. Electrochem. Soc. 136, 979 (1989)3. H. Leidheiser Jr., Coatings Technology, 63, 21 (1991)4. E. Frechette, C. Compere, E. Ghali, Corros. Sci. 33, 1067 (1992)5. S. A. McCluny, S. N. Popova, B. N. Popov, R. E. white, J. Electrochem. Soc. 139,
1556 (1992)
Figure 22: Scanning electron micrograph of epoxy coating afterimmersion for 50 days in Dead Sea water at 50 C
84 Sami Masadeh Vol. 4, No. 2
6. P. R. Roberge, E. Halliop, V. S. Sastri, Corrosion, 48, 447 (1992)7. J.R. Scully and S.T. Hensley, Corrosion, 50, 705 (1994)8. D. F. Wei, I. Chatterjee, and D. A. Jones, Corrosion, 51, 97 (1994)9. F. Deflorian and L. Fedrizzi, J. Adhesion Sci. Technol , 13, 629 (1999)10. C. H. Tsai and F. Mansfield, Corrosion Sci., 726 (1993)11. F Mansfield, M. W. Kendig and S. Tsai, Corrosion, 38, 478 (1982)12. J. E. G. Gonzalez and J. C. Mirza Rosca, J. Adhesion Sci. Technolo.,13, 379 (1999)13. G. Walter, Corrosion Sci., 32, 1041 (1991)14. L. Beaunier, I. Epelboin, J. C. Lestrade, H. Takenouti, Surf. Technol. 4, 237(1976)15. F. MAnsfeld, M. W. Kendig, S. Tsai, Corrosion, 38, 478(1982)16. G. W. Walter, Corros. Sci. 26, 681 91986)17. D. F. Wei, I. Chatterjee, D. A. Jones, Corrosion, 51, 97(1995)18. E. M. Geenen, E. P. M. van Westing, J. H. W. de Wit, Porg. Org. Coat. 18, 295(1990)19. G. W. Walter, Corros. Sci. 32, 1041(1991)20. E. P. M. van Westing, G. M. Ferrari, E. M. Geenen, J. H. W. de Wit, Prog. Org. Coat.
23, 83(1993)