Embed Size (px)
Citation preview
Int. J. Electrochem. Sci., 6 (2011) 2730 - 2745
International Journal of
ELECTROCHEMICAL SCIENCE
www.electrochemsci.org
Electrochemical and SPR Characterization of a Polypyrrole-
Modified Carbon Paste Electrode Useful for the Potentiostatic
Quantification of Surfactants
L. A. Rodríguez- Bravo1, M. Palomar- Pardavé
1,*, S. Corona-Avendaño
1, M. Romero-Romo
1,
H. Herrera-Hernández1, M.T. Ramírez-Silva
2, R. Escarela-Pérez
3
1 Universidad Autónoma Metropolitana Azcapotzalco, Departamento de Materiales, Av. San Pablo
#180, Col. Reynosa-Tamaulipas, C.P. 02200, México, D. F. 2
Universidad Autónoma Metropolitana Iztapalapa, Departamento de Química, Av. San Rafael Atlixco
#186, Col. Vicentina, C.P. 09340, México, D. F. 3
Universidad Autónoma Metropolitana Azcapotzalco, Departamento de Energía, Av. San Pablo #180,
Col. Reynosa-Tamaulipas, C.P. 02200, México, D. F. *E-mail: [email protected]
Received: 4 May 2011 / Accepted: 30 May 2011 / Published: 1 July 2011
The electrochemical synthesis of a polypyrrole membrane doped with sodium dodecyl sulphate on the
surface of a carbon paste electrode (CPE/Ppy-SDS) useful for the anionic surfactants’ potentiometric
quantification either as monomers or micelles, is presented. The synthesis parameters to optimize the
sensitivity of this membrane towards SDS determination were also found. The best membrane
displayed the following analytical features for SDS quantification: a sensitivity of 50.10 mV per
decade, a linear range of 33 to 7943 M and a detection limit of 33.9 M. From EIS measurements the
diffusion coefficient of DS− ions throughout the polymeric membrane was estimated to be 3.53 and
5.30 x 10⁻¹¹
cm2s
−1 for the membranes with the lowest and the highest sensitivity, respectively. From a
comparison of the respective resistance and capacitance values it is possible to conclude that as the
DS− ions residence time is larger, the best sensitivity is achieved. Moreover, it was demonstrated that
with this electrode both surfactants, SDS and sodium dodecylbenzene sulfonate, SDBS, can be
measured without interferences from each other. SPR measurements spectra indicated that deposition
of the pyrrole molecules occurs in a uniform fashion.
Keywords: Ion selective electrode, surfactants, polypyrrole, SPR
1. INTRODUCTION
It is reasonable to state that practically the whole range of analytical measurement instruments
have been used to analyze surfactants; naturally, the amount of analytical success accrued has been
related to the kind of surfactant or problem to solve [1-17].
Int. J. Electrochem. Sci., Vol. 6, 2011
2731
To mention but one among the most common techniques, there is the automatic titration
supported by ion selective electrodes (ISE) [18-23], giving as one of its main advantages the
elimination of reactants, although the results only render the overall amount of surfactants, anionic,
cationic or non-ionic according to the ISE used.
Many authoritative recent papers have shown that the electrochemical modification of electrode
surfaces with conductive polymers [24-30] is a powerful means for the development of ISEs for the
quantification of different analytes [25, 31]. Nevertheless, the quantification of analytes, in particular
surfactants, bearing a very similar structure is a continued challenge. In this work we aboard the
problem of electrochemical synthesis and characterization of an ISE for the simultaneous
determination of two anionic surfactants.
2. EXPERIMENTAL
2.1. Reagents
All reagents used in this work have analytical grade; the SDS (Aldrich) was used as supporting
electrolyte and source of DS- ions. Pyrrole (Py) (Aldrich) was distilled in a N2 atmosphere. Ultrapure
monocrystalline graphite powder 99,999% was used to construct the working carbon paste electrode.
All solutions were prepared with deionised water obtained
from a Milli Q (Millipore) system with 18.2 Mcm resistivity. The Py solutions containing
SDS were bubbled with high purity N2 before each experiment.
2.2. Instrumentation
2.2.1. Electrochemical experiments
A typical three-electrode cell was used, where a platinum wire was used as counter electrode,
an Ag/AgCl (900200 Orion) was the reference electrode and a CPE was the working electrode.
The latter was prepared as described by Álvarez-Romero et al. [24,25] Subsequently, the
exposed surface was polished before the electrochemical growth of the polypyrrole films (Ppy) that
were obtained potentiodinamically using an electrochemical workstation (Ecochemie) PGSTAT 30
AUTOLAB.
This potentiostat was also used for the electrochemical impedance, EIS, measurements, which
were carried out in the frequency range of 106-10
-2 Hz with 10 points/decade at the AC voltage signal
of 10 mV; Nyquist plots resulted from this experiment. The best semicircle was analyzed and fitted
using the Zview software, which fits the experimental EIS data to an appropriate equivalent electrical
circuit (EEC). All potentiometric measurements were referred to the Ag/AgCl saturated electrode
potential.
Int. J. Electrochem. Sci., Vol. 6, 2011
2732
2.2.2. Surface plasmon resonance (SPR) experiments
An electrochemical cell was used for the combined electrochemistry and SPR measurements,
also using an Autolab SPRINGLE system in combination with a PGSTAT 30 AUTOLAB potentiostat
to conduct them. Where a solid Ag/AgCl electrode [32] was used as a reference, a Pt rod as a counter
electrode and the gold surface of the sensor disk (gold covered glass) functioned as the working
electrode.
2.2.3. Scanning electron microscopy (SEM) characterization
The scanning electron microscopy (SEM) secondary electron images of the Ppy films were
obtained with the aid of a JEO L JSM 6300 microscope.
2.3. Synthesis of Ppy-SDS films
Ppy-SDS films were electropolymerized by the cycle voltammetry technique, CV, onto the
bare surface of the CPE, the controlled synthesis variables were: the potential scan rate, the number of
CV cycles, the pyrrole [Py] and sodium dodecyl sulphate [SDS] concentrations. A series of
experiments were proposed in order to find out the sensitivity of the CPE-Ppy-SDS modified electrode
towards the [SDS] in aqueous solution.
The potentiometric response was evaluated by constructing the corresponding calibration plots
using different SDS concentrations. The potentiometric data were then analyzed by statistical fitting of
the linear “C” zone, see below.
3. RESULTS AND DISCUSSION
3.1. Electrochemical synthesis of the Ppy-SDS membrane
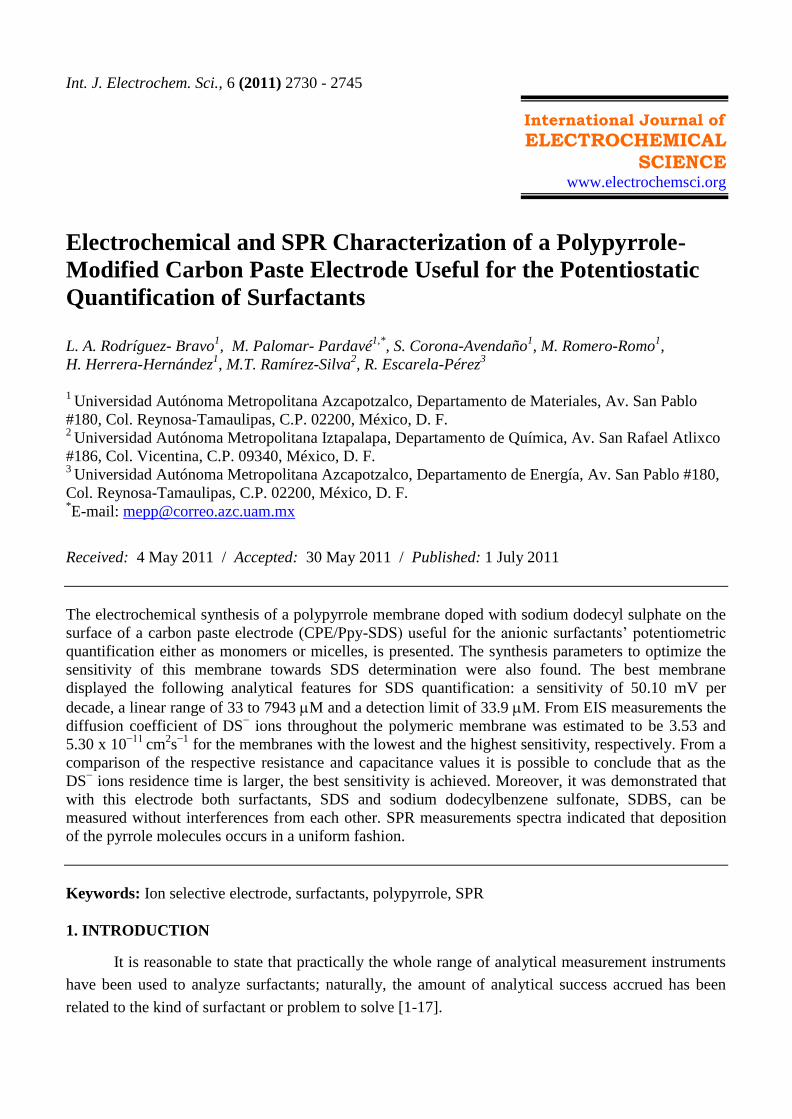
Figure 1 shows a family of potentiodynamic plots recorded in the system: CPE / 100 mM Py,
50 mM SDS. It becomes plain that as the number of voltammetry cycles increases, both the anodic
and cathodic current peaks increase.
Moreover, the charge associated to these peaks also increase. This behavior is typically found
during the electrodeposition of conducting polymers [26-29].
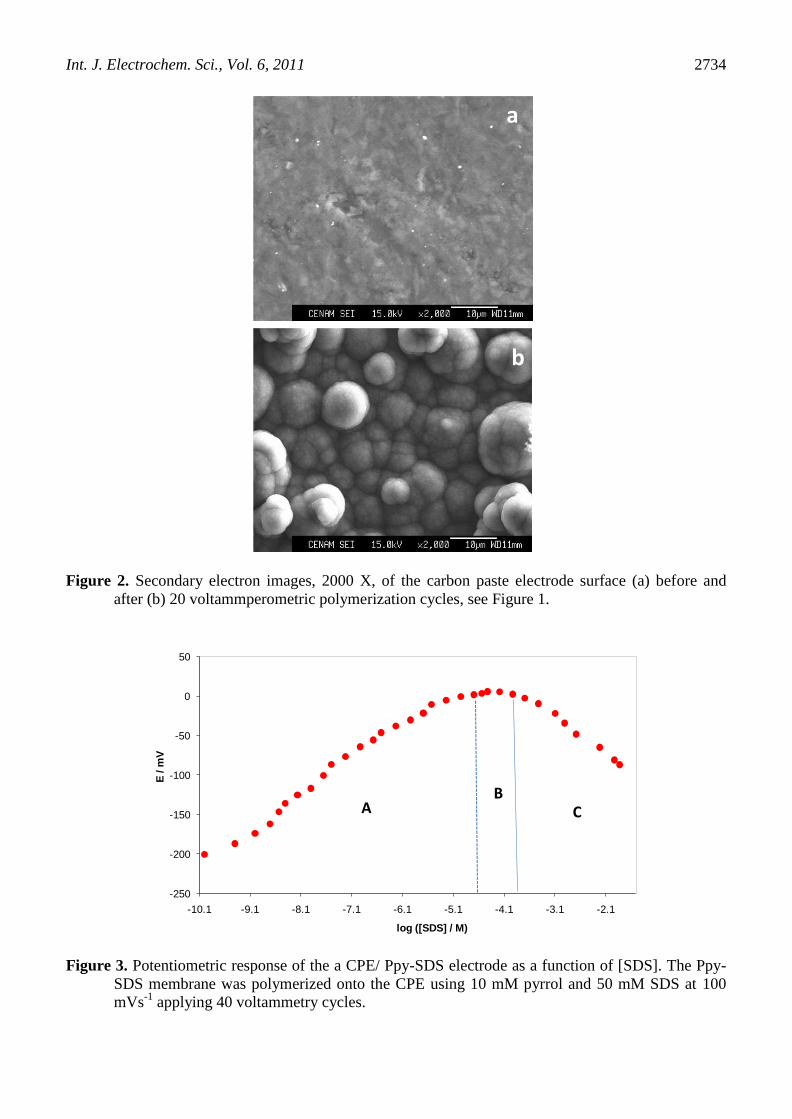
3.2. SEM characterization of the electrochemical synthized Ppy-SDS membrane
Figure 2 depicts the SEI-SEM images of the CPE surface before and after application of 20
voltammetry cycles as described in Figure 1, where it is possible to note that the CPE is completely
covered by the electrodeposited Ppy-SDS membrane.
Int. J. Electrochem. Sci., Vol. 6, 2011
2733
-1000
-600
-200
200
600
1000
-1500 -1000 -500 0 500 1000
E /mV
i/
A
-0.016
-0.014
-0.012
-0.01
-0.008
-0.006
-0.004
-0.002
0
0 1 2 3 4 5 6 7 8 9 10 11 12 13 14 15 16 17 18 19 20
Cycles
Qc/
C
0
0.005
0.01
0.015
0.02
0.025
0 1 2 3 4 5 6 7 8 9 10 11 12 13 14 15 16 17 18 19 20
Cycles
Qa/
C
Figure 1. Family of 20 cyclic voltammograms, recorded in the system CPE / 100 mM Py, 50 mM
SDS. The potential scan started at -100 mV toward the positive direction at 200 mVs-1
scan
rate. The variation of both: the cathodic, Qc, and anodic, Qa charge as a function of the
voltammetry cycles is also shown in the figure.
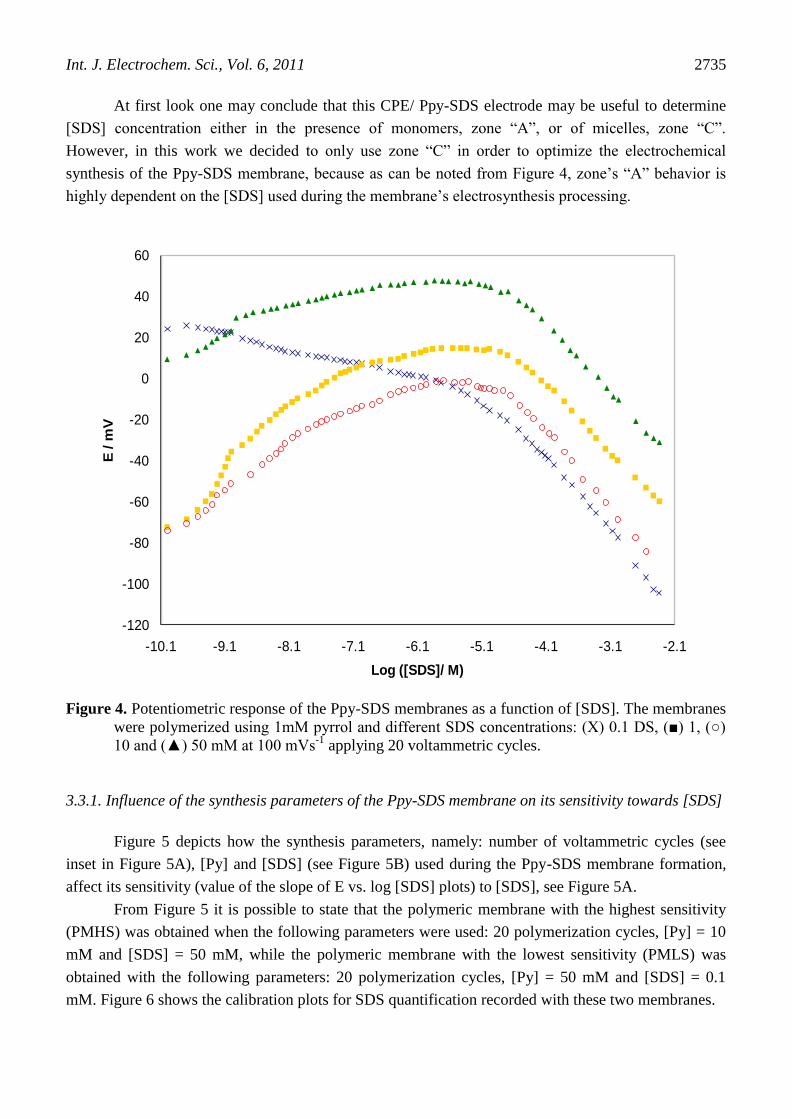
3.3. Optimization of the Ppy-SDS membrane referred to its potentiometric response to SDS
The potentiometric response of the electro-synthesized Ppy-SDS membranes onto the CPE
surfaces was obtained by immersion into a SDS aqueous solution, and by recording the potential at
various SDS concentration increments, see Figure 3. From Figure 3, there are three different zones that
can be clearly noted: in zone “A” the CPE/Ppy-SDS electrode potential increases as the [SDS]
increases, this is then followed by a small zone named “B” where the potential practically remains
independent of the [SDS]; after, there is zone “C” where the electrode’s potential linearly diminish as
the [SDS] was raised. This behavior may be associated with the amphiphilic nature of the SDS
molecules, which in aqueous solutions can form aggregates termed micelles. The critical micellar
concentration, CMC, determines the concentration, C, value at which the surfactant molecules present
in solution tend to form micelles (C > CMC) or where they are mainly present as monomers (C <
CMC) [33,34].
Int. J. Electrochem. Sci., Vol. 6, 2011
2734
a
b
Figure 2. Secondary electron images, 2000 X, of the carbon paste electrode surface (a) before and
after (b) 20 voltammperometric polymerization cycles, see Figure 1.
-250
-200
-150
-100
-50
0
50
-10.1 -9.1 -8.1 -7.1 -6.1 -5.1 -4.1 -3.1 -2.1
E / m
V
log ([SDS] / M)
AB
C
Figure 3. Potentiometric response of the a CPE/ Ppy-SDS electrode as a function of [SDS]. The Ppy-
SDS membrane was polymerized onto the CPE using 10 mM pyrrol and 50 mM SDS at 100
mVs-1
applying 40 voltammetry cycles.
Int. J. Electrochem. Sci., Vol. 6, 2011
2735
At first look one may conclude that this CPE/ Ppy-SDS electrode may be useful to determine
[SDS] concentration either in the presence of monomers, zone “A”, or of micelles, zone “C”.
However, in this work we decided to only use zone “C” in order to optimize the electrochemical
synthesis of the Ppy-SDS membrane, because as can be noted from Figure 4, zone’s “A” behavior is
highly dependent on the [SDS] used during the membrane’s electrosynthesis processing.
-120
-100
-80
-60
-40
-20
0
20
40
60
-10.1 -9.1 -8.1 -7.1 -6.1 -5.1 -4.1 -3.1 -2.1
E / m
V
Log ([SDS]/ M)
Figure 4. Potentiometric response of the Ppy-SDS membranes as a function of [SDS]. The membranes
were polymerized using 1mM pyrrol and different SDS concentrations: (X) 0.1 DS, (■) 1, (○)
10 and (▲) 50 mM at 100 mVs-1
applying 20 voltammetric cycles.
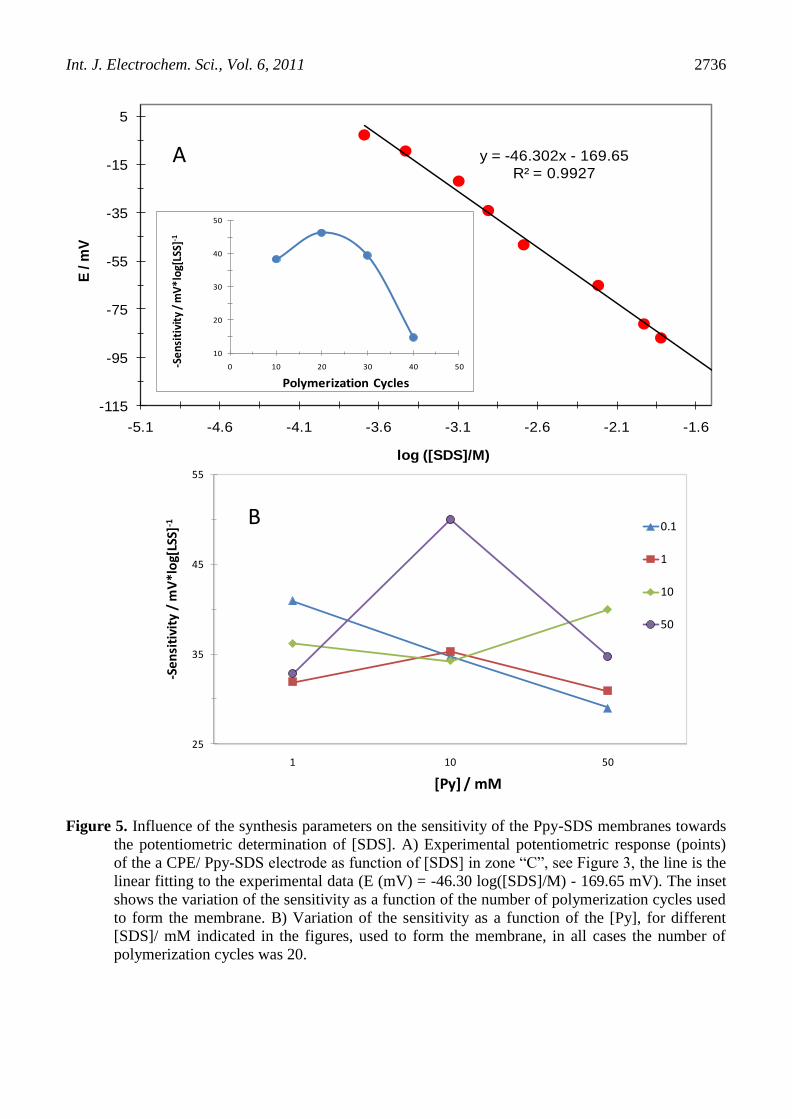
3.3.1. Influence of the synthesis parameters of the Ppy-SDS membrane on its sensitivity towards [SDS]
Figure 5 depicts how the synthesis parameters, namely: number of voltammetric cycles (see
inset in Figure 5A), [Py] and [SDS] (see Figure 5B) used during the Ppy-SDS membrane formation,
affect its sensitivity (value of the slope of E vs. log [SDS] plots) to [SDS], see Figure 5A.
From Figure 5 it is possible to state that the polymeric membrane with the highest sensitivity
(PMHS) was obtained when the following parameters were used: 20 polymerization cycles, [Py] = 10
mM and [SDS] = 50 mM, while the polymeric membrane with the lowest sensitivity (PMLS) was
obtained with the following parameters: 20 polymerization cycles, [Py] = 50 mM and [SDS] = 0.1
mM. Figure 6 shows the calibration plots for SDS quantification recorded with these two membranes.
Int. J. Electrochem. Sci., Vol. 6, 2011
2736
y = -46.302x - 169.65
R² = 0.9927
-115
-95
-75
-55
-35
-15
5
-5.1 -4.6 -4.1 -3.6 -3.1 -2.6 -2.1 -1.6
E / m
V
log ([SDS]/M)
10
20
30
40
50
0 10 20 30 40 50-Sen
siti
vity
/ m
V*l
og[L
SS]-1
Polymerization Cycles
25
35
45
55
1 10 50
-Se
nsi
tivi
ty /
mV
*lo
g[LS
S]-1
[Py] / mM
0.1
1
10
50
A
B
Figure 5. Influence of the synthesis parameters on the sensitivity of the Ppy-SDS membranes towards
the potentiometric determination of [SDS]. A) Experimental potentiometric response (points)
of the a CPE/ Ppy-SDS electrode as function of [SDS] in zone “C”, see Figure 3, the line is the
linear fitting to the experimental data (E (mV) = -46.30 log([SDS]/M) - 169.65 mV). The inset
shows the variation of the sensitivity as a function of the number of polymerization cycles used
to form the membrane. B) Variation of the sensitivity as a function of the [Py], for different
[SDS]/ mM indicated in the figures, used to form the membrane, in all cases the number of
polymerization cycles was 20.
Int. J. Electrochem. Sci., Vol. 6, 2011
2737
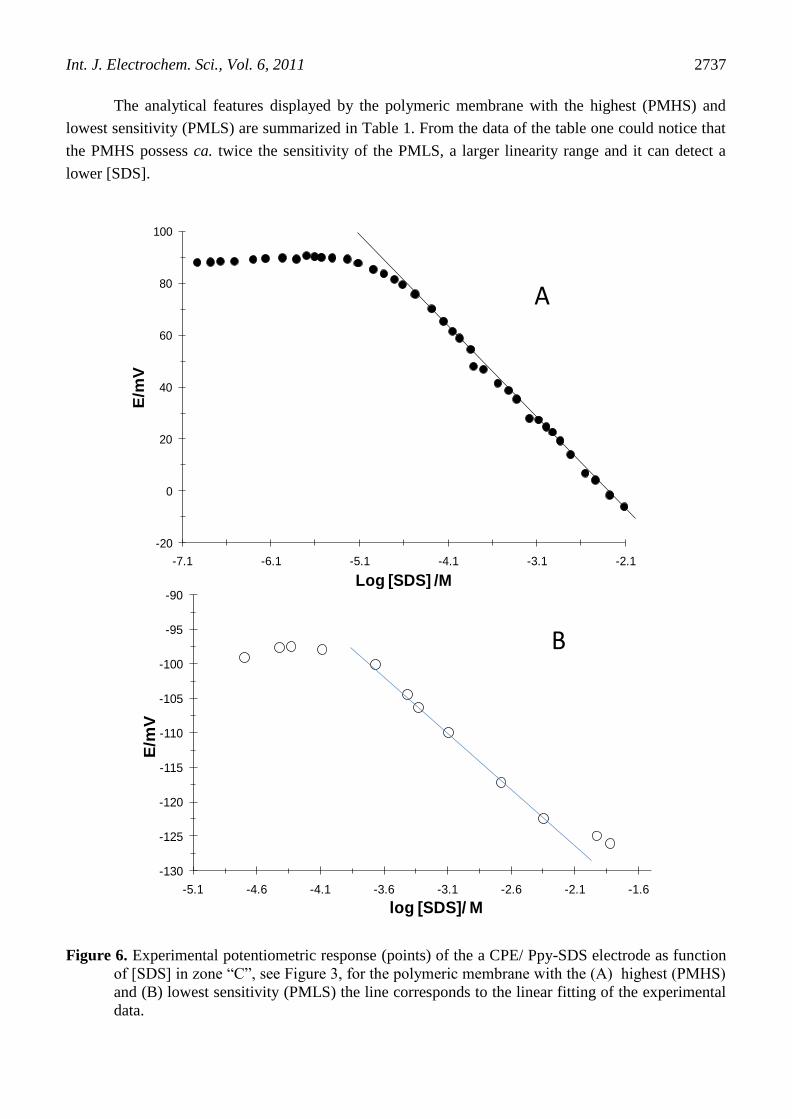
The analytical features displayed by the polymeric membrane with the highest (PMHS) and
lowest sensitivity (PMLS) are summarized in Table 1. From the data of the table one could notice that
the PMHS possess ca. twice the sensitivity of the PMLS, a larger linearity range and it can detect a
lower [SDS].
-20
0
20
40
60
80
100
-7.1 -6.1 -5.1 -4.1 -3.1 -2.1
E/m
V
Log [SDS] /M
-130
-125
-120
-115
-110
-105
-100
-95
-90
-5.1 -4.6 -4.1 -3.6 -3.1 -2.6 -2.1 -1.6
E/m
V
log [SDS]/ M
A
B
Figure 6. Experimental potentiometric response (points) of the a CPE/ Ppy-SDS electrode as function
of [SDS] in zone “C”, see Figure 3, for the polymeric membrane with the (A) highest (PMHS)
and (B) lowest sensitivity (PMLS) the line corresponds to the linear fitting of the experimental
data.
Int. J. Electrochem. Sci., Vol. 6, 2011
2738
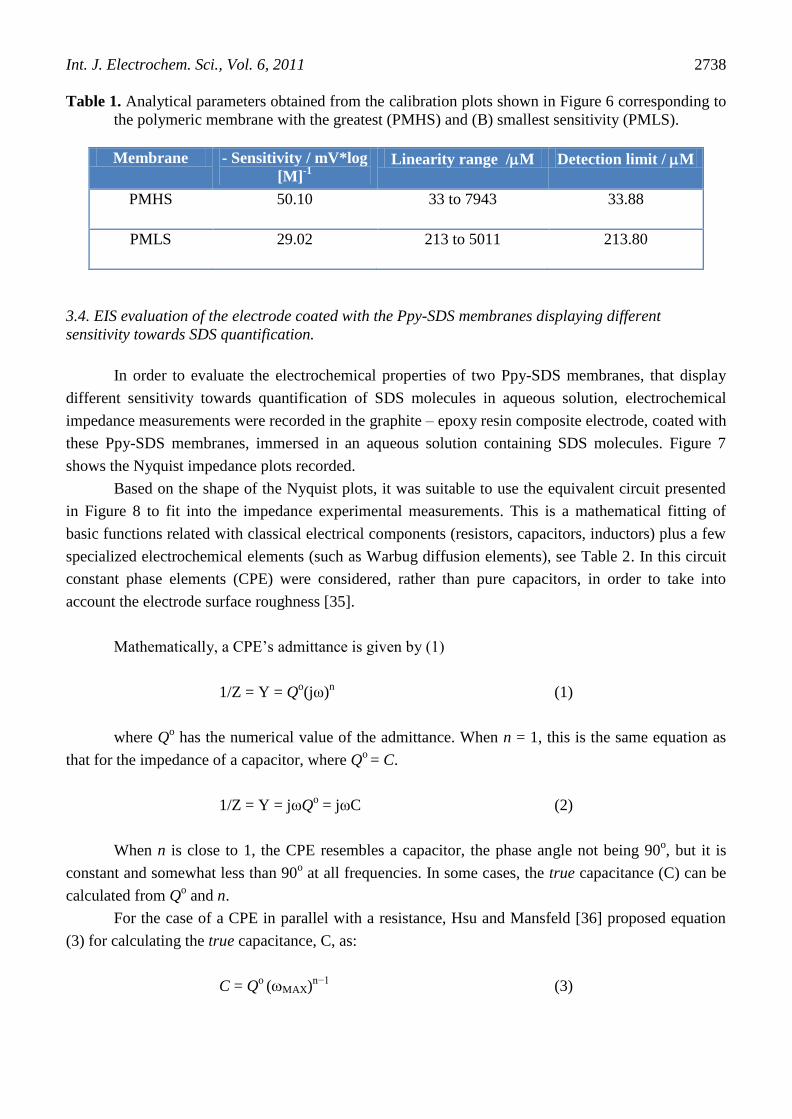
Table 1. Analytical parameters obtained from the calibration plots shown in Figure 6 corresponding to
the polymeric membrane with the greatest (PMHS) and (B) smallest sensitivity (PMLS).
Membrane - Sensitivity / mV*log
[M]-1
Linearity range /M Detection limit / M
PMHS 50.10 33 to 7943 33.88
PMLS 29.02 213 to 5011 213.80
3.4. EIS evaluation of the electrode coated with the Ppy-SDS membranes displaying different
sensitivity towards SDS quantification.
In order to evaluate the electrochemical properties of two Ppy-SDS membranes, that display
different sensitivity towards quantification of SDS molecules in aqueous solution, electrochemical
impedance measurements were recorded in the graphite – epoxy resin composite electrode, coated with
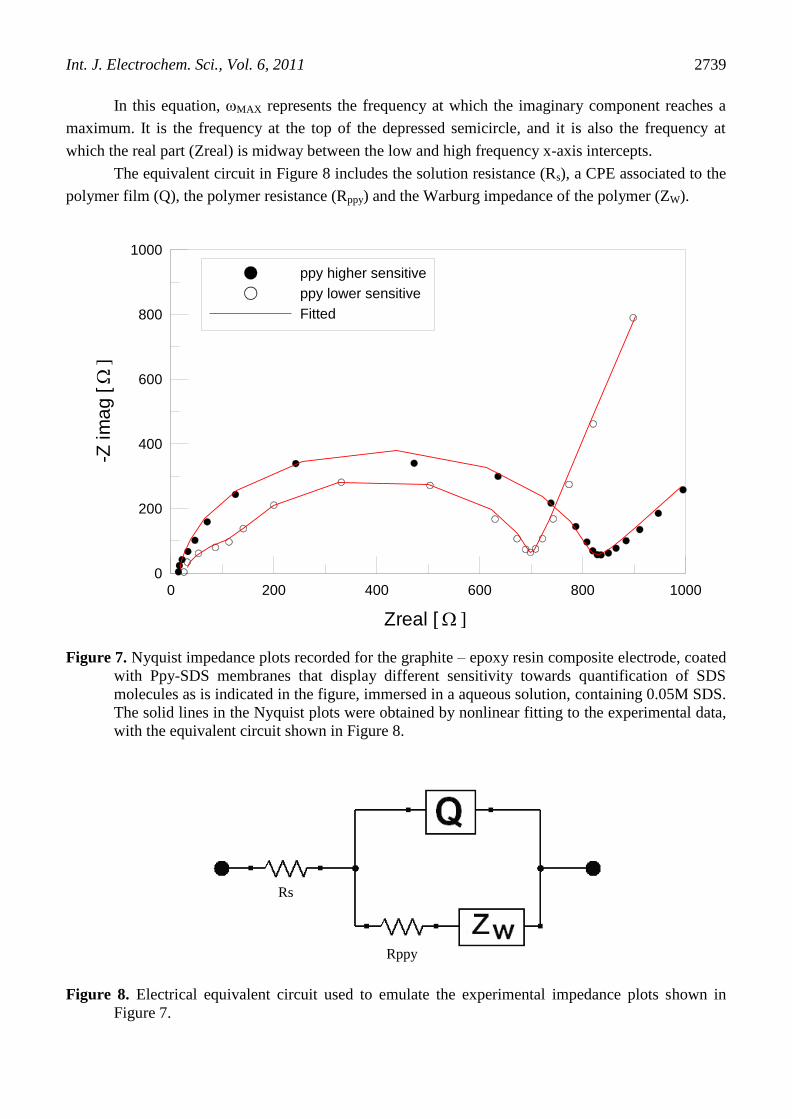
these Ppy-SDS membranes, immersed in an aqueous solution containing SDS molecules. Figure 7
shows the Nyquist impedance plots recorded.
Based on the shape of the Nyquist plots, it was suitable to use the equivalent circuit presented
in Figure 8 to fit into the impedance experimental measurements. This is a mathematical fitting of
basic functions related with classical electrical components (resistors, capacitors, inductors) plus a few
specialized electrochemical elements (such as Warbug diffusion elements), see Table 2. In this circuit
constant phase elements (CPE) were considered, rather than pure capacitors, in order to take into
account the electrode surface roughness [35].
Mathematically, a CPE’s admittance is given by (1)
1/Z = Y = Qo(jω)
n (1)
where Qo has the numerical value of the admittance. When n = 1, this is the same equation as
that for the impedance of a capacitor, where Qo = C.
1/Z = Y = jωQo = jωC (2)
When n is close to 1, the CPE resembles a capacitor, the phase angle not being 90o, but it is
constant and somewhat less than 90o at all frequencies. In some cases, the true capacitance (C) can be
calculated from Qo and n.
For the case of a CPE in parallel with a resistance, Hsu and Mansfeld [36] proposed equation
(3) for calculating the true capacitance, C, as:
C = Qo (MAX)
n−1 (3)
Int. J. Electrochem. Sci., Vol. 6, 2011
2739
In this equation, MAX represents the frequency at which the imaginary component reaches a
maximum. It is the frequency at the top of the depressed semicircle, and it is also the frequency at
which the real part (Zreal) is midway between the low and high frequency x-axis intercepts.
The equivalent circuit in Figure 8 includes the solution resistance (Rs), a CPE associated to the
polymer film (Q), the polymer resistance (Rppy) and the Warburg impedance of the polymer (ZW).
0 200 400 600 800 1000
Zreal [ ]
0
200
400
600
800
1000
-Z im
ag
[
]
ppy higher sensitive
ppy lower sensitive
Fitted
Figure 7. Nyquist impedance plots recorded for the graphite – epoxy resin composite electrode, coated
with Ppy-SDS membranes that display different sensitivity towards quantification of SDS
molecules as is indicated in the figure, immersed in a aqueous solution, containing 0.05M SDS.
The solid lines in the Nyquist plots were obtained by nonlinear fitting to the experimental data,
with the equivalent circuit shown in Figure 8.
Rs
Rppy
Figure 8. Electrical equivalent circuit used to emulate the experimental impedance plots shown in
Figure 7.
Int. J. Electrochem. Sci., Vol. 6, 2011
2740
Figure 7 compares the experimental impedance measurements with those obtained by nonlinear
fitting to the experimental data with the equivalent circuit shown in Figure 8. The best fitting
parameters obtained are shown in Table 2.
Table 2. Impedance parameters of the CPE / Ppy-SDS membranes that display different sensitivity
towards quantification of SDS molecules namely high (PMHS) and low (PMLS), immersed in
an aqueous solution containing SDS using the equivalent circuit shown in Figure 8.
Membrane [SDS]/
M
109Cppy/
F cm-2
Rppy/
cm2
n
104W/
S sec0.5
ZW/
cm2 s
-½
1011
D/
cm2 s
-1
PMHS 0.05 60.7 365 1 4.8 1034 5.30
PMLS 0.05 83.0 285 1 3.9 1267 3.53
*The capacitance of the polymeric films (Cppy) were obtained from the values of Q using equation (3).
From Table 2, it becomes clear that PMHS resistance (Rppy) value is greater than that of
PMLS, however its capacitance values (Cppy) are smaller. Since the geometries of the polymeric film,
namely the surface areas A, were the same in both cases and considering that the local dielectric
constant should be practically equal, hence, as can be noted from the well known Helmholtz model (4),
the thickness of the PMHS layer must be greater than that of the PMLS.
AC 0c (4)
where εc is the dielectric constant of the polymer, ε0 is the vacuum permittivity, A is the
electrode surface area and is the thickness of the layer.
Moreover, the diffusion coefficient for the ionic transport (DS-) in the polymeric matrix can be
obtained from the impedance measurements using the Warburg impedance coefficient Zw in equation
(5) [37].
2
22
C
wZAF
RTD
(5)
where D is the diffusion coefficient of DS-, cm
2 s
-1, A is the area of electrode, cm
2, Zw is the
Warburg impedance coefficient, cm2
s-½
; C is the concentration of SDS in mol cm3, R is the gas
constant, J K-1
mol-1
, T is the absolute temperature, K, and F is the Faraday constant, C mol-1
. The
results of the calculation were 5.30 x 10⁻¹¹
cm2s
-1 for PMHS and 3.53 x 10
-11 cm
2s
-1 for the PMLS. Is
important to emphasize that Valente et al. [38], using conductivity measurements reported similar
values (D = 12-16 x 10-11
cm2s
-1) for permeation of SDS through polyaniline-modified cellulose
acetate membranes.
Int. J. Electrochem. Sci., Vol. 6, 2011
2741
The previous observation regarding the values of the Rppy and Cppy of the Ppy-SDS
membranes and the diffusivity of DS- ions in these polymeric matrixes suggests that the time of
residence of the DS- ions in the PMHS would be larger than PMLS since PMHS exhibits a greater
resistance for DS- movement and a thicker layer, thus provoking its greater sensitivity towards the
potentiometric quantification of SDS.
3.5. Simultaneous quantification of surfactants
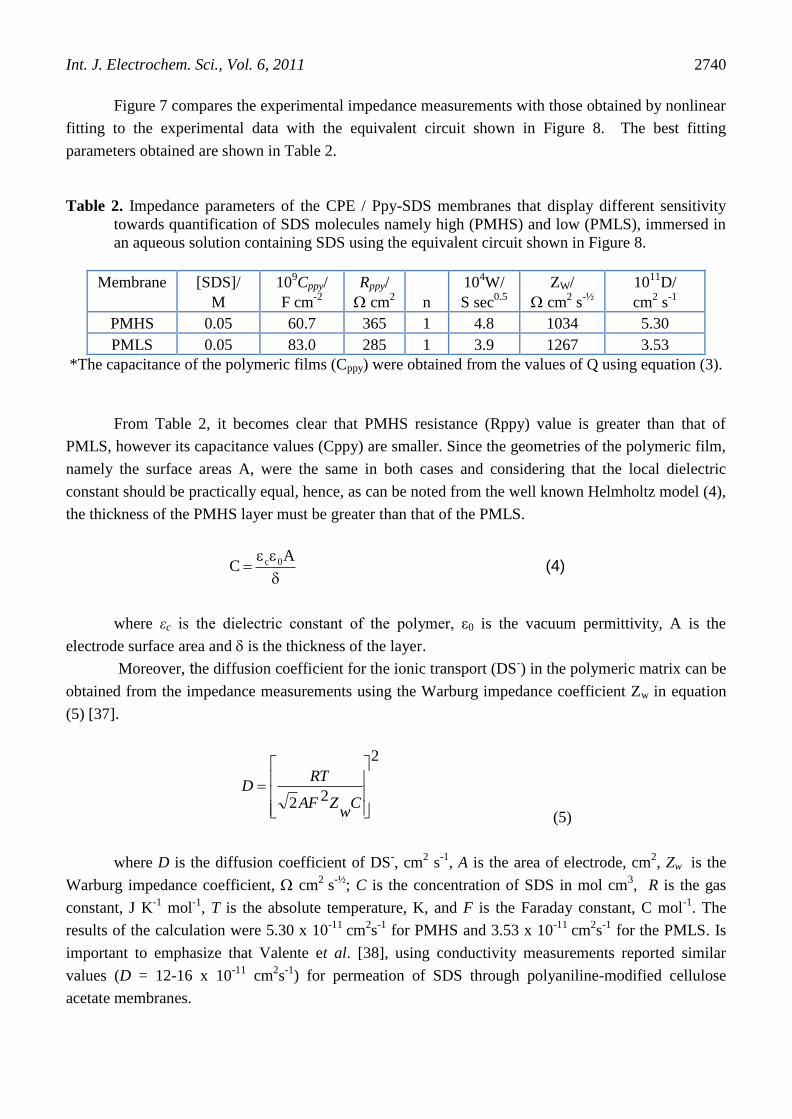
Figure 9 shows the experimental potentiometric response (points) of the CPE/PMHS electrode
immersed in two aqueous solutions: (light points) containing 10 mM of the surfactant Sodium
dodecylbenzene sulfonate, SDBS and different [SDS] and other (dark points) containing 10 mM SDS
and different [SDBS]. From Figure 9 it is possible to conclude that with this electrode both surfactants
can be measured depending on the [surfactant]; for log[surfactant]< -3 it is possible to quantify SDBS
and for log[surfactant] > -3 SDS without interference from each other.
-80
-70
-60
-50
-40
-30
-6 -5 -4 -3 -2
E /m
V
log ([surfactant] / M)
Figure 9. Experimental potentiometric response of the CPE/ Ppy-SDS electrode as a function of the
[surfactant] in aqueous solution (open circles) SDS and (solid circles) SDBS using the
polymeric membrane with the greatest (PMHS) sensitivity; the lines depict the linear fittings to
the experimental data.
3.6. SPR characterization
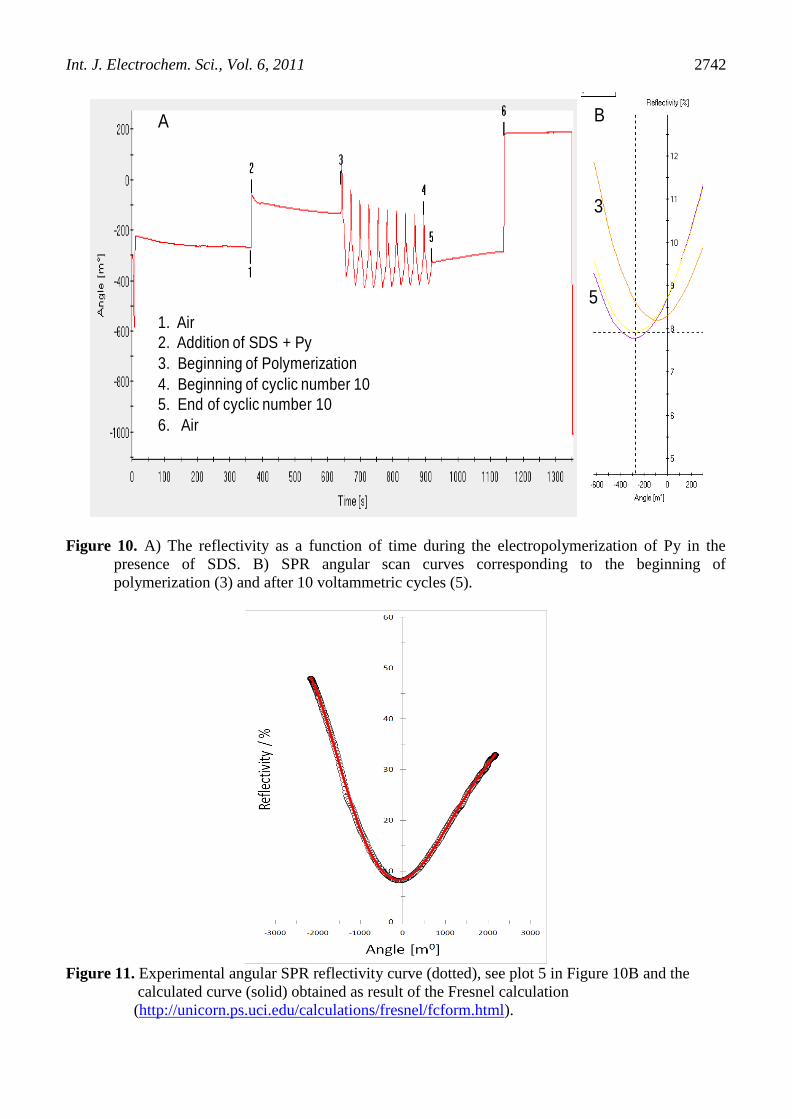
Figure 10A shows the change in SPR angle as recorded in the SPRINGLE software as a
function of time for the following interfaces: Au/air, Figure 10A(1), Au/10 mM Py, 50 mM SDS,
Figure 10A(2) and Au/Ppy-SDS, Figure 10(5); after 10 polymerization cycles, one could clearly note
Int. J. Electrochem. Sci., Vol. 6, 2011
2742
A B
1. Air
2. Addition of SDS + Py
3. Beginning of Polymerization
4. Beginning of cyclic number 10
5. End of cyclic number 10
6. Air
3
5
Figure 10. A) The reflectivity as a function of time during the electropolymerization of Py in the
presence of SDS. B) SPR angular scan curves corresponding to the beginning of
polymerization (3) and after 10 voltammetric cycles (5).
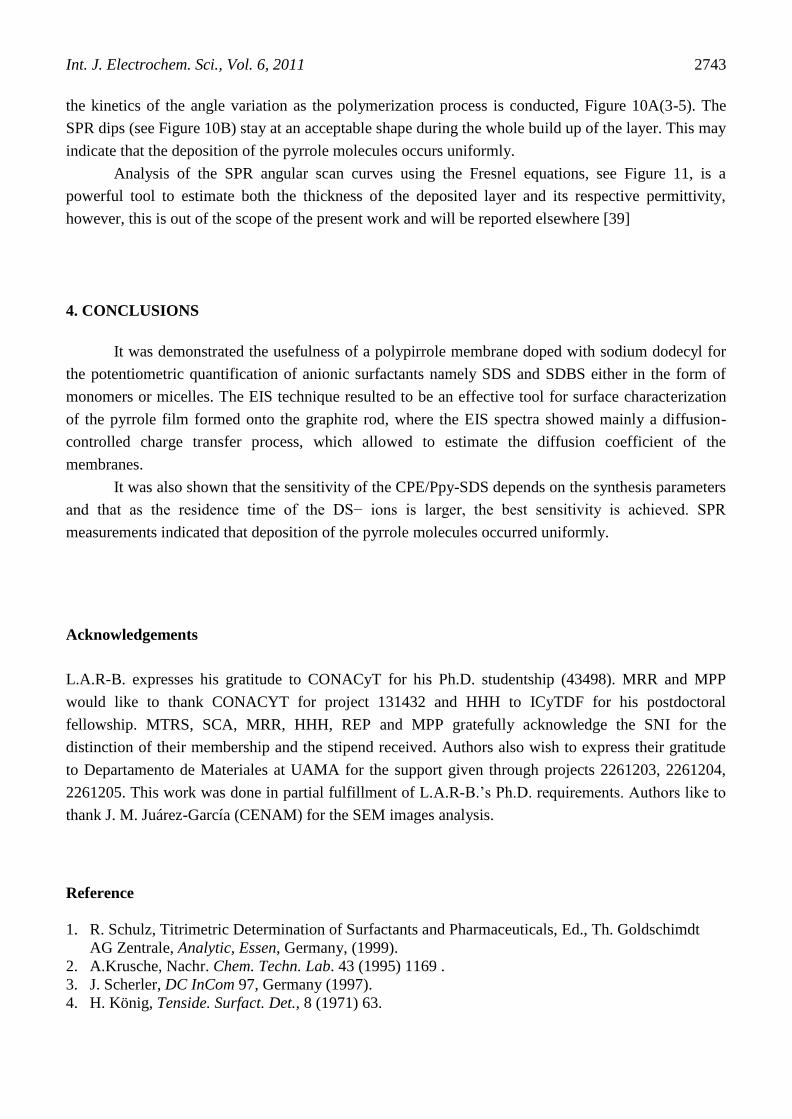
Figure 11. Experimental angular SPR reflectivity curve (dotted), see plot 5 in Figure 10B and the
calculated curve (solid) obtained as result of the Fresnel calculation
(http://unicorn.ps.uci.edu/calculations/fresnel/fcform.html).
Int. J. Electrochem. Sci., Vol. 6, 2011
2743
the kinetics of the angle variation as the polymerization process is conducted, Figure 10A(3-5). The
SPR dips (see Figure 10B) stay at an acceptable shape during the whole build up of the layer. This may
indicate that the deposition of the pyrrole molecules occurs uniformly.
Analysis of the SPR angular scan curves using the Fresnel equations, see Figure 11, is a
powerful tool to estimate both the thickness of the deposited layer and its respective permittivity,
however, this is out of the scope of the present work and will be reported elsewhere [39]
4. CONCLUSIONS
It was demonstrated the usefulness of a polypirrole membrane doped with sodium dodecyl for
the potentiometric quantification of anionic surfactants namely SDS and SDBS either in the form of
monomers or micelles. The EIS technique resulted to be an effective tool for surface characterization
of the pyrrole film formed onto the graphite rod, where the EIS spectra showed mainly a diffusion-
controlled charge transfer process, which allowed to estimate the diffusion coefficient of the
membranes.
It was also shown that the sensitivity of the CPE/Ppy-SDS depends on the synthesis parameters
and that as the residence time of the DS− ions is larger, the best sensitivity is achieved. SPR
measurements indicated that deposition of the pyrrole molecules occurred uniformly.
Acknowledgements
L.A.R-B. expresses his gratitude to CONACyT for his Ph.D. studentship (43498). MRR and MPP
would like to thank CONACYT for project 131432 and HHH to ICyTDF for his postdoctoral
fellowship. MTRS, SCA, MRR, HHH, REP and MPP gratefully acknowledge the SNI for the
distinction of their membership and the stipend received. Authors also wish to express their gratitude
to Departamento de Materiales at UAMA for the support given through projects 2261203, 2261204,
2261205. This work was done in partial fulfillment of L.A.R-B.’s Ph.D. requirements. Authors like to
thank J. M. Juárez-García (CENAM) for the SEM images analysis.
Reference
1. R. Schulz, Titrimetric Determination of Surfactants and Pharmaceuticals, Ed., Th. Goldschimdt
AG Zentrale, Analytic, Essen, Germany, (1999).
2. A.Krusche, Nachr. Chem. Techn. Lab. 43 (1995) 1169 .
3. J. Scherler, DC InCom 97, Germany (1997).
4. H. König, Tenside. Surfact. Det., 8 (1971) 63.
Int. J. Electrochem. Sci., Vol. 6, 2011
2744
5. P.A. Perov, V.L. Laptev, E.E. Zaev, L.A. Bez´yazychnaya, Zh. Anal. Khim, 42 (1987) 2088.
6. R. Gerhards, I. Jussofie, D. Käseborn, S. Keune, R. Schulz, Tenside. Surfact. Det., 33 (1996) 8.
7. J. Waters, P. Kupfer, Anal. Chim. Acta, 85 (1976) 241.
8. G.V. Scott, Anal. Chem., 40 (1968) 768.
9. I.Muray, I. Cowan, Making Light Work: Advances in Near Infrared Spectroscopy, Ed. VCH
Weinheim, Germany (1992).
10. P.I. Walling, J.N. Dabney, J. Soc. Cosm. Chem., 63 (1986) 155.
11. K.K. Stewart, A.G. Rosendfeld, Anal. Chem., 54 (1982) 2368.
12. A.F. Shoukry, S.S. Badawy, R.A. Farghali, Anal. Chem., 60 (1988) 2399.
13. M.M. Khalil, D.F. Anghel, C. Luca, Anal. Lett., 19 (1986) 807.
14. American Society for Testing and Materials, Standard Method for Synthetic Anionic Ingredient by
Cationic Titration, D 3049 – 89, 1916 Race St. Philadelphia PA 19103, USA.
15. H. Y. Lew, J. Am. Oil. Chem Soc., 49 (1972) 665.
16. M. Tusbouchi, J.H. Mallory, Analyst., 108 (1983) 636.
17. M. Tusbouchi, Y. Yamamoto, Anal. Chem., 55 (1983) 583.
18. M. S. Tehrani, M. T. Vardini, P.A. Azar, S.W. HusaiInt, Int. J. Electrochem. Sci., 5 (2010) 88.
19. M.R. Ganjali, A.A.S. Riahi, P. Norouzi, Int. J. Electrochem. Sci. 4 (2009) 1153.
20. M.R. Ganjali, Z. Memari, F. Faridbod, P. Norouzi, Int. J. Electrochem. Sci. 3 (2008) 1169.
21. S.S. Beheshti, M.K. Amini, Int. J. Electrochem. Sci., 2 (2007) 778.
22. P.D. Gaikwad, D.J. Shirale, P.A. Savale, K. Datta ,P. Ghosh, A.J. Pathan, G. Rabbani, M.D.
Shirsat, Int. J. Electrochem. Sci., 2 (2007) 488
23. D. Madunic-Cacic, M. Sak-Bosnar, R. Matešic-Puac, Int. J. Electrochem. Sci., 6 (2011) 240
24. G.A. Álvarez-Romero, E. Garfias-García, M.T. Ramírez-Silva, C. Galán-Vidal, M. Romero-Romo,
M. Palomar-Pardavé. Appl. Surf. Sci., 252 (2006) 5783.
25. G. A. Álvarez-Romero, A. Morales-Pérez, A. Rojas-Hernández, M. Palomar-Pardavé, M. T.
Ramírez-Silva, Electroanal., 16 (2004) 1236.
26. J.A Cobos-Murcia, L. Galicia, A. Rojas-Hernández, M.T. Ramírez-Silva, R. Álvarez-Bustamante,
M. Romero-Romo, G. Rosquete-Pina, M. Palomar-Pardavé, Polymer, 46 (2005) 9053.
27. E. Garfias-García, M. Romero-Romo, M.T. Ramírez-Silva, J. Morales, M. Palomar-Pardavé, J.
Electroanal Chem. 613 (2008) 67.
28. T. de J. Licona-Sánchez, G. A. Álvarez-Romero, L. H. Mendoza-Huizar, C. A. Galán-Vidal, M.
Palomar-Pardavé, M. Romero-Romo, H. Herrera-Hernández, J. Uruchurtu, J. M. Juárez-García, J.
Phys. Chem. B, 114 (2010) 9737.
29. E. Garfias-García, M. Romero-Romo, M. T. Ramírez-Silva, J. Morales, M. Palomar-Pardavé, Int.
J. Electrochem. Sci., 5 (2010) 763.
30. T. de J. Licona-Sánchez, G. A. Álvarez-Romero, M. Palomar-Pardavé, C. A. Galán-Vidal, M. E.
Páez-Hernández, M. T. Ramírez Silva, M. Romero-Romo, Int. J. Electrochem. Sci., 6 (2011) 1537.
31. G.A. Álvarez-Romero, M. Palomar-Pardavé, M.T. Ramírez-Silva, Anal. Bioanal. Chem., 387
(2007) 1533.
32. G. Valdés-Ramírez, M. T. Ramírez-Silva, M. Palomar-Pardavé, M. Romero-Romo, G. A. Álvarez-
Romero, P. R. Hernández-Rodríguez, J.L. Marty, J. M. Juárez-García, Int. J. Electrochem. Sci., 6
(2011) 971.
33. S. Corona-Avendaño, G. Alarcón-Angeles, M. T. Ramírez-Silva, G. Rosquete-Pina, M. Romero-
Romo, M. Palomar-Pardavé, J. Electroanal. Chem., 609 (2007) 17.
34. A.E. Sánchez-Rivera, V. Vitla-Vaquier, M. Romero-Romo, M. Palomar-Pardavé, M.T. Ramírez-
Silva, J. Electrochem. Soc.,151 (2004) C666.
35. R. Álvarez-Bustamante, G. Negrón-Silva, M. Abreu-Quijano, H. Herrera-Hernández, M. Romero-
Romo, A. Cuán, M. Palomar-Pardavé, Electrochim. Acta, 54 (2009) 5393.
36. C.S. Hsu, F. Mansfeld, Corrosion, 57 (2001) 747.
37. R. Vedalakshmi, V. Saraswathy, H.-W.Song, N. Palaniswamy, Corros. Sci., 51 (2009) 1299.

Int. J. Electrochem. Sci., Vol. 6, 2011
2745
38. A.J.M. Valente, H.D. Burrows, A.Ya. Polishchuk, C.P. Domingues, O.M.F. Borges, M.E.S.
Eusébio, T.M.R. Maria, V.M.M. Lobo, A.P. Monkman, Polymer, 46 (2005) 5918.
39. L. A. Rodríguez- Bravo, M. Palomar- Pardavé, M.T. Ramírez-Silva, S. Corona-Avendaño, M.
Romero-Romo, R. Escarela-Pérez (2011) to be submited.
© 2011 by ESG (www.electrochemsci.org)