Embed Size (px)
Citation preview
J
Electro-optic lightning detector
William J. Koshak
Global Hydrology & Climate Center
NASA Marshall Space Flight Center
Huntsville, Alabama
Richard J. Solakiewicz
Department of Mathematics & Computer Science
Chicago State University
Chicago, Illinois
https://ntrs.nasa.gov/search.jsp?R=19990036563 2018-05-09T05:09:59+00:00Z
Abstract
The design, alignment, calibration, and field deployment of a solid-state lightning detector is
described. The primary sensing component of the detector is a potassium dihydrogen phosphate
(KDP) electro-optic crystal that is attached in series to a fiat plate aluminum antenna; the
antenna is exposed to the ambient thundercloud electric field. A semiconductor laser diode (2 =
685 nm), polarizing optics, and the crystal are arranged in a Pockels cell configuration.
Lightning-caused electric field changes are related to small changes in the transmission of laser
light through the optical cell. Several hundred lightning electric field change excursions were
recorded during five thunderstorms that occurred in the summer of 1998 at the NASA Marshall
Space Flight Center (MSFC) in northern Alabama.
1. Introduction
The most common means for measuring lightning-caused changes in thunderstorm electric
fields involves the application of a flat metal plate antenna and a charge integrating apparatus.
Because the normal field E,, at the surface of an exposed antenna plate satisfies the normal
component boundary condition E,, = Q/(A_o), where Q is the induced charge, A is the plate
area, and Eo is the permittivity of flee space, a change in the thunderstorm field must be
accompanied by a change in induced charge. The integrating apparatus used to measure the
changes in induced charge normally consists of an electronic integrating circuit composed of an
electrometer and having in the feedback loop a resistor R and capacitor C in parallel. The
inverting input of the electrometer is attached to the plate and the noninverting input is grounded.
Typical RC decay times of the electrometer output are measured in seconds (slow antennas) and
from milliseconds to microseconds (fast antennas).
From the point of view of the experimenter, the RC decay time should be made larger than
any time variation of interest [1]. For instance, if one is interested in lightning return stroke
fields, the RC should be in milliseconds and if interested in total lightning field changes, the RC
should be in seconds. The decay assures that the sensor output is nullified before another event
occurs; triggering from the "zero line" is an advantage because one can devote the full vertical
amplitude resolution and dynamic range of the sensor to the event. The systems described by [2]
employed RC values of 4 s, 0.3 ms, and 70 /3s to look at various temporal regimes in the
lightning signature.
In the past 20 years, several new scientific and commercial applications of electro-optic
technologies have arisen for measuring electric voltages and fields ([3] - [10]), and some of these
investigations were specifically directed toward the study of thunderstorm electric fields.
Electro-optic crystals have offered a convenient and affordable means of controlling the
intensity or phase of optical radiation in an ever-expanding number of applications that include
high-speed digital communication, optical beam deflection, and spectral tunable filters [11].
Because the crystals respond quickly to applied voltages and no moving parts are required,
modulation frequencies of several gigahertz are possible. Liquid crystals have also been used in
high speed optical shutter applications, and [12] has used liquid crystals to measure lightning
electric field changes.
In the present study, we describe an electro-optic lightning field change detector that was
recently developed and deployed in the summer of 1998 at the NASA Marshall Space Flight
Center (MSFC) in Huntsville, Alabama. The sensor is an engineering model composed of both
fabricated and vendor-supplied components, and the optics were mounted on a small laboratory
optical breadboard. The RC decay was adjustable from 1 s to 1 ,us and was typically set to a few
tens of milliseconds during deployment in order to resolve individual strokes in a lightning flash.
The main sensing components are a flat aluminum plate and a long cylindrical, high impedance
electro-optic crystal of potassium dihydrogen phosphate (chemically written as KH2PO 4, or
"KDP" for brevity); some dielectric and optical properties of KDP are provided in [13]. The
details of the design, alignment, calibration, deployment, and data results are discussed below.
We begin our discussion with a review of the linear electro-optic effect since it is fundamental to
the design characteristics of the lightning detector.
2. The Linear Electro-Optic Effect
Friedrich Pockels (1865-1913) was the first to describe the linear electro-optic effect in two
early publications ([14], [15]). Figure 1 shows a typical Pockels cell arrangement for an electro-
optic modulator. The central component is an electro-optic crystal, KDP. Light from a diode
laser(inputbeam)passesthroughtwopolarizers,aquarterwaveretarder,andthecrystalbefore
exitingtheopticalsystem.Theoutputbeamwouldtypicallybemeasuredwitha photodetector
andtransimpedancecurrentamplifiersystem.
Equationsfor thetransmissionof light throughananisotropicmediumsuchasthe KDP
crystalmaybederivedfrom Maxwell'sequationsandenergyconservation.Conductivitycr is
negligible for the materials we are using at optic frequencies. The electric displacement D and
magnetic induction B are related through [ 16]
VxF=-3B/Ct, VxH=OD/Ot+J, V-D=p, V.B=0, (1)
where F and I-I are the electric and magnetic field intensities, respectively. [Note: we have
used "F" to denote the laser light electric field here rather than the customary notation "E" to
avoid confusion, i.e., "E" and its components denote the (enhanced) atmospheric field at the
sensor antenna plate as suggested in section 1 above and in the discussion that follows.] The
vector J is current density, p denotes charge density, and we have the relations I) = o_. F and
B = _IJ. The electric permittivity { is a tensor for anisotropic materials; it may be brought
into diagonal form by a suitable rotation of coordinates. We will approximate /_ by kt,,, the
magnetic permeability of a vacuum, for all materials in the optical circuit.
Energy conservation is described by
x.>=-,,i,v .[,,,where fi is the outward normal to a surface S which bounds a volume v. We will assume that
p and J are both zero. The equation for energy conservation can be used to show that the
perrnittivity tensor is symmetric.
Suitable manipulations of ( 1) for isotropic media yield a wave equation
+k')r=0
The same equation is satisfied by H. Plane wave solutions f)e ikr-j°_ are admitted, where 1_ is a
polarization, k = kl_, k = 2_r/2, and 1_ is the direction of propagation. Angular frequency is
denoted by co, t is time, r is a position vector, and 2 is the wavelength. With such assumed plane
wave forms for F and H in anisotropic media, we have the relations H = (k x F)/(co/t) and
I) = - (k x H)/co from which we may obtain (see [17])
(k. F)k - k2F = -co2_t_. F. (4)
We let k = con/c, where n is the wave index of refraction and c is the speed of light, and refer to
a coordinate system in which _ is diagonal. The form in (4) is that of an eigenvalue equation. In
general, there will be two nontrivial solutions.
The following coordinate system will be used. The Z-coordinate will be along the path of
the collimated laser beam with the direction from the laser to the photodetector considered as
positive. The zenith direction vertical to the optics breadboard, on which the components are
mounted, will define Y, and X is chosen to complete a right-handed system. Furthermore, we
define a system (x, y, z) that is identical to the (X, Y, Z) system but is attached to the crystal; the
(x, y, z) system defines the crystal principal axes when no voltage is placed across the crystal. In
the present discussion of perfectly aligned optics, there will be no distinction between the two
coordinate systems. Later however, in our discussion of misaligned optics provided in section 4,
the (x, y, z) system, or "crystal system", will be oriented differently than the fixed (X, Y, Z)
"breadboard system".
The indices of refraction and their associated allowable polarizations may be obtained
geometrically. By considering surfaces of constant energy density, an index ellipsoid
2 2
x /n x +y2/ny2 +zY_? =1
maybeconstructed[11]; n x, n_,, and n: are the refractive indices along the coordinate axes.
The allowable polarizations and indices of refraction may be obtained by finding the axes of the
ellipse formed by the intersection of the index ellipsoid and a plane normal to the direction of
propagation.
The index ellipsoid of the crystal may be modified by applying an electric field to the
crystal. The general formula is given by [1 1]
(nx -2 +rlkek)x 2 +(ny -2 +r2kek)y 2 +(nz -2 +r3kek)z 2 (6)+ 2rdkekyz + 2rskekxz + 2r6kekxy = 1,
where the summation convention has been employed. The ek are components of the applied
electric field, and the rik are the electro-optic coefficients of the crystal. It is intended that the
modulating field be along _; only r63 is needed since rj3 = 0, 1 _<j _<5 for KDP.
We assume that the crystal is aligned so that its axes of symmetry are parallel to the
coordinate axes. The KDP crystal is uniaxial which means that n x = n v = n o , where n o has a
numerical value of 1.507 and is called the ordinary index of refraction. The extraordinary index
of refraction is defined by n,, = n= = 1.467. Since n,, < n o the KDP is additionally specified as
being a negative uniaxial crystal.
When a field e_ is applied along the z-direction, the allowed polarizations are
(- i + _)/-q/2 and (i + _)/,_f2. Light polarized along )' upon entering the crystal is split into
these polarizations, the waves along which propagate at different speeds. For a crystal of length d
having a voltage V = e=d, the phase lag is
c[G _ n "_d = 2rc_) 3 -= (_0 ----_n ° r63V , (7)F
wheren.,. (slow) and n l (fast) are the indices of refraction along the allowed polarizations.
Waves traveling along the z-axis with no modulating voltage have a speed corresponding to the
ordinary index. Waves traveling in the xy plane with polarization in the z-direction have a speed
determined by the extraordinary index of the crystal. The crystal's utility lies in its ability to
introduce a variable phase retardation between the two waves in response to an applied voltage.
The linear relationship provided in (7) is the Pockels effect [ 18].
If the laser light field immediately following the first polarizer is F 0 coscot Y, then the field
of the output beam will be
F = F0[cos(cot - r) + cos cot]: /2. (8)
Here, the phase change due to the path length between optical components is suppressed.
Reflection losses at the interfaces are relatively small, and are customarily neglected. Exact
solutions that account for such losses are available ([19], [20]).
Using (8) to obtain the square magnitude F 2, the power is obtained by taking the time
average of F 2 [21]. Dividing by the input power, which is proportional to F02/2, yields the
optical transmission T given by
= sin 2 F/2 = sin2[(TcV)/(2V_)],T (9)
where V,_ = 2/(2n3r63)is called the half-wave voltage, i.e., V= V_ yields a retardation of rc
which is one half of 2_r, or "one half wave".
Note that the derivative, T'(V) - dT/dV, or electro-optic sensitivity, is zero when there is
no voltage across the crystal, i.e., T'(0)= 0. In order to have the largest possible change in
transmission with applied voltage for small voltages, it is convenient to start at a point where
T'(0) is as large as possible. This may be achieved by introducing an additional phase
retardationof re/2 by inserting a quarter wave plate before the second polarizer. In such a case,
the transmission of the system is given by
T=sin2[F/2+Tc/4]. (10)
This process is the optical analog of biasing an electronic component.
The preceding discussion has summarized the basics of the linear electro-optic effect in
anisotropic media. Some early experimental investigations of this effect are provided in [22].
Note from (9) and (10) that a high frequency modulation voltage can be applied to the crystal to
vary the optical transmission and hence the optical amplitude of the output beam. In this sense
the Pockels cell configuration can serve as a high speed optical shutter.
However, the Pockels cell can also be used in the reverse sense, that is, a high gain
measurement of small changes in the optical amplitude of the output beam can be used to infer
the changes in crystal voltage. This is the operational principle of the electro-optic lightning
detector developed in this work. The lightning places a transient voltage across the electro-optic
crystal thereby changing the optical transmission of laser light through the cell. Specific details
of the sensor follow.
3. Sensor Description
Figure 2 provides a simplistic overview of the electro-optic lightning detector developed at
NASA MSFC. The detector is placed outside on a flat surface sufficiently far from tall grass or
pointed objects that could produce local field-limiting corona discharges. Note that a
thunderstorm separates positive and negative charges and thereby generates strong electric fields
in the atmosphere and on the ground. When a cloud-to-ground flash occurs, as shown in Figure
2, tens of coulombs of negative charge from the lower regions of the thundercloud (i.e., -7 km
altitude) are deposited to Earth. The large charge transfer is accompanied by a substantial change
in theelectricfield AEgat theground,i.e.,a AEg > 5 kV/m is notuncommonfor discharges
thatarewithinarangeof afewkilometers.Thoselightningeventsthatdonottransferchargeto
groundbut transportchargewhollywithin theatmosphere,calledcloud flashes, also produce
substantial values of AEx. In general, the field change at the height of the antenna plate differs
from that at the ground, and the presence of the sensor itself enhances the local field change.
Figure 2 indicates the net field change at the antenna plate as AE, and this is the stimulus that
produces a change in crystal voltage given by AV = Ae:d.
When the sensor detects the lightning-caused field change AE, the photocurrent output
from the optical system is converted to an analog voltage using a Stanford Research Systems,
Inc. current preamplifier (model SR570), and the analog voltage is passed to a Pentium computer
where the signal is digitized at 125 Hz using a Data Translation A/D board (model DT2833).
A closer look at the sensor's optical system is provided in Figure 3(a); it is based on the
linear Pockels cell configuration discussed in section 2. The totality of optics are mounted on an
optical breadboard that is 30.48 cm by 60.96 cm in dimension. The intent was to build a
reasonably small engineering model that still provided "on-line" adjustability and
interchangeability of optical components. Future designs of the sensor would be scaled down
considerably (i.e., the laser and all optical elements could be precision mounted within a single
sealed tube only a few centimeters long and wide).
Working from left to right in Figure 3(a), the first element is a 30 mW semiconductor laser
diode that has a wavelength of 685 nm and an elliptic beam cross section (major and minor axes
of 4 mm and 1 mm, respectively). We have also used a 4 mW, 670 nm laser diode, but at the
expense of reduced sensor sensitivity. The beam height above the optical breadboard is 75 mm
and the beam divergence is negligible across the length of the breadboard. The only
considerations during operation are to allow the laser a few minutes of"on time" prior to taking
10
datato assurepowerstability,preventreflectionsbackinto the laseraperture,andprevent
excessivetemperaturechangesin theair surroundingthelaser.
The next(optional)optic is a beamsplitterthat sendsa portionof the laserlight to a
photodetector(shownin thebackground).Thesetwocomponentsallowoneto monitorthe laser
stability,butbecauseourMellesGriot,Inc. lasershadminimal(< 1%)powerfluctuation,the
monitoringsystemwasnotastrictrequirement.
The next elementis a post-mounted,verticallyorientedMelles Griot dichroic sheet
polarizerfollowedby theKDPcrystal.Thepolarizerhasa clearaperatureof 26.5mm anda
thicknessof 2.5mm.ThehygroscopicandwatersolubleKDPcrystalis housedinadrynitrogen-
flushedair- tight Plexiglasscontainerthat is mountedon a two-axisholder;the holderhas
alignmentmicrometeradjustmentsin both yaw and pitch. A durablestrap fastensthe
crystal/containertotheholderandtheholderisboltedto theopticalbreadboard.Thecrystalhas
acylindricalgeometry(40mmlength,20mmdiameter)with ringelectrodeswrappedaroundthe
outercrystaldiameterat eachend.Thering electrodesallowfor a largercrystalaperturethan
commonlyusedwasher-typeelectrodesthatareplaceddirectlyonthecrystalentrance/exitfaces.
Additional details and considerationsof ring electrodesare provided in [23]. Direct
measurementsof crystalimpedanceandcapacitancegivethevaluesR = 194 Gf2 and C = 5.51
pF, respectively, or a crystal RC decay time of ~1 s. (In addition, we have also experimented
with a post-mounted 3 mm thick, 25.4 mm aperture crystal of potassium didueterium phosphate
(KD*P) similar to the crystal used in [24] and [25]. This crystal had transparent indium tin oxide
(ITO) electrodes, and, because of its thin width it had a shorter RC decay time constant than the
long cylindrical crystal of KDP.)
The next two optical elements include a quarter wave plate and a horizontal polarizer.
Except for its orientation, the polarizer is identical to that described above. The quarter wave
plate is composed of quartz and has a diameter of 20 mm. As discussed in section 2, the quarter
I1
waveplatechangesthetransmissionprofile T(V) from that given in (9) to that given in (10)
when the optics are perfectly aligned and reflections are negligible. In effect, the quarter wave
plate improves the electro-optic sensitivity T'(V) at a crystal voltage V = 0. This is important
since, before a lightning event, the voltage on the crystal is very nearly zero (very small and
random stray voltages undoubtably exist across the crystal at all times). A subsequent change in
crystal voltage AV due to the lightning produces a change in optical transmission given by
AT _ T'(0)AV for AV small. Hence, in order to get large (measurable) changes in transmission,
it is desirable to have T'(0) large. As will be detailed in section 4, we have found that small
misalignments in the optics produce sufficiently large values of T'(0) when the quarter wave
plate is not inserted.
The final component shown in Figure 3a is the photodetector. It has an active detector area
of 100 mm 2 and was connected directly to the input of the SR570 current preamplifier with a
short (30.5 cm) 50 f_ plenum coaxial cable. The amplifier (not shown) has a low end sensitivity
of 1 volt output per 1 pA current input (written as 1 pA/volt). It also has valuable input offset
adjust buttons that allowed us to accurately null the transmitted laser light (at V = 0) so we could
increase amplifier gain without over ranging. We typically collected lightning data at either the 1
/_A/volt or 50 nA/volt gain setting, depending on storm range. The amplifier also offered
considerable band pass filtering capabilities. Lightning data were collected using the 10 - 30 Hz
band-pass filter, primarily to avoid dc drift and 60-cycle noise sources. Application of the band-
pass filter contributed to shortening the overall, or "effective RC " decay time constant of the
sensor to a value of tens of milliseconds. The specific value of the effective RC decay depended
on the particular amplifier gain setting that was chosen (see section 5 below for additional
comments on sensor RC decay and specific examples).
12
Figure3(b) showsthe protectivehousingthatthe opticalsystemis placedwithin. The
housingisconstructedof a50.8mmthickpolypropylenematerialthataffordsverygoodthermal
insulationfrom excessiveheatingdueto typicalsummerconditionsin Alabama.Ampleroom
insidetheboxallowedfor theinsertionof coolingpacksasanaddedmeasureto preventexcess
heatingto the laserandcrystal;detailsof KDPrefractiveindexchangeswith temperatureare
providedin [26].Methodsmoresophisticatedthanapplyingcoolingpacksarethe so-called
"quenchingconditions"discussedin [27] that removeunwantedbirefringencesin crystals
affectedby generalchangesinenvironmentalconditions.Fortunately,undergoodthunderstorm
conditionsthe weatherwascloudyand not excessivelyhot, particularlyduringperiodsof
precipitation.In thesesituations,we sawno discernabledifferencein sensoroutputwith or
withoutcoolingpacks.
Thepolypropylenematerialhadsufficientweightandshockabsorptionto minimizethe
effectsof vibrationsdueto wind/precipitation/thunderthatmightdisturbtheopticalalignment.
Greatcarewasspentassuringthattheboxwaswatertight;theboxtop lid overhangsthesides
andawatertightO-ringlinestheareawherethelid rests.Theoutsideof theboxwascoatedwith
a durablewater-repellentpaintandthe colorwaswhiteto reflectsunlight(againpreventing
excessiveheatinginsidethebox).Theinsideof theboxwascoatedwith a flat blackpaintto
minimizescatteringof laserlightthatmightbereflectedfromopticalelements.
Ontheoutsidetop portionof thebox lid is mounteda teflonrod thatsupportsa circular
aluminumantennaplate.A smallboreholewasdrilledthroughtheteflonrodsothata teflon-
coatedwire couldinconspicuouslyconnecttheantennaplateto the left ring electrodeof the
crystal.Theothercrystalring electrodewasgroundedto the opticalbreadboard,as wasthe
currentpreamplifier.Theopticalbreadboardandaluminumgroundplane(mountedontopof the
boxlid) werebothconnectedto astandard8 ft coppergroundrodthatwasdrivenintotheEarth
a fewinchesfromthehousing.A smallteflon"raincap"wasplacedovertheteflonsupportrod
13
beforeboltingtheantennaplatedown;thispreventsstreamsof waterfromshortingtheantenna
to groundpotential.
In summary,thelightning-causedAEexcitesthesensorantennaandraisesit to atransient
voltage,AV,measuredbetweentheantennaplate(theleft-sidecrystalelectrode)andground(the
right-sidecrystalelectrode);herewehaveneglectedthesmallcapacitancebetweentheantenna
plateandthe left crystal electrode. The voltage AV across the crystal changes the crystal's
refractive index and polarization characteristics, and hence the transmission of the optical system
changes by an amount AT. With laser power P,,, the change in transmitted power is simply
AP = ATP,, which is measured using a high gain photodetector/preamplifier system. Therefore,
one formally has the chain AE _ AV --_ AT _ AP so that values of AP can be directly related
to the values of AE through calibration (see section 5 below).
4. Alignment
The expressions for the optical transmission, T, given in (9) and (10) assume that the optical
elements are perfectly aligned. Since in this study the Pockels cell is used as a detector to sense
the slightest antenna voltages, we have found that even small misalignments of the crystal and/or
quarter wave are important effects.
The theory of transmission through birefringent media is well developed and the
transmission through a crystal at an oblique angle can be derived by exact or approximate means
([19], [20], [28], [29]). When a collimated beam of light enters a birefringent medium at an
oblique angle, the transmitted field consists of two beams that propagate in two distinct
directions. The direction of a refracted beam depends on its angle of incidence and the refractive
index, and the refractive index in turn depends on the angle of incidence. An exact solution to
this problem is complicated, but a great simplification can be made by noting that there is very
14
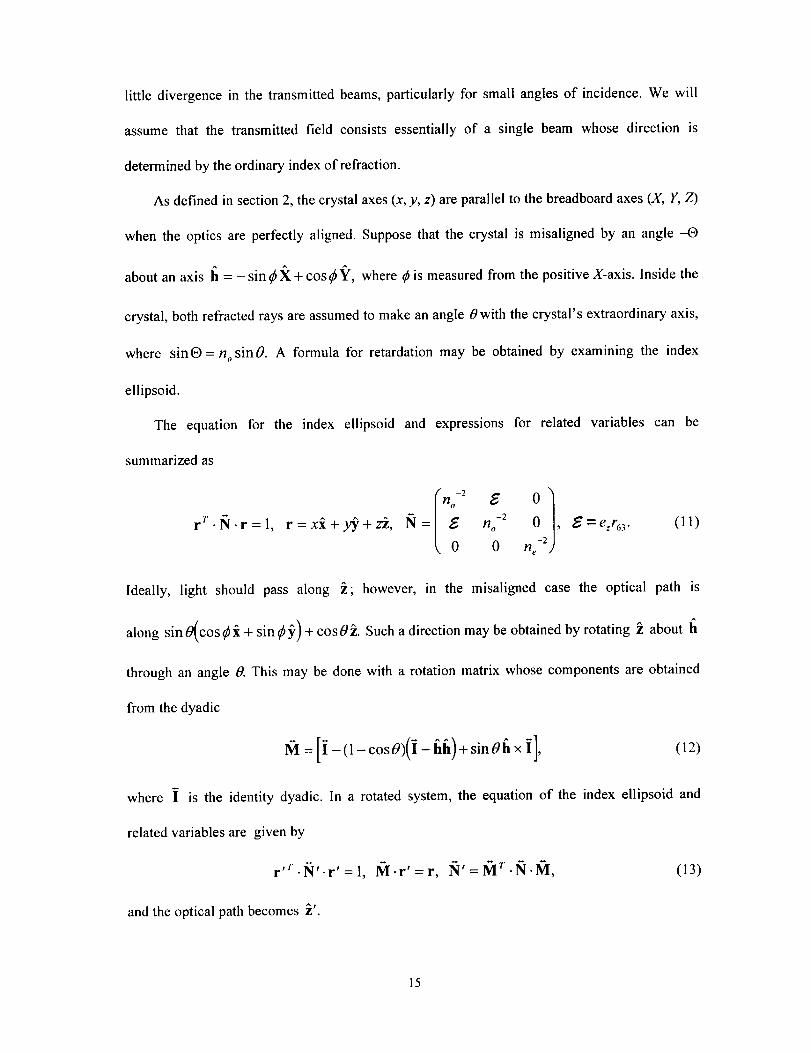
little divergencein the transmitted beams, particularly for small angles of incidence. We will
assume that the transmitted field consists essentially of a single beam whose direction is
determined by the ordinary index of refraction.
As defined in section 2, the crystal axes (x, y, z) are parallel to the breadboard axes (X, Y, Z)
when the optics are perfectly aligned. Suppose that the crystal is misaligned by an angle -O
about an axis 1] = -sin _bX + cos _bY, where _bis measured from the positive X-axis. Inside the
crystal, both refracted rays are assumed to make an angle 0 with the crystal's extraordinary axis,
where sin® = no sinO. A formula for retardation may be obtained by examining the index
for the index
ellipsoid.
The equation
summarized as
ellipsoid and expressions for related variables can be
f2 /n ,, _ 0
rT .l_l.r = 1, r = xi+ y_ +z_, 1_ = ( _0 /70 -2 02,_=ezr63. (11)0 n e- ;
Ideally, light should pass along _; however, in the misaligned case the optical path is
along sinO(cos_b_ + sin_b_,) + cos0$. Such a direction may be obtained by rotating $ about (1
through an angle O. This may be done with a rotation matrix whose components are obtained
from the dyadic
1VI= [I-(1- cos0)(l - hh) + sin Ola x I], (12)
where I is the identity dyadic. In a rotated system, the equation of the index ellipsoid and
related variables are given by
r'r.l_l'-r':l, l_I.r':r, i_l':l_lr.i_l.lVI, (13)
and the optical path becomes _'.
15
by:
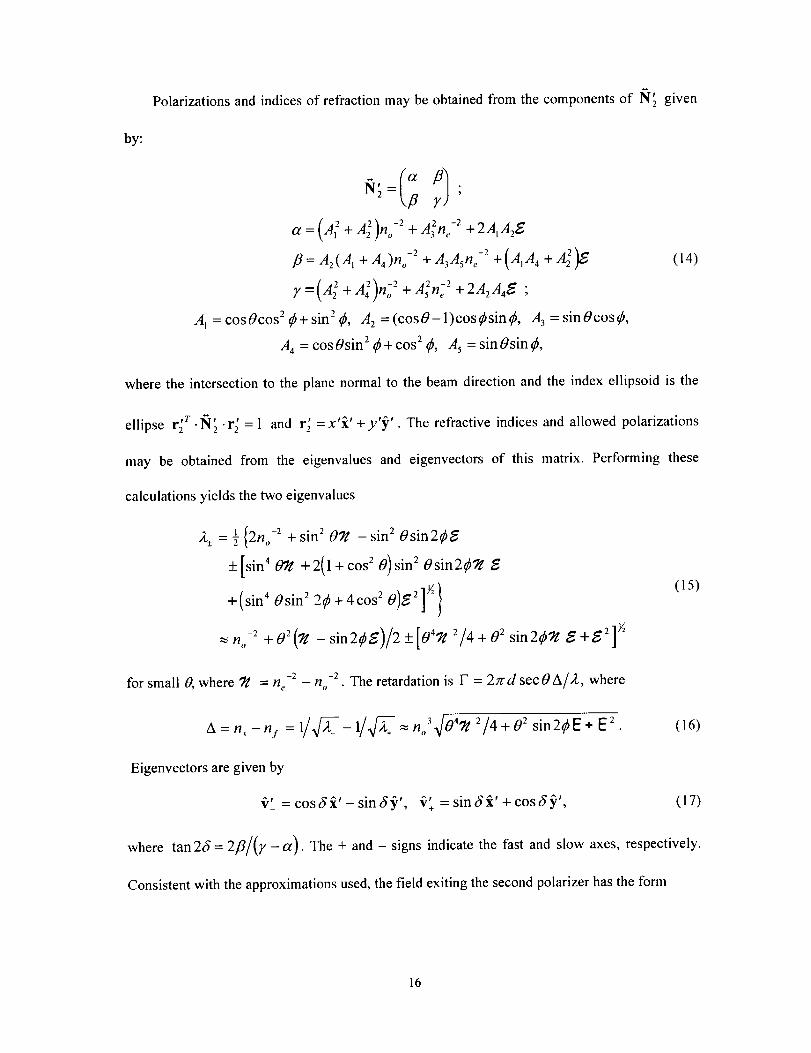
Polarizationsandindicesof refractionmaybeobtainedfromthecomponentsof I7,/'2given
Y
ct=(A 2+A2_ -2 _2 n-22)n,, +--3 e +2AtA2_
fl= A2(A 1 + A,)n,, -2 + A3Asne -2 +(A1A , + A_),_ (14)
y= A_ + A 4 n o +..s _ + 2A2AaE ;
A I = cosOeos 2 _b+sin 2 _b, A 2 = (cosO-1)cos_bsin_b, A 3 = sinOcos_b,
A 4 = cosOsin 2 _b+ cos 2 _b, A 5 = sinOsin_b,
where the intersection to the plane normal to the beam direction and the index ellipsoid is the
ellipse r_ r "/q'z .r_ = 1 and r_ = x'i' +y'_,'. The refractive indices and allowed polarizations
may be obtained from the eigenvalues and eigenvectors of this matrix. Performing these
calculations yields the two eigenvalues
2± = ½ {2n,, -2 + sin z 07/ -sin 20sinZ_b_
+[sin' 07/ + 2(1 + cos 20)sin 20sin2_,bT/E
+ (sin4 Osin2 2_b + 4c0s2 0)_2 ]_ } (15)
._ n,, -2 +82(7/ -sin2_b_)/2 + [0'7/ 2/4 + 82 sinZ_bT/e "a¢-e2]_
for small 0, where 7/ = n¢ -2 - n,-2 . The retardation is F = 2_r d sec 0 A/d., where
A = n.,-nj =l/.f2-_-l/._f-Z+_n,,340'7/2/4+O 2 sin2_bE+ E 2 (16)
Eigenvectors are given by
¢,'_ = cos6i' - sinb'_', v+̂' = sindi' +cos6_,', (17)
where tan2b'= 2fl/(T-a ). The + and - signs indicate the fast and slow axes, respectively.
Consistent with the approximations used, the field exiting the second polarizer has the form
16
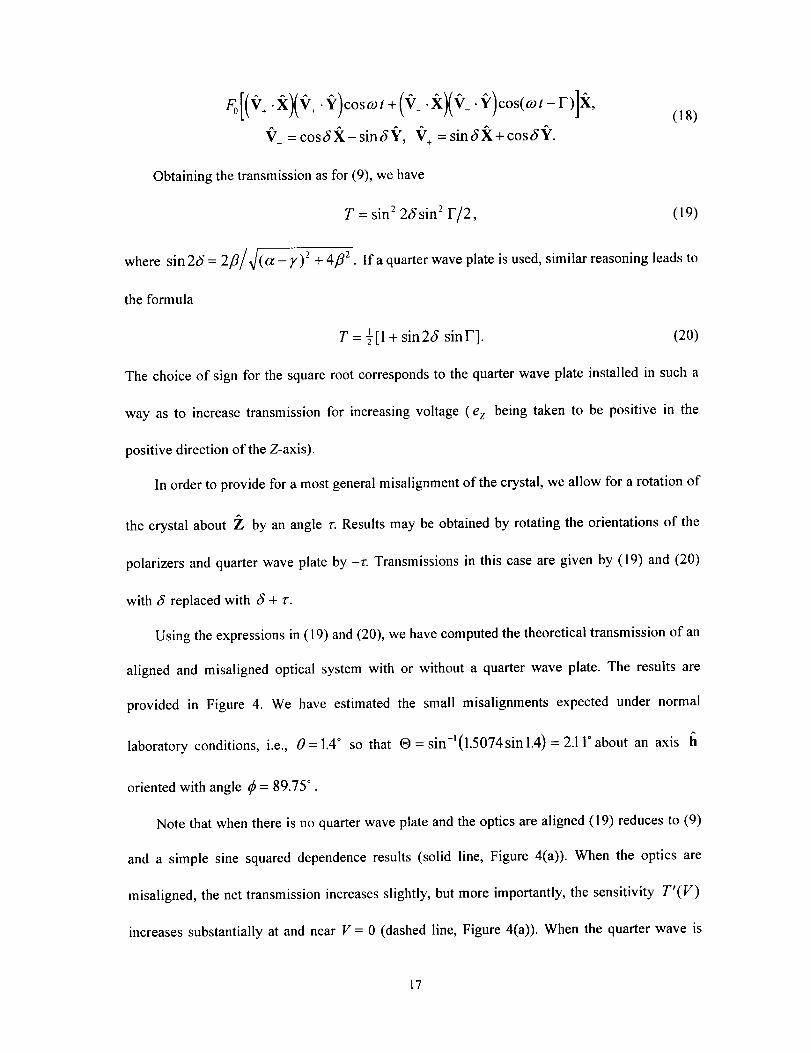
9_ = cosdX-sind_', V÷ = sinSX+cosdY.
(18)
Obtaining the transmission as for (9), we have
T = sin 2 26sin 2 F/2, (19)
where sin 26 = 2fl/X/(a - y)2 + 4fl2. If a quarter wave plate is used, similar reasoning leads to
the formula
T = ½[1 + sin26 sinU]. (20)
The choice of sign for the square root corresponds to the quarter wave plate installed in such a
way as to increase transmission for increasing voltage (e z being taken to be positive in the
positive direction of the Z-axis).
In order to provide for a most general misalignment of the crystal, we allow for a rotation of
the crystal about Z by an angle r. Results may be obtained by rotating the orientations of the
polarizers and quarter wave plate by -v. Transmissions in this case are given by (19) and (20)
with 6 replaced with 6 + r.
Using the expressions in (19) and (20), we have computed the theoretical transmission of an
aligned and misaligned optical system with or without a quarter wave plate. The results are
provided in Figure 4. We have estimated the small misalignments expected under normal
laboratory conditions, i.e., 0 = 1.4° so that (9 = sin-_(1.5074sinl.4) = 2.11 ° about an axis la
oriented with angle _b= 89.75 ° .
Note that when there is no quarter wave plate and the optics are aligned (19) reduces to (9)
and a simple sine squared dependence results (solid line, Figure 4(a)). When the optics are
misaligned, the net transmission increases slightly, but more importantly, the sensitivity T'(V)
increases substantially at and near V = 0 (dashed line, Figure 4(a)). When the quarter wave is
17
inserted, the transmission increases for both aligned (dotted line, Figure 4(b)) and misaligned
(dot-dashed line, Figure 4(b)), but the misalignment no longer improves sensor sensitivity at and
near V = 0, or at any larger values of V.
To further clarify the variation of sensor sensitivity for small changes in crystal voltage, we
have numerically computed the change in transmission AT = T(V)-T(O) for a small crystal
voltage change AV = V - 0 = V all as a function of V. The functional dependence AT = f(V)
is provided in Figure 5 for aligned and misaligned optics with or without a quarter wave plate.
We see that the addition of the quarter wave plate necessarily improves sensor sensitivity no
matter if the system is aligned or misaligned. However, because the quarter wave plate produces
additional reflective losses to the optical system, because its inclusion produces additional noise
sources during high-gain operation of the lightning detector, and because the slope of the lines in
Figure 5(b) have magnitudes that are not vastly different, we did not include the use of the
quarter wave plate during normal calibration and operation of the lightning sensor.
5. Calibration
The calibration of the lightning detector was straightforward. On the top lid of the optical
housing shown in Figure 3a, four threaded holes were drilled (one at each corner of the square
lid). A nylon rod was screwed into each hole in order to support a large circular aluminum
calibration plate. An Avtech high voltage wave function generator (HVWFG) was connected
between the calibration plate and the lid-mounted ground plane. This provided a uniform vertical
electric field change for the lightning detector antenna plate located between the calibration plate
and ground plane. We also used a standard (i.e., lower voltage) BK-Precision WFG to check
low-end sensor detectability.
18
The risetimeof a lightningreturnstrokefield changeis typically60 ys. The Avtech
HVWFGcouldsupplysquarewaveshavingamplitudesof +500 volts with frequencies ranging
from near dc to 3 kHz and with a peak-to-peak risetime < 35/_s. The BK Precision WFG could
supply square waves having amplitudes of +12 volts with frequencies ranging from near dc to
several megahertz, and a risetime of about 2 ms when operated at 0.5 Hz. In order to get an
accurate calibration, it is important to have waveforms that rise to peak in milliseconds or less
because of the characteristic RC decay of the crystal. In effect, the vertical displacement current
density _',, dE/dr produced by the calibration apparatus or a lightning event must be large
enough to place a significant amount of charge onto the left crystal electrode before leakage
currents in the crystal drain the crystal voltage to ground. The electric field line distribution
inside an electro-optic parallelepiped crystal is provided in [30] and evidence for field-driven
leakage currents in electro-optic materials is given in [3] and [24].
Because we have picked a crystal that has an RC decay of ~1 s, the leakage current to
ground is slow. This allows the crystal to acquire a larger voltage, and hold a voltage for a longer
period of time. Furthermore, since electro-optic crystals can be modulated into the gigahertz
region, they respond quickly to changes in voltage. Hence, the crystal responds quickly to
lightning transients, acquires a sufficient voltage, and holds the voltage for a time that is long in
comparison to the (tens of milliseconds) decay time of the photodetector/amplifier system. The
amplifier effectively samples the crystal voltage substantially faster than the crystal voltage has a
chance to decay, thereby optimizing overall sensor sensitivity.
If it were not for our desire to remove 60-cycle noise sources, we could replace the applied
band-pass filter with a high-pass filter (> 10 Hz) to improve overall sensor bandwidth. A narrow
filter for removing 60-cycle noise in conjunction with the high-pass filter would clearly be
optimum, but is not possible with the SR570 electronics alone.
19
Figure6 showssomespecificexamplesof sensoroutputin responseto bothhighandlow
voltageWFG-simulatedlightningelectricfieldchanges;theamplifiergainwassetto 1/iA/volt
and the 10 - 30 Hz band-pass filter was used. The train of sensor output pulses provided in
Figure 6(a) are due to a +2083 V/m square wave calibration input; this field change magnitude is
typical of lightning that is a few kilometers away from the observer. Note that the output
waveforms decay back to zero with an e-folding time (effective RC decay) of-14 ms. The
amplifier then "overshoots" until it recedes back completely to zero about 154 ms later. At a gain
of 50 nA/volt, there was no overshooting and the e-folding time was -27 ms.
Figure 6(b) shows the output for a square wave input of only +30.6 V/m. The low-end
sensitivity and signal-to-noise shown in Figure 6(b) can be further improved by further
optimizing the misalignment of the optical system. Additional details related to the general
accuracy and limits of precision of electro-optic voltage sensors is provided in the U.S. National
Bureau of Standards (NBS) report given in [31].
We performed these type of calibration tests for a variety of simulated lightning AE values
and amplifier gains when the sensor was deployed outside of building 4614 at the NASA MSFC.
Figure 7 shows a sample linear response calibration plot acquired over a large range of AE values
when the gain was set to I/_A/volt. Because the KDP crystal half wave voltage V,_ is about 9000
volts, the lightning detector's full dynamic range well exceeds that shown in Figure 7. In
addition, because of the misalignment of optical elements, the value of 6 in (19) differs from
nt4 so that we are able to discriminate between positive and negative lightning AEs, i.e., the
linear calibration curve extends to negative values of AE.
6. Storm Data
20
Thesummerof 1998in northernAlabamawasmarkedby substantiallydryperiodsthatled
to eventualfire outbreaksin September.Nonetheless,we wereableto deploythe lightning
detectoronfive separateoccasionsfor stormsthatoccurredonJune30,and July3,20,21,and
24. The stormoccurringon July 20 resultedin a lightningdeathto a citizenof northern
Huntsville,Alabamathat occuredabout45 minutesprior to the startof ourdatacollection
period.
TheNationalLightningDetectionNetwork(NLDN)operatedbyGlobalAtmosphericsInc.
(GAI) locatedin Tucson, Arizona detected widespread cloud-to-ground activity on June 30 over
much of northern Mississippi, Alabama, and Georgia, and over most of Tennessee. Several
cloud-to-ground lightning events that occurred within a few kilometers of our deployment site
were identified by eye and were time-correlated with transient sensor outputs that we displayed
in real time on the Pentium computer. We used Microcal Origin 4.0 data acquisition software in
"scope" mode to look at the digitized sensor output. We also viewed the direct analog output of
the sensor on a conventional 40 MHz oscilliscope. Our sensor detects both ground and cloud
discharges, but for these daytime thunderstorms it was more practical to time-correlate events
with ground discharges, i.e., it was easier to see the well-defined channel of a ground stroke
rather than the faint diffuse emission from cloud-obscured discharges.
Figure 8(a) shows the output from the electro-optic lightning detector for an active 2-min
period during the June 30 storm (the plot abscissa is in seconds after 4:48:30.5 PM CST, i.e., the
time the sensor was turned on). These data were collected using a gain of 50 nA/volt, or a factor
of 20 higher than that shown in the calibration curve in Figure 7. By looking southward from our
deployment site during this storm, we were able to visually confirmed over 10 lightning events
that gave coincident field excursions in our recorded sensor output. Two small amplitude
lightning flashes are indicated with pointers in Figure 8(a), and a more time-resolved plot of each
21
flashis providedin Figure 8(b) and 8(c). These particular flashes were confirmed by eye as
cloud-to-ground events. Several rapid variations are evident in each flash that we believe are
individual strokes. The duration between the peaks of these excursions is less than -100 ms
which is characteristic of the interstroke time interval shown in Figure 3 of [2]. There may even
be evidence of a small amplitude "K" change just after 3160.4 s in Figure 8(c). There are some
positive excursions starting at ~3122.7 s in Figure 8(b) that might be associated with stepped
leader activity or other local atmospheric electrical effects. We believe that the negative
excursion before the series of positive strokes is associated with an upward in-cloud moment
change; a similar negative excursion also occurs in the flash shown in Figure 8(c).
As we have stated, vibrations due to wind, precipitation, and thunder can produce noise in
the sensor output and these affects are evident for small amplitude discharges. Figure 9 shows
some time-resolved, single pulse, large amplitude events that occurred earlier during the June 30
storm. There are several low amplitude reverse-polarity field changes associated with distant
lightning events, and two larger amplitude events that are probably much closer to the sensor. It
is possible that the reverse-polarity events are associated with cloud discharges that occur
beyond the "reversal distance", i.e., the surface field verses range from a tripolar thundercloud
charge distribution reverses sign at the "reversal distance", or about 10 km [1].
The saturation output voltage of the SR570 amplifier is +5 volts which was occasionally
exceeded by some lightning events. In some cases, we were forced to decrease sensor gain to
avoid frequent pulse saturation in the data stream. An RS232 cable connection between the
amplifier and our indoor computer allowed us to remotely adjust sensor gain as the storm cells
moved or developed relative to the deployment site.
22
7.Summary
In the future,we would like to furtherexperimentwith andoptimizethe electro-optic
lightningsensorand deploy it againto collect morestormdata.As we havestated,the
dimensionsof oursensorcouldbescaleddownsignificantly.The laser and all optical elements
could be precision-mounted within a single sealed tube only a few inches long and wide.
Alternately, a small crystal attached to polarization maintaining (PM) fibers and an antenna
could be the sole components deployed into the thunderstorm environment; the photodetector,
current amplifier, laser, and remaining optics could all reside inside a building along side the
data acquisition computer. Or, crossed polarizers could be mounted to the crystal and regular
fiber optic cables used. In any case, a single unit reduced size system would be less susceptible
to vibration-induced noise sources.
Size reduction, as well as improvements in low end sensitivity and signal-to-noise are
fundamental to improving the attractiveness of electro-optic applications in the discipline of
lightning research. It is possible to arrange optics in such a way as to pass the laser light multiple
times through the crystal to increase the total birefringence and thereby substantially improve
sensor gain. We are also interested in inspecting other crystal types that offer certain advantages
such as bismuth germanate (Bi4Ge3012) described in [32] and Hexamine ((CH2)6N4) described
in [33].
Ultimately, the electro-optic technology needs to be placed beside a conventional electric
field mill such as the type operated by the NASA Kennedy Space Center (KSC) and the U.S. Air
Force Eastern Range (ER) located in east central Florida. This would allow one to further inspect
the sensitivity, accuracy, signal, and noise characteristics of the electro-optic sensor under a
variety of environmental conditions and lightning source stimuli.
23
In the future, lightning field changes derived from a ground-based network of electro-optic
sensors that cover a region of a few hundred square kilometers could be used to retrieve the
charges deposited by a lightning. This has already been achieved using the KSC-ER field mill
network, but with the added difficulty and errors associated with detecting and computing values
of AE from the continuous E-data ([33] - [37]).
Acknowledgments: We are grateful for the assistance of NASA MSFC's computer aided design
engineer Mr. Steven Beneficial, the graphical art support of Janine Roskowski, and the final
manuscript editing performed by Susan Burrer. This work was made possible through NASA
Center Director's Discretionary Fund (CDDF) project #96-11.
24
References
[1] Uman, M. A., The Lightning Discharge, International Geophysics Series, Vol. 39, Academic
Press, Inc., Orlando, Florida, 1987.
[2] Kitigawa, N., and M. Brook, A comparison of intracloud and cloud-to-ground lightning
discharges, J. Geophys. Res., 65, 1189- 1201, 1960.
[3] Osamu, K., and K. Kakishita, Electo-optical effect of Bi4Ge3012 crystals for optical voltage
sensors, Jpn. J. Appl. Phys., 32, 4288 - 4291, 1993.
[4] Hilliard, D. P., and D. L. Mensa, Photonic electromagnetic field sensor apparatus, United
States Patent #5243186, September 7, 1993.
[5] Nelson, B. N., C. Menzel, and T. G. DiGiuseppe, Fiber optic electric field sensor
configurations for high bandwidth lightning research measurement applications, SPIE: High
Bandwidth Analog Applications of Photonics, 720, 85 - 91, 1986.
[6] Masterson K. D., Photonic electric-field probe for frequencies up to 2 Ghz, SPIE: High
Bandwidth Analog Applications of Photonics, 720, 100 - 104, 1986.
[7] Kanoi, M., G. Takahashi, T. Sato, M. Higaki, E. Mori, and K. Okumura, Optical voltage and
current measuring system for electric power systems, IEEE Trans. on Power Delivery, PWRD-1,
91 - 97, 1986.
25
[8] Kyuma,K., S.Tai, M. Nunoshita,N. Mikami,andY. Ida,Fiber-opticcurrentandvoltage
sensorsusingaBil2GeO20singlecrystal,J. Light. Tech., LT-1, 1983.
[9] Shibata, K., A fibre optic electric field sensor using the electrooptic effect of Bi4Ge3012,
Fuji Electric Corporate Research and Development, Ltd., Japan (Presented paper preprint), circa
1982.
[10] Hamasaki, Y., H. Gotolt, M. Katoh, and S. Takeuchi, OPSEF: An optical sensor for
measurement of high electric field strength, Elect. Let., 16, 406 - 407, 1980.
[11] Yariv, A., and P. Yeh, Optical Waves in Crystals, John Wiley & Sons, New York, 1984.
[12] Tahara, N., M. Shimizu, K. Nakamura, E. Enukai, and Y. Kojima, A lightning warning
device using liquid crystal elements, Sixth International Conference on Dielectric Materials
(Conf. Pub. No. 363), Sponsored by the Institution of Electric and Electronic Engineers (IEEE)
United Kingdom, 397-400, 1992.
[13] Sliker, T. R., and S. R. Burlage, Some dielectric and optical properties of KD2PO 4, J. Appl.
Phys.,34, 1837- 1840, 1963.
[14] Pockels, F., Abhandlungen der Gesellschaft der Wissenschaften zu Gottingen, 39, 1, 1893.
[15] Pockels, F., Lehrbuch der Kristalloptik, Leipzig, 1906.
26
[16] Jackson, J., Classical Electrodynamics, 2 nd Ed., John Wiley & Sons, New York, p. 218,
1975.
[17] Ghatak, A. and K. Thyagarajian, Optical Electronics, Cambridge Univ. Press, Cambridge,
pp. 74 - 89, 1989.
[18] Levi, L., Applied Optics, a Guide to Optical System Design, Vol. 2, John Wiley & Sons,
New York, pp. 283-284, 1980.
[19] Holmes, D., Exact theory of retardation plates, J. Opt. Soc. Amer., 54, 1115-1120, 1964.
[20] Holmes, D., and D. Freucht, "Electromagnetic wave propagation in birefringent
multilayers", J. Op. Soc. Am., 56, 1763-1769, 1966.
[21] Mickleson, A., Physical Optics, Van Nostrand Reinhold, New York, p. 17, 1992.
[22] Billings, B. H., The electro-optic effect in uniaxial crystals of the type X H2PO4, II.
Experimental, J. Opt. Soc. Amer., 39, 802 - 807, 1949.
[23] Steinmetz, L. L., T. W. Pouliot, and B. C. Johnson, Cylindrical, ring-electrode KD*P
electrooptic modulator, Appl. Opt., 12, 1468 - 1471, 1973.
[24] West, E. A., Using KD*P modulators for polarization measurements of the Sun, SPIE:
Polarization Considerations for Optical Systems 11, 1166, 434 - 445, 1989.
27
[25] West, E. A., and N. Wilkins, DC bias moulation characteristics of longitudinal KD*P
modulators, SPIE: Polarization Analysis and Measurement, 1746, 386 - 394, 1992.
[26] Phillips, R. A., Temperature variation of the index of refraction of ADP, KDP, and
Deuterated KDP, J. Opt. Soc. Amer., 56, 629 - 632, 1966.
[27] Lee, K. S., New compensation method for bulk optical sensors with multiple birefringences,
Appl. Opt., 28, 2001 - 2011, 1989.
[28] Billings, B. H., The electro-optic effect in uniaxial crystals of the type XH2PO 4 , I.
Theoretical, J. Opt. Soc. Amer., 39, 797 - 801, 1949.
[29] Billings, B. H., The electro-optic effect in uniaxial crystals of the dihydrogen phosphate (X
H2PO4) type. IV. Angular field of the electro-optic shutter, J. Opt. Soc. Amer., 42, 12 - 20, 1952.
[30] Gilbert, M. A., Polarizability of an electro-optic parallelepiped crystal, SPIE. High
Bandwidth Analog Applications of Photonics, 720, 92 - 99, 1986.
[31] Day, G. W., P. D. Hale, M. Deeter, T. E. Milner, D. Conrad, and S. M. Etzel, Limits to the
Precision of Electro-Optic and Magneto-Optic Sensors, NBS Technical Note 1307, #PB87-
212536, U.S. Department of Commerce, 1987.
28
[32]WilliamsP.A., A. H. Rose,K. S.Lee,D. C. Conrad,G.W. Day,andP.D. Hale,Optical,
thermo-optic,electro-optic,and photoelasticpropertiesof bismuthgermanate(Bi4Ge3Ol2),
Appl. Opt., 35, 3562 - 3568, 1996.
[331 Forno, C., and O. C. Jones, Hexamine electro-optic light modulators, J. of Phys. E:
Scientific Instruments, 7, 101 - 104, 1974.
[34] Koshak, W. J., and E. P. Krider, A linear method for analyzing lightning field changes, J.
Atmos. Sci., 51,473 - 488, 1994.
[35] Koshak, W. J., and E. P. Krider, Analysis of lightning field changes during active Florida
thunderstorms, J. Geophys. Res., 94, 1165-1186, 1989.
[36] Maier, L. M., and E. P. Krider, The charges that are deposited by cloud-to-ground lightning in
Florida, J. Geophys. Res., 91, 13,275-13,289, 1986.
[37] Jacobson, E. A., and E. P. Krider, Electrostatic field changes produced by Florida lightning, J.
Atmos. Sci., 33, 103-117, 1976.
29
Figure Captions
Figure 1. Typical electro-optic Pockel cell light amplitude modulator [adapted from Yariv and
Yeh, 1984].
Figure 2. Overview of the electro-optic lightning detector system; AE denotes a thunderstorm
electric field change produced by a cloud-to-ground lightning event shown to the left.
Figure 3. The basic components of the electro-optic lighting detector: (a) optics, and (b) the
optical housing and antenna.
Figure 4. Comparison of the transmission T for aligned and misaligned optics (a) without a
quarter wave plate and (b) with a quarter wave plate.
Figure 5. The change in transmission AT for a voltage change AV = V- 0 = V across the crystal
all as a function of V, with and without a quarter wave plate for (a) aligned optics and (b)
misaligned optics.
Figure 6. Some calibration results for (a) a typical lightning field change of 2083 V/m and (b) a
very small 30.6 V/m field change that would be produced by a distant lightning source. The
band-pass filter of the amplifier is 10 - 30 Hz and the amplifier gain is 1/zA/volt.
30
Figure 7. Sample calibration curve across a wide dynamic range of AE values. A linear
regression fit to the data points shown is ALE = -21.130 + 371.495AF; the linear regression
constant is r = 0.99902. The band-pass filter of the amplifier is 10 - 30 Hz and the amplifier gain
is 1/tA/volt.
Figure 8. Example of lightning data results for a storm that occurred on June 30, 1998: (a) for a
2-min period, (b) for a cloud-to-ground lightning flash within the 2-min period, and (c) another
cloud-to-ground flash in the 2 minute period. The band-pass filter of the amplifier is 10 - 30 Hz
and the amplifier gain is 50 hA/volt, or a factor of 20 higher than that used in the calibration plot
of Figure 7.
Figure 9. Additional examples of larger amplitude time-resolved lightning field changes
collected from the June 30, 1998 storm. Several small field excursions exist due to distant
lightning. The band-pass filter of the amplifier is l0 - 30 Hz and the amplifier gain is 50 hA/volt,
or a factor of 20 higher than that used in the calibration plot of Figure 7.
31