Embed Size (px)
Citation preview


ELECTRICITY NETWORK PERFORMANCE REPORT 2012/13 | 2
Contents Introduction ................................................................................................................................................................................... 4 1 Profile ............................................................................................................................................................................ 5
1.1 Overview 5 1.2 Capital Works Program 8
2 Network Management .................................................................................................................................................. 9 2.1 Overview 9 2.2 Network Complaints 9
3 Network Planning ....................................................................................................................................................... 10 3.1 Overview 10 3.2 System Design Criteria (Planning Standards) 11 3.3 Demand Management 11
4 Asset Management .................................................................................................................................................... 13 4.1 Overview 13 4.2 Technical Service Standards 13 4.3 Transmission Reliability 13
5 Network Safety ........................................................................................................................................................... 15 5.1 Overview 15 5.2 Public Injuries 16 5.3 Worker Injuries 16 5.4 Major Incident Reports 16
6 Bush Fire Risk Management ..................................................................................................................................... 17 6.1 Bush Fire Risk Management Plan 17 6.2 Bush Fire Risk Management Performance 17 6.3 Audits 17 6.4 Preventative Programs 17 6.5 Proactive Programs 17
7 Public Electrical Safety Awareness .......................................................................................................................... 18 8 Power Line Crossings of Navigable Waterways ..................................................................................................... 19 9 CEO/ Managing Director Declaration ............................................................................. Error! Bookmark not defined.

ELECTRICITY NETWORK PERFORMANCE REPORT 2012/13 | 3
Tables and Figures Table 1.1 Network Operator Statistics .................................................................................................................................. 5 Figure 1.1 TransGrid’s Transmission Network ...................................................................................................................... 6 Table 1.2 Capital works program trend................................................................................................................................. 8 Table 2.1 Complaint Performance Data ................................................................................................................................ 9 Figure 3.1 TransGrid’s Planning Roles ................................................................................................................................ 10 Table 4.1 Transmission Asset Availability (%) Trend ........................................................................................................ 13 Table 4.2 Network Reliability Trend (Off Supply Event Numbers) .................................................................................... 13 Table 4.3 Outage (Un-Planned) Average Duration (Minutes) Trend ................................................................................. 13 Table 4.4 Market Impact of Transmission Congestion (5 min dispatch periods) ............................................................ 14 Table 4.5 Connection Point Interruptions (Unplanned) Current Year .............................................................................. 14 Table 4.6 Connection Point Numbers ................................................................................................................................. 14 Table 5.1 Public Injuries ....................................................................................................................................................... 16 Table 5.2 Serious Electrical Network and Electrical Accident and Reportable Safety Incidents. ................................. 16 Table 6.1 Bushfire risk management .................................................................................................................................. 17 Table 8.1 Power Line Crossings of Navigable Waterways Summary .............................................................................. 19

ELECTRICITY NETWORK PERFORMANCE REPORT 2012/13 | 4
IntroductionThis Electricity Network Performance Report has been prepared by TransGrid to fulfil the requirements of the Electricity Network Operator reporting regime and the Electricity Supply (Safety and Network Management) Regulation 2008.
This report outlines TransGrid’s performance in meeting its NSW regulatory objectives for the 2012/13 Financial Year.

ELECTRICITY NETWORK PERFORMANCE REPORT 2012/13 | 5
1 Profile 1.1 Overview TransGrid is Australia’s largest electricity transmission company with its network comprising more than 12,700 kilometres of high voltage transmission line and underground cables, as well as 94 substations and switching stations, worth over $5.4 billion.
TransGrid is responsible for planning and developing the New South Wales transmission system to meet the requirements of customers within NSW and the ACT, and to facilitate operation of the National Electricity Market.
The TransGrid network operates at voltage levels of 500, 330, 220 and 132 kilovolts (kV). TransGrid’s substations and power
station switchyards are located on land owned by TransGrid. Transmission lines are generally constructed on easements acquired across private or public land.
TransGrid has staff strategically based at locations throughout NSW. They are responsible for day-to-day operations and maintenance activities, as well as emergency response. The main administrative office is located at 201 Elizabeth Street, Sydney. Field staff are co-ordinated from major depots located in Tamworth, Newcastle, Orange, Western Sydney, Yass and Wagga Wagga.
Table 1.1 Network Operator Statistics
Number at end of 2011/12 Number at end of 2012/13
Customer Numbers (Total) 14 15
Maximum Demand (Aggregated System MW) 12,884 13,946
Energy Received to Year End (GWh) 70,884 65,579
System Loss Factor (%) 1.5% 1.43%
High Voltage Overhead (km) 12,623 12,704
High Voltage Underground (km) 47 47
Substation (Number) 94 94
Structures (Number) 37,189 37,400
Poles (Number) 39,069 39,016
Employees (Full Time Equivalent Number) 1063 1069
Contractors (Full Time Equivalent Number) 176 156

ELECTRICITY NETWORK PERFORMANCE REPORT 2012/13 | 6
Figure 1.1 TransGrid’s Transmission Network
YassMarulan
Yanco
Griffith
Buronga
Broken Hill
FinleyDeniliquin
Darlington Point
AlburyHume
Cooma
Munyang
Snowy Adit
Queanbeyan
Tumut
Murrumburrah
Cowra
Kangaroo Valley
Panorama
Molong
Orange
Beryl
Parkes
Forbes
Wellington Bayswater Liddell
Dapto
Muswellbrook
Tamworth 330
Armidale
DumaresqLismore
Tamworth 132
Gunnedah
Narrabri
Moree
Inverell Glen Innes
Tenterfield
Koolkhan
Coffs Harbour
Nambucca
Kempsey
Port Macquarie
Taree
OPERATING SYSTEM VOLTAGES
Balranald
Coleambally
Murray
Upper Tumut
Lower Tumut
ANMJindera
Guthega
Wallerawang132 & 330
Avon
Wagga 132
SubstationsSubstationsSubstationsSubstations
INSET
Burrinjuck
500 kV Transmission Lines330 kV Transmission Lines220 kV Transmission Lines132 kV Transmission Lines330 kV Underground CableCustomer Exchange PointInterstate Exchange Point
Wag
ga
330
Red Cliffs
Dederang
Wodonga
Bulli CreekMudgeeraba
Uranquinty
Gadara
Capital Wind Farm
Raleigh
Wollar
Macksville
Boambee South
Bannaby
Wagga North
8E 8C
8M 8L 96L
Direct Link
967
89
96R
96T966
87
96C
96H
965
9U2
96M
9U3
968
86
85969
97A97B
88 84
83
5A6 5A7
5A5 5A381
8232 31
964
96P
963
94M
94B
947
948944
94X
947
72
79
94E
94K
945
94T94P
94U
9987677999973
61
3910
18
16
854
6
3W9
99M
990
991970
3
2 977/1976/1
976/2
O7
O1
99499F
99J
99K
97K/2
97K/1
97897D
979
97G6867
6665
64
O51
992
ex-975
99TX5/1
X5/3
X2
99L
99A
9R3
63
996
62
O60995
99B99H
9R19R2
96G
9W89W3
9W79W6
9W2
9W5
OX1
5A4
96F
8996N
993
9W9
9R6
9U4
Manildra94H
Orange North
949
Williamsdale
978 97D
Stroud
Hawks Nest
Mudgee
Ilford
Burrendong
Wellington
Geehi
Blowering
Murrumbateman
Casino
99P
O97B
3W
6
3CCanberra
Jindabyne97L
963
Morven
99Z
to Tomago
17 11
Mt Piper500/330

ELECTRICITY NETWORK PERFORMANCE REPORT 2012/13 | 7
Eraring
Vales Point
RegentvilleSydney West
Sydney South
Liverpool
Vineyard
Ingleburnto Bannaby
to Bayswater
to Liddell
INSET
Haymarket
Macarthur
to Wallerawang
Kemps Creek
Tomago
Munmorah
Tuggerah
Sydney East
NewcastleWaratah
West
Sydney North
to Daptoto Avon
Beaconsfield West
5A1 5A232 31
82
81
9496
9W
8295
90 9293
26
2M
24 92
23, 26
25 2221
26 29
14 20
38
32
30
14
13 12 41
42
11
7678
76
17
37
39
27 95992Z
932, 939
28
26
77
Mount Colah
Mount Druitt
Brandy Hill
9C6,9C5
9C8 to Stroud
One Steel

ELECTRICITY NETWORK PERFORMANCE REPORT 2012/13 | 8
1.2 Capital Works ProgramTransGrid’s capital works program is needed to ensure the NSW electricity transmission network continues to deliver a secure, reliable and safe supply of electricity to businesses and consumers in NSW and the ACT. The capital works program is primarily driven by either the need to augment the network as demand grows, or the need to replace assets when they reach the end of their serviceable life.
Between 2009 and 2014 TransGrid will undertake more than 80 projects across NSW as part of a $3 billion capital works program. For the 2012/13 financial year TransGrid’s capital expenditure was $547.3 million.
Table 1.2 shows TransGrid’s capital expenditure in the last 5 financial years.
Table 1.2 Capital works program trend
Previous Years Current Year
Year 2008/09 2009/10 2010/11 2011/12 2012/13
Capital works program ($M) 619.9 428.7 378.6 384.4 547.3
1.2.1 Recently Completed Projects
Beaconsfield West 330/132kV Substation Redevelopment
TransGrid replaced the 132 kV gas insulated switchgear at Beaconsfield West 330/132 kV Substation as is had reached the end of its serviceable life. There was also a need to provide additional 132 kV cable connections, a third 330/132 kV transformer and two 132 kV capacitors. These works were completed in November 2012.
Wallerawang 132/66kV Substation Replacement
The old Wallerawang 132/66 kV Substation is in the process of being decommissioned at the end of its serviceable life. Construction of the new Wallerawang 132/66 kV Substation was completed in May 2013. Over the coming year, transfers of the 132 kV and 66 kV transmission lines from their current connection point at the old substation to the new substation site will be undertaken. This work is expected to completed by mid 2014.
Tomago 330/132kV Substation Development
To relieve constraints on the sub-transmission system in the Newcastle area, TransGrid has expanded the Tomago 330/132kV Substation with the installation of a third 330/132kV transformer and the provision of two additional 132 kV line switchbays. The works were completed in June 2013.
Munyang Transformers Replacement
TransGrid replaced two 132/33kV oil filled transformers at Munyang Substation that were at the end of their serviceable life with new gas-insulated transformers. These works, which reduce the environmental risk at this site adjacent to the Snowy River, were completed in March 2013.
Establishment of Orange North 132 kV Switching Station
To meet the present and emerging limitations, TransGrid has established Orange North 132 kV Switching Station to the north of the existing Orange 132/66 kV Substation to increase the capacity of the transmission network supplying the Orange area. The switching station works were completed in March 2012 with the line rearrangements completed in September 2012.
Establishment of Williamsdale 330/132 kV Substation
The construction of Williamsdale 330/132 kV Substation was completed in October 2011. The provision of the 330kV supply to the substation was achieved with the completion of the Canberra to Williamsdale 330kV transmission line in February 2013. The ACT and the Cooma/Monaro region is now supplied from the Williamsdale 330/132kV substation
Supply to the Hawks Nest/Tea Gardens Area
Hawks Nest is located approximately 75 kilometres south of Taree. Essential Energy constructed a new single transformer 132/33kV substation together with associated 33kV line works to connect it to the local 33kV network to meet reliability requirements for the area. TransGrid provided short sections of 132kV line to connect the new substation to the 963 Tomago – Taree 132kV transmission line. The substation was commissioned in October 2012.
Other Projects
Completed connections for distributor requirements at Newcastle, Waratah West, Port Macquarie and Vales Point Substations.
Capacitor bank replacements at Sydney West, Coffs Harbour, Port Macquarie and Griffith substations.
Provision of dual switching at Liddell 330kV switchyard for the 84 Liddell – Tamworth 330kV transmission line.
Installation of Phase Angle Measurement Units at five sites between Sydney and Newcastle as part of joint work with Ausgrid on the Smart Grid Smart City project.

ELECTRICITY NETWORK PERFORMANCE REPORT 2012/13 | 9
2 Network Management2.1 Overview In the 2012/13 financial year TransGrid has commenced a number of new initiatives related to improving the management of the transmission network. These include:
The completion of the Project Symphony, a business transformation project to further integrate the way TransGrid conducts its business. An upgrade of the Ellipse and Oracle ERP systems were the main component of this project.
The second Demand Management Innovation Forum was held in 2012/13 to support TransGrid’s corporate objective to service the market. This forum provided an opportunity to provide details on TransGrid’s initiatives and to obtain valuable feedback and idea exchange from key customer groups.
TransGrid is currently moving towards certification for it’s asset management systems under the PAS 55 / ISO 50001 Asset Management Framework. PAS 55 (later ISO 55001) is an internationally recognised framework which allows asset management performance to be objectively measured against a maturity scale, and to enable the targeting of improvement programs in those areas considered to give the best value. This initiative aims to formally recognise TransGrid’s asset management capabilities and provide a framework for the continuing improvement of core asset management competencies.
2.2 Network Complaints There were 44 complaints registered during 2012/13. This result is higher than 2011/12, but within the bounds of the five year historical results. This volatility in the number of complaints can be expected due to fluctuations in the number and types of major capital projects being undertaken in each financial year.
The majority of complaints were associated with the major capital works program and primarily relate to:
Issues with impacts of construction such as noise, dust, restriction to business opening hours and other impacts (23 complaints).
Objections to specific project works, including consultation processes, compensation and visual amenity concerns (9 complaints).
Issues with access to land for project work, including protocols not being followed and gates not left as found (7 complaints).
Complaints are formally registered with TransGrid’s Corporate Communications team and all attempts are made to address with the complainant. A summary of complaints and outcomes are provided to senior management at regular intervals to monitors the organisations performance in complaint handling.
Table 2.1 Complaint Performance Data
Previous Years Current Year
Years 2008/09 2009/10 2010/11 2011/12 2012/13
Complaints Total 92 20 3 26 44
Complaints regarding Vegetation Management 1 1 1 0 1

ELECTRICITY NETWORK PERFORMANCE REPORT 2012/13 | 10
3 Network Planning3.1 OverviewTransGrid carries out planning in accordance with its regulatory obligations under the National Electricity Rules (NER), Jurisdictional requirements and customer expectations. As the Jurisdictional Planning Body (JPB) for NSW, TransGrid works with the Australian Energy Market Operator (AEMO) to provide input to the Electricity Statement of Opportunities (ESOO) and National Transmission Network Development Plan.
As a registered Transmission Network Service Provider (TNSP) in the National Electricity Market (NEM), TransGrid is required to perform a yearly planning review and produce a Transmission Annual Planning Report (TAPR) with information relevant to supply demand balance, transmission network planning and distribution network planning.
The roles of AEMO, TransGrid and other parties in the planning process are set out in Figure 3.1.
Figure 3.1 TransGrid’s Planning Roles

ELECTRICITY NETWORK PERFORMANCE REPORT 2012/13 | 11
3.2 System Design Criteria (Planning Standards)
Under NSW legislation, TransGrid has responsibilities that include planning for future NSW transmission needs and interconnections with other networks. The NSW Government has specified the Transmission Network Design and Reliability Standard to be applied by TransGrid.
In addition, as a TNSP in the NEM, TransGrid is obliged to meet the requirements of Schedule 5.1 of the NER. In particular, TransGrid is obliged to meet the requirements of clause S5.1.2
The NER sets out the required processes for developing networks as well as minimum performance requirements of the network in a range of areas. These include contingency events, power transfer capability, power, voltage, and frequency quality, line ratings and protection systems. It also requires TransGrid to consult with AEMO, Registered Participants, and interested parties and to apply the AER’s Regulatory Investment Test for Transmission (RIT-T) to development proposals.
In meeting these obligations TransGrid’s approach to network planning is socially and economically based and is consistent with both the NER and the RIT-T. It includes consideration of non-network options such as demand side response (DSR) and demand management (DM) and/or embedded generation, as an integral part of the planning process. Joint planning with Distribution Network Service Providers (DNSPs), directly supplied industrial customers, generators and interstate TNSPs is carried out to ensure that the most economic options, whether network options or non-network options are identified and implemented to meet customer and community requirements.
In addition to meeting requirements imposed by the NER, environmental legislation and other statutory instruments, TransGrid is required by the NSW Government to plan and develop its transmission network on an “n-1” basis. That is, unless specifically agreed otherwise by TransGrid and the affected distribution network owner or directly connected end-use customer, there will be no loss of load (other than load which is interruptible or dispatchable) following the occurrence of a credible contingency on the network at any time. In fulfilling this obligation, TransGrid must recognise specific customer requirements as well as AEMO’s role as system operator for the NEM.
TransGrid’s planning obligations are also interlinked with the licence obligations placed on DNSPs in NSW. TransGrid must ensure that the system is adequately planned to enable their licence requirements to be met. For instance, if the mandatory DNSP license obligation is an “n-1, 1 minute” reliability standard for sub-transmission lines and zone substations supplying loads greater than or equal to specified minimums, eg 15 MVA in urban and non-urban areas, the requirement imposes a consequential obligation on TransGrid to provide a commensurate level of reliability in its network supplying the sub-transmission line or zone substation. In addition to adherence to the NER and regulatory requirements, TransGrid’s transmission planning approach takes into account the historical performance of the components of the NSW system, the sensitivity of loads to supply interruption and asset maintenance procedures. It has also been recognised that there is a need for an orderly development of the system taking into account the long-term requirements of the system to meet future load and generation developments.
3.3 Demand Management The primary drivers for investment in new assets on the NSW transmission network is the need to replace ageing assets due to their condition and the need to augment capacity due to increases in peak demand. System constraints emerge as the maximum capability of existing assets is reached. These constraints are usually due to growth in demand, or in some cases a reduction in rating for ageing assets due to their condition. To relieve constraints, investments in new transmission assets may be required. However, if the peak demand can be managed, it is possible to reduce, defer or eliminate the need for new transmission investment and thereby reduce the costs and environmental impacts associated with construction of new assets.
During the assessment of options to address an emerging constraint, demand management is referred to as a non-network option. Non-network options consist of one or more of demand management, demand side response, embedded generation and local generation.
Demand Management (DM) or Demand Side Response (DSR)
DM or DSR options may include, but are not limited to, combinations of the following:
Reduction in electricity demand at points of end-use by using energy efficiency systems, renewable and reticulated energy sources, etc
Reduction in peak electricity consumption at points of end-use through tariff and load curtailment incentives, energy storage systems, standby generators, power factor correction, etc
Embedded or Local Generation
Embedded or local generation options may include generation or cogeneration facilities located on the load side of a transmission constraint. They may utilise alternative energy sources such as bagasse, biomass, gas, hydro, solar, etc.
TransGrid actively promotes these non-network options by informing the market of constraints via the TAPR, external consultations, joint planning and reviews with distributors and joint sponsorship of research projects.
3.3.1 Consideration of Non-Network Options by TransGrid
TransGrid’s TAPR provides advance information to the market on the nature and location of emerging network constraints. This is intended to encourage interested parties to formulate and propose feasible non-network options to relieve emerging network constraints.
TransGrid considers non-network options on an equal footing with network options when planning its network augmentations and applying the RIT-T.
For a non-network option to be considered during the evaluation and analysis process, it must be feasible and capable of being implemented in time to relieve the emerging constraint. The option can then be recommended and implemented if it satisfies the RIT-T.
It is expected that DM and local/embedded generation options would emerge from joint planning with DNSPs, from the market or from interested parties.

ELECTRICITY NETWORK PERFORMANCE REPORT 2012/13 | 12
3.3.2 Price Signals and Financial Incentives to Encourage DM and Local Generation
TransGrid is a provider of bulk transmission network services and is best placed to implement ‘bulk’ DM options. For instance, a monthly maximum demand charge on customers encourages the implementation of demand side response at the time of maximum demand on the transmission network.
Additionally, TransGrid can and does provide financial incentives via direct payments under network support contracts with wholesale suppliers of demand reductions such as larger end users or embedded generators or DM aggregators. Contractual payments to smaller suppliers of DM are now proving practical for TransGrid with the increasing number of DM aggregators. The regulatory incentive framework is evolving to provide improved commercial incentives for TransGrid to engage in these activities.
3.3.3 Promotion of DM and Local Generation Alternatives by TransGrid
TransGrid actively promotes DM and local generation alternatives through:
Identifying opportunities for DM and local generation options through joint planning with the DNSPs and engaging expert external consultants where warranted.
Informing the market of constraints via the TAPR and consultations for alleviating individual constraints.
Participation in initiatives and reviews that include consideration of DM and its relationship to the development of electricity networks.
Joint sponsorship of research projects involving DM and embedded generation.
On 14 June 2013, TransGrid hosted its second DM Innovation Forum in Sydney involving all NSW and ACT distributors, universities and advisors participating in the DM programs with TransGrid. Invitations were also extended to interstate DNSPs, with one providing a presentation via teleconference facilities. At the Forum, progress reports on all of the joint projects were presented. The participants also discussed the ways in which DM can be further promoted. The Forum was very well received by all participants as a result of the open exchange of information.

ELECTRICITY NETWORK PERFORMANCE REPORT 2012/13 | 13
4 Asset Management4.1 Overview TransGrid has developed an Asset Management model that is based on the NSW Government’s Total Asset Management Model.
TransGrid strives to meet availability, reliability, environmental, and safety objectives through efficient implementation of policies and procedures across every phase of the asset management lifecycle. These policies and procedures have been designed within a risk management framework to ensure that their implementation is carried out to achieve OH&S, environmental, and regulatory requirements.
The performance of the network is constantly monitored and Asset Management Strategies and Maintenance Policies are updated to ensure that asset performance objectives are met.
4.2 Technical Service Standards The AER Service Target Performance Incentive Scheme sets out TransGrid’s primary technical service standards. The measures are:
Reliability, based on the number of Energy Not Served (ENS) events.
Availability, based on transmission line, transformer, and reactive plant availability.
Average unplanned-outage duration.
Market impact of transmission congestion.
Further details of this scheme are available in the Service Target Performance Incentive Scheme Guideline published by the AER, available on its web site.
http://www.aer.gov.au/node/9417
4.3 Transmission Reliability The availability of transmission lines, transformers and reactive plant were below target for the 2012/13 financial year. This is mainly because of TransGrid’s large capital works program for transmission line rebuilds, pole replacements and transformer replacements. Also, a small number of reactive plant failure events have resulted in prolonged reactive plant outages.
Of TransGrid’s 15 connected customers, 12 did not experience any unplanned outages causing loss of supply or interruption to generation. No interconnectors experienced an unplanned outage.
Table 4.1 Transmission Asset Availability (%) Trend
Years
Objective 2008/09 2009/10 2010/11 2011/12 2012/13
Transmission Lines 99.26% 98.44 98.17 98.99 99.08% 98.89%
Transformers 98.61% 98.42 98.60 98.43 97.82% 97.59%
Reactive Plant 99.12% 98.96 96.35 95.71 96.16% 96.13%
Table 4.2 Network Reliability Trend (Off Supply Event Numbers)
Years
Objective 2008/09 2009/10 2010/11 2011/12 2012/13
Measure A >0.05 System Minutes Events 4 3 4 2 2 4
Measure B > 0.25 System Minutes Events 1 0 1 1 0 1
Table 4.3 Outage (Un-Planned) Average Duration (Minutes) Trend
Years
Objective 2008/09 2009/10 2010/11 2011/12 2012/13
824 862 607 926 1688 1705
The Average Unplanned Outage Duration result is at a relatively high level as a result of the occurrence of a small number of events, the nature of which has necessitated longer than average repair times. The root cause of these events has been reviewed and no particular trends or risks have been determined warranting corrective action.

ELECTRICITY NETWORK PERFORMANCE REPORT 2012/13 | 14
Table 4.4 Market Impact of Transmission Congestion (5 min dispatch periods)
Years Objective 2008/09 2009/10 2010/11 2011/12 2012/13 2857 N/A 1770 822 315 1013
The Market Impact of Transmission Congestion result for 2012/13 has been within the proposed target level.
Table 4.5 Connection Point Interruptions (Unplanned) Current Year
Connection Point Interruptions (Unplanned) Current Year
Connection Point Customer Interruption Duration Total (Minutes)
218 Sydney West - Eastern Creek 132kV Line Endeavour Energy 329
217 Sydney West - Eastern Creek 132kV Line Endeavour Energy 329
79C Griffith - Darlington 33kV line Essential Energy 60
79F Griffith - Yenda 33kV line Essential Energy 60
79J Griffith - Grifith Zone Standby 33kV line Essential Energy 60
79G Griffith - Griffith West 33kV line Essential Energy 60
80R Beryl - Ulan 66kV line Essential Energy 7
851 Beryl - Mudgee tee Gulgong 66kV line Essential Energy 7
No.1 Balranald - Balranald 22kV Line Essential Energy 156
No.2 Balranald - Moulamein 22kV Line Essential Energy 156
No.3 Broken Hill - South 22kV Line Essential Energy 86
No.4 Broken Hill - Railway Town 22kV Line Essential Energy 86
No.5 Broken Hill - Talc St -2 22kV line Essential Energy 86
722 Moree - Moree 66kV Line Essential Energy 222
876 Moree - Bellata 66kV Line Essential Energy 222
879 Narrabri - Wee Waa 66kV Line Essential Energy 161
861 Narrabri - Walgett 66kV Line Essential Energy 161
834 Narrabri - Narrabri 66 66kV Line Essential Energy 161
833 Narrabri - Narrabri 66 66kV Line Essential Energy 161
882 Narrabri - Wee Waa 66kV Line Essential Energy 161
837 Murrumburrah - Jugiong 66kV Line Essential Energy 209 83D Murrumburrah - Murrumburrah 66kV 66kV Line Essential Energy 209 847 Murrumburrah - Boorowa 66kV Line Essential Energy 209
96C Armidale - Coffs Harbour Tee Dorrigo 132kV TL Essential Energy 93
723 Moree - Wenna tee Wathagar 66kV Line Essential Energy 119
881 Moree - Garah tee Ashley 66kV Line Essential Energy 109
721 Moree - Moree 66kV Line Essential Energy 109
723 Moree - Wenna tee Wathagar 66kV Line Essential Energy 109
97G Murray - Guthega tee Geehi 132kV TL Snowy Hydro 2966
97G Murray - Guthega tee Geehi 132kV TL Snowy Hydro 97
M5 Murray - Murray 1 330kV TL Snowy Hydro 20
Table 4.6 Connection Point Numbers
Connection Point Numbers End Current Year Number of Connection Points (Total Number) 457 + 6 interconnectors
Note: for the purpose of connection point interruption reporting, the connection point numbers are counted as the basis of the number of individual supply points to all customers.

ELECTRICITY NETWORK PERFORMANCE REPORT 2012/13 | 15
5 Network Safety5.1 Overview TransGrid’s goal is zero injuries, occupational illnesses and incidents. Our first priority is the health and safety of our people, our contractors, visitors and the public. Our strategies are aimed at continually improving our performance and maintaining a major focus on risk management.
Our Health & Safety Management System is certified to Australian Standard AS/NZS 4801.
TransGrid’s Health & Safety Management System is overseen by the Executive Health and Safety Committee which is chaired by the Managing Director and includes the Executive General Manager or senior management representative from each business unit. A Health and Safety Board Committee also meets quarterly to review TransGrid’s health and safety incidents and risks. In addition, a number of key health and safety strategies and programs have been developed or conducted through the 2012/13 year including:
Improving contractor engagement and accreditation processes.
Project management improvement and delivery.
Continuing the communication of quarterly health and safety themes that reflect the key health and safety risks.
Shifting the reporting focus off lost time injuries to reporting high consequence near misses and incidents.
Improving the quality of safety compliance audits and inspections.
Encouraging health and safety information and communication which is increasingly available on “The Wire” (TransGrids intranet).
In 2012/13 the above strategies will continue with a focus on:
Demonstrating health & safety behaviours.
Minimising incidents through improving the safety focus for contractors.
Reducing the number of high consequence incidents.
Wellbeing and health.
The following activities continue to underpin our health and safety program:
Corporate Health and Safety Plan
This Plan sets out TransGrid’s objectives, targets and key strategies for the year and is the basis for the development of business unit Health and Safety Action Plans. Progress reports on each business unit’s Action Plan are reviewed by the Executive Health and Safety Committee on a quarterly basis.
A Corporate Health and Safety Plan 2013/14 has been developed, communicated and cascaded through the business where Business Units develop their own unique health and safety plan and measures based on the corporate plan and the local health and safety risks.
Wellbeing
The TransGrid “Wellbeing” Program has the vision “to promote living a healthy, happy and productive life by making personal choices that contribute to a healthy and balanced lifestyle”. The Program provides principles, policies and programs to support employees in the following areas:
Physical Wellbeing - Maintaining healthy and energetic bodies by making informed choices about exercise, diet and general fitness.
Emotional Wellbeing - The peace of mind, confidence, and self-respect that we achieve by coming to terms with the full range of emotions.
Social Wellbeing - Recognising the value and contribution of the relationships with family, colleagues and the community.
Financial Wellbeing - A sense of comfort and security that results from informed financial decisions that help us achieve our life goals.
Annual Safety Day
TransGrid’s 18th annual Safety Day attracted more than 80 participants and hundreds more spectators to Eastern Creek on 24 August 2012. Safety Day featured the traditional fire fighting, first aid, risk assessment and wiring competitions. TransGrid’s Safety Day helps to reinforce TransGrid’s emphasis on safety as the number one priority. The day helps to hone safety skills which positively influence a sustained safety culture in the workplace. It was also an opportunity to display and discuss issues relating to safety and wellbeing.
Schedule of Compliance Audits and Inspections
Compliance audits and inspections are conducted to ensure that procedures are implemented in accordance with legislative and organisational requirements. These include health and safety system audits, random unannounced safety compliance inspections, site conformance inspections, health and safety audits on construction and asset replacement projects, and maintenance activities. Non conformances identified in audits are reported and actions are tracked.
Health and safety audit reports provided by internal and external auditors reflect a strong health and safety commitment, understanding and performance across TransGrid.
Participation in Industry Committees
TransGrid takes an active role in a number of industry and Australian Standards committees and working groups such as Energy Networks Association’s Health, Safety and Environment Committee, Ministerial Council on Energy - Energy Supply Industry Safety Committee and the Department of Trade and Investment, Electrical Industry Asbestos Safety Working Group, Regional Infrastructure and Services NSW Industry Safety Steering Committee and the Australian Standards Technical Committee for the development of AS5577, the Electrical Industry Safety Management System Standard.
Participation ensures that trends and expectations of legislators, industry and the community are understood and managed effectively.

ELECTRICITY NETWORK PERFORMANCE REPORT 2012/13 | 16
5.2 Public Injuries In the 2012/13 financial year there were no Serious Electricity Network Accidents or Reportable Safety incidents where members of the public were involved.
Table 5.1 Public Injuries
Previous Years Current Year
Year 2008/09 2009/10 2010/11 2011/12 2012/13
Non-Fatal 0 0 0 0 0
Fatal 0 0 0 0 0
Total 0 0 0 0 0
5.3 Worker InjuriesThe injuries reportable in this section are defined in the guidelines for the Significant Electricity Network Incidents (SENI) Scheme. These definitions changed during 2012, and so the reporting is based on the following guidelines.
Date of Incident Number of injuries Guideline
Prior to 1 May 2012 Serious Electricity Network Accident + Serious Electrical Accident
Significant Electricity Network Incidents Objectives, definitions and reporting requirements February 2011
After 1 May 2012 Reportable Safety Incidents SENI Definitions and Reporting Requirements June 2012
No major reportable safety incidents occurred in the 2012/13 financial year. The relatively large (when compared with historical figures) number of reportable safety incidents is due to the change in reporting definitions. None of these incidents resulted in injury to workers or contractors, but met the SENI scheme definition of incidents involving electricity or network equipment or apparatus where a significant risk of serious injury was present.
Table 5.2 Serious Electrical Network and Electrical Accident and Reportable Safety Incidents.
Previous Years Current Year
Year 2008/09 2009/10 2010/11 July 2011 – April 2012
May 2012 – June 2012
2012/13
Workers 1 1 0 0 0 2
Contractors 0 1 2 1 0 4
Total 1 1 2 1 0 6
5.4 Major Incident Reports A contactor engaged by TransGrid on the Murray to Guthega transmission line upgrade project, died as the result of injuries he received in an incident that occurred on 11 April 2013. The incident involved mobile plant and occurred on an access track leading to structure 21 on TransGrid’s transmission line 97G. At the time of the incident, emergency procedures were deployed, an emergency signal was triggered and emergency services crews notified. WorkCover was also contacted and since that time a number of interviews with a WorkCover investigation officer have taken place and TransGrid continues to cooperate with WorkCover in its investigation.
This incident did not meet the SENI reporting criteria as it occurred outside TransGrid property and easements and did not involve electricity or network apparatus.
ELECTRICITY NETWORK PERFORMANCE REPORT 2012/13 | 17
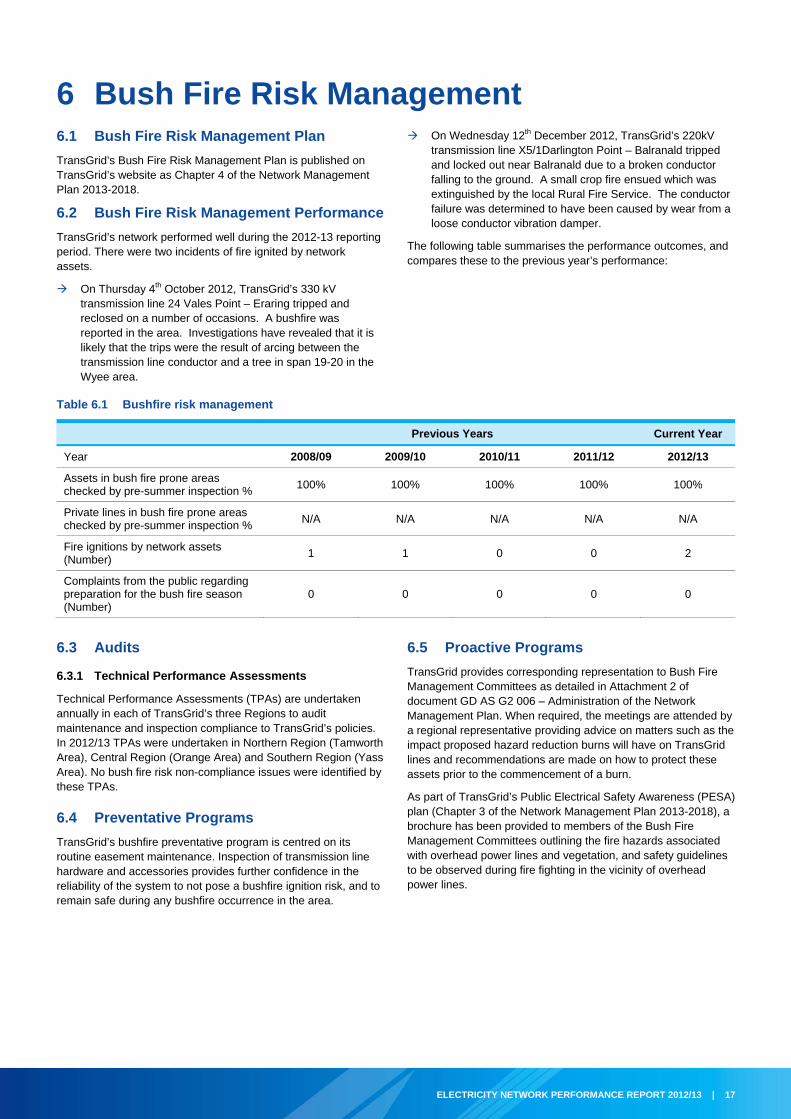
6 Bush Fire Risk Management6.1 Bush Fire Risk Management Plan TransGrid’s Bush Fire Risk Management Plan is published on TransGrid’s website as Chapter 4 of the Network Management Plan 2013-2018.
6.2 Bush Fire Risk Management Performance TransGrid’s network performed well during the 2012-13 reporting period. There were two incidents of fire ignited by network assets.
On Thursday 4th October 2012, TransGrid’s 330 kV transmission line 24 Vales Point – Eraring tripped and reclosed on a number of occasions. A bushfire was reported in the area. Investigations have revealed that it is likely that the trips were the result of arcing between the transmission line conductor and a tree in span 19-20 in the Wyee area.
On Wednesday 12th December 2012, TransGrid’s 220kV transmission line X5/1Darlington Point – Balranald tripped and locked out near Balranald due to a broken conductor falling to the ground. A small crop fire ensued which was extinguished by the local Rural Fire Service. The conductor failure was determined to have been caused by wear from a loose conductor vibration damper.
The following table summarises the performance outcomes, and compares these to the previous year’s performance:
Table 6.1 Bushfire risk management
Previous Years Current Year
Year 2008/09 2009/10 2010/11 2011/12 2012/13
Assets in bush fire prone areas checked by pre-summer inspection % 100% 100% 100% 100% 100%
Private lines in bush fire prone areas checked by pre-summer inspection % N/A N/A N/A N/A N/A
Fire ignitions by network assets (Number) 1 1 0 0 2
Complaints from the public regarding preparation for the bush fire season (Number)
0 0 0 0 0
6.3 Audits
6.3.1 Technical Performance Assessments
Technical Performance Assessments (TPAs) are undertaken annually in each of TransGrid’s three Regions to audit maintenance and inspection compliance to TransGrid’s policies. In 2012/13 TPAs were undertaken in Northern Region (Tamworth Area), Central Region (Orange Area) and Southern Region (Yass Area). No bush fire risk non-compliance issues were identified by these TPAs.
6.4 Preventative Programs TransGrid’s bushfire preventative program is centred on its routine easement maintenance. Inspection of transmission line hardware and accessories provides further confidence in the reliability of the system to not pose a bushfire ignition risk, and to remain safe during any bushfire occurrence in the area.
6.5 Proactive Programs TransGrid provides corresponding representation to Bush Fire Management Committees as detailed in Attachment 2 of document GD AS G2 006 – Administration of the Network Management Plan. When required, the meetings are attended by a regional representative providing advice on matters such as the impact proposed hazard reduction burns will have on TransGrid lines and recommendations are made on how to protect these assets prior to the commencement of a burn.
As part of TransGrid’s Public Electrical Safety Awareness (PESA) plan (Chapter 3 of the Network Management Plan 2013-2018), a brochure has been provided to members of the Bush Fire Management Committees outlining the fire hazards associated with overhead power lines and vegetation, and safety guidelines to be observed during fire fighting in the vicinity of overhead power lines.

ELECTRICITY NETWORK PERFORMANCE REPORT 2012/13 | 18
7 Public Electrical Safety Awareness TransGrid’s Public Electrical Safety Awareness Plan (PESAP) is based on a risk assessment of public safety issues with regard to TransGrid’s assets. The PESAP is made available to all employees on TransGrid’s Intranet “The Wire” and to the public via TransGrid’s external website, as Chapter 3 of the Network Management Plan 2013-2018.
The 2012/13 Action Plan for the implementation of the PESAP continued with the three specific focus areas from previous Plans: Relationship Management, Site Specific Issues and Community Interaction. Specific highlights for this year included:
Continuation of the BeSafeKidz electrical safety presentations to schools with TransGrid power lines in their property. These presentations provide basic electrical safety awareness information, as well as specific discussion relating to the power lines in the school property. In support of this, an advertisement relating to the BeSafeKidz program was placed in the 2013 Police Legacy Child Safety Handbook which is distributed throughout NSW Primary Schools.
Completion of installation of revised maximum vessel height signage for existing waterway crossings in accordance with the requirements of NSW Maritime for crossings of navigable waterways. Some old signage is due to be removed by June 2014.
The implementation of each specific strategy in the Action Plan is regularly reviewed by a working group of representatives from each Region and a report is provided to the Executive OHS Committee quarterly for review. Satisfactory progress on each strategy was noted during the 2012/13 reporting period.
In addition to regular inspections by field staff, random audits are conducted on all TransGrid substations at least once every two years by OHS Advisors to monitor safety conformance and identify any public safety issues. Identified issues are managed via reports to the relevant managers of the sites and recorded in the Issues Management System as appropriate.

ELECTRICITY NETWORK PERFORMANCE REPORT 2012/13 | 19
8 Power Line Crossings of Navigable Waterways
In accordance with Australian Standard AS 6947-2009, the crossings of navigable waterways by TransGrid infrastructure have been reviewed in conjunction with NSW Maritime and risk assessments of each crossing location have been completed.
In accordance with the NSW Maritime Power Line Crossings of Navigable Waterways Electricity Industry Code, the installation of updated signage indicating maximum allowable vessel height has been completed on a priority basis to meet the required timeframes. Crossings with existing non-compliant signage that were identified as not requiring signage due to significant crossing height will have the non-compliant signage removed by June 2014.
Table 8.1 Power Line Crossings of Navigable Waterways Summary
Existing (Number)
New (Number) Incidents (Number)
Crossings Reconstructed
(Number)
Crossings Identified as
Requiring Conversion to
Submarine Crossings (Number)
Overhead Crossings 41 0 0 01 0
Submarine Crossings 0 0 0 0 0
Note:
1. Two crossings of the Clarence River near Grafton have crossing heights that are below the expected maximum vessel height initially notified by NSW Maritime. These two crossings are by one 132kV transmission line, either side of an island in the Clarence River. Discussions have been held with NSW RMS, with the outcome being a revision of the maximum expected vessel heights to meet the 17m as marked on the new signage, with no further modification of the crossing required. RMS will update the boating maps with the revised information. A revision of this arrangement has been requested by RMS in 2018 to assess the river traffic and the suitability of the safety clearance of the crossing at that time.

ABN 19 622 755 774 Sydney 201 Elizabeth Street PO Box A1000 Sydney South NSW 1235 Australia T (02) 9284 3456 F (02) 9284 3000 www.transgrid.com.au