Embed Size (px)
Citation preview
Toronto Hydro-Electric System Limited
Anthony Haines President & CEO Toronto Hydro Corporation
Electricity Infrastructure and Economic Development in Toronto City of Toronto Economic Development Committee October 16, 2012
Toronto Hydro-Electric System Limited
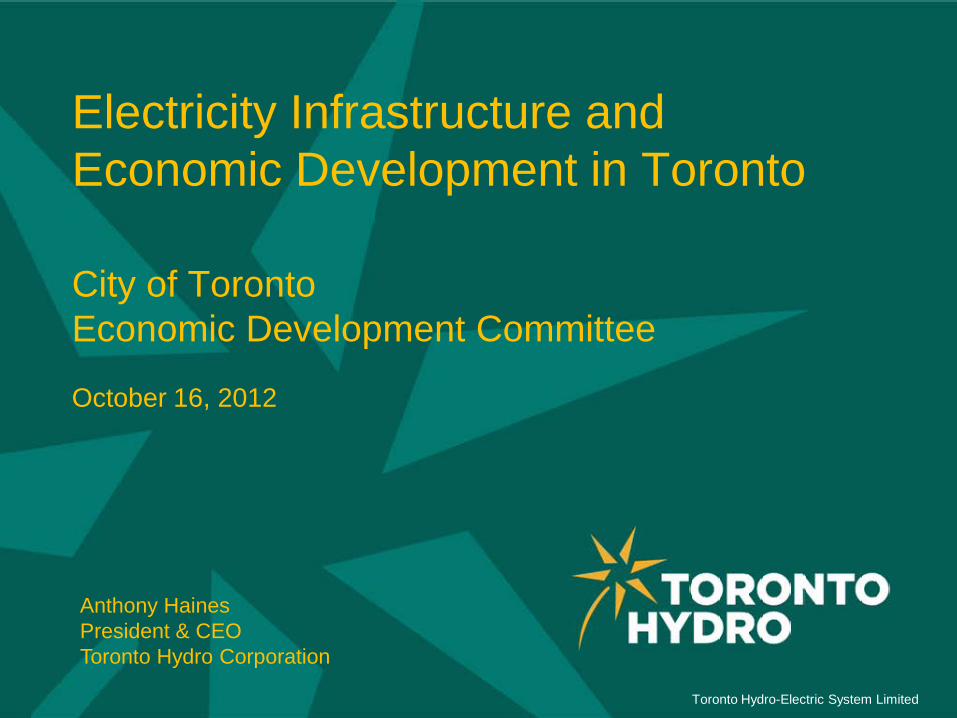
Toronto Hydro at a Glance
2 | City of Toronto - Economic Development Committee – October 16, 2012
• Over 100 years of service history
• One of the largest distribution utilities in Canada
• Approx. 712,000 customers
• Peak load of 5,000 MW
• 18% of Provincial demand
• $2.2 billion in assets
• $2.8 billion revenues
• 1,500 employees
Toronto Hydro-Electric System Limited
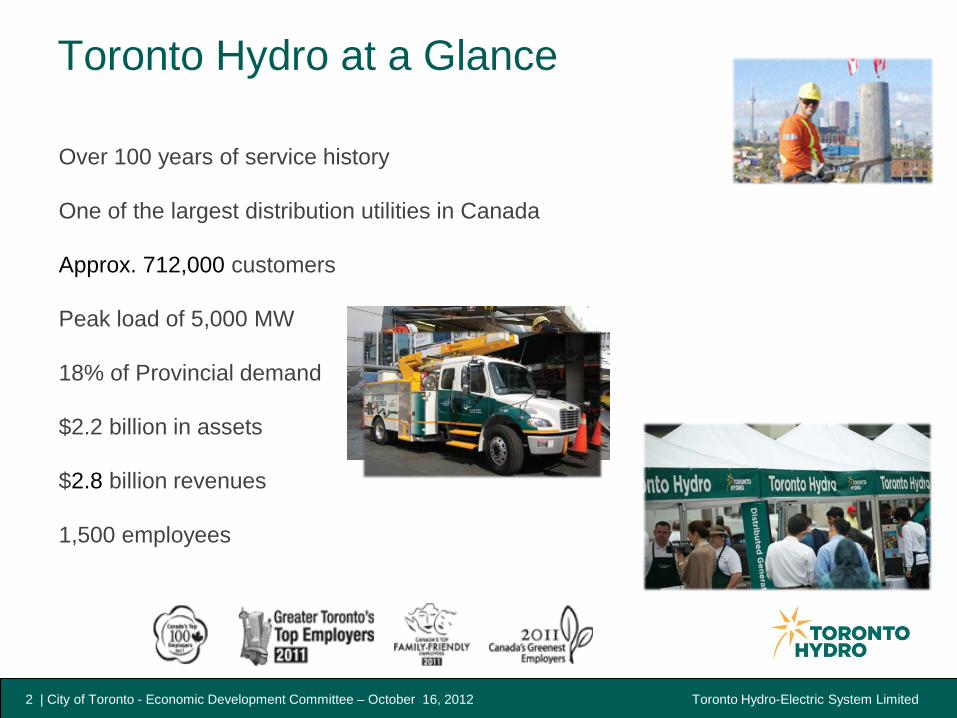
Corporate Structure
$1 Billion
Regulated by Ontario Energy Board (OEB) Local Distribution Company
Contractual Relationship with City of Toronto Owns and operates street lighting 1% of Revenue
$1.4 Billion
OEB’s Affiliate
Relationship Code
Regulated by Ontario Securities Commission Governance Financing
Shareholder Direction
Energy Services
3 | City of Toronto - Economic Development Committee – October 16, 2012
Toronto Hydro-Electric System Limited
Toronto Hydro and Economic Development
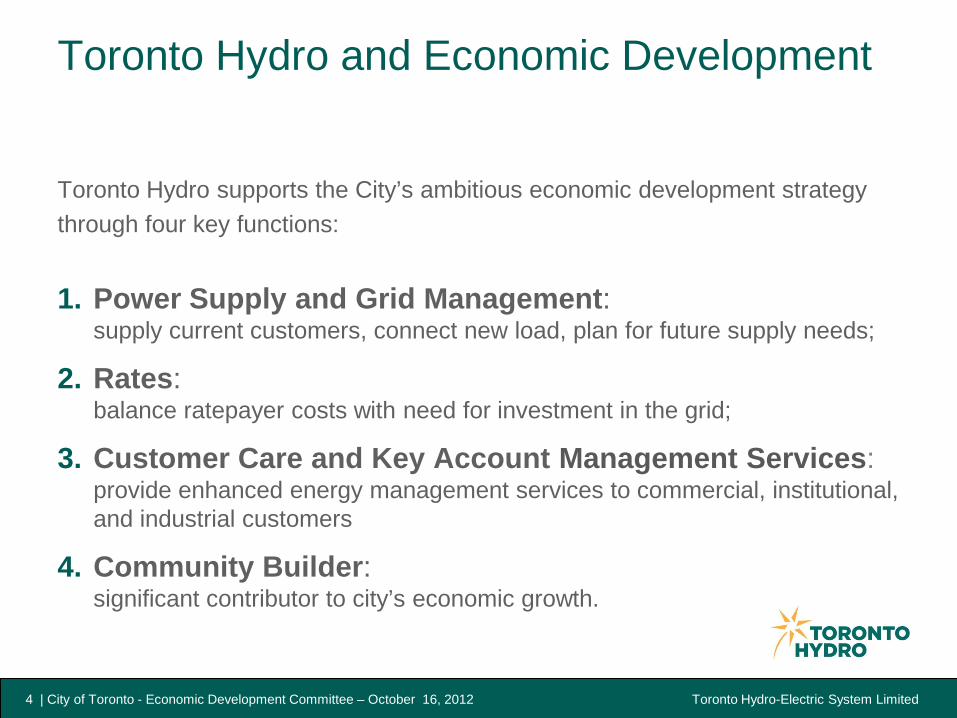
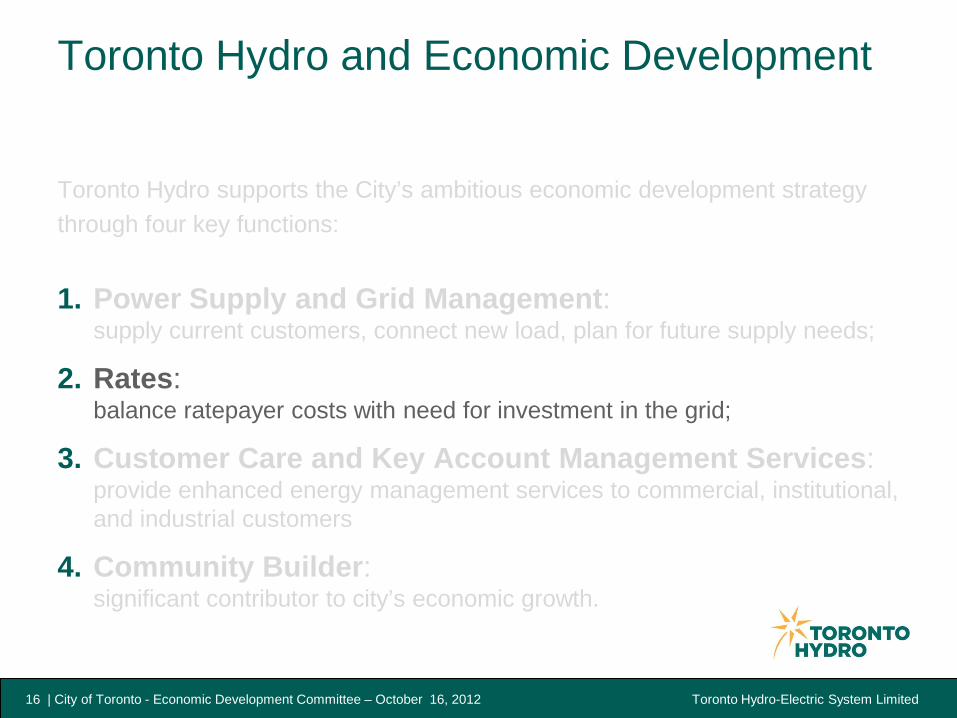
Toronto Hydro supports the City’s ambitious economic development strategy through four key functions:
1. Power Supply and Grid Management: supply current customers, connect new load, plan for future supply needs;
2. Rates: balance ratepayer costs with need for investment in the grid;
3. Customer Care and Key Account Management Services: provide enhanced energy management services to commercial, institutional, and industrial customers
4. Community Builder: significant contributor to city’s economic growth.
4 | City of Toronto - Economic Development Committee – October 16, 2012
Toronto Hydro-Electric System Limited
Toronto Hydro and Economic Development
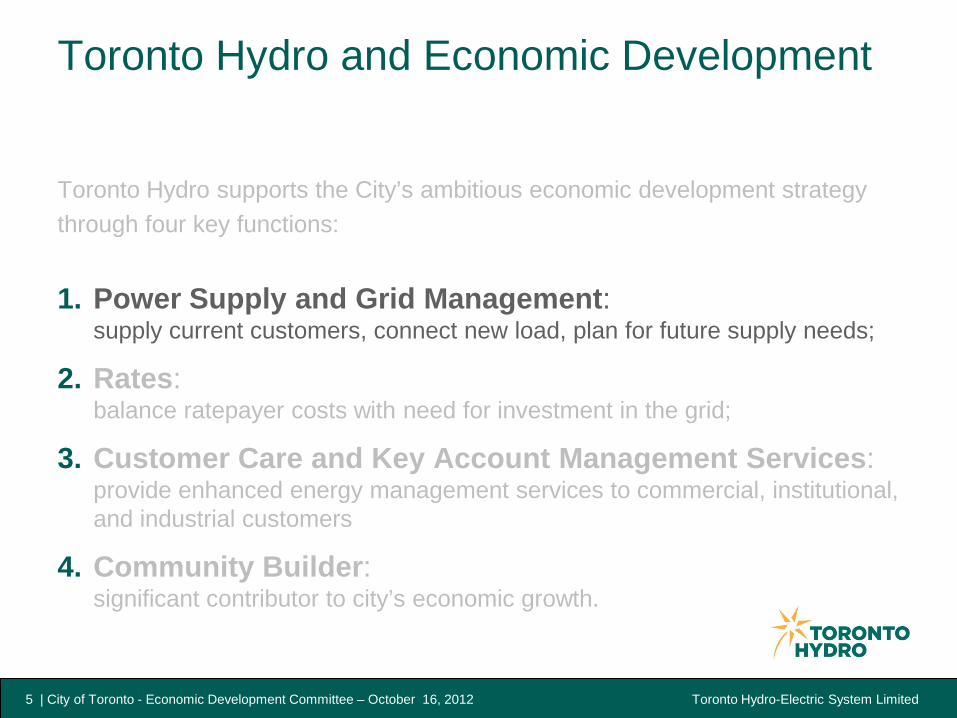
Toronto Hydro supports the City’s ambitious economic development strategy through four key functions:
1. Power Supply and Grid Management: supply current customers, connect new load, plan for future supply needs;
2. Rates: balance ratepayer costs with need for investment in the grid;
3. Customer Care and Key Account Management Services: provide enhanced energy management services to commercial, institutional, and industrial customers
4. Community Builder: significant contributor to city’s economic growth.
5 | City of Toronto - Economic Development Committee – October 16, 2012
Toronto Hydro-Electric System Limited
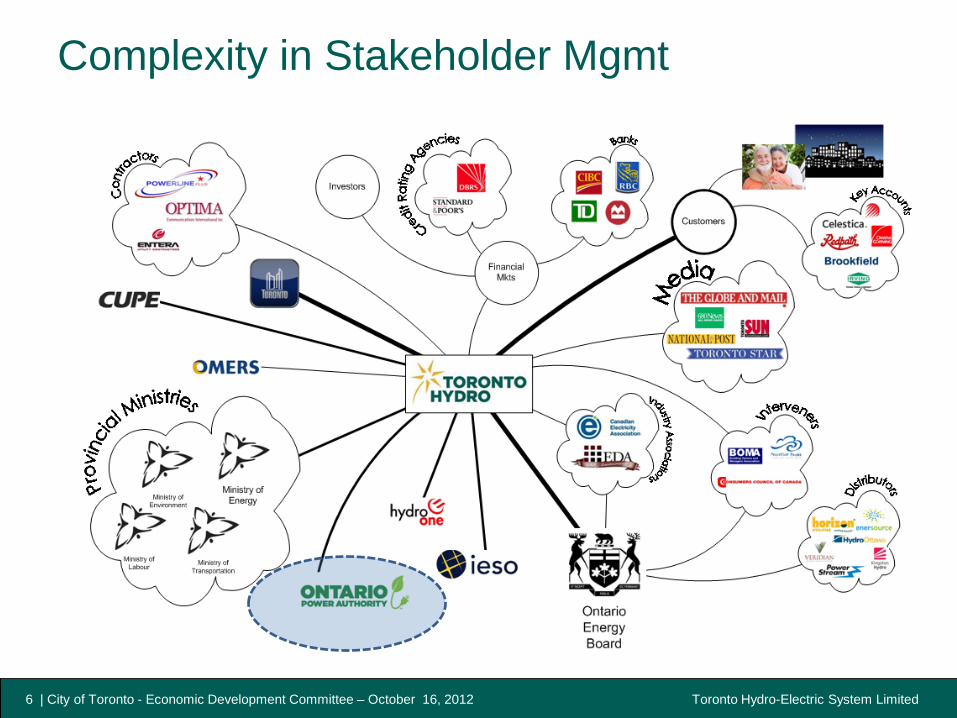
Complexity in Stakeholder Mgmt
6 | City of Toronto - Economic Development Committee – October 16, 2012
Toronto Hydro-Electric System Limited
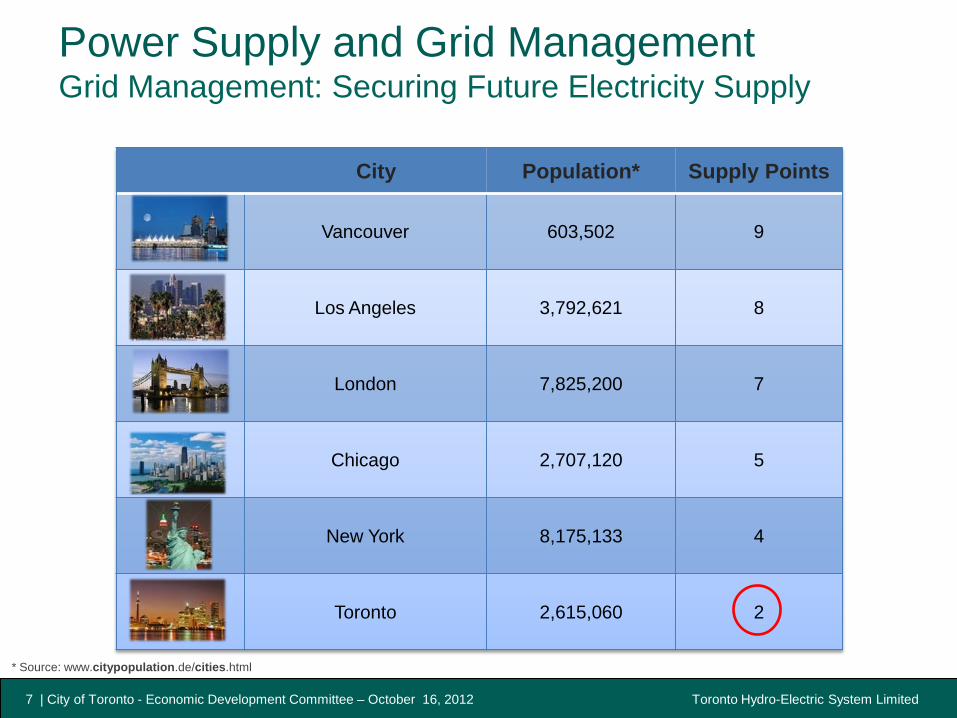
City Population* Supply Points
Vancouver 603,502 9
Los Angeles 3,792,621 8
London 7,825,200 7
Chicago 2,707,120 5
New York 8,175,133 4
Toronto 2,615,060 2
Power Supply and Grid Management Grid Management: Securing Future Electricity Supply
* Source: www.citypopulation.de/cities.html
7 | City of Toronto - Economic Development Committee – October 16, 2012
Toronto Hydro-Electric System Limited
Power Supply and Grid Management Toronto Regional Plan
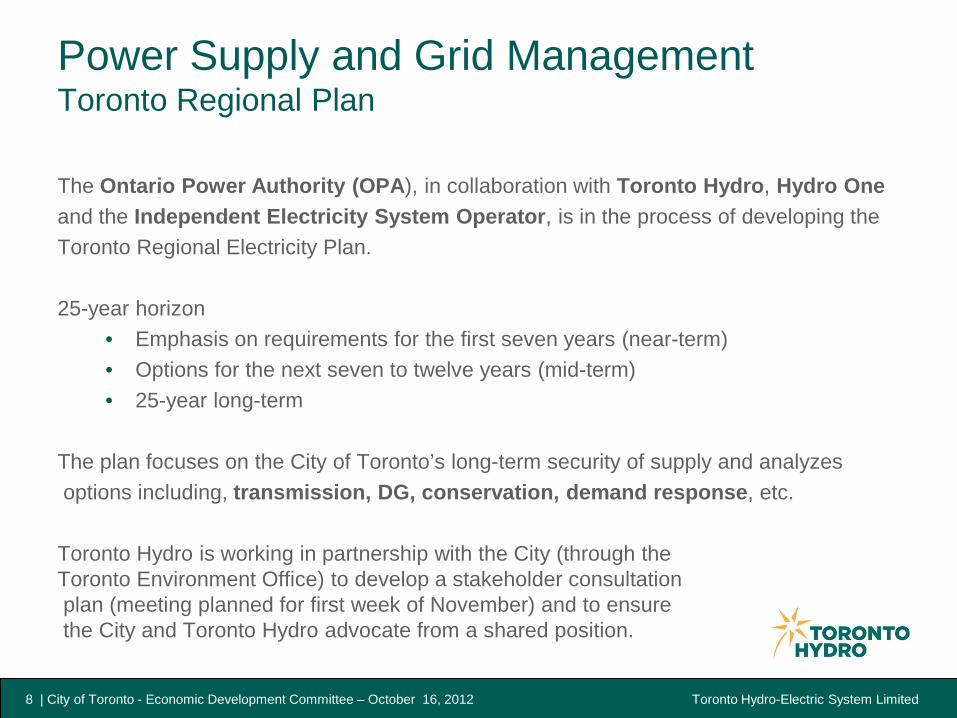
The Ontario Power Authority (OPA), in collaboration with Toronto Hydro, Hydro One and the Independent Electricity System Operator, is in the process of developing the Toronto Regional Electricity Plan. 25-year horizon
• Emphasis on requirements for the first seven years (near-term) • Options for the next seven to twelve years (mid-term) • 25-year long-term
The plan focuses on the City of Toronto’s long-term security of supply and analyzes options including, transmission, DG, conservation, demand response, etc. Toronto Hydro is working in partnership with the City (through the Toronto Environment Office) to develop a stakeholder consultation plan (meeting planned for first week of November) and to ensure the City and Toronto Hydro advocate from a shared position.
8 | City of Toronto - Economic Development Committee – October 16, 2012
Toronto Hydro-Electric System Limited
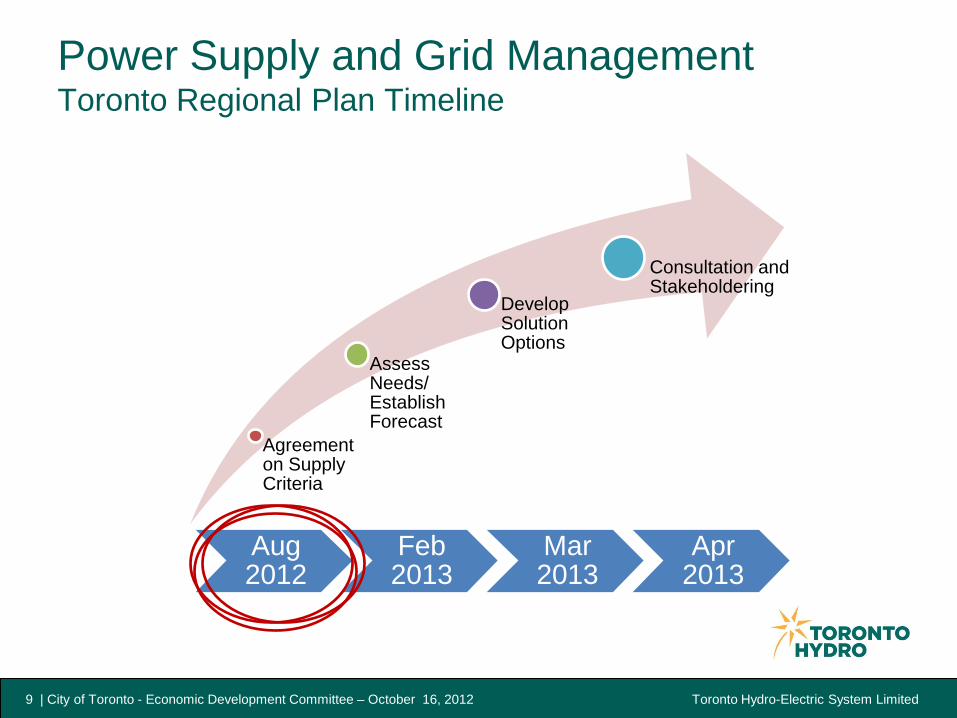
Agreement on Supply Criteria
Assess Needs/ Establish Forecast
Develop Solution Options
Consultation and Stakeholdering
Aug 2012
Feb 2013
Mar 2013
Apr 2013
Power Supply and Grid Management Toronto Regional Plan Timeline
9 | City of Toronto - Economic Development Committee – October 16, 2012
Toronto Hydro-Electric System Limited
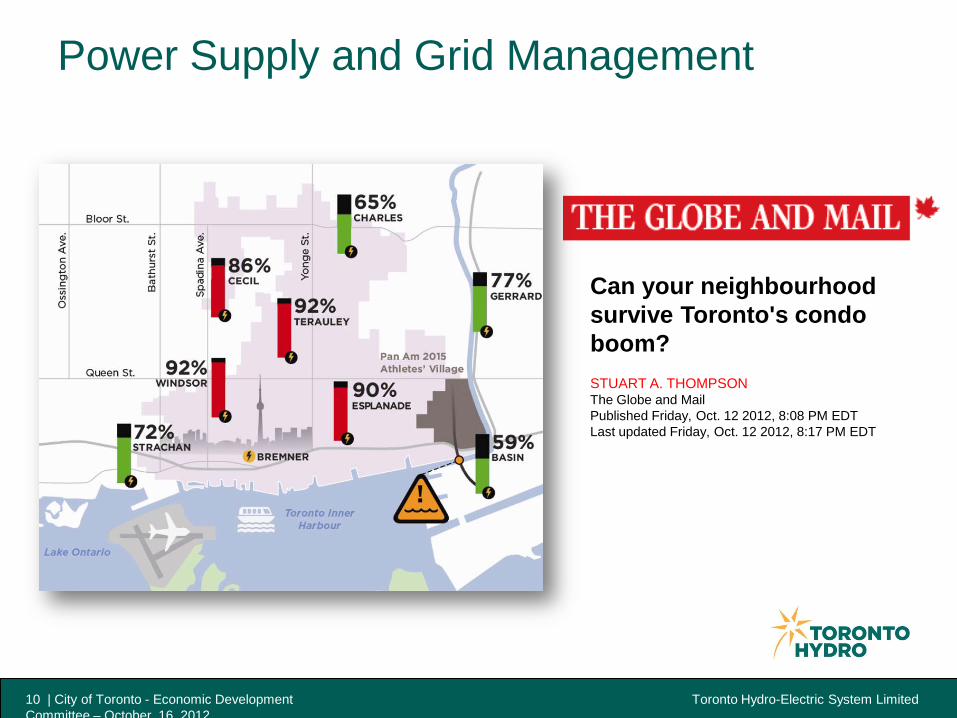
Can your neighbourhood survive Toronto's condo boom? STUART A. THOMPSON The Globe and Mail Published Friday, Oct. 12 2012, 8:08 PM EDT Last updated Friday, Oct. 12 2012, 8:17 PM EDT
Power Supply and Grid Management
10 | City of Toronto - Economic Development Committee – October 16 2012
Toronto Hydro-Electric System Limited
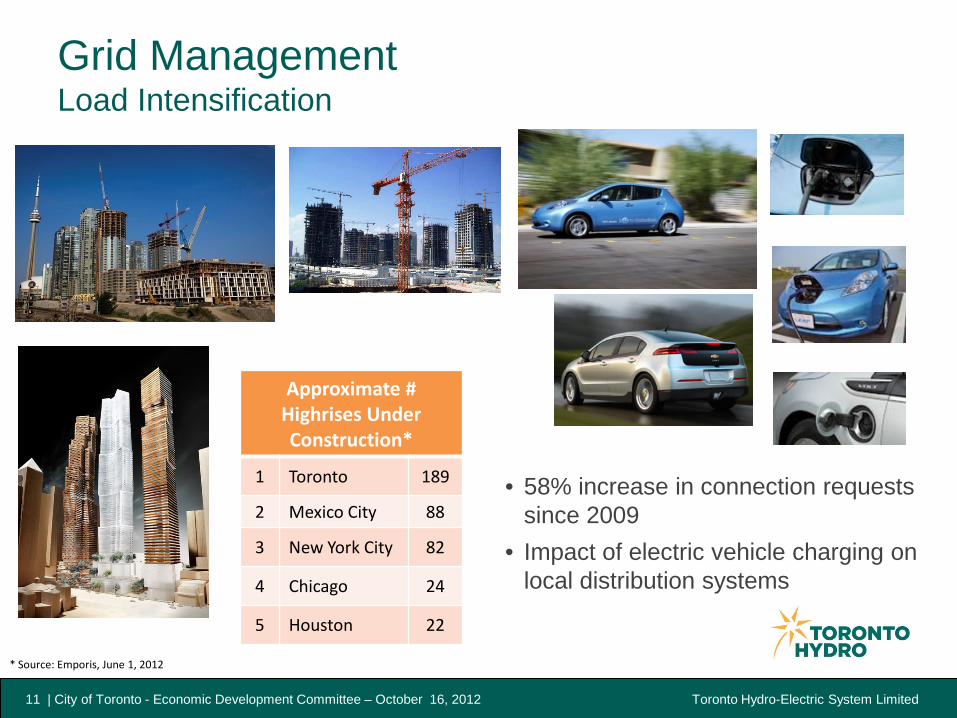
• 58% increase in connection requests since 2009
• Impact of electric vehicle charging on local distribution systems
Approximate # Highrises Under Construction*
1 Toronto 189
2 Mexico City 88
3 New York City 82
4 Chicago 24
5 Houston 22
* Source: Emporis, June 1, 2012
Grid Management Load Intensification
11 | City of Toronto - Economic Development Committee – October 16, 2012
Toronto Hydro-Electric System Limited
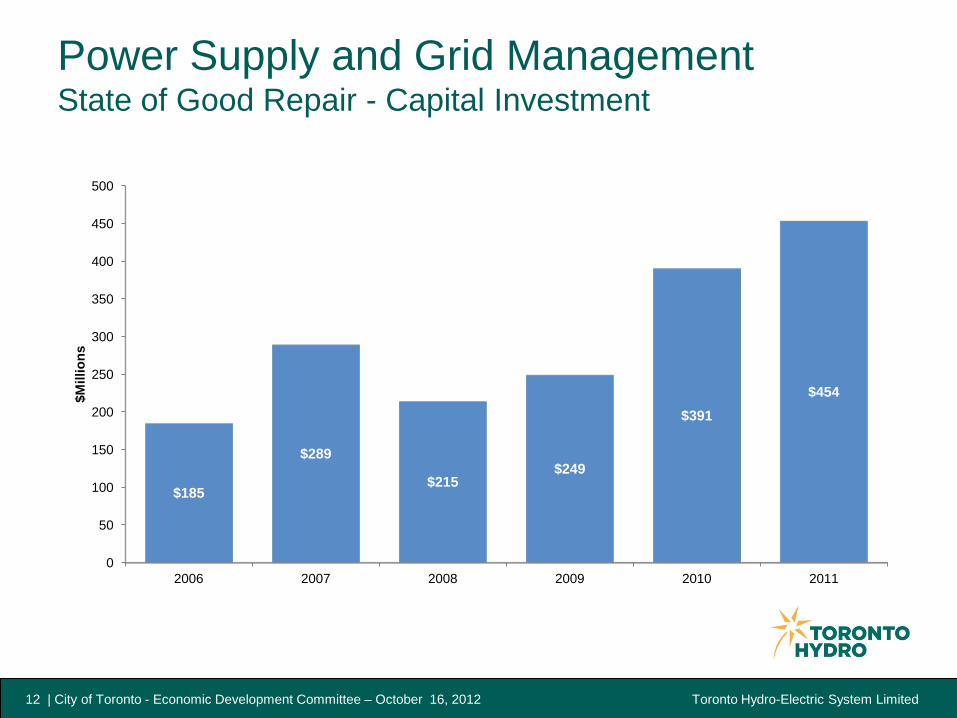
Power Supply and Grid Management State of Good Repair - Capital Investment
0
50
100
150
200
250
300
350
400
450
500
2006 2007 2008 2009 2010 2011
$185
$289
$215 $249
$391 $454 $M
illio
ns
12 | City of Toronto - Economic Development Committee – October 16, 2012
Toronto Hydro-Electric System Limited
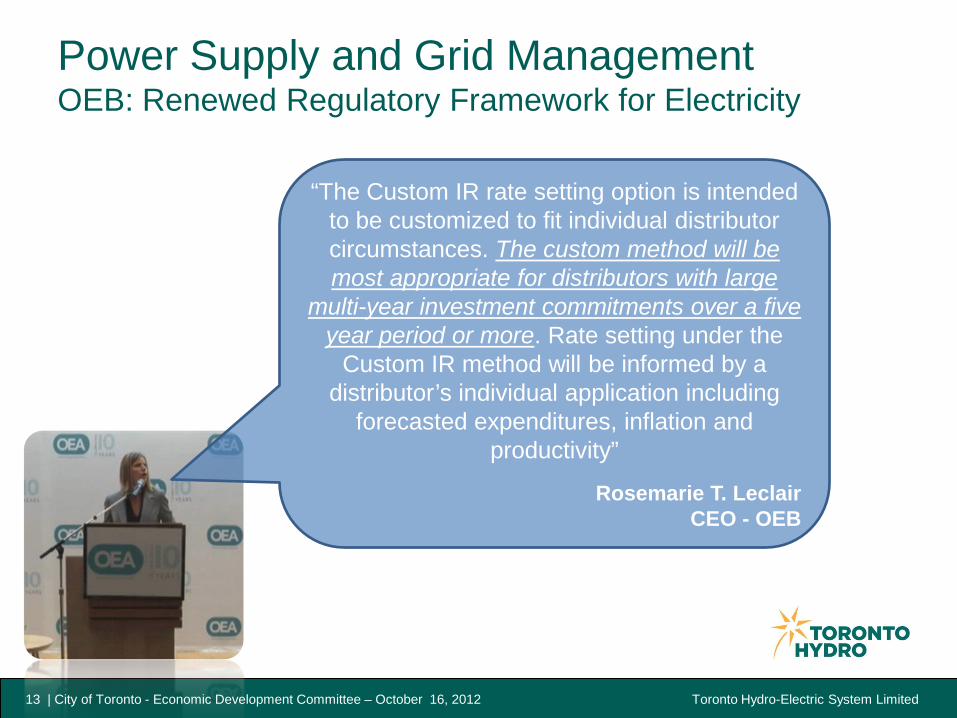
“The Custom IR rate setting option is intended to be customized to fit individual distributor circumstances. The custom method will be most appropriate for distributors with large
multi-year investment commitments over a five year period or more. Rate setting under the
Custom IR method will be informed by a distributor’s individual application including
forecasted expenditures, inflation and productivity”
Rosemarie T. Leclair CEO - OEB
Power Supply and Grid Management OEB: Renewed Regulatory Framework for Electricity
13 | City of Toronto - Economic Development Committee – October 16, 2012
Toronto Hydro-Electric System Limited
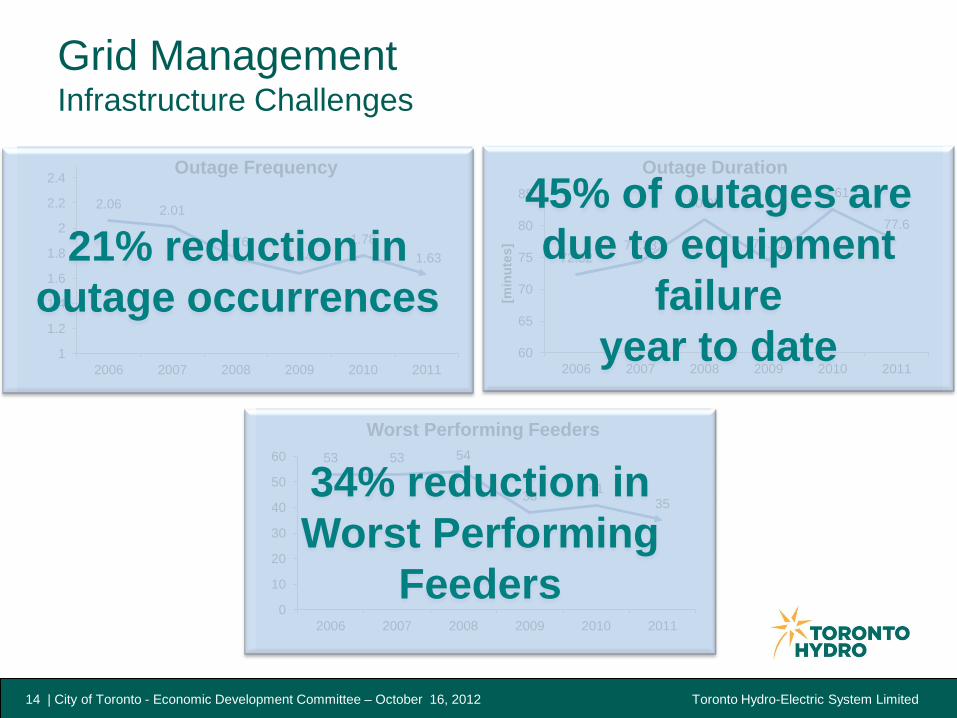
2.06 2.01
1.76 1.64
1.78 1.63
1
1.2
1.4
1.6
1.8
2
2.2
2.4
2006 2007 2008 2009 2010 2011
Outage Frequency
72.32 74.33
80.95
74.51
82.61
77.6
60
65
70
75
80
85
2006 2007 2008 2009 2010 2011
[min
utes
]
Outage Duration
53 53 54
38 41 35
0
10
20
30
40
50
60
2006 2007 2008 2009 2010 2011
Worst Performing Feeders
Grid Management Infrastructure Challenges
21% reduction in outage occurrences
45% of outages are due to equipment
failure year to date
34% reduction in Worst Performing
Feeders
14 | City of Toronto - Economic Development Committee – October 16, 2012
Toronto Hydro-Electric System Limited
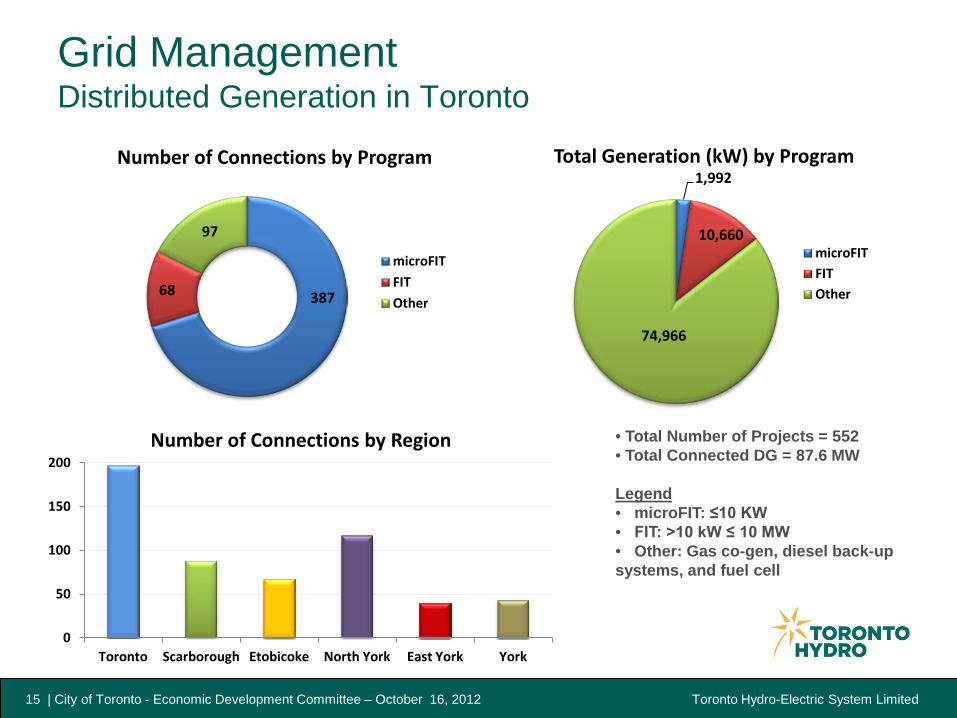
Grid Management Distributed Generation in Toronto
387 68
97
Number of Connections by Program
microFIT
FIT
Other
1,992
10,660
74,966
Total Generation (kW) by Program
microFIT FIT Other
0
50
100
150
200
Toronto Scarborough Etobicoke North York East York York
Number of Connections by Region
15 | City of Toronto - Economic Development Committee – October 16, 2012
• Total Number of Projects = 552 • Total Connected DG = 87.6 MW Legend • microFIT: ≤10 KW • FIT: >10 kW ≤ 10 MW • Other: Gas co-gen, diesel back-up systems, and fuel cell
Toronto Hydro-Electric System Limited
Toronto Hydro and Economic Development
Toronto Hydro supports the City’s ambitious economic development strategy through four key functions:
1. Power Supply and Grid Management: supply current customers, connect new load, plan for future supply needs;
2. Rates: balance ratepayer costs with need for investment in the grid;
3. Customer Care and Key Account Management Services: provide enhanced energy management services to commercial, institutional, and industrial customers
4. Community Builder: significant contributor to city’s economic growth.
16 | City of Toronto - Economic Development Committee – October 16, 2012
Toronto Hydro-Electric System Limited
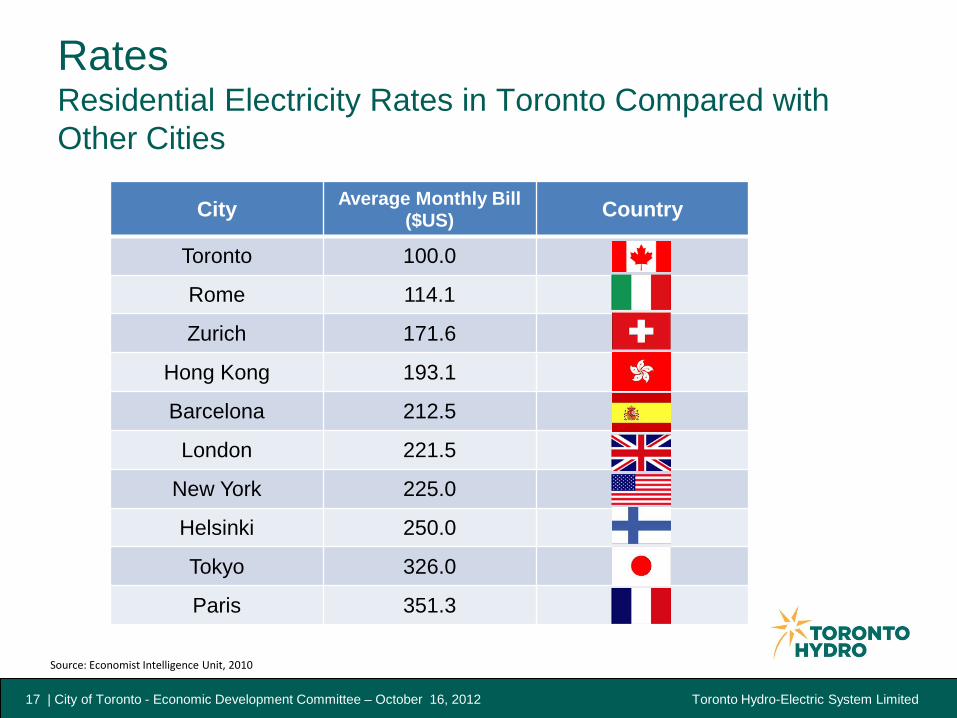
Rates Residential Electricity Rates in Toronto Compared with Other Cities
City Average Monthly Bill ($US) Country
Toronto 100.0
Rome 114.1
Zurich 171.6
Hong Kong 193.1
Barcelona 212.5
London 221.5
New York 225.0
Helsinki 250.0
Tokyo 326.0
Paris 351.3
Source: Economist Intelligence Unit, 2010
17 | City of Toronto - Economic Development Committee – October 16, 2012
Toronto Hydro-Electric System Limited
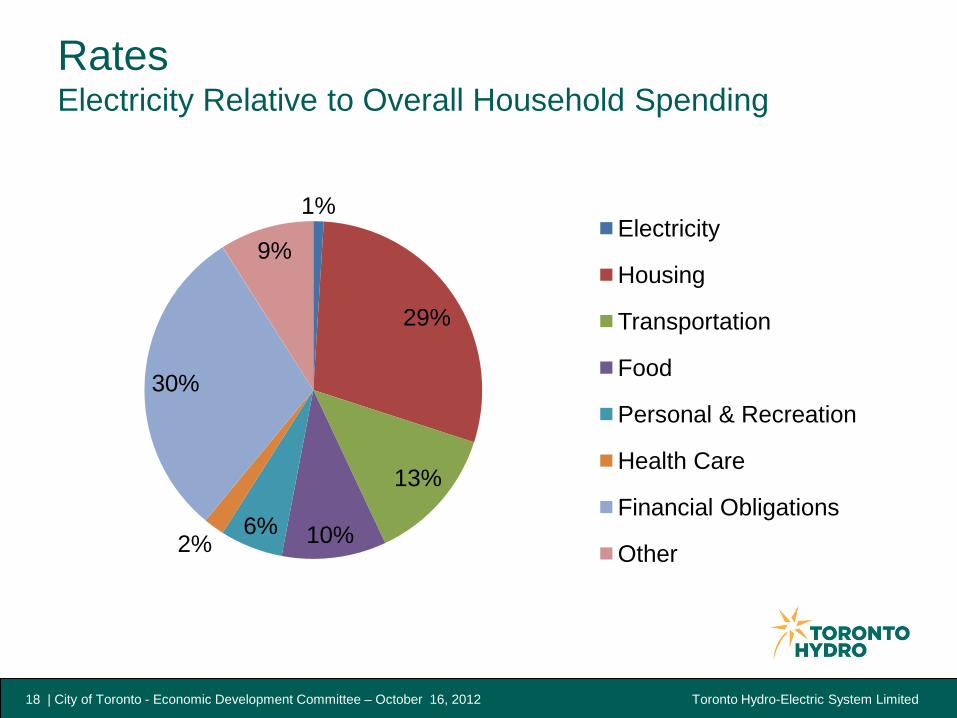
Rates Electricity Relative to Overall Household Spending
1%
29%
13%
10% 6% 2%
30%
9% Electricity
Housing
Transportation
Food
Personal & Recreation
Health Care
Financial Obligations
Other
18 | City of Toronto - Economic Development Committee – October 16, 2012
Toronto Hydro-Electric System Limited 19 | Presentation Subtitle October 16, 2012
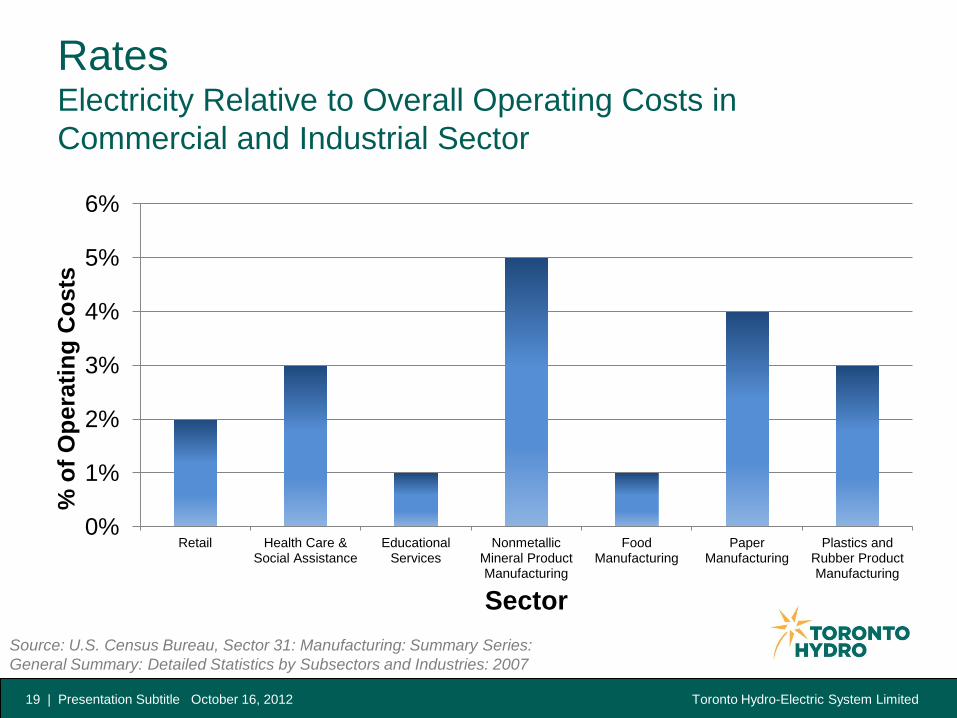
0%
1%
2%
3%
4%
5%
6%
Retail Health Care & Social Assistance
Educational Services
Nonmetallic Mineral Product Manufacturing
Food Manufacturing
Paper Manufacturing
Plastics and Rubber Product Manufacturing
% o
f Ope
ratin
g C
osts
Sector Source: U.S. Census Bureau, Sector 31: Manufacturing: Summary Series: General Summary: Detailed Statistics by Subsectors and Industries: 2007
Rates Electricity Relative to Overall Operating Costs in Commercial and Industrial Sector
Toronto Hydro-Electric System Limited
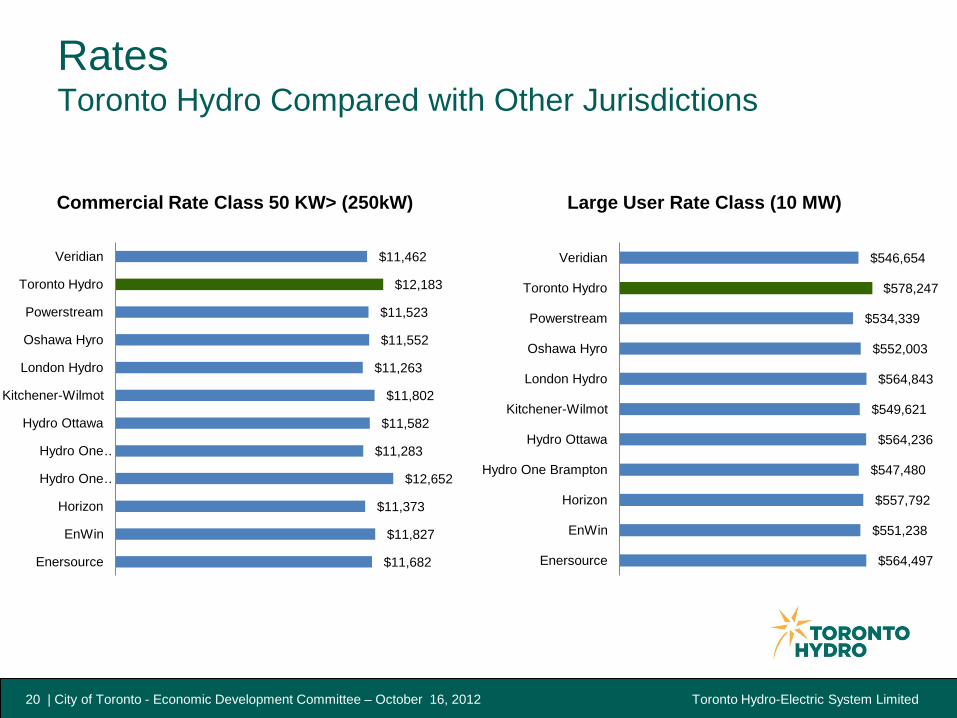
Rates Toronto Hydro Compared with Other Jurisdictions
20 | City of Toronto - Economic Development Committee – October 16, 2012
$564,497
$551,238
$557,792
$547,480
$564,236
$549,621
$564,843
$552,003
$534,339
$578,247
$546,654
Enersource
EnWin
Horizon
Hydro One Brampton
Hydro Ottawa
Kitchener-Wilmot
London Hydro
Oshawa Hyro
Powerstream
Toronto Hydro
Veridian
Large User Rate Class (10 MW)
$11,682
$11,827
$11,373
$12,652
$11,283
$11,582
$11,802
$11,263
$11,552
$11,523
$12,183
$11,462
Enersource
EnWin
Horizon
Hydro One …
Hydro One …
Hydro Ottawa
Kitchener-Wilmot
London Hydro
Oshawa Hyro
Powerstream
Toronto Hydro
Veridian
Commercial Rate Class 50 KW> (250kW)
Toronto Hydro-Electric System Limited
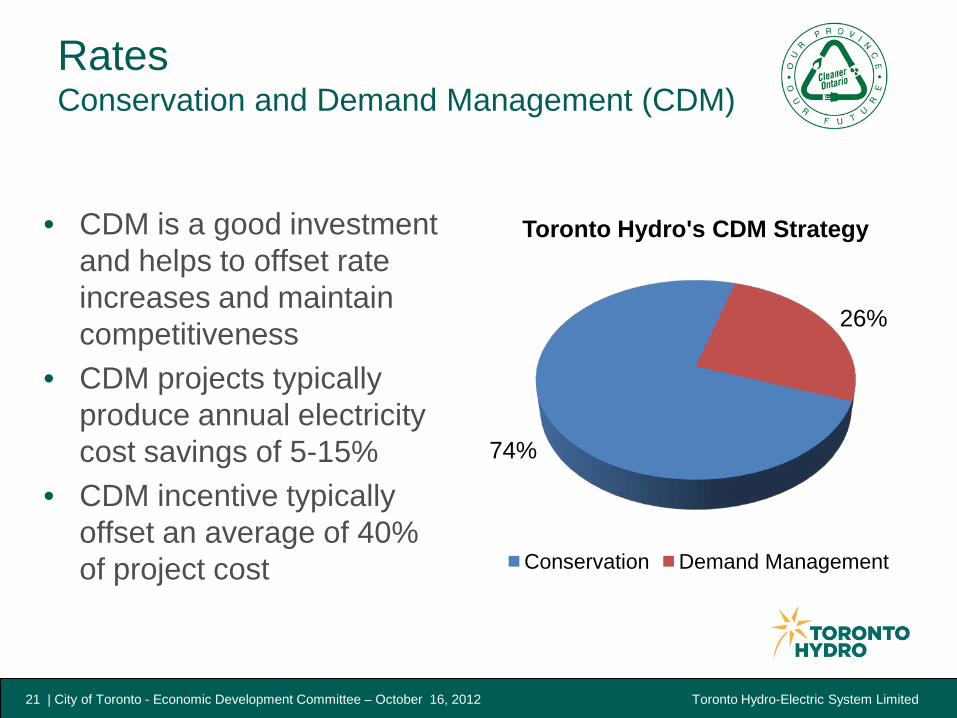
• CDM is a good investment and helps to offset rate increases and maintain competitiveness
• CDM projects typically produce annual electricity cost savings of 5-15%
• CDM incentive typically offset an average of 40% of project cost
74%
26%
Toronto Hydro's CDM Strategy
Conservation Demand Management
21 | City of Toronto - Economic Development Committee – October 16, 2012
Rates Conservation and Demand Management (CDM)
Toronto Hydro-Electric System Limited
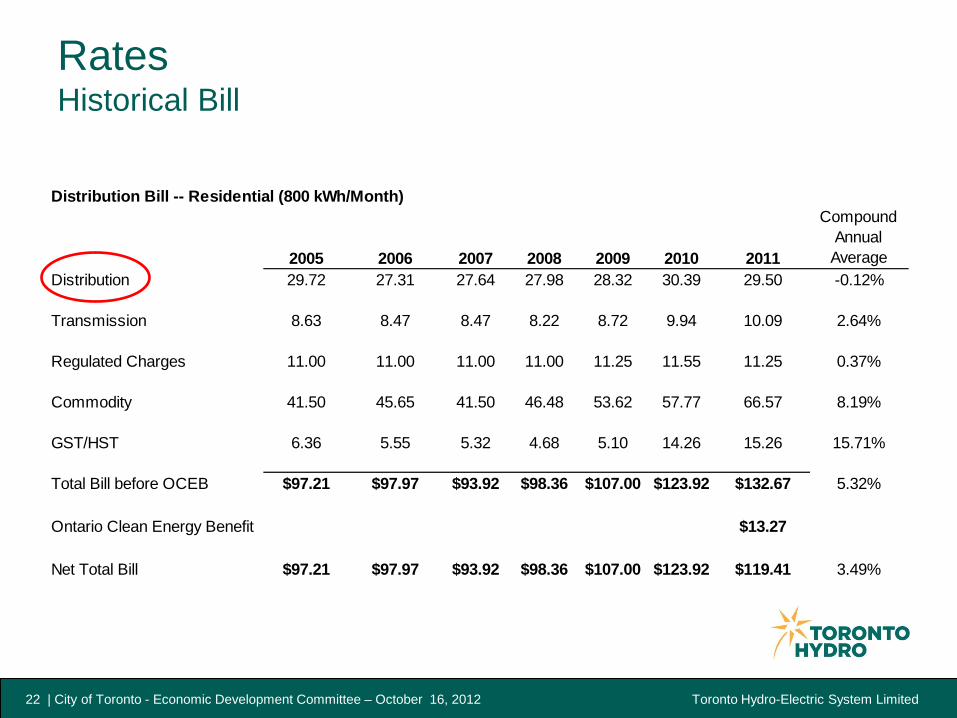
Rates Historical Bill
Distribution Bill -- Residential (800 kWh/Month)
2005 2006 2007 2008 2009 2010 2011
Compound Annual Average
Distribution 29.72 27.31 27.64 27.98 28.32 30.39 29.50 -0.12%
Transmission 8.63 8.47 8.47 8.22 8.72 9.94 10.09 2.64%
Regulated Charges 11.00 11.00 11.00 11.00 11.25 11.55 11.25 0.37%
Commodity 41.50 45.65 41.50 46.48 53.62 57.77 66.57 8.19%
GST/HST 6.36 5.55 5.32 4.68 5.10 14.26 15.26 15.71%
Total Bill before OCEB $97.21 $97.97 $93.92 $98.36 $107.00 $123.92 $132.67 5.32%
Ontario Clean Energy Benefit $13.27
Net Total Bill $97.21 $97.97 $93.92 $98.36 $107.00 $123.92 $119.41 3.49%
22 | City of Toronto - Economic Development Committee – October 16, 2012
Toronto Hydro-Electric System Limited
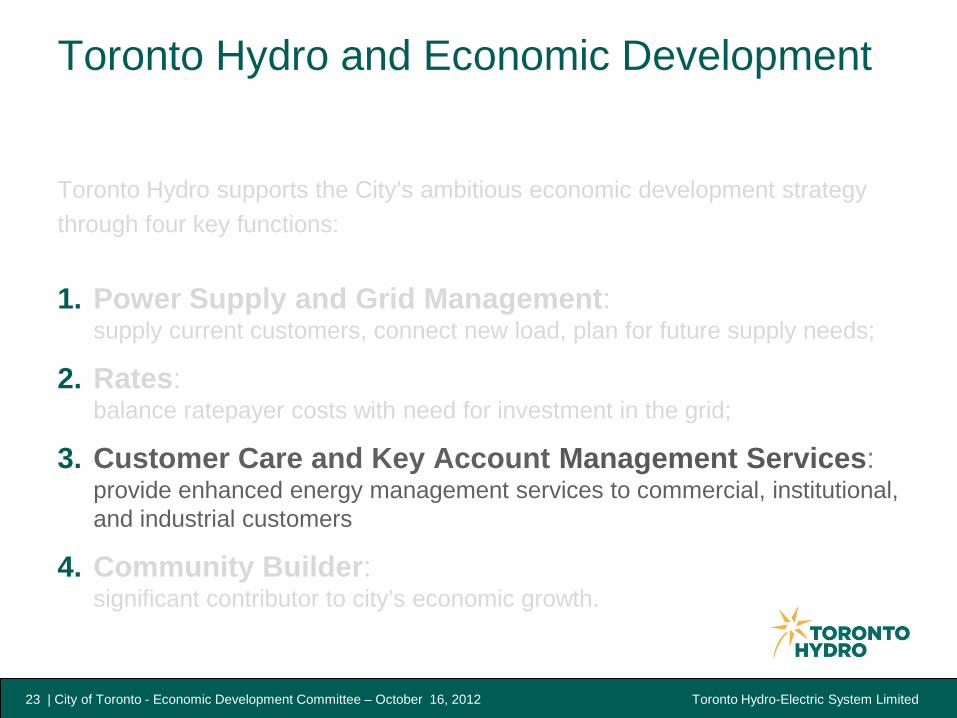
Toronto Hydro and Economic Development
Toronto Hydro supports the City’s ambitious economic development strategy through four key functions:
1. Power Supply and Grid Management: supply current customers, connect new load, plan for future supply needs;
2. Rates: balance ratepayer costs with need for investment in the grid;
3. Customer Care and Key Account Management Services: provide enhanced energy management services to commercial, institutional, and industrial customers
4. Community Builder: significant contributor to city’s economic growth.
23 | City of Toronto - Economic Development Committee – October 16, 2012
Toronto Hydro-Electric System Limited
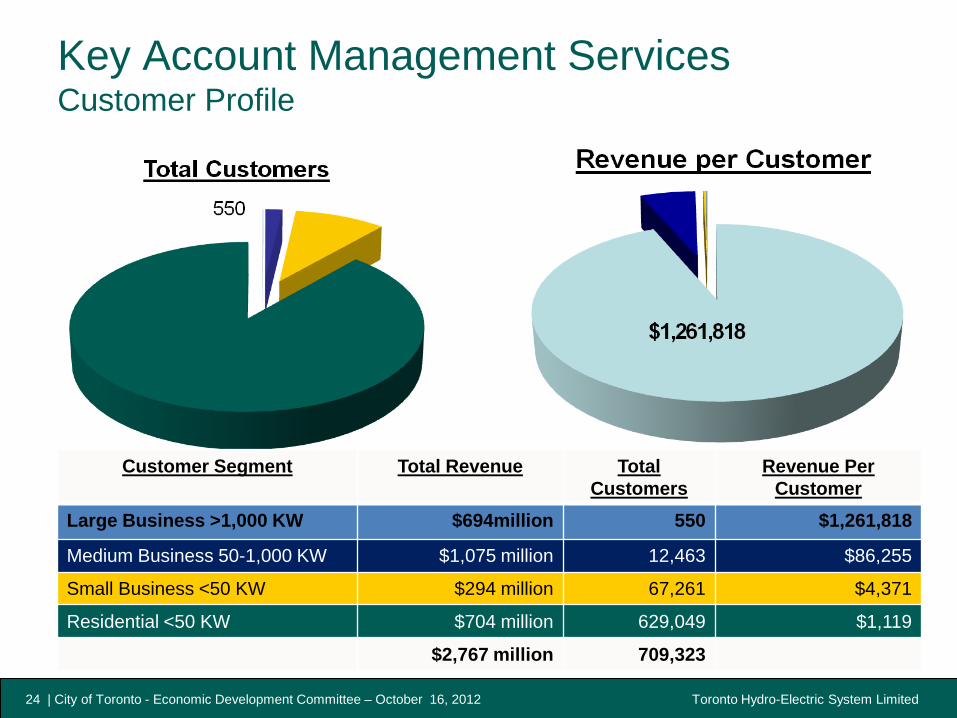
Key Account Management Services Customer Profile
Customer Segment Total Revenue Total Customers
Revenue Per Customer
Large Business >1,000 KW $694million 550 $1,261,818
Medium Business 50-1,000 KW $1,075 million 12,463 $86,255
Small Business <50 KW $294 million 67,261 $4,371
Residential <50 KW $704 million 629,049 $1,119
$2,767 million 709,323
24 | City of Toronto - Economic Development Committee – October 16, 2012
Toronto Hydro-Electric System Limited
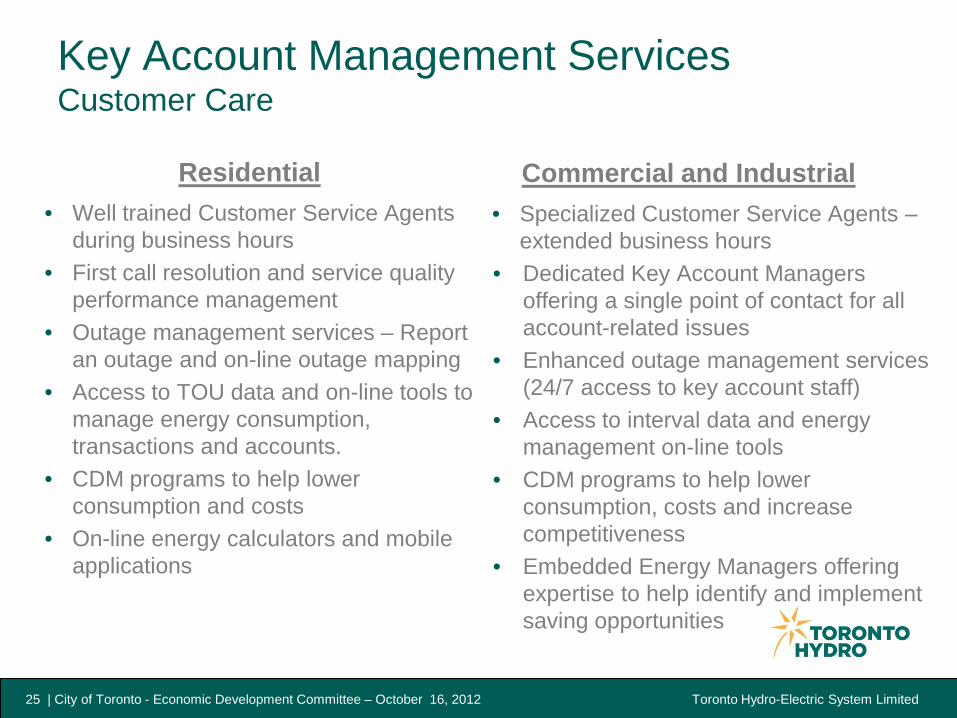
Commercial and Industrial
• Specialized Customer Service Agents – extended business hours • Dedicated Key Account Managers
offering a single point of contact for all account-related issues
• Enhanced outage management services (24/7 access to key account staff)
• Access to interval data and energy management on-line tools
• CDM programs to help lower consumption, costs and increase competitiveness
• Embedded Energy Managers offering expertise to help identify and implement saving opportunities
Residential
• Well trained Customer Service Agents during business hours
• First call resolution and service quality performance management
• Outage management services – Report an outage and on-line outage mapping
• Access to TOU data and on-line tools to manage energy consumption, transactions and accounts.
• CDM programs to help lower consumption and costs
• On-line energy calculators and mobile applications
Key Account Management Services Customer Care
25 | City of Toronto - Economic Development Committee – October 16, 2012
Toronto Hydro-Electric System Limited
Toronto Hydro and Economic Development
Toronto Hydro supports the City’s ambitious economic development strategy through four key functions:
1. Power Supply and Grid Management: supply current customers, connect new load, plan for future supply needs;
2. Rates: balance ratepayer costs with need for investment in the grid;
3. Customer Care and Key Account Management Services: provide enhanced energy management services to commercial, institutional, and industrial customers
4. Community Builder: significant contributor to city’s economic growth.
26 | City of Toronto - Economic Development Committee – October 16, 2012
Toronto Hydro-Electric System Limited
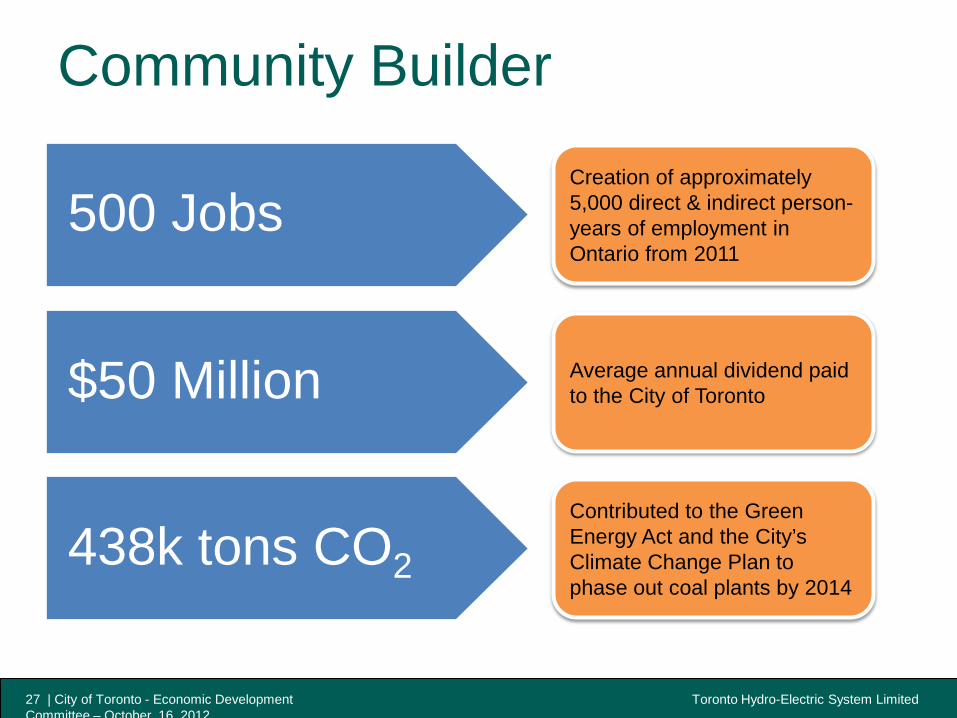
Community Builder
27 | City of Toronto - Economic Development Committee – October 16 2012
500 Jobs
$50 Million
438k tons CO2
Creation of approximately 5,000 direct & indirect person-years of employment in Ontario from 2011
Average annual dividend paid to the City of Toronto
Contributed to the Green Energy Act and the City’s Climate Change Plan to phase out coal plants by 2014

Toronto Hydro-Electric System Limited
Thank You
28 | City of Toronto - Economic Development Committee – October 16, 2012
Toronto Hydro-Electric System Limited
Disclaimer The information in these materials is based on information currently available to Toronto Hydro Corporation and its affiliates
(together hereinafter referred to as “Toronto Hydro”), and is provided for information purposes only. Toronto Hydro does not warrant the accuracy, reliability, completeness or timeliness of the information and undertakes no obligation to revise or update these materials. Toronto Hydro (including its directors, officers, employees, agents and subcontractors) hereby waives any and all liability for damages of whatever kind and nature which may occur or be suffered as a result of the use of these materials or reliance on the information therein. These materials may also contain forward-looking information within the meaning of applicable securities laws in Canada ("Forward-Looking Information"). The purpose of the Forward-Looking Information is to provide Toronto Hydro’s expectations about future results of operations, performance, business prospects and opportunities and may not be appropriate for other purposes. All Forward-Looking Information is given pursuant to the "safe harbour" provisions of applicable Canadian securities legislation. The words "anticipates", "believes", "budgets", "could", "estimates", "expects", "forecasts", "intends", "may", "might", "plans", "projects", "schedule", "should", "will", "would" and similar expressions are often intended to identify Forward-Looking Information, although not all Forward-Looking Information contains these identifying words. The Forward-Looking Information reflects the current beliefs of, and is based on information currently available to, Toronto Hydro’s management. The Forward-Looking Information in these materials includes, but is not limited to, statements regarding Toronto Hydro’s future results of operations, performance, business prospects and opportunities. The statements that make up the Forward-Looking Information are based on assumptions that include, but are not limited to, the future course of the economy and financial markets, the receipt of applicable regulatory approvals and requested rate orders, the receipt of favourable judgments, the level of interest rates, Toronto Hydro’s ability to borrow, and the fair market value of Toronto Hydro’s investments. The Forward-Looking Information is subject to risks, uncertainties and other factors that could cause actual results to differ materially from historical results or results anticipated by the Forward-Looking Information. The factors which could cause results or events to differ from current expectations include, but are not limited to, the timing and amount of future cash flows generated by Toronto Hydro's investments, market liquidity and the quality of the underlying assets and financial instruments, the timing and extent of changes in prevailing interest rates, inflation levels, legislative, judicial and regulatory developments that could affect revenues, and the results of borrowing efforts. Toronto Hydro cautions that this list of factors is not exclusive. All Forward-Looking Information in these materials is qualified in its entirety by the above cautionary statements and, except as required by law, Toronto Hydro undertakes no obligation to revise or update any Forward-Looking Information as a result of new information, future events or otherwise after the date hereof.
29 | City of Toronto - Economic Development Committee – October 16, 2012