Embed Size (px)
Citation preview

EE

Electricity generation major projects
November 2015

Department of Industry, Innovation and Science (2015), Electricity generation major projects,
Canberra, November.
Further information
For more information or to comment on this publication please contact:
Allison Ball
Manager, Energy Statistics
Office of the Chief Economist
Department of Industry, Innovation and Science
GPO Box 9839
CANBERRA ACT 2601
Email: [email protected]
Web: www.industry.gov.au/oce
Project Team
Caitlin McCluskey
Christian Tisdell
Acknowledgements
The authors would like to express their appreciation for the assistance and support provided by
colleagues in the Department of Industry, Innovation and Science, the Clean Energy Regulator,
representatives from various state and territory government agencies, and the companies involved in
the projects listed in this report.
The views expressed in this publication are those of the authors and do not necessarily reflect those
of the Australian Government or the Department of Industry, Innovation and Science.
© Commonwealth of Australia 2015
ISSN (Online): 2204-2172
This work is copyright. Apart from use under Copyright Act 1968, no part may be reproduced or
altered by any process without prior written permission from the Australian Government. Requests
and inquiries concerning reproduction and rights should be addressed to
[email protected]. For more information on Office of the Chief Economist publications
please access the Department’s website at: www.industry.gov.au/OCE
Creative Commons Licence
With the exception of the Coat of Arms, this publication is licensed under a Creative Commons
Attribution 3.0 Australia Licence.
Creative Commons Attribution 3.0 Australia Licence is a standard form license agreement that
allows you to copy, distribute, transmit and adapt this publication provided that you attribute the
work. A summary of the licence terms is available from
http://creativecommons.org/licenses/by/3.0/au/deed.en. The full licence terms are available from
http://creativecommons.org/licenses/by/3.0/au/legalcode.
The Commonwealth’s preference is that you attribute this publication (and any material sourced from
it) using the following wording:
Source: Licensed from the Commonwealth of Australia under a Creative Commons Attribution 3.0
Australia Licence. The Commonwealth of Australia does not necessarily endorse the content of this
publication.

Electricity generation major projects November 2015
2
Foreword
This annual publication provides a summary of electricity generation projects
under consideration or development in Australia.
Investment in new electricity generation capacity is constrained by the current
overcapacity in the market and weak expectations for demand growth in
electricity from the grid. In the medium term demand is expected to remain
subdued, and some existing capacity to be decommissioned. Projects under
development are mainly being driven by the need to refurbish or replace existing
plants, local demand, and government incentives to drive innovation and
decarbonise the electricity market.
Project proponents surveyed noted renewed optimism and increased certainty in
the sector, compared with this time last year, following recent announcements
confirming the target for the Renewable Energy Target (RET).
As of 31 October 2015, there are 18 committed projects around Australia, all
using renewable energy sources. The additional planned capacity of these
projects totals 3 747 megawatts, equivalent to 6 per cent of existing installed
capacity in Australia, with an estimated capital expenditure of $5.5 billion. The
proposed new generation capacity is likely to be sufficient to meet requirements
going forward.
Mark Cully
Chief Economist
Department of Industry, Innovation and Science
November 2015
Electricity generation major projects November 2015
3
Contents
Foreword 2
Figures 4
Tables 4
1. Executive summary 6
1.1 Factors affecting investment 6
1.2 Current investment pipeline 6
2. About the Electricity Generation Major Projects Report 9
2.1 Project classification 10
3. Investment in electricity generation in Australia 12
3.1 Current electricity generation and investment trends 12
3.2 Factors affecting decisions to invest 16
Electricity demand 16
Surplus capacity 18
Electricity prices 19
Power purchase agreements 20
Government policies 20
Emerging technologies 21
4. Projects at the Completed Stage 22
5. Projects at the Committed Stage 23
5.1 Solar Projects 26
5.2 Wind Projects 26
5.3 Hydro projects 26
6. Projects at the Feasibility Stage 27
6.1 Non-renewable electricity projects 28
6.2 Renewable electricity projects 29
7. Projects at the Publicly Announced Stage 30
7.1 Non-renewable electricity projects 30
7.2 Renewable electricity projects 31
References 32

Electricity generation major projects November 2015
4
Figures
Figure 1.1: Investment pipeline for new capacity, by fuel type and by year of expected start
up, as at October 2015 7
Figure 1.2: Number and nominal value of projects at the Committed Stage 7
Figure 2.1: The stages of the investment pipeline 10
Figure 3.1: Electricity generation, by fuel type 13
Figure 3.2: Electricity generation by fuel type, and by state and territory, 2013–14 14
Figure 3.3: Cumulative solar PV installations 14
Figure 3.4: Annual investment in registered capacity 15
Figure 3.5: Australia’s electricity consumption, by region 17
Figure 5.1: Electricity generation projects, Committed Stage, October 2015 25
Figure 5.2: Additional capacity by location and by energy source, Committed Stage, as at
October 2015 25
Figure 6.1: Additional capacity by location and by energy source, Feasibility Stage, as at
October 2015 28
Figure 7.1: Additional capacity by location and by energy source, Publicly Announced Stage,
as at October 2015 31
Tables
Table 1.1: Summary of projects in the investment pipeline, as at October 2015 8
Table 3.1: Australia’s electricity consumption, by region 18
Table 4.1: Major electricity projects, Completed Stage, as at October 2015 22
Table 5.1: Major electricity projects, Committed Stage, as at October 2015 23
Table 5.2: Major electricity projects investment pipeline, by region, as at October 2015 24
Table 6.1: Major electricity projects, Feasibility Stage, as at October 2015 27
Table 7.1: Major electricity projects, Publicly Announced Stage, as at October 2015 30

Electricity generation major projects November 2015
5
Major Projects List
The major projects list in Excel format is located on the Department of Industry,
Innovation and Science website, http://www.industry.gov.au/Office-of-the-Chief-
Economist/Publications/Pages/Major-electricity-generation-projects.aspx
Abbreviations and acronyms
ACCC Australian Competition and Consumer Commission
AEMO Australian Energy Market Operator
AES Australian Energy Statistics
ARENA Australian Renewable Energy Agency
CER Clean Energy Regulator
ESAA Energy Supply Association of Australia
ESOO Electricity Statement of Opportunities
FID Final Investment Decision
IMOWA Independent Market Operator of Western Australia
MW Megawatts
NEM National Electricity Market
NWIS North-West Interconnected System
PPA Power Purchase Agreement
PV Photovoltaic
RET Renewable Energy Target
SWIS South-West Interconnected System
WEM Wholesale Energy Market, Western Australia

Electricity generation major projects November 2015
6
1. Executive summary
1.1 Factors affecting investment
Since 2010–11 demand for electricity has fallen, resulting in overcapacity in
the market, lower wholesale electricity prices, and less ability to finance
projects. Growth in distributed generation, particularly rooftop solar
photovoltaics (PV), plant closures by large scale industrial users, and
energy efficiency improvements have contributed to this aggregated
demand decrease.
Anecdotal evidence suggests that there is difficulty in securing long term
PPAs, affecting the ability of project proponents to have certainty in the
return on their investments.
Maximum demand for electricity is projected to increase, helping to drive
some demand for electricity generation, particularly peaking plants.
Policy incentives such as the Renewable Energy Target (RET), funding
from the Australian Renewable Energy Agency (ARENA), and some state
schemes continue to drive some investment in this subdued climate.
Project proponents surveyed reported that government announcements
confirming the target for the RET earlier this year had improved the
environment for investment.
1.2 Current investment pipeline
There are 133 projects in the investment pipeline, including those
completed since October 2014, with a combined disclosed value of
$42 billion and 28 968 megawatts of planned capacity (Figure 1.1, Table
1.1).
This is expected to be sufficient to meet requirements when investment
conditions become more favourable and extra capacity is required.
The portfolio of new capacity in the investment pipeline, as reported by
project proponents and gathered from publicly available sources, includes:
- three projects at the Completed Stage worth $936 million with
320 megawatts of additional capacity;
- 18 projects at the Committed Stage worth $5.5 billion with
3 747 megawatts of planned capacity (Figure 1.2);
- 85 projects at the Feasibility Stage that have a combined disclosed
value of $29.7 billion and 20 107 megawatts of planned capacity; and
- 27 projects at the Publicly Announced Stage that have a combined
disclosed value of $5.7 billion and 4 794 megawatts of planned capacity.
There are seven fewer projects than in last year’s report, and fewer projects
at each stage in the investment pipeline, except for committed projects.
All committed projects are currently renewable energy generation projects.
Their combined capacity (3 747 megawatts) is equal to six per cent of
Australia’s currently installed capacity.

Electricity generation major projects November 2015
7
Renewable projects constitute 78 per cent of proposed new capacity in the
investment pipeline, and 88 per cent of capital expenditure. Wind accounts
for half of total planned capacity and 59 per cent of total capital expenditure.
Figure 1.1: Investment pipeline for new capacity, by fuel type and by year of expected start up, as at October 2015
Notes: Projects with undisclosed timelines are presented as post 2020.
Source: Department of Inudstry, Innovation and Science (2015)
Figure 1.2: Number and nominal value of projects at the Committed Stage
Source: Department of Inudstry, Innovation and Science (2015)
Electricity generation major projects November 2015
8
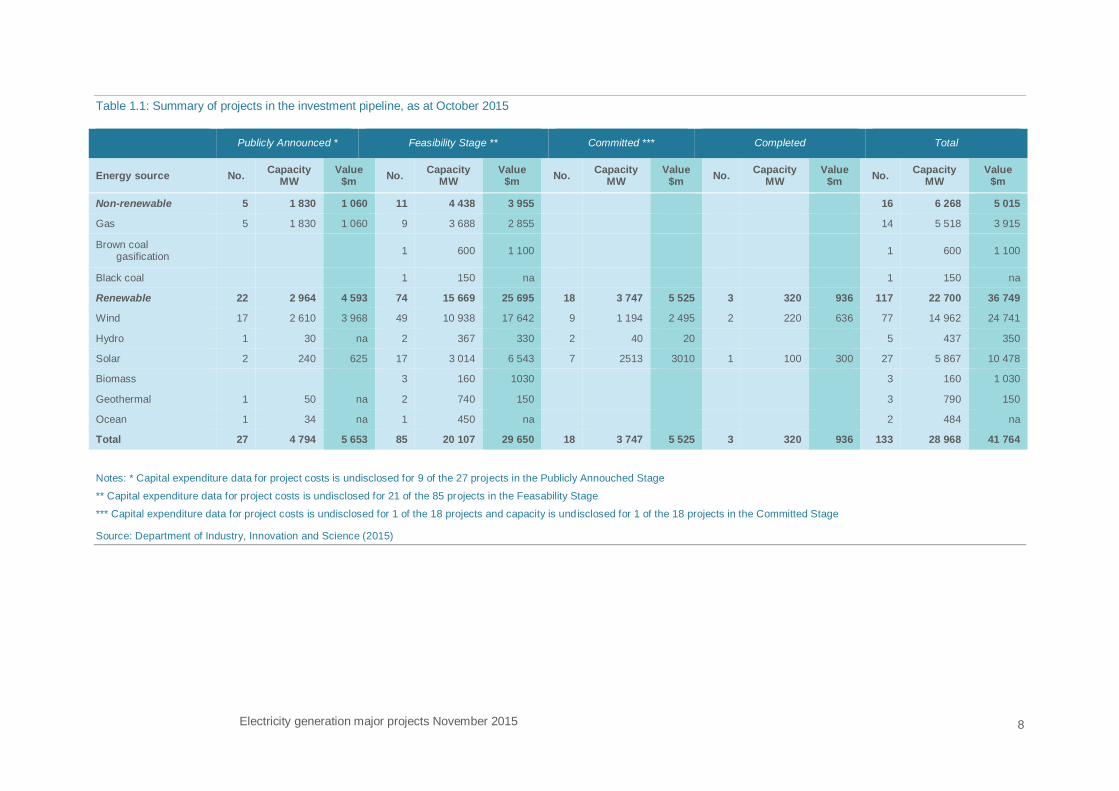
Table 1.1: Summary of projects in the investment pipeline, as at October 2015
Publicly Announced * Feasibility Stage ** Committed *** Completed Total
Energy source No. Capacity
MW Value
$m No.
Capacity MW
Value $m
No. Capacity
MW Value
$m No.
Capacity MW
Value $m
No. Capacity
MW Value
$m
Non-renewable 5 1 830 1 060 11 4 438 3 955
16 6 268 5 015
Gas 5 1 830 1 060 9 3 688 2 855
14 5 518 3 915
Brown coal gasification
1 600 1 100 1 600 1 100
Black coal
1 150 na 1 150 na
Renewable 22 2 964 4 593 74 15 669 25 695 18 3 747 5 525 3 320 936 117 22 700 36 749
Wind 17 2 610 3 968 49 10 938 17 642 9 1 194 2 495 2 220 636 77 14 962 24 741
Hydro 1 30 na 2 367 330 2 40 20
5 437 350
Solar 2 240 625 17 3 014 6 543 7 2513 3010 1 100 300 27 5 867 10 478
Biomass
3 160 1030
3 160 1 030
Geothermal 1 50 na 2 740 150
3 790 150
Ocean 1 34 na 1 450 na
2 484 na
Total 27 4 794 5 653 85 20 107 29 650 18 3 747 5 525 3 320 936 133 28 968 41 764
Notes: * Capital expenditure data for project costs is undisclosed for 9 of the 27 projects in the Publicly Annouched Stage
** Capital expenditure data for project costs is undisclosed for 21 of the 85 projects in the Feasability Stage
*** Capital expenditure data for project costs is undisclosed for 1 of the 18 projects and capacity is undisclosed for 1 of the 18 projects in the Committed Stage
Source: Department of Industry, Innovation and Science (2015)

Electricity generation major projects November 2015 9
2. About the Electricity Generation Major Projects Report
The annual Electricity generation major projects report provides an update on
electricity generation investment and additions to Australia’s installed capacity.
The list of major projects covers all fuel types, including black and brown coal,
oil, natural gas, solar, wind, hydro, bioenergy, geothermal and ocean. The
information draws on publicly available sources and information provided directly
by companies. The list that accompanies this report is provided as a Microsoft
Excel workbook. Projects are shown on separate worksheets based on the fuel
type used in generation.
Power plants of 30 megawatts or more are defined as major projects in this
report. This threshold is consistent with the requirement in the National
Electricity Rules for plants to be scheduled to the National Electricity Market
(NEM). Therefore, many smaller scale projects are not represented on the list,
including small-scale solar and bioenergy facilities. While these generation units
have an important role to play in Australia’s electricity supply, it is not feasible to
obtain a comprehensive list of all these projects.
As of 31 October 2015, the major electricity generation projects list contains
information on 133 projects, with the following details, where available:
project name
proponent company or joint venture
state
location
type — expansion or new project
estimated start up
project status — publicly announced, feasibility, committed, or completed
additional new capacity
fuel type
capital cost of the project in nominal terms
employment at the construction and operating stages.

Electricity generation major projects November 2015 10
2.1 Project classification
The report classifies projects into four stages of development that represent the
investment pipeline as reported by proponents (see Figure 2.1).
Figure 2.1: The stages of the investment pipeline
Source: Department of Industry, Innovation and Science (2015)
The four stages of the pipeline are:
1. Publicly Announced Stage. Projects at this stage are either at a very early
stage of planning or have stalled in their feasibility studies and may have an
unclear development path. Reflecting this, not all projects will progress from
this stage to become operational facilities. Preliminary information on project
schedule, planned capacity or cost is generally publicly available at this
stage.
2. Feasibility Stage. In this stage of development initial feasibility studies have
been completed and the results support further development. Further
studies are generally undertaken to finalise project scope and engineering
designs, assess environmental impacts and develop commercial plans.
Projects are classified as at the Feasibility Stage until a Final Investment
Decision (FID) is made. Typically, information can be gathered about at
least the cost, schedule and planned capacity of projects, as these have
been defined in the completed pre-feasibility study. Though more certain
than projects at the Publicly Announced Stage, these projects are not
guaranteed to progress further as evaluations of commercial prospects and
approvals have not yet been finalised.
3. Committed Stage. Projects at this stage of the development cycle have
received or are expected to recieve a positive FID from the owner and a
PPA is typically in place. These projects are either under construction or
preparing to commence construction. Cost estimates, schedules and plant
capacities are typically well defined and often publicly released. However,
plans are changeable due to schedule delays, scope changes and cost
overruns even after construction has commenced.
4. Completed Stage. Projects are moved to the completed list when
construction is substantially finished to the point where initial production can
commence, however work may still be continuing to bring full capacity
online.

Electricity generation major projects November 2015 11
There are earlier stages in developing projects, such as concept and
pre-development activities, which are not included in this report. These earlier
stages are important for the commercial development of an electricity generation
project but it is beyond the scope of this report to report these on a per project
basis.

Electricity generation major projects November 2015 12
3. Investment in electricity generation in Australia
3.1 Current electricity generation and investment trends
In 2013–14, total electricity generation in Australia declined by 0.6 per cent to
248 terawatt hours (Figure 3.1). This continues the downward trend since 2010–
11, in response to lower demand for electricity in the National Electricity Market
(NEM), which declined by 2 per cent in 2013-14. In contrast, generation
continued to grow in Western Australia (8 per cent growth) and the Northern
Territory (5 per cent growth). This is largely attributed to continued expansion in
off-grid generation, particularly to support the mining sector, which accounted for
an estimated 12 per cent of total generation in 2013–14.
Coal remained the major fuel source for electricity generation in 2013–14,
however the share of coal in the fuel mix fell to 61 per cent, down from 79 per
cent a decade ago. Coal’s dominant share is due to it providing continuous
base-load power and having relatively low cost input fuels (Figure 3.2).
Gas is Australia’s second largest source of electricity generation, accounting for
22 per cent of generation in 2013–14. Generation from natural gas increased
overall in the past two years, with increases in Western Australia, Queensland
and New South Wales in 2013–14. However, wholesale gas prices in the
eastern gas market have increased due to the transition to LNG exporting,
making gas a less attractive fuel for base and intermediate load electricity
generation.
Generation from renewable fuels contributed nearly 15 per cent of Australia’s
electricity generation in 2013–14, with hydro, wind and solar being the
predominant energy sources. Although hydro generation retains the largest
share of renewable electricity generation, it has dropped to below 50 per cent for
the first time in 2013–14, while wind and solar have continued to grow strongly.
Distributed rooftop solar PV, both residential and commercial, has grown
particularly strongly, which has replaced demand for electricity from the network
and reduced the need for new capacity. To date, around 15 per cent of
Australian households have installed solar PV, one of the highest penetrations in
the world,1 with the most installations occurring in Queensland (Figure 3.3).
Tasmania produces the largest amount of renewable energy in Australia,
followed by New South Wales. The largest shares of renewable generation in
the electricity generation mix occurred in Tasmania (93 per cent share,
predominantly hydro) and South Australia (38 per cent, predominantly wind) in
2013–14. Decisions to invest in renewables are largely driven by government
incentive schemes.
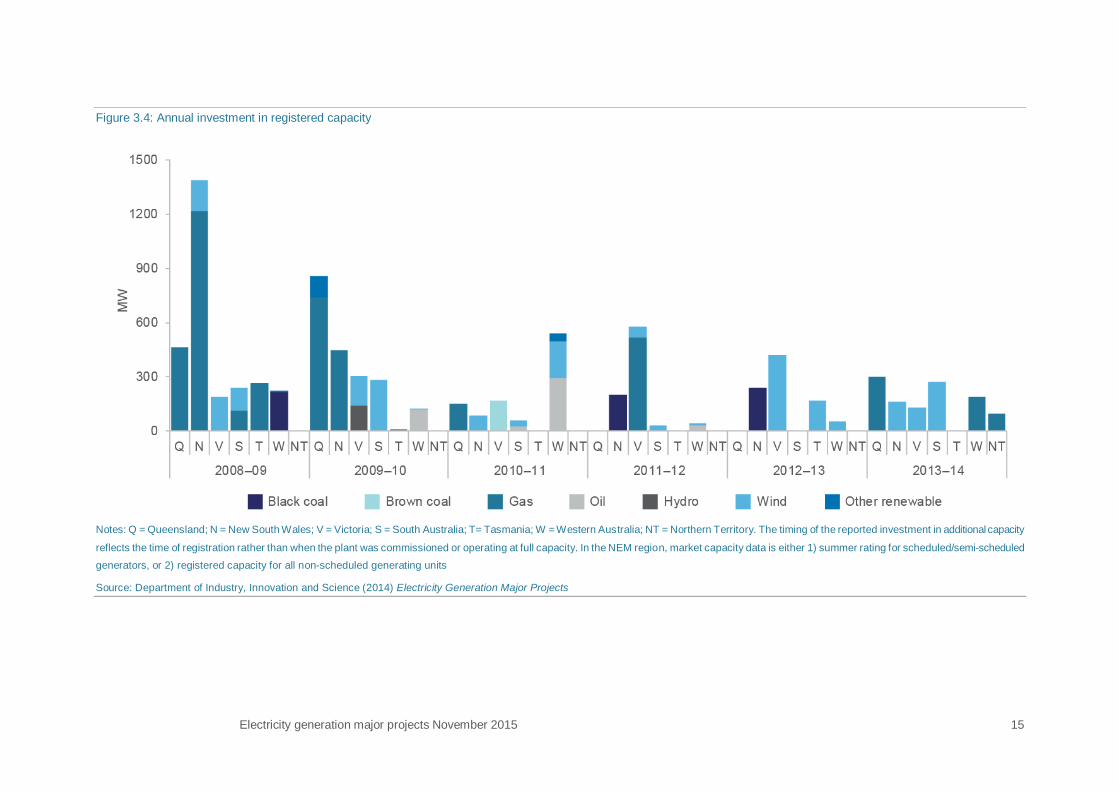
The profile of annual investment in registered capacity differs from year to year.
In 2014, gas and wind accounted for all of the new capacity in Australia, with
588 megawatts of new gas coming online and 567 megawatts of wind, spread
across all states except Tasmania (Figure 3.4). In 2013, there was strong uptake
1 Energy Supply Association Australia (ESAA) (2015) Electricity Gas Australia 2015, p. 4

Electricity generation major projects November 2015 13
of wind generation, with some black coal, and in 2012 a mixture of largely coal
and gas. From 2011 onwards, there is a considerable reduction in new capacity
additions.
Figure 3.1: Electricity generation, by fuel type
Source: Department of Industry and Science (2015) Australian Energy Statistics, Table O

Electricity generation major projects November 2015 14
Figure 3.2: Electricity generation by fuel type, and by state and territory, 2013–14
Notes: New South Wales includes the Australian Capital Territory.
Source: Department of Industry and Science (2015) Australian Energy Statistics, Table O
Figure 3.3: Cumulative solar PV installations
Notes: New South Wales includes the Australian Capital Territory.
Source: Clean Energy Regulator (2015) Postcode Data for Small-Scale Installations
Electricity generation major projects November 2015 15
Figure 3.4: Annual investment in registered capacity
Notes: Q = Queensland; N = New South Wales; V = Victoria; S = South Australia; T= Tasmania; W = Western Australia; NT = Northern Territory. The timing of the reported investment in additional capacity
reflects the time of registration rather than when the plant was commissioned or operating at full capacity. In the NEM region, market capacity data is either 1) summer rating for scheduled/semi-scheduled
generators, or 2) registered capacity for all non-scheduled generating units
Source: Department of Industry, Innovation and Science (2014) Electricity Generation Major Projects

Electricity Generation Major Projects November 2015 16
3.2 Factors affecting decisions to invest
There are many interconnected factors that influence decisions to invest in the
electricity generation sector in Australia. The most common reasons cited by
project proponents surveyed for this report were related to the ability to finance
projects, particularly whether there was demand for electricity in an oversupplied
market, wholesale electricity prices, and the ability to secure PPAs. Other
interrelated factors affecting whether a project goes forward include: regional
considerations, cost of fuel inputs, consideration of state or federal government
policies, incentives and loans, and the perceived risk of investing in new or
emerging technologies.
In 2015, a significant proportion of publicly announced projects across all fuel
types have continued to be put on hold or shelved, and projects at the feasibility
stage have had the expected commencement delayed.
Electricity demand
Electricity consumption in the NEM Region accounts for the majority of electricity
consumption in Australia (84 per cent in 2013–14) (Figure 3.5). Electricity
consumption in the NEM Region has declined by 1 per cent per year on average
since 2009–10, while it has continued to increase in Western Australia (6 per
cent) and the Northern Territory (1 per cent) as a result of increasing end-use
activity, largely in the mining sectors (Table 3.1).
Since 2010–11, milder weather across much of Australia, energy efficiency
improvements in residential and non-residential sectors, consumer responses to
higher retail electricity prices, and declines in the petroleum refining, non-ferrous
metals, and food, beverage and tobacco manufacturing industries, have
combined to cause a decline in electricity demand. Energy efficiency
improvements have occurred in appliances, such as refrigeration and air
conditioning, and energy efficiency requirements in the Building Code of
Australia. Electricity consumption fell by 4 per cent in the residential sector in
2013–14 and by 3 per cent in the manufacturing sector which, together with the
commercial and services sector which remained fairly flat, are the largest users
of electricity.
However, while aggregate demand has declined, maximum demand is projected
to increase. This is particularly true in Queensland, where high electricity
consumption from LNG plants is expected to increase maximum demand in the
short term. Population growth is expected to drive up maximum demand in the
medium to long term, particularly in New South Wales, Victoria and South
Australia.2 This means that extra investment may be needed in generation to
meet maximum demand.
2 Australian Energy Market Operator (AEMO) (2015) 2015 Electricity Statement of Opportunities,
p. 4

Electricity Generation Major Projects November 2015 17
Figure 3.5: Australia’s electricity consumption, by region
Notes: New South Wales Includes the Australian Capital Territory
Source: Department of Industry and Science (2015) Australian Energy Statistics, Table L

Electricity Generation Major Projects November 2015 18
Table 3.1: Australia’s electricity consumption, by region
Notes: NEM States include New South Wales, Victoria, Queensland, South Australia, Tasmania and
the Australian Capital Territory
Source: Department of Industry and Science (2015) Australian Energy Statistics, Table L
Surplus capacity
The unexpected plateauing and subsequent fall in demand around 2009–10 has
contributed to excess capacity in the NEM. Figure 3.6 shows two indexes
summarising relative changes in installed generating capacity and electricity
demand in the NEM.
Figure 3.6: Growth in installed generating capacity in the NEM region and demand for electricity
Source: Energy Supply Association of Australia (2015) Electricity Gas Australia; Global Roam, NEM Review database
The Electricity Statement of Opportunities (ESOO), published by the Australian
Energy Market Operator (AEMO), concludes that there is currently surplus
2013–14
Average annual growth
TWh Share
(per cent)
2013–14 (per cent)
10 years (per cent)
National Electricity Market (NEM) states
208.1 83.8
-2.0 0.2
Western Australia 36.7 14.8 8.4 6.4
Northern Territory 3.5 1.4 5.0 4.2
Total 248.3 100.0 -0.5 0.9

Electricity Generation Major Projects November 2015 19
capacity in the NEM. However, scheduled withdrawal of capacity from the NEM
(as a response to surplus capacity), and the projected continued increase in
maximum demand, means that over the next 10 years some additional capacity
is expected to be required to maintain the reliability standard and to meet
requirements under the RET. This is particularly true in New South Wales and
South Australia where projected withdrawals from the NEM exceed projected
surplus capacity. Additionally, withdrawal of capacity from South Australia will
lead to an increasingly high penetration of renewables in South Australia, and
possible effects on reliability of supply due to the intermittent nature of renewable
generation.
The Independent Market Operator (IMO) of Western Australia publishes the
ESOO for Western Australia. The IMO conclude that existing and committed
capacity should be sufficient to meet demand until 2024–25 and that no new
generation will be required in the South West Interconnected System (SWIS) for
this period. This is result of lower than expected demand due to consumer
responses to electricity prices, energy efficiency measures, and the impact of
distributed generation. However, the SWIS only covers a small portion of
Western Australia, and new capacity may be required elsewhere, particularly in
off-grid and mini-grid systems in remote mining regions.
The Power System Review is published by the Utilities Commission of the
Northern Territory that reports on the need for investment in further generation
capacity in each of the Alice Springs, Darwin-Katherine, and Tennant creek
regulated systems. The report concludes that in the Darwin-Katherine region
there is sufficient capacity to meet demand over the next ten years. In Alice
Springs and Tennant Creek regions there is almost enough capacity to meet
demand with good management over the ten year outlook period.
Electricity prices
Wholesale electricity purchase prices, as well as contract prices, have a strong
effect on decisions to invest in electricity generation, as these prices represent a
large part of the return that generators will receive on their investments. In the
NEM, generators are paid only for energy sent out, and wholesale prices provide
incentives to invest in generation according to demand for electricity.
There are notable differences in the wholesale energy purchase costs across
states in the NEM which partly reflect actual differences in wholesale prices
faced by retailers in each state as network capacity constraints limit the amount
of electricity transmitted across state borders. Figure 3.7 shows the spread
between average monthly wholesale prices in the NEM states.
In the early 2000s, relatively high wholesale electricity prices, combined with
robust demand growth, provided strong signals for investment in generation.
The cost of purchasing energy rose sharply between 2006 and 2009, as drought
conditions limited hydro-electric generation and reduced the availability of water
resources for cooling in the operation of thermal generation plants. This required
generation from other sources to make up for the shortfall. The effect of the
carbon pricing mechanism contributed to higher dispatch prices in 2012–13 and
2013–14, but there is, overall, a declining trend in wholesale prices, reflecting
weak demand and the oversupply of electricity generation in the NEM.

Electricity Generation Major Projects November 2015 20
Power purchase agreements
PPAs are contracts where an electricity generator contracts to sell power to a
purchaser (typically an electricity provider) for a set price. This can protect the
generator from market volatility. The continued oversupply of electricity in the
NEM, and, up until recently, uncertainty surrounding government renewable
energy policies, has created little appetite for energy providers to sign PPAs with
electricity generators. Anecdotal evidence suggests that companies are
unwilling to sign long term PPAs in the current investment climate, leaving
project developers with uncertainty over the viability of proceeding with projects.
However, recent announcements concerning the RET have led to greater
certainty in the sector and may lead to more willingness to sign PPAs going
forward.
Figure 3.7: Spread of monthly average real spot prices across states in the NEM region compared to the average
NEM spot price
Notes: Wholesale prices reported for the Snowy Scheme are excluded as well as the price spike in 2005 which may be associated
with high prices in Tasmania at the time that state joined the NEM
Source: Global Roam, NEM Review database; ABS (2015) Producer Price Indexes, cat. no. 6427.0
Government policies
Legislation to amend the RET was agreed to by the Australian Parliament in
June 2015. This included the new target for large-scale generation of 33,000
GWh in 2020. This is expected to be equivalent to around 23.5 per cent of
Australia’s electricity generation in 2020 being sourced from renewable energy.

Electricity Generation Major Projects November 2015 21
Queensland introduced Solar 60, an initiative committed to supporting up to 60
megawatts of solar power generation. Queensland retailer, Ergon Energy,
commenced a 150 megawatt tender for large scale renewable projects to be
added to its regional grid.
The ACT held two reverse auctions through 2015 to develop and encourage
more renewable electricity generation to reach its 90 per cent renewable energy
target by 2020. The ACT Government developed a legislated feed-in tariff
mechanism and reverse auction process that aims to provide a higher degree of
investment certainty for project developers and financiers.3
Nationwide, federally funded ARENA’s $100 million grants round has attracted
high interest as well as the Clean Energy Finance Corporations $250 million
financing opportunities.
Emerging technologies
A potentially disruptive emerging technology, and one that will need to be
considered going forward when investing in utility scale electricity generation, is
the potential for home storage options for solar rooftop PV generation. When
uptake of this technology combined with solar rooftop PV becomes cost
competitive it will further reduce demand from the electricity grid, including a
potential reduction in peak demand.4
3 ACT Government (2015) Renewable Energy Local Investment Framework. Accessed: November
2015 http://www.environment.act.gov.au
4 Parkinson G (2014) UBS: Australian Households Could Go Off-Grid by 2018, Reneweconomy,
May. Accessed: November 2015 http://reneweconomy.com.au/2014/ubs-australian-households-go-
grid-2018

Electricity Generation Major Projects November 2015 22
4. Projects at the Completed Stage
In the twelve months to October 2015, three electricity generation projects were
completed (Table 4.1), all of which were renewable energy projects. This
compares with seven completed in the year to October 2014 and the four
completed in the year to October 2013. The 2015 completed projects have a
total generation capacity of 320 megawatts and a total disclosed capital cost of
around $936 million.
Table 4.1: Major electricity projects, Completed Stage, as at October 2015
Energy source
Project Location Company Capacity MW
Value $m
Wind Boco Rock Wind Farm NSW EGCO 113 361
Wind Taralga Wind Farm NSW Banco Santander SA/BlueNRGY
107 275
Solar Nyngan Solar Farm NSW AGL Energy 100 300
Total 320 936
Source: Department of Industry, Innovation and Science (2015)
The largest renewable electricity project was the Boco Rock Wind Farm, owned
by EGCO and operated by CWP Renewables. Boco Rock was completed in
February 2015 and has a total capacity of 113 megawatts at a cost of $361
million.
Taralga Wind Farm was commissioned in July 2015, by Banco Santander SA
and BlueNRGY. Taralga’s 51 turbines, valued at $275 million, add capacity of
107 megawatts in the southern tablelands of NSW.
AGL’s Nyngan Solar Farm in western New South Wales is now the largest
operating solar project in Australia, adding 100 megawatts of power from
1.3 million solar panels. The $300 million project commenced operation in July
2015.
Electricity Generation Major Projects November 2015 23
5. Projects at the Committed Stage
Projects at the Committed Stage of development have received a FID and have
either started, or are expected to start construction. While these projects are
more certain than projects at the Publicly Announced and Feasibility Stages,
they are not immune to cost increases and schedule variations and may still be
postponed.
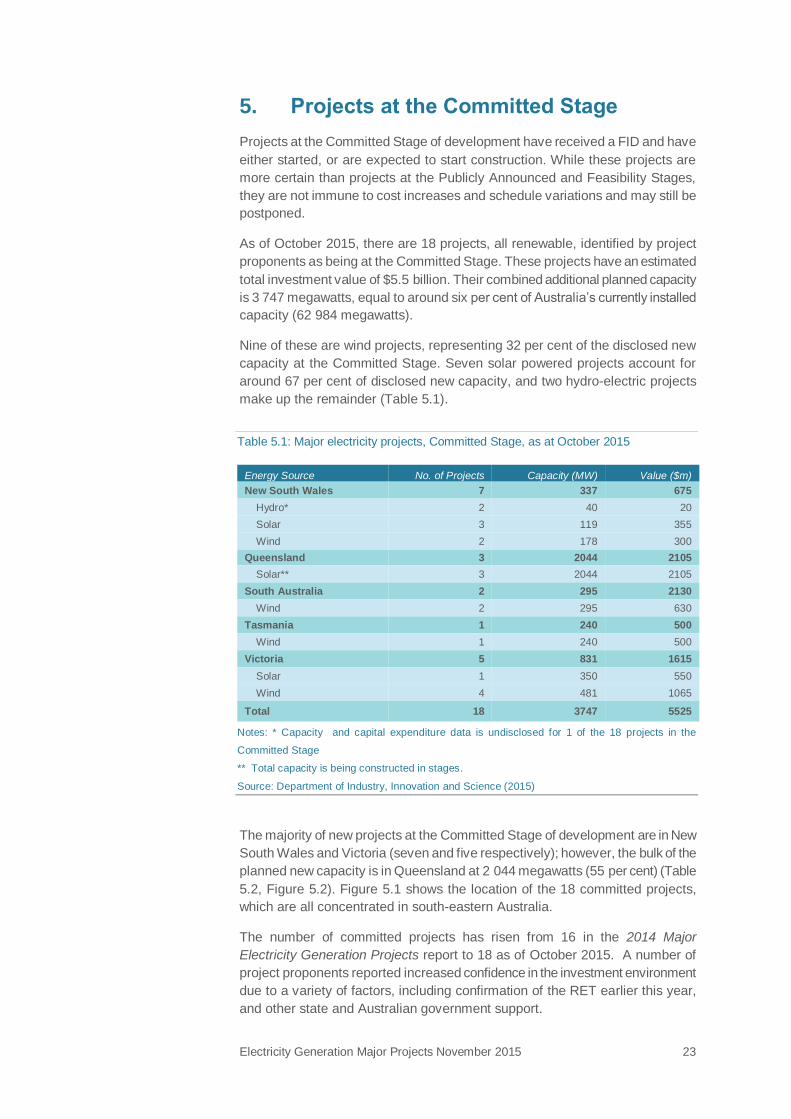
As of October 2015, there are 18 projects, all renewable, identified by project
proponents as being at the Committed Stage. These projects have an estimated
total investment value of $5.5 billion. Their combined additional planned capacity
is 3 747 megawatts, equal to around six per cent of Australia’s currently installed
capacity (62 984 megawatts).
Nine of these are wind projects, representing 32 per cent of the disclosed new
capacity at the Committed Stage. Seven solar powered projects account for
around 67 per cent of disclosed new capacity, and two hydro-electric projects
make up the remainder (Table 5.1).
Table 5.1: Major electricity projects, Committed Stage, as at October 2015
Energy Source No. of Projects Capacity (MW) Value ($m)
New South Wales 7 337 675
Hydro* 2 40 20
Solar 3 119 355
Wind 2 178 300
Queensland 3 2044 2105
Solar** 3 2044 2105
South Australia 2 295 2130
Wind 2 295 630
Tasmania 1 240 500
Wind 1 240 500
Victoria 5 831 1615
Solar 1 350 550
Wind 4 481 1065
Total 18 3747 5525
Notes: * Capacity and capital expenditure data is undisclosed for 1 of the 18 projects in the
Committed Stage
** Total capacity is being constructed in stages.
Source: Department of Industry, Innovation and Science (2015)
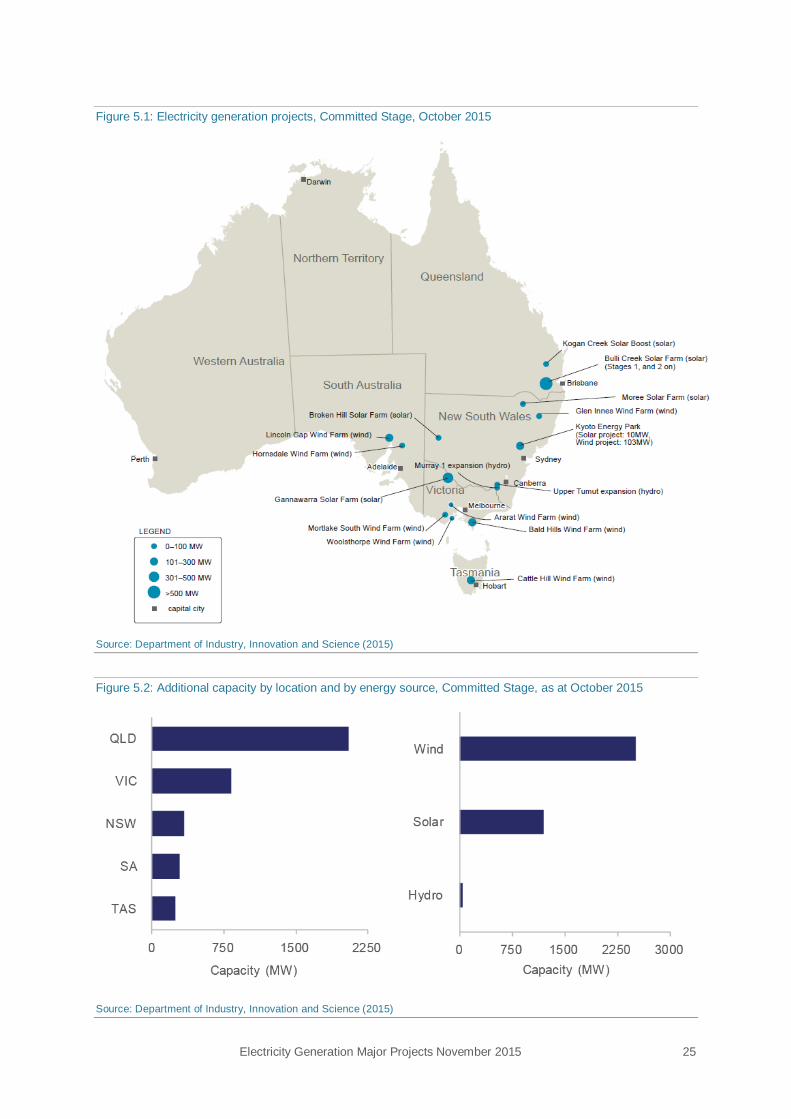
The majority of new projects at the Committed Stage of development are in New
South Wales and Victoria (seven and five respectively); however, the bulk of the
planned new capacity is in Queensland at 2 044 megawatts (55 per cent) (Table
5.2, Figure 5.2). Figure 5.1 shows the location of the 18 committed projects,
which are all concentrated in south-eastern Australia.
The number of committed projects has risen from 16 in the 2014 Major
Electricity Generation Projects report to 18 as of October 2015. A number of
project proponents reported increased confidence in the investment environment
due to a variety of factors, including confirmation of the RET earlier this year,
and other state and Australian government support.

Electricity Generation Major Projects November 2015 24
Table 5.2: Major electricity projects investment pipeline, by region, as at October 2015
Publicly Announced * Feasibility Stage ** Committed *** Completed Total
Region No. Capacity
MW Value
$m No.
Capacity MW
Value $m
No. Capacity
MW Value
$m No.
Capacity MW
Value $m
No. Capacity
MW Value
$m
New South Wales 8 1834 1677 22 5848 5925 7 337 675 3 319.8 936 40 8 339 9 213
Northern Territory
1 450
1 450
Queensland 4 770 625 18 3927 8855 3 2044 2105
25 6 741 11 585
South Australia 5 680 1160 12 3604 3530 2 295 630
19 4 579 5 320
Tasmania
2 539 1400 1 240 500
3 779 1 900
Victoria 9 1360 1621 17 4003 6390 5 830.5 1615
31 6 194 9 626
Western Australia 1 150 570 13 1736.4 3550
14 1 886 4 120
Total 27 4 794 5 653 85 20 107 29 650 18 3 747 5 525 3 320 936 133 28 968 41 764
Notes: * Capital expenditure data for project costs is undisclosed for 9 of the 27 projects
** Capital expenditure data for project costs is undisclosed for 21 of the 85 projects
*** Capacity and capital expenditure data for project costs is undisclosed for 1 of the 18 projects
Source: Department of Industry, Innovation and Science (2015)
Electricity Generation Major Projects November 2015 25
Figure 5.1: Electricity generation projects, Committed Stage, October 2015
Source: Department of Industry, Innovation and Science (2015)
Figure 5.2: Additional capacity by location and by energy source, Committed Stage, as at October 2015
Source: Department of Industry, Innovation and Science (2015)

Electricity Generation Major Projects November 2015 26
5.1 Solar Projects
Australia’s abundance of space, climate conditions and investment in
renewables R&D makes it an attractive location for large scale solar projects.
Solar projects dominate the Committed Stage of project development,
representing 67 per cent of total planned capacity (2 513 megawatts) and
$3 billion. While there are seven solar projects across Australia, most capacity is
from the two gigawatt Bulli Creek mega solar project in south Queensland.
The $2 billion Bulli Creek Solar Farm, owned by Solar Choice, co-developed
with Sun Edison, will be the world’s largest solar farm once fully developed. The
project is set for staged deployment over eight years and will be 20 times the
capacity of Australia’s current largest solar farm when completed. Solar Choice
is also undertaking staged development of the 350 megawatt Gannawarra Solar
Farm in north-western Victoria.
CS Energy is developing the 44 megawatt Kogan Creek Solar Boost project.
The solar boost project is a hybrid between renewable solar thermal power and
the existing coal powered Kogan Creek Power Station and will be completed in
2016.
5.2 Wind Projects
Wind is a well-established and competitive renewable energy source, and
accounted for 4 per cent of Australia’s electricity generation in 2013–14. Wind
projects represent 32 per cent (1 194 megawatts) of new capacity in the
Committed Stage at a total value of $2.5 billion.
Victoria has the highest new capacity of wind at 481 megawatts, followed by
South Australia at 295 megawatts, and Tasmania at 240 megawatts.
OneWind owns (or is a subsidiary in) three of the four largest wind projects in
the Committed Stage of development: Tasmania’s 240 megawatt Cattle Hill
Wind Farm; South Australia’s 195 megawatt Lincoln Gap Wind Farm; and the
75 megawatt Glenn Innes Wind Farm in New South Wales.
The largest project in Victoria is RES Australia’s Ararat Windfarm in Ararat. The
project is scheduled for completion in 2017 at a capital cost of $450 million, and
is planned to add 240 megawatts to existing capacity.
5.3 Hydro projects
Hydro projects make up 40 megawatts of disclosed capacity at the Committed
Stage. There are no new identified hydro projects, with new capacity coming
from the expansion of two Snowy Hydro facilities.
The Upper Tumut project is being developed as part of Snowy Hydro’s $400
million Scheme Modernisation project and is planned to expand capacity by 40
megawatts at a capital cost of $20 million and be completed in 2015. Snowy
Hydro has also committed to the development of the Murray 1 project with the
proposed expansion of hydro-electricity capacity at the plant.

Electricity Generation Major Projects November 2015 27
6. Projects at the Feasibility Stage
Projects at this stage have completed initial feasibility studies into their
commercial viability and have an announced development path ahead of them.
There is uncertainty over the number of projects that are likely to receive a
positive FID in the short to medium term, and not all of potential investment will
become committed. Consequently, the value of projects at the Feasibility Stage
is not directly comparable to the value of the more certain projects at the
Committed Stage.
There are 85 projects identified as at the Feasibility Stage with combined
capacity of 20 107 megawatts and total disclosed capital expenditure of
$29.7 billion (Table 6.1). The location of projects is widespread, with at least one
project in each jurisdiction (Figure 6.1).
Table 6.1: Major electricity projects, Feasibility Stage, as at October 2015
Energy Source No. of Projects Capacity (MW) Value ($m)*
New South Wales 22 5848 5925
Gas 5 1950 1350
Solar 3 130 378
Wind 14 3768 4197
Northern Territory 1 450 na
Ocean 1 450 na
Queensland 18 3927 8855
Black coal 1 150 na
Biomass 1 85 500
Hydro 2 367 330
Solar 6 2369 4925
Wind 8 956 3100
South Australia 12 3604 3530
Gas 2 1020 800
Geothermal 1 600 75
Solar 1 50 na
Wind 8 1934 2655
Tasmania 2 539 1400
Wind 2 539 1400
Victoria 17 4003 6390
Brown coal gasification 1 600 1100
Gas 1 550 525
Geothermal 1 140 75
Solar 2 180 na
Wind 12 2533 4690
Western Australia 13 1736 3550
Gas 1 168 180
Biomass 2 75 530
Solar 5 285 1240
Wind 5 1208 1600
Total 85 20107 29650
Notes: *Capital expenditure data for project costs is undisclosed for 21 of the 85 projects.
Source: Department of Industry, Innovation and Science (2015)

Electricity Generation Major Projects November 2015 28
Figure 6.1: Additional capacity by location and by energy source, Feasibility Stage, as at October 2015
Source: Department of Industry, Innovation and Science (2015)
6.1 Non-renewable electricity projects
Non-renewable electricity generation projects accounted for 11 of the
85 projects at the Feasibility Stage, and 22 per cent (4 438 megawatts) of
disclosed new capacity. The majority of these non-renewable projects — nine of
11 — are gas-fired projects, as well one black coal-fired power station and one
brown coal gasification station.
Most of the gas projects are currently on hold, awaiting positive investment
signals and approvals. The transition from Feasibility Stage to Committed Stage
for gas projects seems unlikely and unprofitable at this point in time, with
domestic gas prices expected to rise in the next few years.
The coal-fired project currently in the Feasibility Stage is the Moray Power
station (150 megawatts), run by Moray Power. It is proposed as the main power
supply to Adani’s Carmichael coal mine in the Galilee Basin, Central
Queensland. The Carmichael mine has encountered approval barriers including
environmental concerns and public backlash. Moray Power’s operations will
coincide with decisions made on the mine.

Electricity Generation Major Projects November 2015 29
6.2 Renewable electricity projects
There are 74 renewable electricity generation projects at the Feasibility Stage,
totalling 15 669 megawatts of capacity at a value of $25.7 billion.
Forty-nine of these projects are wind (compared to 51 in 2014), representing 54
per cent of the disclosed renewable capacity at the Feasibility Stage (10 938
megawatts). Wind projects are spread throughout Australia in all jurisdictions but
the Northern Territory and the ACT, with particular concentration in New South
Wales and Victoria.
Solar projects rose to 17 projects from nine in 2014. They currently account for
around 15 per cent of total planned new capacity at the Feasibility Stage with
capital expenditure of $6.5 billion.
There are two geothermal projects (740 megawatts) as well as two hydro-
electric plants (367 megawatts). The three bioenergy generation facilities have a
planned capacity of 160 megawatts, and one ocean powered project is
proposed for development with planned capacity of 450 megawatts.

Electricity Generation Major Projects November 2015 30
7. Projects at the Publicly Announced Stage
Projects at this stage include those for which concept and pre-development
activities are completed, but which have not yet completed an initial form of
feasibility study to fully assess the commercial viability of the project. During this
development phase project costs and market conditions may prevent the project
from going ahead or change the initial publicly announced project proposal. In
some cases this progression through to the Feasibility Stage and further can
take several years.
As of October 2015, 27 projects at the Publicly Announced Stage have been
identified, with a total capacity of 4 794 megawatts and total disclosed
investment value of $5.7 billion (Table 7.1). These projects are mostly wind and
gas-fired generation (Figure 7.1).
Table 7.1: Major electricity projects, Publicly Announced Stage, as at October 2015
Energy Source No. of Projects Capacity (MW) Value ($m)*
New South Wales 7 1834 1677
Gas 2 730 490
Wind 6 1104 1187
Queensland 4 770 625
Gas 1 500 na
Hydro 1 30 na
Solar 2 240 625
South Australia 5 680 1160
Wind 5 680 1160
Victoria 9 1360 1621
Gas 1 450 na
Geothermal 1 50 na
Ocean 1 34 na
Wind 6 826 1621
Western Australia 1 150 570
Gas 1 150 570
Grand Total 27 4794 5653
Notes: * Capital expenditure data for project costs is undisclosed for 9 of the 27 projects
Source: Department of Industry, Innovation and Science (2015)
7.1 Non-renewable electricity projects
Non-renewable electricity generation projects accounted for five of the
27 projects at the Publicly Announced Stage, and around 38 per cent
(1 830 megawatts) of disclosed new capacity. All of these non-renewable
projects are gas-fired projects with total disclosed value of $1 billion.
The largest non-renewable project at the Publicly Announced stage of
development is the $450 million Marulan power station in New South Wales.

Electricity Generation Major Projects November 2015 31
The proposed 700 megawatt gas-fired power station is planned as a peaking
plant to supply the Southern Tablelands region, but is currently on hold due to
reduced electricity demand.
Figure 7.1: Additional capacity by location and by energy source, Publicly Announced Stage, as at October 2015
Source: Department of Industry, Innovation and Science (2015)
7.2 Renewable electricity projects
There are 22 renewable electricity generation projects accounting for around 62
per cent (2 964 megawatts) of new capacity with a disclosed value of
$4.6 billion. 17 of these projects are wind-powered, representing 54 per cent of
the disclosed new capacity.
EPYC’s Jupiter Wind Farm in New South Wales is the largest wind project at the
Publicly Announced Stage in terms of capacity and capital expenditure. The
project has a planned capacity of up to 350 megawatts and an estimated capital
cost of $400 million.
The two large-scale solar farms at the Publicly Announced Stage are both in
Queensland and account for 240 megawatts of new capacity and $625 million of
capital expenditure. The projects, Clare Solar Farm and Lilyvale Solar Farm, are
owned by FRV.
Electricity generation major projects 32
References
ACT Government (2015) Renewable Energy Local Investment Framework.
Accessed: November 2015 http://www.environment.act.gov.au
Australian Energy Market Operator (AEMO) (2015) 2015 Electricity Statement of
Opportunities, August. Accessed: November 2015
http://www.aemo.com.au/Electricity/Planning/~/media/Files/Electricity/Planning/
Reports/ESOO/2015/2015%20ESOO%20Exec%20Summary.ashx
Australian Energy Market Operator (AEMO) (2015) 2015 National Electricity
Forecasting Report, June. Accessed: November 2015
http://www.aemo.com.au/Electricity/Planning/Forecasting/National-Electricity-
Forecasting-Report
Australian Bureau of Statistics (ABS) (2015) Producer Price Indexes, Australia,
cat. no. 6427.0, September. Accessed: November 2015
http://www.abs.gov.au/ausstats/[email protected]/mf/6427.0
Australian Energy Market Operator (AEMO) 2015 2015 Gas Statement of
Opportunities, April. Accessed: November 2015
http://www.aemo.com.au/Gas/Planning/Gas-Statement-of-Opportunities
Clean Energy Regulator (CER) (2015) Postcode Data for Small-Scale
Installations, March
Clean Energy Council (2015) Clean Energy Australia Report 2014, Melbourne,
June
Department of Industry and Science (2015) Australian Energy Statistics,
Canberra, August
Energy Supply Association Australia (ESAA) (2015) Electricity Gas Australia
2015, Melbourne, July
Global-Roam, NEM Review database
Independent Market Operator (IMO) of Western Australia (2015) 2014 Electricity
Statement of Opportunities, June
Parkinson G (2014) UBS: Australian Households Could Go Off-Grid by 2018,
Reneweconomy, May. Accessed: November 2015
http://reneweconomy.com.au/2014/ubs-australian-households-go-grid-2018
Queensland Government (2015) Solar 60 — Queensland's large-scale solar
investment program. Accessed: November 2015
http://www.business.qld.gov.au/industry/energy/renewable-energy/solar-60,
Utilities Commission (2015) Power System Review 2013–14, Northern Territory
Government, May