Embed Size (px)
Citation preview
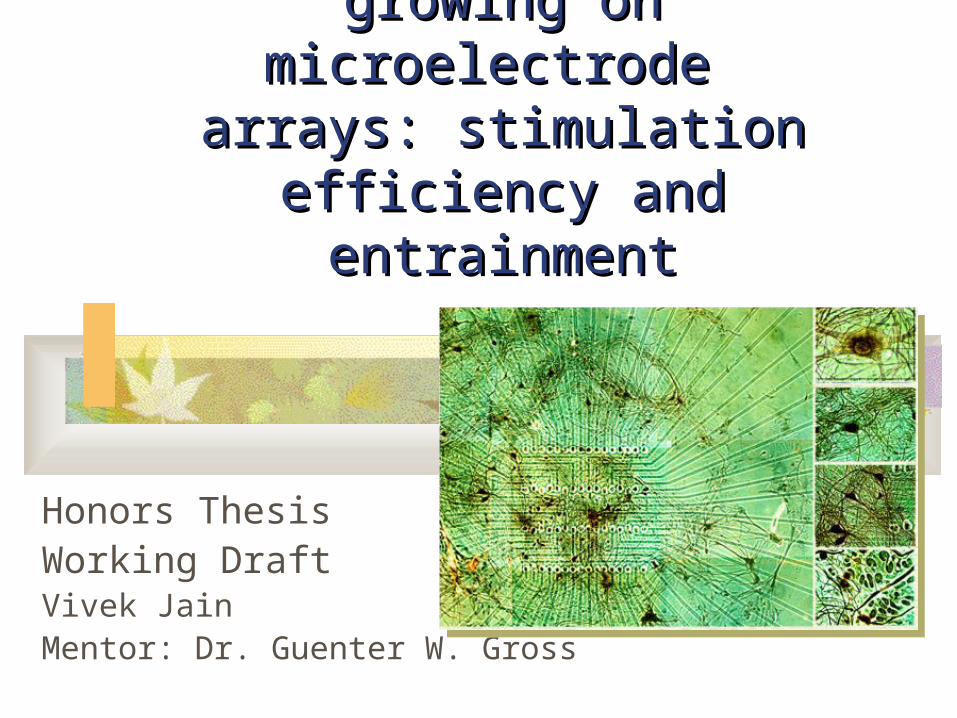
Electrical stimulation of nerve cell Electrical stimulation of nerve cell networks growing on microelectrode networks growing on microelectrode
arrays: stimulation efficiency and arrays: stimulation efficiency and entrainmententrainment
Honors ThesisWorking DraftVivek JainMentor: Dr. Guenter W. Gross

AcknowledgementAcknowledgementI thank the CNNS staff for their assistance with MEA fabrication and cell culture.
I also express my appreciation to Dr. Gross for his assistance with culture setup, recording, and stimulation procedures.
Finally, I express my gratitude to Dr. Eve for leading us all through many hurdles during the past three semesters.

STATEMENTSTATEMENT
StatementStatement Understanding native activity changes in
neuronal networks will lead to development of viable methods for memory storage and network ‘learning’,
Observing such changes requires repeatable and quantifiable network responses
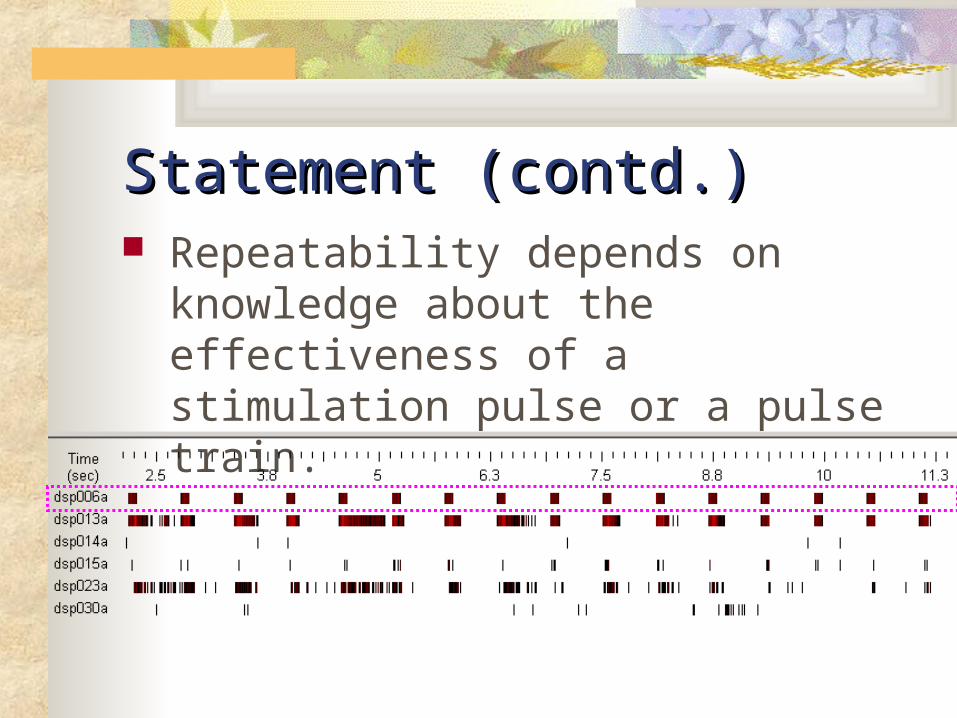
Statement (contd.)Statement (contd.) Repeatability depends on knowledge about
the effectiveness of a stimulation pulse or a pulse train.

BACKGROUNDBACKGROUND
TerminologyTerminology MEAs: micro-electrode arrays
MMEPs (multi micro-electrode plates), for culturing, stimulating and recording neuronal activity, spikes and action potentials of individual axons neurons
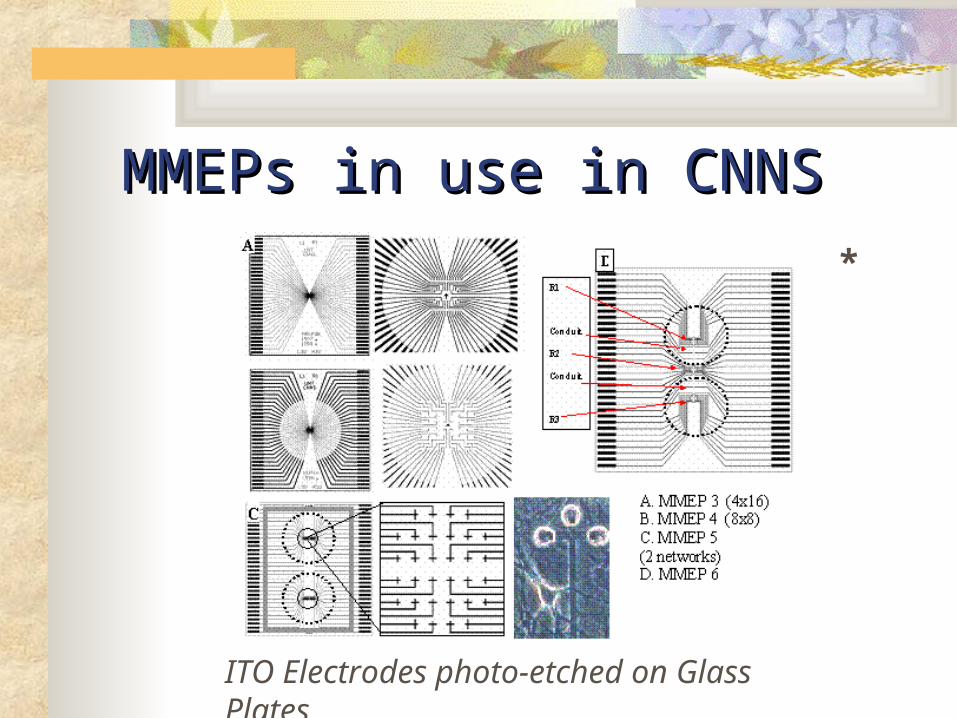
MMEPs in use in CNNSMMEPs in use in CNNS
ITO Electrodes photo-etched on Glass Plates
*
DefinitionsDefinitions
+
–
Ne
gat
ive
Po
sit
ive
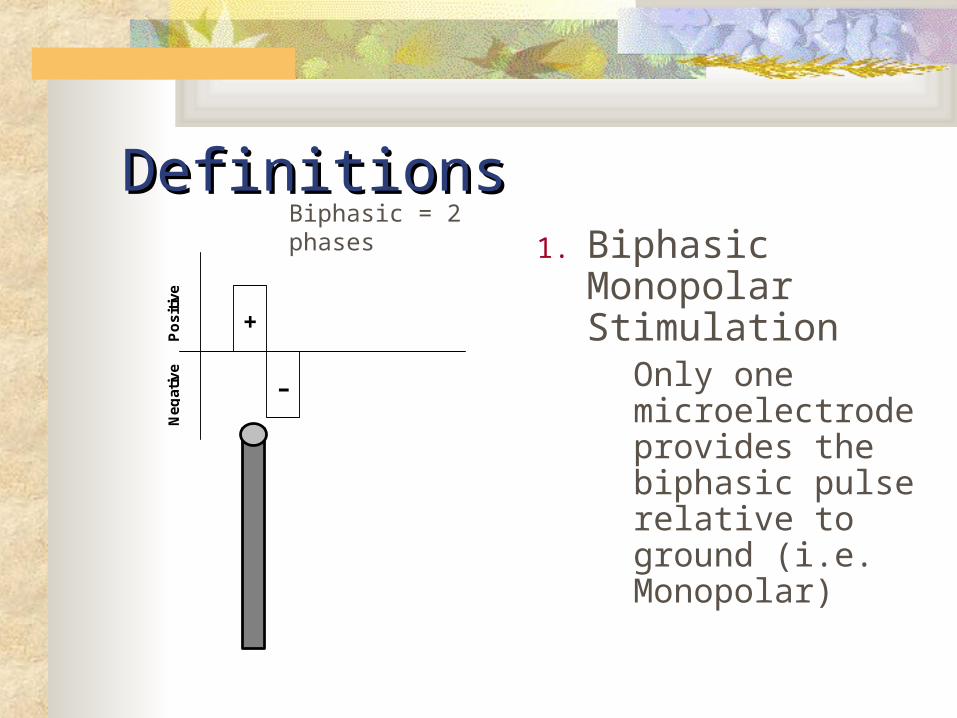
1. Biphasic Monopolar Stimulation
Only one microelectrode provides the biphasic pulse relative to ground (i.e. Monopolar)
Biphasic = 2 phases
Definitions (contd.)Definitions (contd.)2. Stimulation Efficiency:
Gross et al (1993), Shahaf et al (2001) use efficiency as the Response/Stimulus ratio:
Efficiency = (# of Response Pulses) (# of Stimulation
Pulses)
Definitions (contd.)Definitions (contd.)3. Entrainment:
The “locking together of frequencies” (Winfree, 1980) so as to make the network respond in synchronization with the applied stimulus is called the entrainment. While in entrainment, the network units fire when, and only when, there is a stimulus provided

Definitions (contd.)Definitions (contd.)Entrainment: the process by which an extrinsic stimulus changes the phase of a spontaneous event cycleLeft: at 30 trains/min, the network gets entrained to the stimulus pulse train
Gross et al, 1993
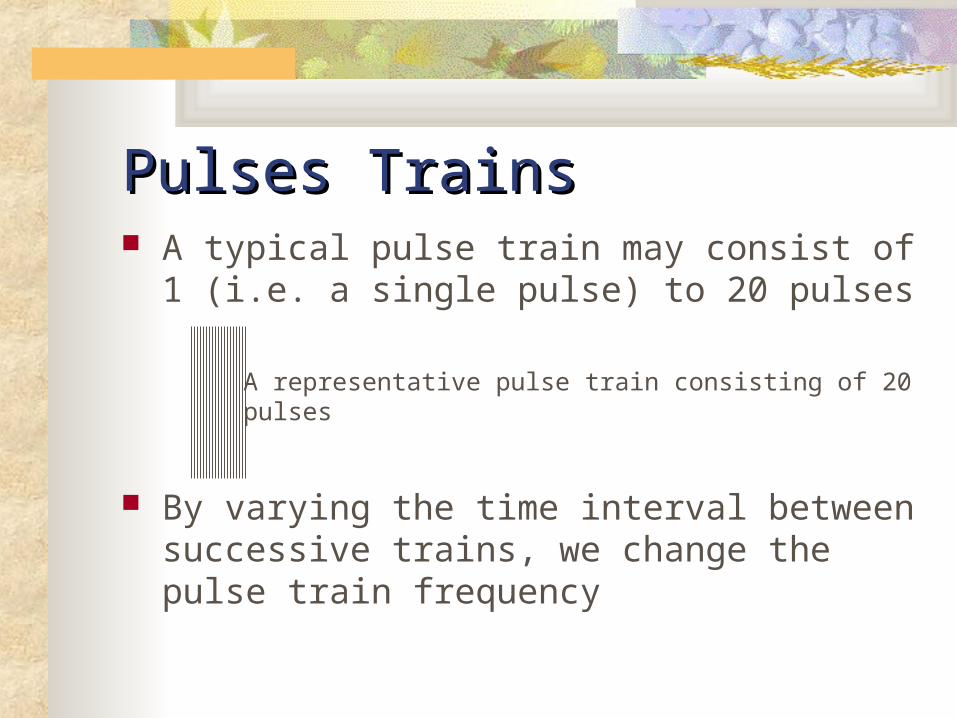
Pulses TrainsPulses Trains A typical pulse train may consist of 1 (i.e. a
single pulse) to 20 pulses
A representative pulse train consisting of 20 pulses
By varying the time interval between successive trains, we change the pulse train frequency
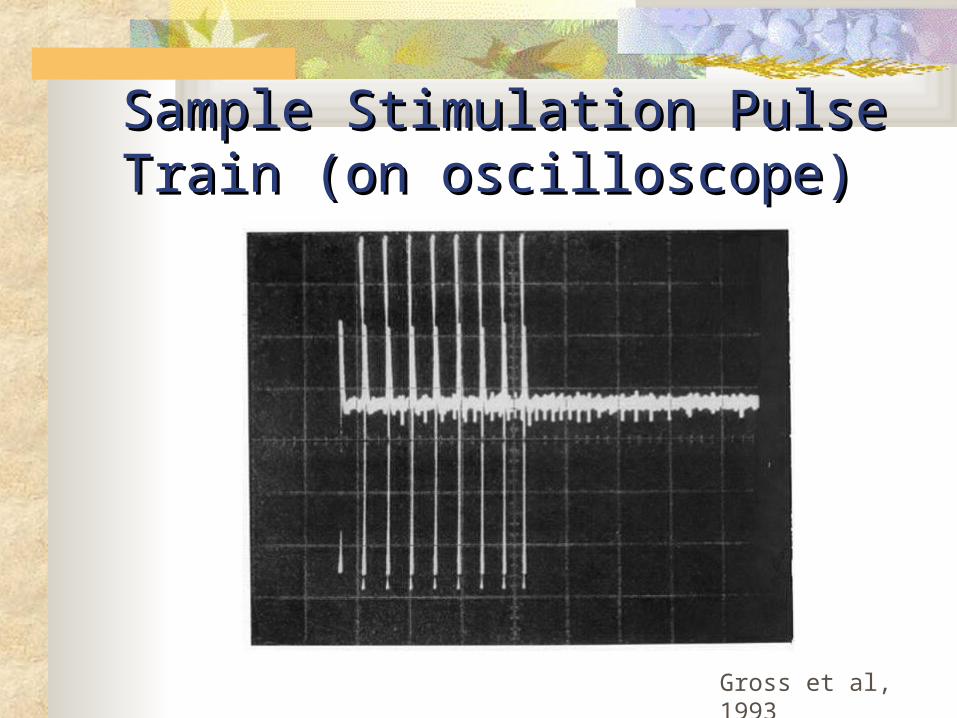
Sample Stimulation Pulse Train (on Sample Stimulation Pulse Train (on oscilloscope)oscilloscope)
Gross et al, 1993
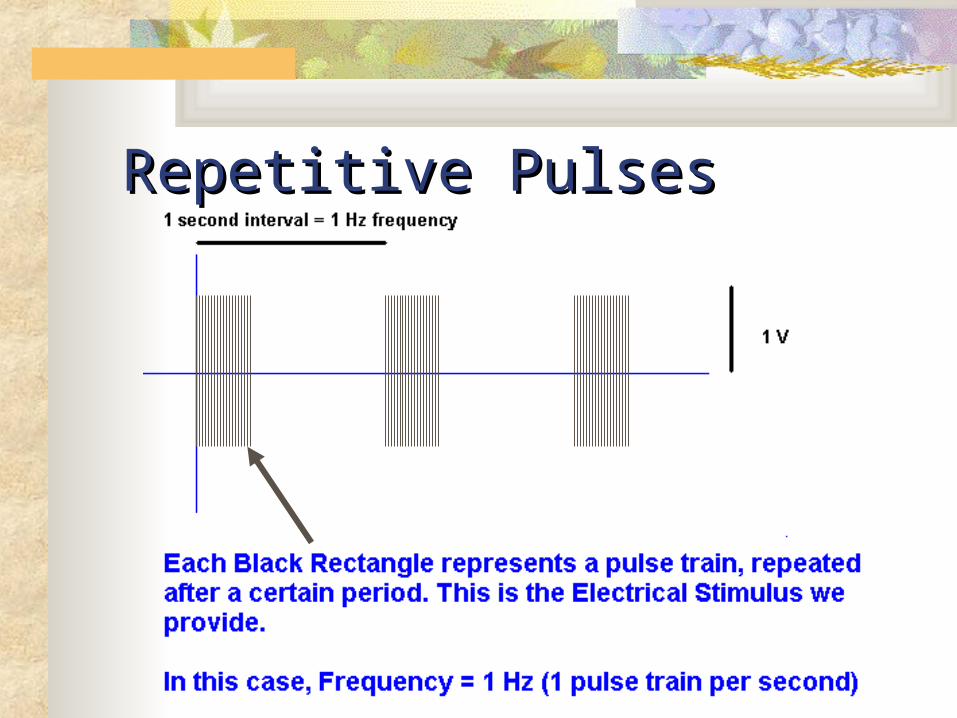
Repetitive PulsesRepetitive Pulses
Characteristics of StimulationCharacteristics of Stimulation Monopolar, Biphasic pulses for less cell
damage and to avoid electrode breakdown (Temel et al 2004, Gross et al 1993)
Constant Voltage stimulation because constant current may cause voltages to exceed electrolysis thresholds (~2.5 V) (Gross et al 1993)
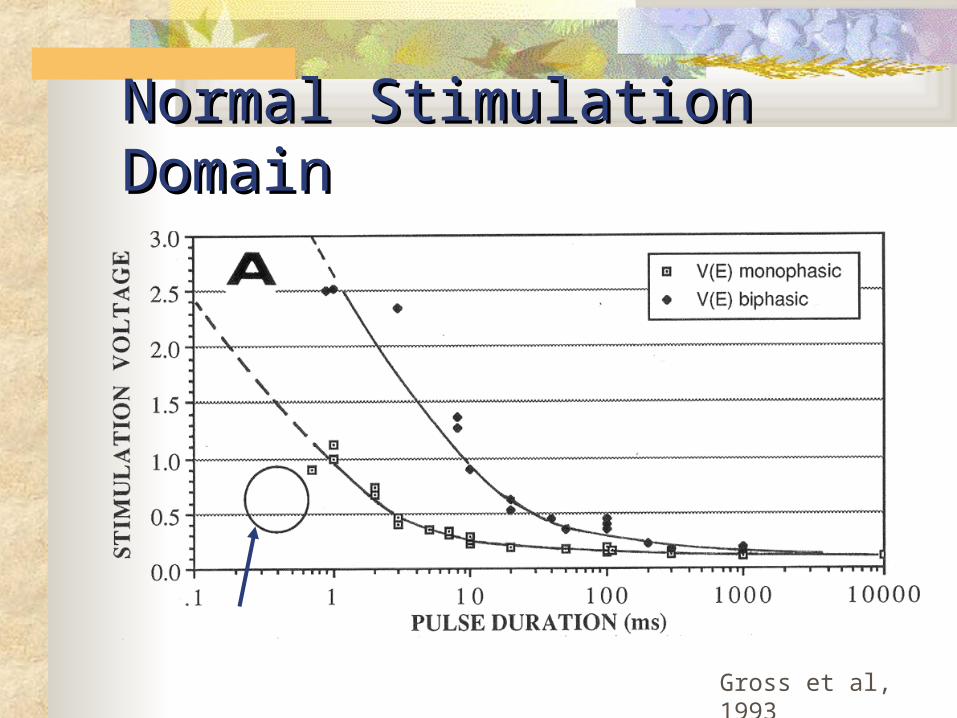
Normal Stimulation DomainNormal Stimulation Domain
Gross et al, 1993
LIMITATION 1: Networks non-stationary dynamic (Jimbo et al,
1999); constant network ‘learning’ probably occurs
LIMITATION 2: Each culture is unique; activity differs no a priori knowledge of stimulation electrodes Replication not easy
Limitations of methodologyLimitations of methodology

Large cells near electrode cratersLarge cells near electrode craters(Morphological cell-electrode coupling)(Morphological cell-electrode coupling)
Gross et al., 1993

RESEARCH OBJECTIVERESEARCH OBJECTIVE

Research ObjectiveResearch ObjectiveTo characterize stimulation efficiency/entrainment as
a function of the following variables: Frequency (pulses/trains) Pulse durations # of pulses/trainsSignificance:
No study done yet that pins down most effective characteristics of a stimulation pulse train
May pave way for improved communication with networks and studies of information storage.

RESEARCH METHODOLOGYRESEARCH METHODOLOGY
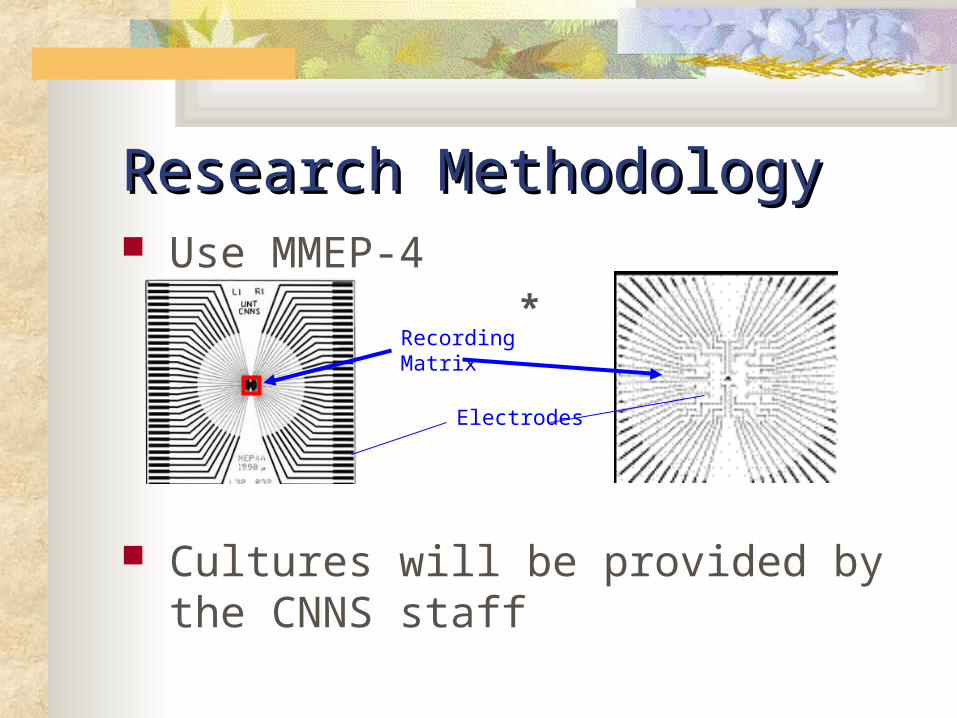
Research MethodologyResearch Methodology Use MMEP-4
Cultures will be provided by the CNNS staff
Electrodes
Recording Matrix
*
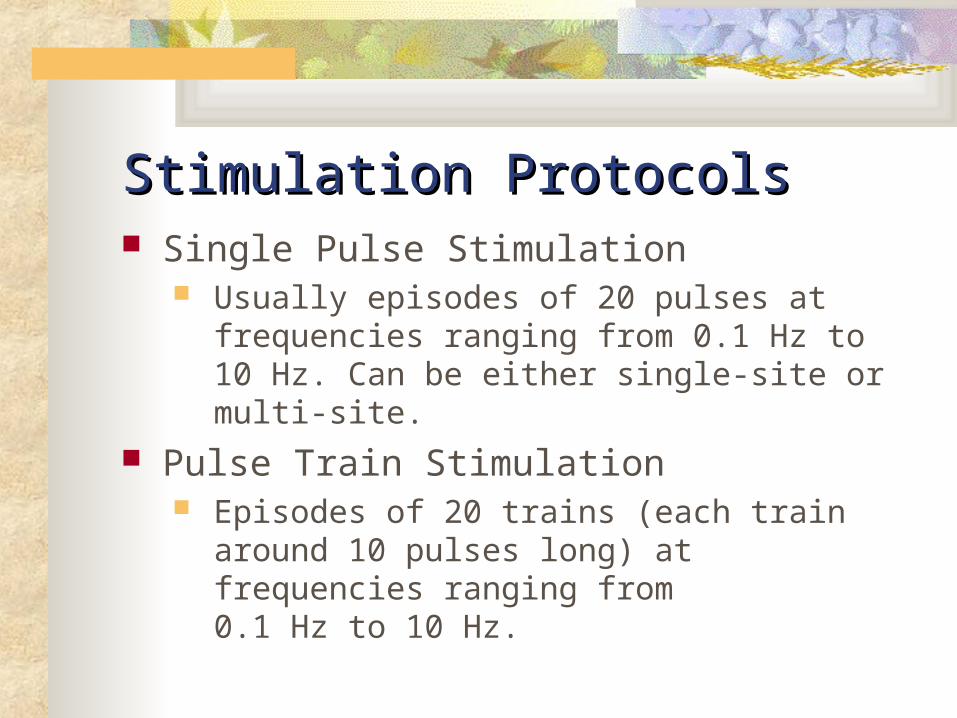
Stimulation ProtocolsStimulation Protocols Single Pulse Stimulation
Usually episodes of 20 pulses at frequencies ranging from 0.1 Hz to 10 Hz. Can be either single-site or multi-site.
Pulse Train Stimulation Episodes of 20 trains (each train around 10
pulses long) at frequencies ranging from 0.1 Hz to 10 Hz.
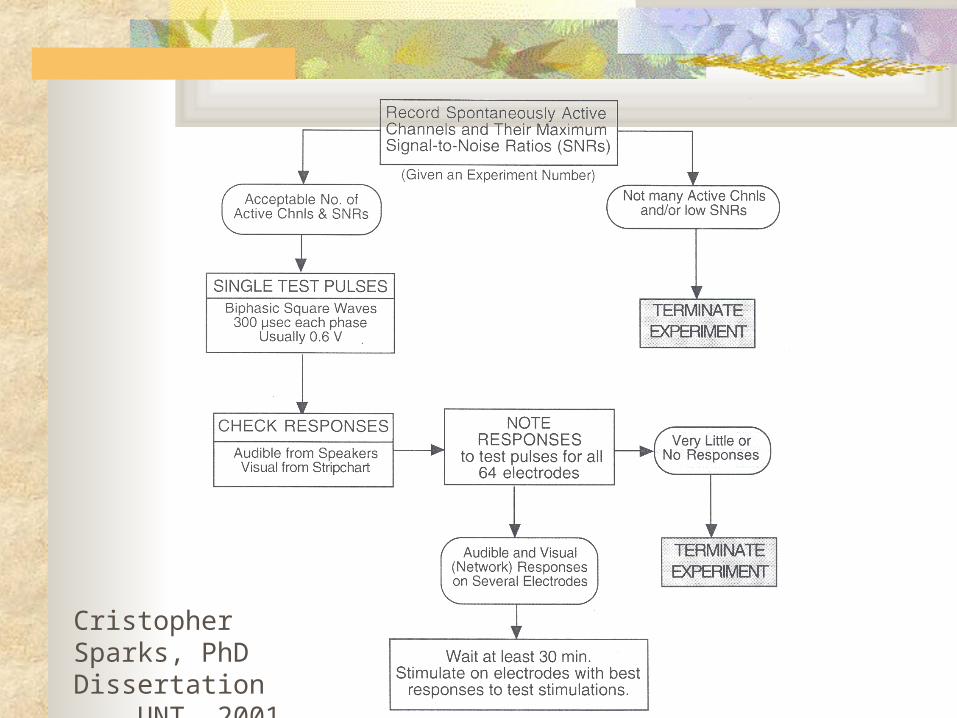
Cristopher Sparks, PhD Dissertation UNT, 2001
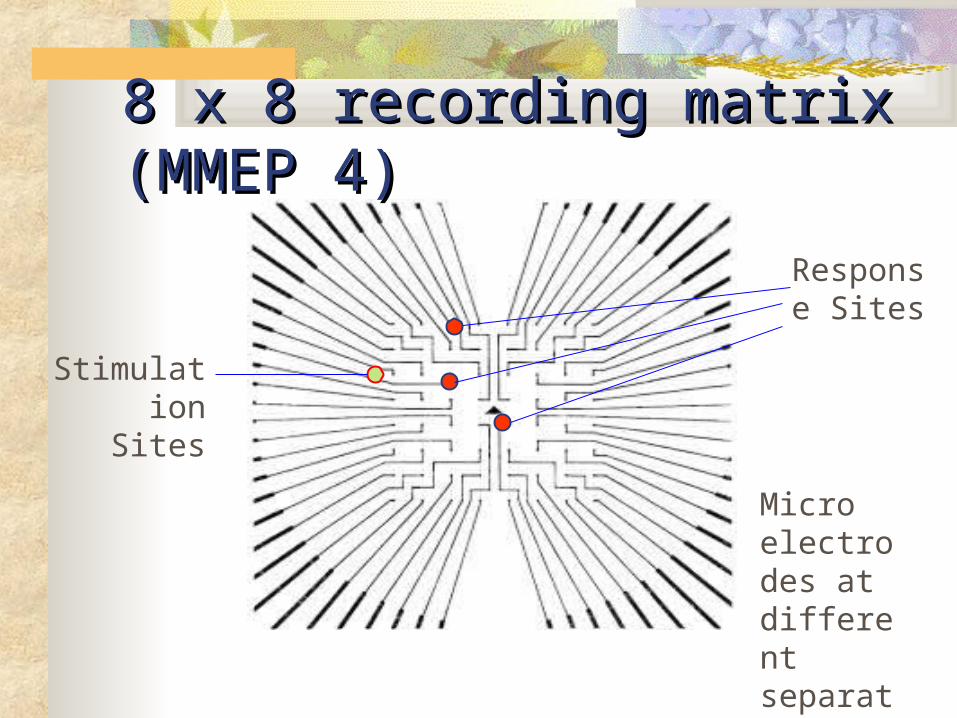
8 x 8 recording matrix (MMEP 4)8 x 8 recording matrix (MMEP 4)
Micro electrodes at different separations
Stimulation Sites
Response Sites

PRELIMINARY RESULTSPRELIMINARY RESULTS
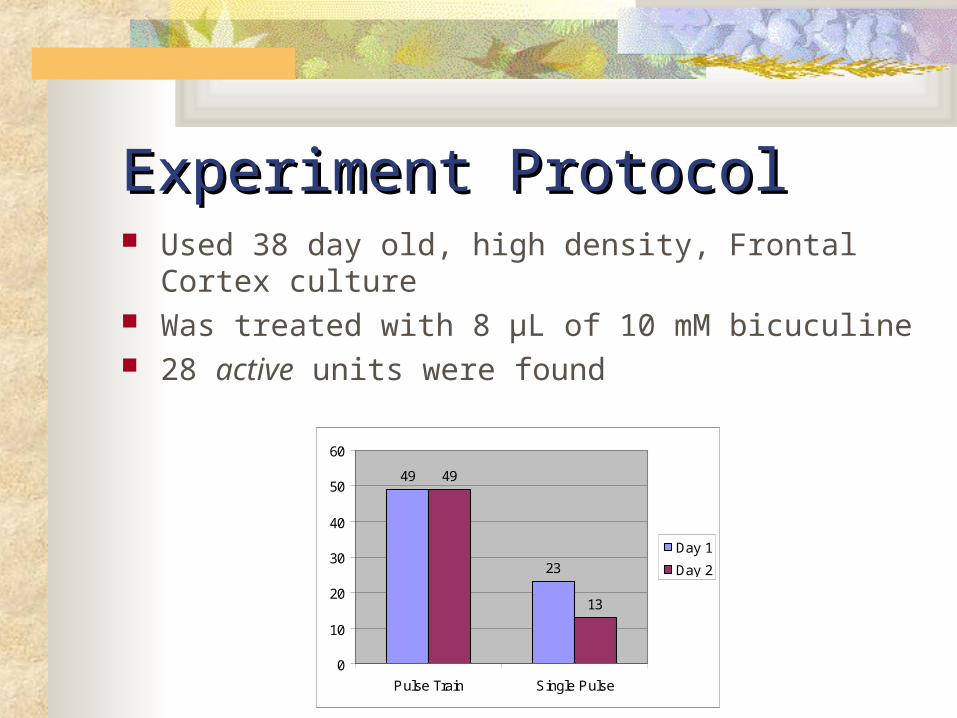
Experiment ProtocolExperiment Protocol Used 38 day old, high density, Frontal Cortex
culture Was treated with 8 μL of 10 mM bicuculine 28 active units were found
49
23
49
13
0
10
20
30
40
50
60
Pulse Train Single Pulse
Day 1
Day 2

Experiment Protocol (contd.)Experiment Protocol (contd.) Located responsive units, and then
conducted episodes of pulse train and single pulse stimulation at 5 sites that yielded the strongest auditory network response
Stimulation occurred at frequencies from 0.1 Hz to 10 Hz for pulse trains and from 0.2 Hz to 10 Hz for single pulses
Experiment Protocol (contd.)Experiment Protocol (contd.) Pulse Trains Characteristics
Train Width: 0.04s i.e. 10 pulses pulse-train @ 250 pulses per second (PPS)
Pulse Duration: 300 μs Inter-pulse Period: 4 ms Amplitude: 0.8 V
Single Pulse Characteristics Pulse Duration: 300 µs Amplitude: 0.8 V
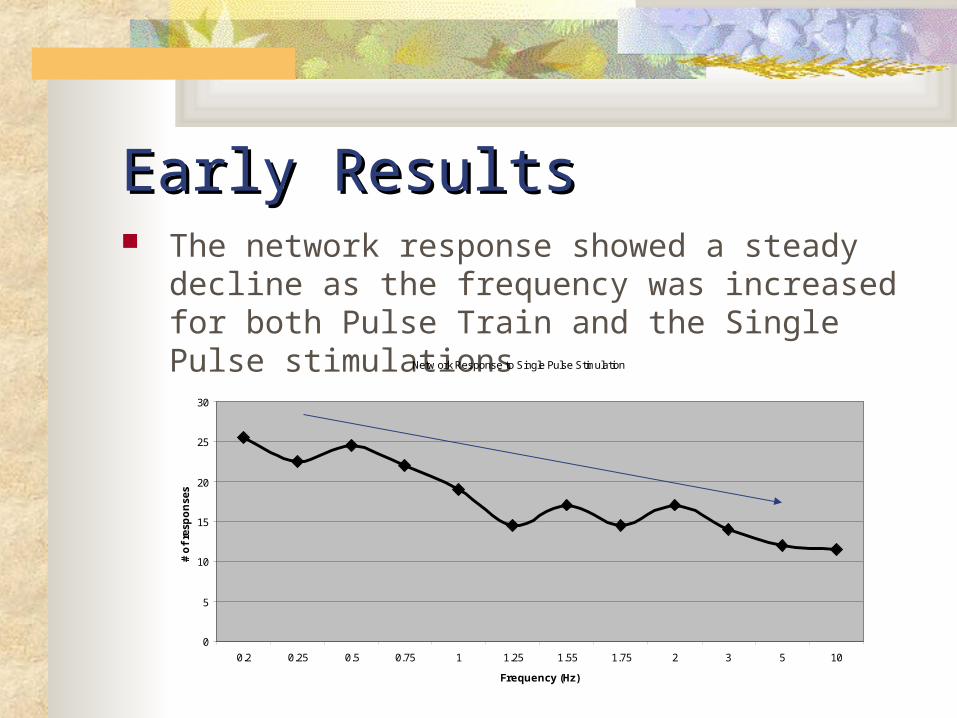
Early ResultsEarly Results The network response showed a steady decline as the
frequency was increased for both Pulse Train and the Single Pulse stimulations
Netw ork Response to Single Pulse Stimulation
0
5
10
15
20
25
30
0.2 0.25 0.5 0.75 1 1.25 1.55 1.75 2 3 5 10
Frequency (Hz)
# o
f re
spo
nse
s
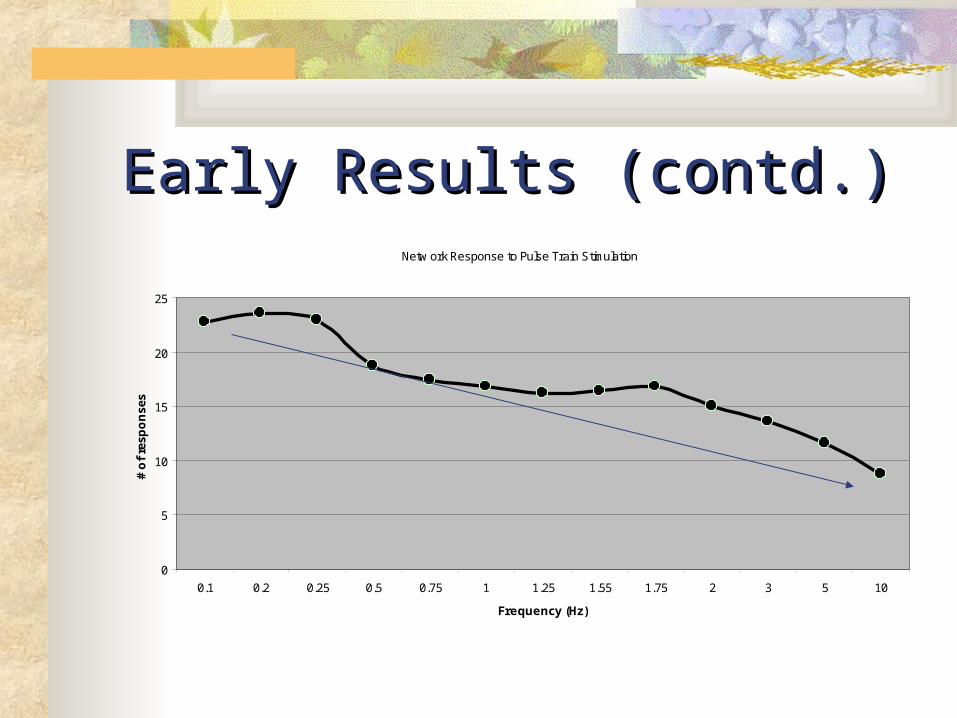
Early Results (contd.)Early Results (contd.)Netw ork Response to Pulse Train Stimulation
0
5
10
15
20
25
0.1 0.2 0.25 0.5 0.75 1 1.25 1.55 1.75 2 3 5 10
Frequency (Hz)
# o
f re
spo
nse
s

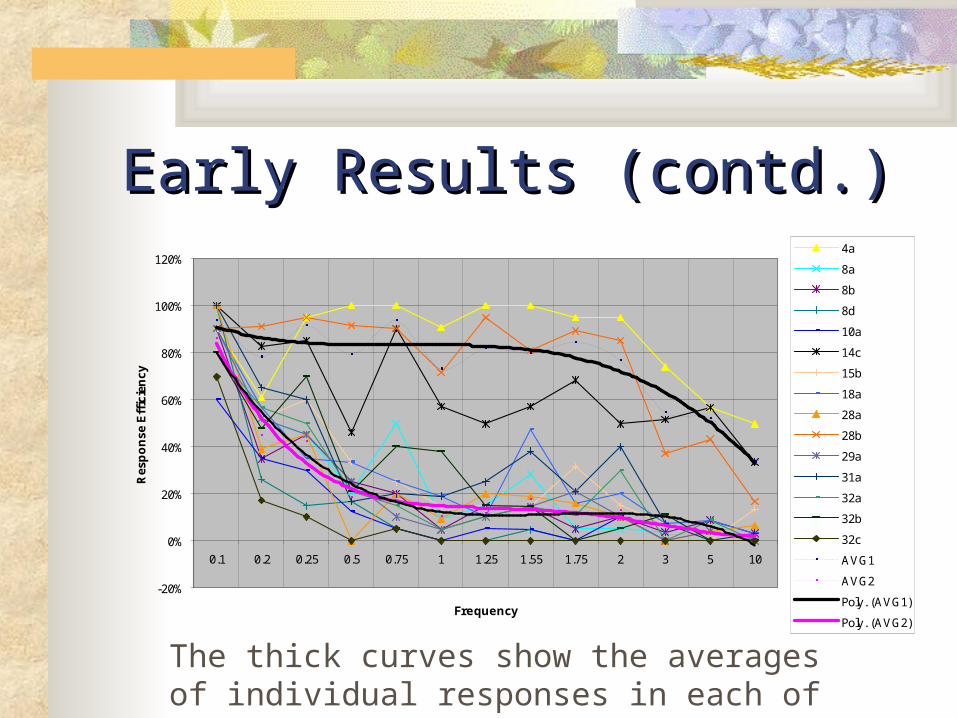
Early Results (contd.)Early Results (contd.) Pulse Train Stimulation
Stimulated 4 different sites Recorded the response for each of the 28 units that
responded to the stimulation Some responses were very minimal, and therefore
any unit that responded less than 50% at 0.1 Hz was eliminated when response curves were sorted
Distinct “colonies” of cells seem to appear, whose response curves show similar characteristics!
Early Results (contd.)Early Results (contd.)
-20%
0%
20%
40%
60%
80%
100%
120%
0.1 0.2 0.25 0.5 0.75 1 1.25 1.55 1.75 2 3 5 10
Frequency
Res
po
nse
Eff
icie
ncy
4a
8a
8b
8d
10a
14c
15b
18a
28a
28b
29a
31a
32a
32b
32c
AVG1
AVG2
Poly. (AVG1)
Poly. (AVG2)
Poly. (AVG2)
The thick curves show the averages of individual responses in each of the two ‘colonies’ of cells
Early Results (contd.)Early Results (contd.)Site 1
0%
10%
20%
30%
40%
50%
60%
70%
80%
90%
100%
0.1 0.2 0.25 0.5 0.75 1 1.25 1.55 1.75 2 3 5 10
Frequency (Hz)
Res
po
nse
Eff
icie
ncy
AVG1
AVG2
Poly. (AVG1)
Expon. (AVG2)
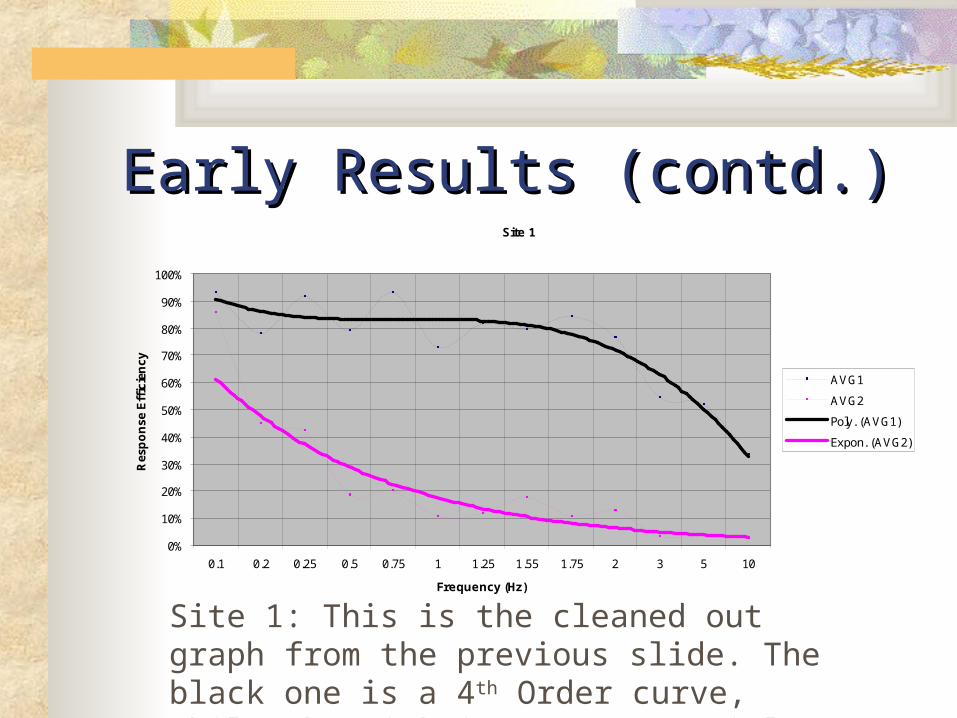
Site 1: This is the cleaned out graph from the previous slide. The black one is a 4th Order curve, while the pink is an exponential decay curve
Early Results (contd.)Early Results (contd.)Site 2
0%
20%
40%
60%
80%
100%
120%
0.1 0.2 0.25 0.5 0.75 1 1.25 1.55 1.75 2 3 5 10
Frequency (Hz)
Res
po
nse
Eff
icie
ncy
AVG1
AVG2
Poly. (AVG1)
Expon. (AVG2)
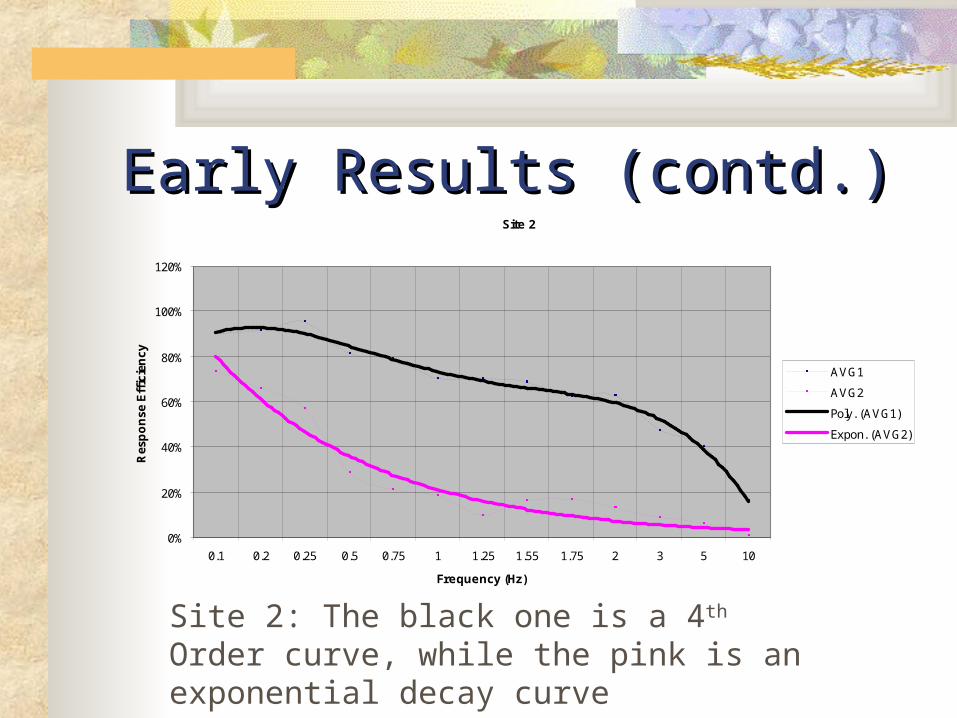
Site 2: The black one is a 4th Order curve, while the pink is an exponential decay curve

Early Results (contd.)Early Results (contd.)Site 3
0%
20%
40%
60%
80%
100%
120%
0.1 0.2 0.25 0.5 0.75 1 1.25 1.55 1.75 2 3 5 10
Frequency (Hz)
Res
po
nse
Eff
icie
ncy AVG1
AVG2
AVG3
Poly. (AVG1)
Expon. (AVG2)
Site 3. The black one is a 4th Order curve, while the pink is an exponential decay curve. There seems to be another colony active in this site.

Early Results (contd.)Early Results (contd.)Site 4
0%
20%
40%
60%
80%
100%
120%
1 2 3 4 5 6 7 8 9 10 11 12 13
Frequency (Hz)
Res
po
nse
Eff
icie
ncy
4a
AVG2
Expon. (AVG2)
Poly. (4a)
Site 4: The black one is a 4th Order curve, while the pink is an exponential decay curve
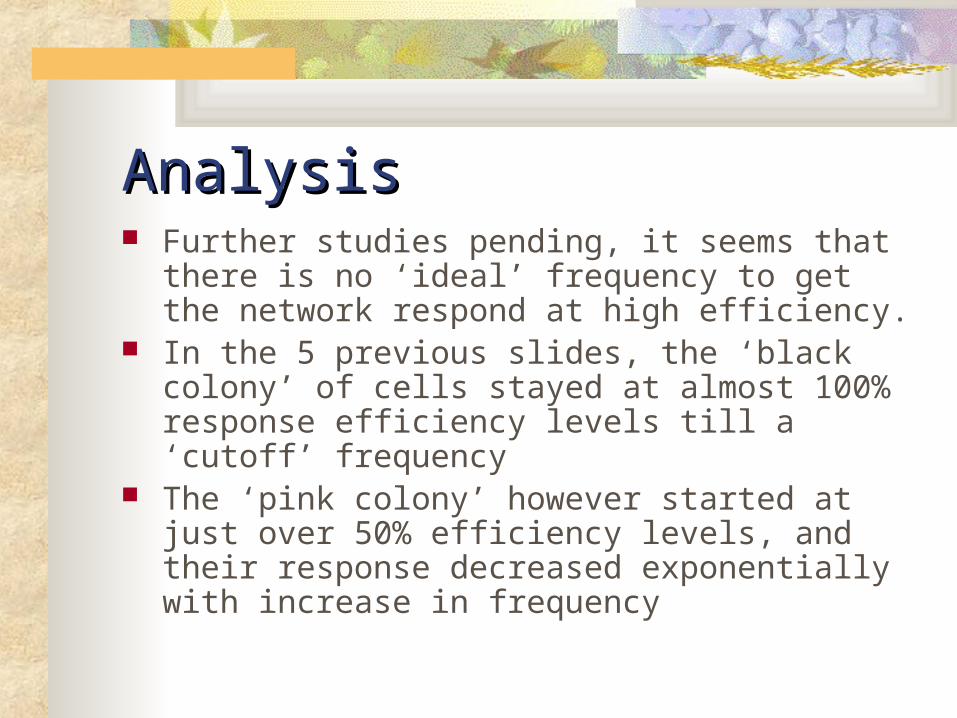
AnalysisAnalysis Further studies pending, it seems that there is no
‘ideal’ frequency to get the network respond at high efficiency.
In the 5 previous slides, the ‘black colony’ of cells stayed at almost 100% response efficiency levels till a ‘cutoff’ frequency
The ‘pink colony’ however started at just over 50% efficiency levels, and their response decreased exponentially with increase in frequency
Analysis (contd.)Analysis (contd.) It also seems that as the frequency is lowered (0.1
Hz really means a pulse every 10 seconds!), the network simply responds to the pulse / pulse train, because it is much below the network’s native natural frequency
The network remained ‘resilient’ through my stimulation experiment – i.e., after every stimulation episode, it ‘recovered’ to its native bursting rate, showing that the results are valid and therefore avoid Limitation 1 mentioned earlier
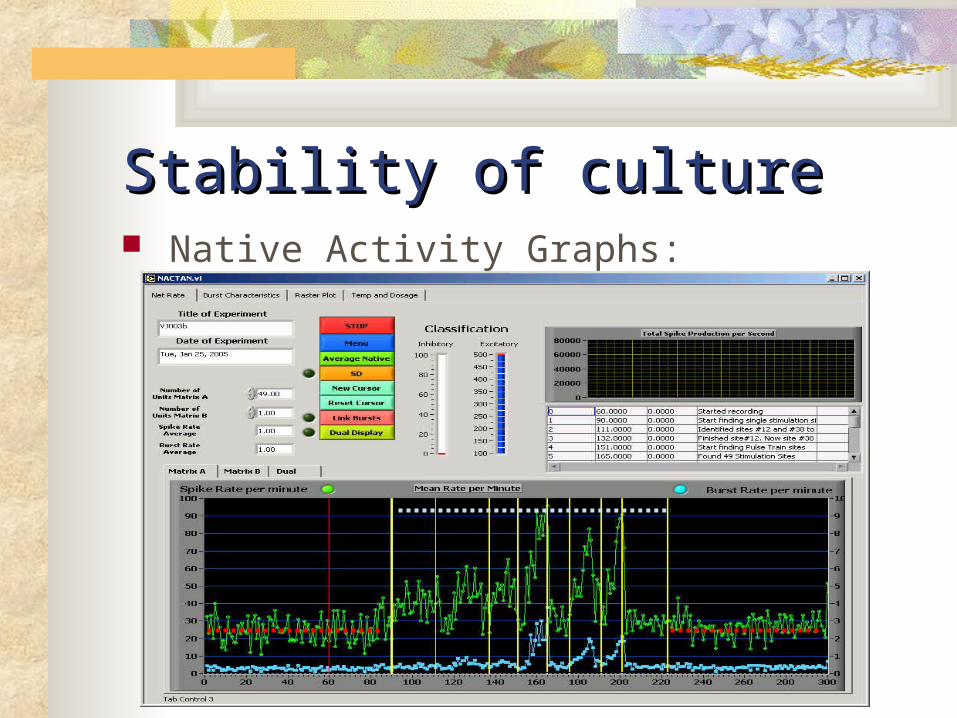
Stability of cultureStability of culture Native Activity Graphs:
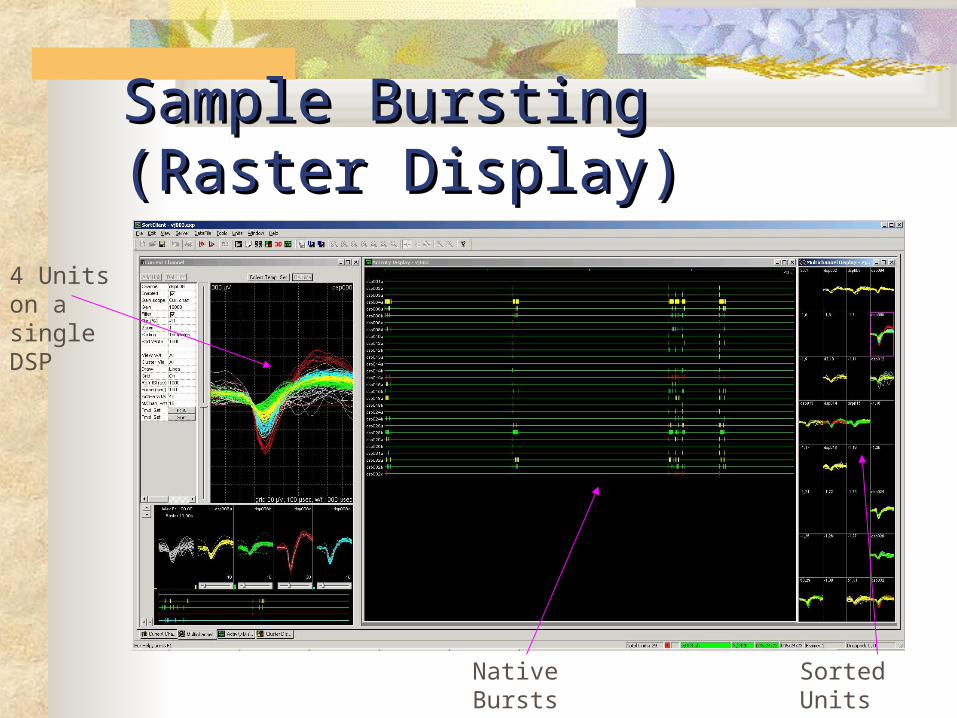
Sample Bursting (Raster Display)Sample Bursting (Raster Display)
4 Units on a single DSP
Native Bursts
Sorted Units

Near futurueNear futurue Culture left for 3 days
Hmm…
Hypothesis for the next experiment??
Future (contd.)Future (contd.) What Next?
Repeat, Repeat, Repeat Conduct more experiments before
concluding firmly whether we have found what we think we have
…actually did an experiment last week– data analysis still pending

REFERENCESREFERENCES

ReferencesReferencesBove, M., M. Grattarola, M. Tedesco and G. Verreschi. Characterization
of growth and electrical activity of nerve cells cultured on microelectronic substrates: towards hybrid neuro-electronic devices, Journal of Materials Science: Materials in Medicine, 5: 684-687.
Babalian, A. L., D. K. Ryugo and E. M. Rouiller. 2003. Discharge properties of identified cochlear nucleus neurons and auditory nerve fibers in response to repetitive electrical stimulation of the auditory nerve, Exp Brain Res, 153: 452-460
Gross, G. W., B. Rhoades, D. Reust and F. Schwalm. 1993. Stimulation of monolayer networks in culture through thin-film indium-tin oxide recording electrodes, Journal of Neuroscience Methods, 50: 131-143
Jimbo, Y., T. Tateno, H. P. C. Robinson. 1999. Simultaneous induction of pathway-specific potentiation and depression in networks of cortical neurons, Biophysics Journal, 76: 670-678

ReferencesReferencesManevitz, L. M. and S. Marom. 2002. Modeling the Process of
Rate Selection in Neuronal Activity, Journal of Theoretical Biology, 216: 337-343
Shahaf, G. and S. Marom. 2001. Learning in Networks of Cortical Neurons, Journal of Neuroscience, 21 (22): 8782-8788
Temel, Y., V. V. Vandewalle, M. van der Wolf, G. H Spincemaille, L. Desbonnet, G. Hoogland & H. W. M. Steinbusch. 2004. Monopolar versus bipolar high frequency stimulation in the rat subthalamic nucleus: differences in histological damage, Neuroscience Letters, 367: 92-96
Winfree, A. T. 1980. Ring Population, The Geometry of Biological Time: 114


![[tel-00861119, v1] Implantable microelectrode biosensors for - HAL](https://img.pdfslide.us/doc/110x75/620615a58c2f7b17300473ad/tel-00861119-v1-implantable-microelectrode-biosensors-for-hal.jpg)