Embed Size (px)
Citation preview
25
Electrical Properties of Graphene Polymer
Nanocomposites
P. Noorunnisa Khanam, Deepalekshmi Ponnamma and M.A. AL-Madeed
© Springer International Publishing Switzerland 2015
K.K. Sadasivuni et al. (eds.), Graphene-Based Polymer Nanocomposites
in Electronics, Springer Series on Polymer and Composite Materials,
DOI 10.1007/978-3-319-13875-6_2
Abstract Graphene, a monolayer of sp2 hybridized carbon atoms arranged
in a two dimensional lattice has attracted electronic industrial interest due to its
exceptional electrical properties. One of the most promising applications of this
material is in polymer nanocomposites in which the interface of graphene based
materials and polymer chains merge to develop the most technologically prom-
ising devices. This chapter presents the electrical properties of such graphene
based polymer nanocomposites and also discusses the effect of various factors on
their electrical conductivity. Graphene enables the insulator to conductor transi-
tion at significantly lower loading by providing percolated pathways for electron
transfer and making the polymers composite electrically conductive. The effect of
processing conditions, dispersion, aggregation, modification and aspect ratio of
graphene on the electrical conductivity of the graphene/polymer nanocomposites
is conferred.
Keywords Conductivity · Percolation · Filler modification · Volume fraction ·
Fabrication
1 Introduction
Graphene, a two-dimensional, single-atom-thick structure of sp2 bonded carbon
atoms, has attracted tremendous research interest due to their excellent reinforce-
ment, electrical properties, unique physical characteristics and high mechanical
properties. Therefore, recent research has focused on developing high perfor-
mance polymer nanocomposites, with the benefit of graphene nanotechnology, to
P.N. Khanam (*) · M.A. AL-Madeed
Centre for Advanced Materials, Qatar University, Doha, Qatar
e-mail: [email protected]; [email protected]
D. Ponnamma
School of Chemical Sciences, Mahatma Gandhi University, Kottayam 686560, Kerala, India
26 P.N. Khanam et al.
achieve novel composite materials for a wide range of industrial fields. Graphene
dramatically improves the properties of polymer based composites at a very low
loading and its most fascinating property is the very high surface conductivity
leading to the formation of numerous electrically conductive polymer composites.
Such conducting graphene nanocomposites have been widely applied in anti-static
materials, electromagnetic interference (EMI) shielding, chemical sensor, bipolar
plates for fuel cells etc. Other possible applications include radio-frequency inter-
ference shielding for electronic devices and electrostatic dissipation [1–3].
By using conventional processing methods, graphene composites can be eas-
ily fabricated into intricately shaped components with excellent preservation of the
structure and properties. This is very important to make full use of the outstanding
properties of graphene. Compared with carbon nanotubes (CNTs), graphene has a
higher surface-to-volume ratio because of the inaccessibility of the CNT’s inner
tube surface to polymer molecules. This makes graphene potentially more favora-
ble for improving the properties of polymer matrices, such as electrical properties.
Therefore, graphene-based polymer composites have attracted both academic and
industrial interest [3].
The present chapter gives an overview of the electrical properties of graphene
based polymer nanocomposites. A brief description about the synthesis and
characterization of graphene is also included in this chapter. Since the present book
deals with the applications of graphene nanocomposites in various fields of flexible
and wearable electronics, we think this chapter is of much significance as electrical
conductivity is the basis for graphene’s such applications. After giving an outline
about the electrical properties of graphene polymer composites, the various fac-
tors affecting the conductivity such as filler aspect ratio, dispersion, modification
of graphene surfaces etc. are also discussed here. The phenomenon of percolation
threshold is also well pictured and finally this chapter ends with a few applications.
2 Synthesis and Characterization
2.1 Synthesis of Graphene
Graphite is available in large quantities as in the form of both natural and synthetic
sources and is rather inexpensive [4]. The main graphite derivatives include EG,
graphite oxide, graphene nanoplatelets (GNP), graphene oxide (GO), reduced gra-
phene oxide (RGO), and graphene. Because the electronic, photonic, mechanical,
and thermal properties of graphene depend on the number of layers [5] [although
the monolayer (ML), bi-layer (BL), and tri-layer (TL) graphenes have practical
significance] and its crystalline structure, the controlled synthesis of graphene with
defined layers is rather significant. The mechanical peeling method by which gra-
phene is first produced [6] is not used for an industrial scale of production. The
GO and RGO derivatives are usually synthesized via solution-based oxidation
and reduction by thermal and chemical methods, whereas graphene layers with
27Electrical Properties of Graphene Polymer Nanocomposites
superior electron transport characteristics are always synthesized using dry meth-
ods such as chemical vapor deposition (CVD) and surface segregation [6–13].
Although more than 95 % of graphene has been grown on Cu foil [5], this growth
was not epitaxial, and thus complete growth over the entire substrate remains a
major challenge. The surface of Ni(III) proved to be the best substrate for the epi-
taxial growth of structurally homogeneous graphene due to the small lattice mis-
match of this surface with that of graphene and highly oriented pyrolytic graphite
[14]. However, this method suffers from the disadvantage of carbon solubility in
nickel, and thus achieving uniform thickness throughout the substrate is difficult.
The simple method of surface segregation [15–17] was recently introduced to
solve this problem and to epitaxially grow graphene over Ni film (~100 nm thick)
[18]. Raman spectroscopy and scanning tunneling microscopy (STM) verified the
homogeneity of the graphene layer over the entire Ni film [19–21].
2.2 Preparation of Graphene Polymer Composites
Various preparation methods employed to synthesize graphitic filler reinforced
polymer nanocomposites include melt mixing, solution mixing and in situ polym-
erization. In addition to these three traditional polymer composite preparation
methods, many other methods are also practiced for material fabrication. Since the
common methods were the subjects for several reviews, a few other methods are
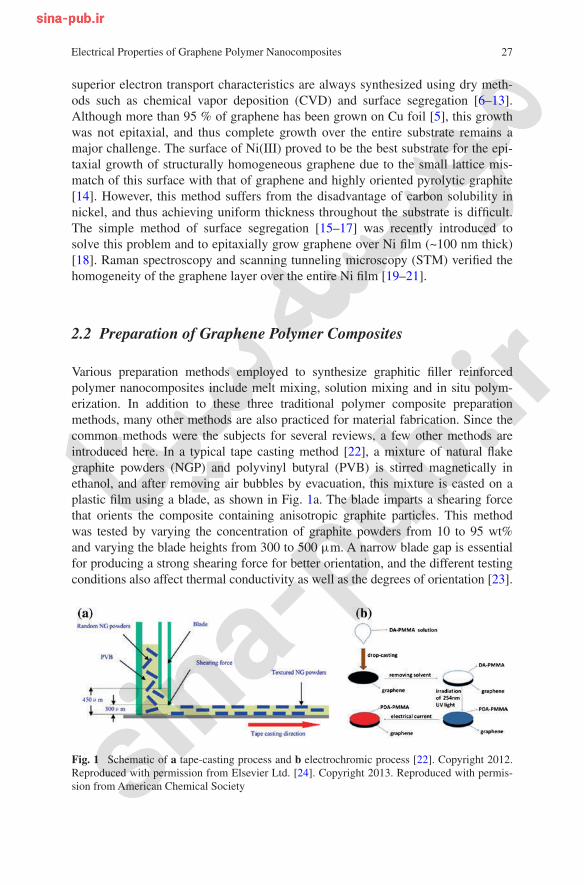
introduced here. In a typical tape casting method [22], a mixture of natural flake
graphite powders (NGP) and polyvinyl butyral (PVB) is stirred magnetically in
ethanol, and after removing air bubbles by evacuation, this mixture is casted on a
plastic film using a blade, as shown in Fig. 1a. The blade imparts a shearing force
that orients the composite containing anisotropic graphite particles. This method
was tested by varying the concentration of graphite powders from 10 to 95 wt%
and varying the blade heights from 300 to 500 µm. A narrow blade gap is essential
for producing a strong shearing force for better orientation, and the different testing
conditions also affect thermal conductivity as well as the degrees of orientation [23].
Fig. 1 Schematic of a tape-casting process and b electrochromic process [22]. Copyright 2012.
Reproduced with permission from Elsevier Ltd. [24]. Copyright 2013. Reproduced with permis-
sion from American Chemical Society
28 P.N. Khanam et al.
In another preparation process, polydiacetylene (PDA)-Polymethylmethacrylate
(PMMA)/graphene composites were developed that are capable of respond-
ing to electrical current with a color change. In the so-called electrochromic
method (Fig. 1b), PDA acts as the electrochromic material and the graphene pro-
vides conductivity. The PMMA serves as the inert polymer matrix and improves
the mechanical properties and colorimetric phenomenon. The blue-red phase
transition is clearly visible in PDA-PMMA/graphene compared with that of
PDA/graphene. The critical current for the color transition can be varied with the
amount of graphene [24].
Mixing of functionalized GO with epoxy resin by sonication transfers the
modified GO particles from the water to the epoxy. This is yet another fabrica-
tion method practiced. After decanting the water, heating the mixture forms a dark
violet epoxy-modified GO composite, and the epoxy can be cured by adding hard-
ener. The calculated volume fractions of functionalized GO in the final composites
were 1.16 and 2.2 g/cm3, respectively [25]. Copper oxide nanoparticle/graphene
(CuO-GR) nanocomposites were prepared using GO synthesized by Hummers
method. The copper-acetate-adsorbed GO acts as a precursor. The GO was
washed with de-ionized water to remove the remaining metal ions and acid, and a
copper(II) nitrate aqueous solution was added. Again, ammonium hydroxide was
added under magnetic stirring, and the mixture was transferred to an autoclave at
100 °C. The black CuO-GR nanocomposites formed were washed with distilled
water and ethanol [26].
2.3 Characterization of Polymer Nanocomposites
Many important characteristic techniques reveal the morphology, structure and
superior properties of graphitic fillers and their polymer composites. Of the vari-
ous characterization techniques, three important methods of analysis for the
materials are explained in this section- X-ray diffraction spectroscopy (XRD),
Fourier Transformation Infrared (FTIR) Spectroscopy and Raman spectroscopy.
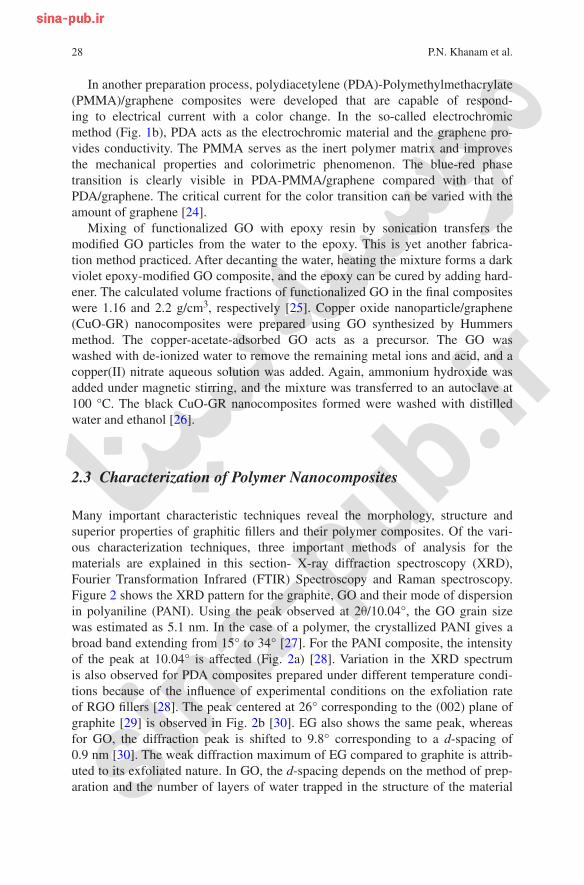
Figure 2 shows the XRD pattern for the graphite, GO and their mode of dispersion
in polyaniline (PANI). Using the peak observed at 2θ/10.04°, the GO grain size
was estimated as 5.1 nm. In the case of a polymer, the crystallized PANI gives a
broad band extending from 15° to 34° [27]. For the PANI composite, the intensity
of the peak at 10.04° is affected (Fig. 2a) [28]. Variation in the XRD spectrum
is also observed for PDA composites prepared under different temperature condi-
tions because of the influence of experimental conditions on the exfoliation rate
of RGO fillers [28]. The peak centered at 26° corresponding to the (002) plane of
graphite [29] is observed in Fig. 2b [30]. EG also shows the same peak, whereas
for GO, the diffraction peak is shifted to 9.8° corresponding to a d-spacing of
0.9 nm [30]. The weak diffraction maximum of EG compared to graphite is attrib-
uted to its exfoliated nature. In GO, the d-spacing depends on the method of prep-
aration and the number of layers of water trapped in the structure of the material
29Electrical Properties of Graphene Polymer Nanocomposites
[30]. Functionalised graphene sheets (FGS) show no characteristic peak indicating
the loss of long-range stacking order in the material. Also in the graphene case, the
Bragg peak is totally absent because pure graphene contains no stacks.
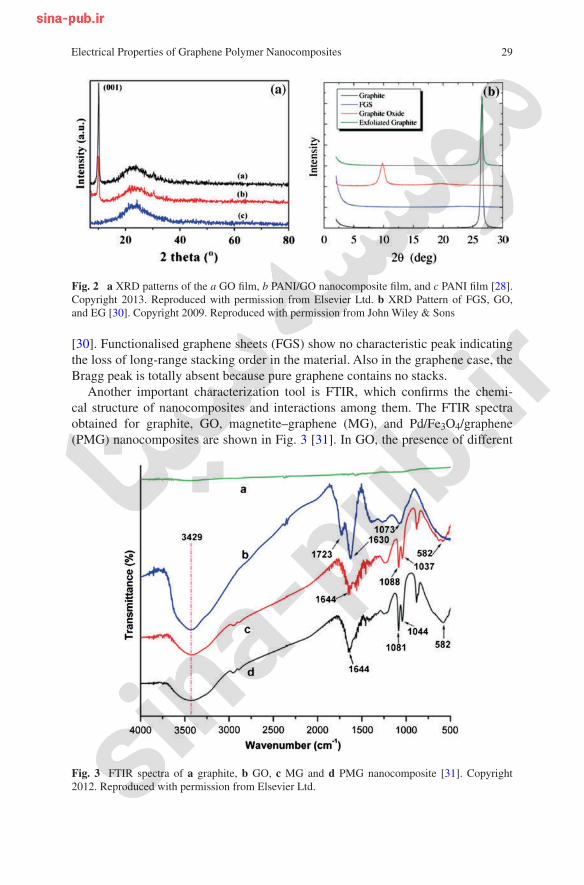
Another important characterization tool is FTIR, which confirms the chemi-
cal structure of nanocomposites and interactions among them. The FTIR spectra
obtained for graphite, GO, magnetite–graphene (MG), and Pd/Fe3O4/graphene
(PMG) nanocomposites are shown in Fig. 3 [31]. In GO, the presence of different
Fig. 2 a XRD patterns of the a GO film, b PANI/GO nanocomposite film, and c PANI film [28].
Copyright 2013. Reproduced with permission from Elsevier Ltd. b XRD Pattern of FGS, GO,
and EG [30]. Copyright 2009. Reproduced with permission from John Wiley & Sons
Fig. 3 FTIR spectra of a graphite, b GO, c MG and d PMG nanocomposite [31]. Copyright
2012. Reproduced with permission from Elsevier Ltd.
30 P.N. Khanam et al.
types of oxygen functionalities are confirmed as evidenced from the bands at
3,429, 1,723, 1,630, 1,618 and 1,073 cm−1 corresponding to the O–H groups,
C = O carbonyl/carboxyl groups, C = C aromatic groups and C–O in the epox-
ide group, respectively [31, 32]. As a result GO interacts with metal ions and the
additional peak at 582 cm−1 in MG and PMG composites implies the formation
of Fe–O bond. The two additional peaks at 1,037 and 1,088 cm−1 for MG and at
1,044 cm−1 for PMG corresponds to distinct C–O stretching vibrations, involv-
ing the formation of metal nanoparticles by binding C–O with different metal
ions [31].
In general RGO, the intensity of the O–H band at 3,430 cm−1 was reduced due
to the de-oxygenation of the GO functionalities. For the RGO-(PMMA) nanocom-
posites obtained from the in situ method, the bands present at 3,420, 1,726 and
1,620 cm−1 are due to the presence of O–H, C = O and C = C groups, respectively
[33]. When GO-PMMA is reduced in the case of R-(GO-PMMA), the intensity of
the C = C bands increases, whereas that of the C = O band decreases.
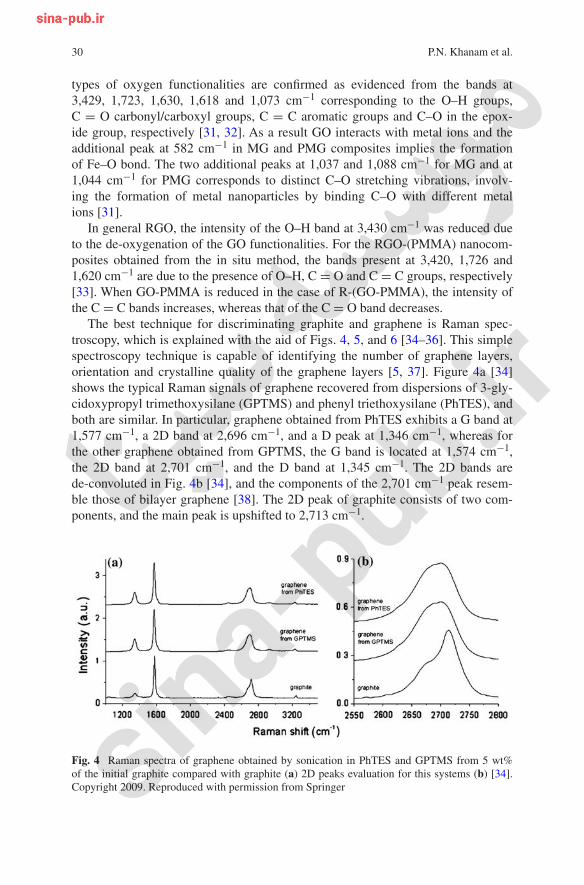
The best technique for discriminating graphite and graphene is Raman spec-
troscopy, which is explained with the aid of Figs. 4, 5, and 6 [34–36]. This simple
spectroscopy technique is capable of identifying the number of graphene layers,
orientation and crystalline quality of the graphene layers [5, 37]. Figure 4a [34]
shows the typical Raman signals of graphene recovered from dispersions of 3-gly-
cidoxypropyl trimethoxysilane (GPTMS) and phenyl triethoxysilane (PhTES), and
both are similar. In particular, graphene obtained from PhTES exhibits a G band at
1,577 cm−1, a 2D band at 2,696 cm−1, and a D peak at 1,346 cm−1, whereas for
the other graphene obtained from GPTMS, the G band is located at 1,574 cm−1,
the 2D band at 2,701 cm−1, and the D band at 1,345 cm−1. The 2D bands are
de-convoluted in Fig. 4b [34], and the components of the 2,701 cm−1 peak resem-
ble those of bilayer graphene [38]. The 2D peak of graphite consists of two com-
ponents, and the main peak is upshifted to 2,713 cm−1.
Fig. 4 Raman spectra of graphene obtained by sonication in PhTES and GPTMS from 5 wt%
of the initial graphite compared with graphite (a) 2D peaks evaluation for this systems (b) [34].
Copyright 2009. Reproduced with permission from Springer
31Electrical Properties of Graphene Polymer Nanocomposites
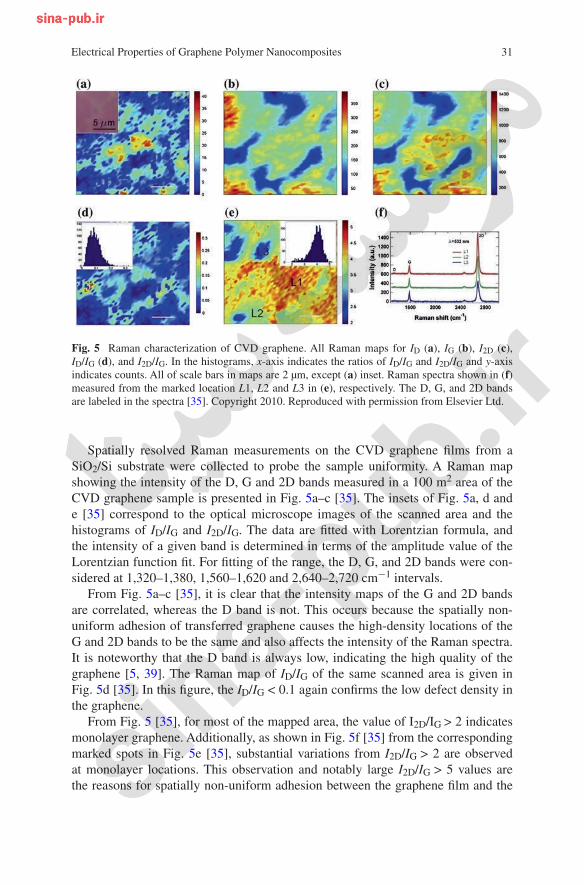
Spatially resolved Raman measurements on the CVD graphene films from a
SiO2/Si substrate were collected to probe the sample uniformity. A Raman map
showing the intensity of the D, G and 2D bands measured in a 100 m2 area of the
CVD graphene sample is presented in Fig. 5a–c [35]. The insets of Fig. 5a, d and
e [35] correspond to the optical microscope images of the scanned area and the
histograms of ID/IG and I2D/IG. The data are fitted with Lorentzian formula, and
the intensity of a given band is determined in terms of the amplitude value of the
Lorentzian function fit. For fitting of the range, the D, G, and 2D bands were con-
sidered at 1,320–1,380, 1,560–1,620 and 2,640–2,720 cm−1 intervals.
From Fig. 5a–c [35], it is clear that the intensity maps of the G and 2D bands
are correlated, whereas the D band is not. This occurs because the spatially non-
uniform adhesion of transferred graphene causes the high-density locations of the
G and 2D bands to be the same and also affects the intensity of the Raman spectra.
It is noteworthy that the D band is always low, indicating the high quality of the
graphene [5, 39]. The Raman map of ID/IG of the same scanned area is given in
Fig. 5d [35]. In this figure, the ID/IG < 0.1 again confirms the low defect density in
the graphene.
From Fig. 5 [35], for most of the mapped area, the value of I2D/IG > 2 indicates
monolayer graphene. Additionally, as shown in Fig. 5f [35] from the corresponding
marked spots in Fig. 5e [35], substantial variations from I2D/IG > 2 are observed
at monolayer locations. This observation and notably large I2D/IG > 5 values are
the reasons for spatially non-uniform adhesion between the graphene film and the
Fig. 5 Raman characterization of CVD graphene. All Raman maps for ID (a), IG (b), I2D (c),
ID/IG (d), and I2D/IG. In the histograms, x-axis indicates the ratios of ID/IG and I2D/IG and y-axis
indicates counts. All of scale bars in maps are 2 µm, except (a) inset. Raman spectra shown in (f)
measured from the marked location L1, L2 and L3 in (e), respectively. The D, G, and 2D bands
are labeled in the spectra [35]. Copyright 2010. Reproduced with permission from Elsevier Ltd.
32 P.N. Khanam et al.
underlying SiO2 substrate [40]. The adhesion can significantly affect the G and
1D band but to different extents. Quantum Hall measurements also support the
presence of monolayer graphene [41]. In short, Fig. 5 provides information on the
high quality and uniform monolayers of CVD-grown graphene films.
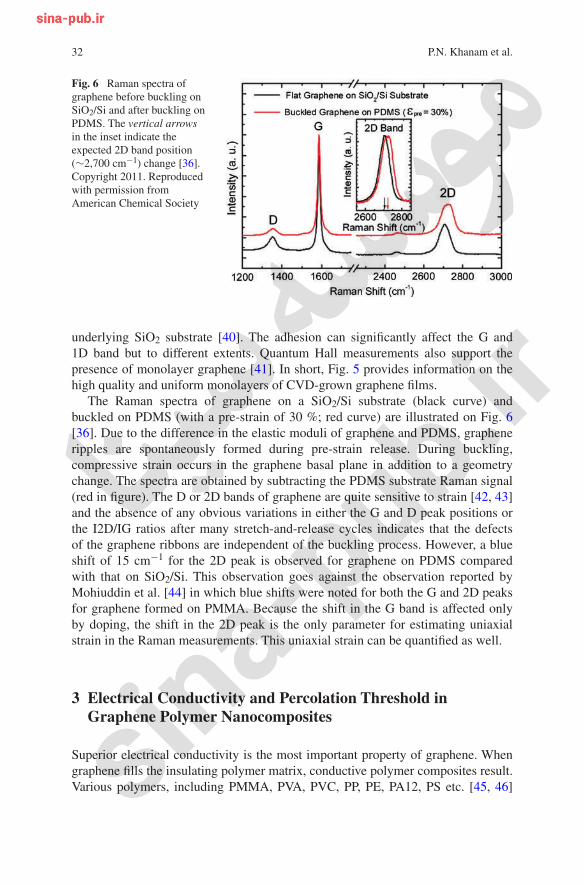
The Raman spectra of graphene on a SiO2/Si substrate (black curve) and
buckled on PDMS (with a pre-strain of 30 %; red curve) are illustrated on Fig. 6
[36]. Due to the difference in the elastic moduli of graphene and PDMS, graphene
ripples are spontaneously formed during pre-strain release. During buckling,
compressive strain occurs in the graphene basal plane in addition to a geometry
change. The spectra are obtained by subtracting the PDMS substrate Raman signal
(red in figure). The D or 2D bands of graphene are quite sensitive to strain [42, 43]
and the absence of any obvious variations in either the G and D peak positions or
the I2D/IG ratios after many stretch-and-release cycles indicates that the defects
of the graphene ribbons are independent of the buckling process. However, a blue
shift of 15 cm−1 for the 2D peak is observed for graphene on PDMS compared
with that on SiO2/Si. This observation goes against the observation reported by
Mohiuddin et al. [44] in which blue shifts were noted for both the G and 2D peaks
for graphene formed on PMMA. Because the shift in the G band is affected only
by doping, the shift in the 2D peak is the only parameter for estimating uniaxial
strain in the Raman measurements. This uniaxial strain can be quantified as well.
3 Electrical Conductivity and Percolation Threshold in
Graphene Polymer Nanocomposites
Superior electrical conductivity is the most important property of graphene. When
graphene fills the insulating polymer matrix, conductive polymer composites result.
Various polymers, including PMMA, PVA, PVC, PP, PE, PA12, PS etc. [45, 46]
Fig. 6 Raman spectra of
graphene before buckling on
SiO2/Si and after buckling on
PDMS. The vertical arrows
in the inset indicate the
expected 2D band position
(∼2,700 cm−1) change [36].
Copyright 2011. Reproduced
with permission from
American Chemical Society
33Electrical Properties of Graphene Polymer Nanocomposites
have been used as matrices to prepare electrically conductive graphene/polymer
composites. Such composite materials generally exhibit a non-linear increase of the
electrical conductivity as a function of the filler concentration. The two parameters,
electrical conductivity and percolation threshold are together associated with. At a
certain filler loading fraction, which is known as the percolation threshold (pc), the
fillers form a network leading to a sudden rise in the electrical conductivity of the
composites [45, 46]. Sometimes addition of a very low amount of conducting parti-
cles can make filler contact to form effective conducting paths and thus making the
whole composite conductive.
A theoretical study by Xie et al. [47] predicted that graphene is more effec-
tive for conductivity improvement than competing nanofillers such as CNTs
because of their large specific surface area. An outstanding electrically conduc-
tive graphene/polymer composite is expected to have lower percolation threshold
and higher conductivity at a lower graphene loading, which can not only decrease
the cost of filler but also preserve the processability of the composite. Ruoff et al.
[48] synthesized graphene/PS composites and they observed a low percolation
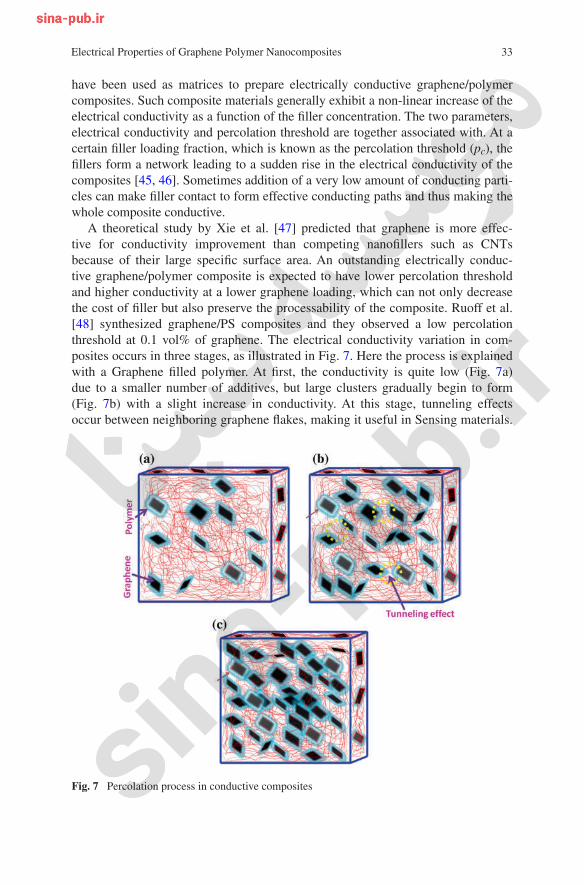
threshold at 0.1 vol% of graphene. The electrical conductivity variation in com-
posites occurs in three stages, as illustrated in Fig. 7. Here the process is explained
with a Graphene filled polymer. At first, the conductivity is quite low (Fig. 7a)
due to a smaller number of additives, but large clusters gradually begin to form
(Fig. 7b) with a slight increase in conductivity. At this stage, tunneling effects
occur between neighboring graphene flakes, making it useful in Sensing materials.
Fig. 7 Percolation process in conductive composites
34 P.N. Khanam et al.
As the graphene flakes increases, a complete conductive path (red) is formed
by the contacting flakes (Fig. 7c) at the percolation, and further increase in the
conducting particles enhances the number of conducting networks, as shown in
Fig. 7c, until the conductivity levels off [49].
This explanation based on the way those nanoparticles form conducting net-
work when dispersed in polymer matrix is called percolation theory. Various
factors influence the electrical conductivity and the percolation threshold of the
composites such as concentration of filler, aggregation of filler, processing meth-
ods, functionalization and aspect ratio of graphene sheets, inter-sheet junction,
distribution in the matrix, wrinkles and folds etc. A more detailed study of these
factors is done in the subsequent sections.
3.1 Effect of Graphene Concentration
In nanocomposites containing conducting fillers conduction takes place via tun-
neling between the thin polymer layers surrounding the filler particles, and this
tunneling resistance is said to be the limiting factor in the composite conductiv-
ity. So in order to get a current flow in the composite, the direct contact between
the filler is not necessary. However percolation of filler particles occurs and this
enhances the electrical conductivity. The concentration of the filler for creating the
percolation threshold varies from polymer to polymer. For instance Liang et al.
reported a very low percolation threshold of 0.1 vol% for the solution-processa-
ble functionalized graphene filled epoxy composites compared to the percolation
of 0.53 vol% for the neat graphene/epoxy nanocomposite [50]. For the graphene/
ultra high molecular weight polyethylene composite, the percolation threshold
was 0.070 vol% [51]. The graphene/polyethylene terephthalate (PET) nanocom-
posite [52] fabricated by melt compounding exhibited a percolation at 0.47 vol%.
Kim et al. [53] reported lower percolation threshold of <0.5 vol% for TRGO
while >2.7 vol% for graphite.
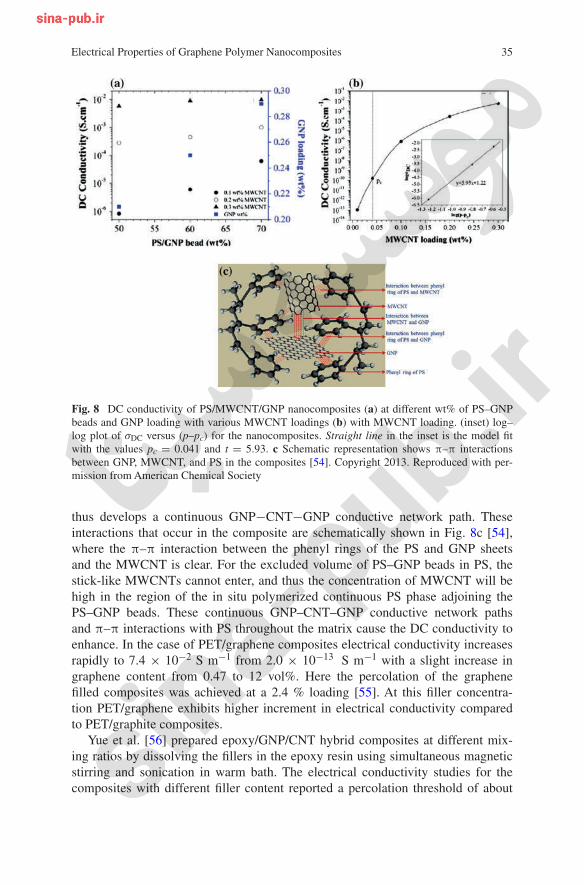
The synergy between MWCNTs and GNPs is successfully used to fabricate
their polystyrene (PS) composites exhibiting a good response in terms of its DC
conductivity value. Figure 8 illustrates the room temperature conductivity of
PS/MWCNT/GNP nanocomposites prepared by in situ suspension polymerization
of PS−GNP beads (50, 60 and 70 wt%) and MWCNT (0.1, 0.2 and 0.3 wt%). The
increase in weight percent of both PS−GNP beads increased the conductivity of
the composites, as shown in the figure [54].
The maximum electrical conductivity of ∼9.47 × 10⁻³ S cm−1 is obtained
in the case of PS–GNP (70 wt%) beads polymerized with 30 wt% PS-MWCNT
containing 0.3 wt% MWCNT loading. Similar to the previous case, PS/MWCNT
without PS–GNP beads was non-conducting with a 0.1 wt% loading of MWCNT.
However, in situ polymerization of styrene−MWCNT in the presence of 50 wt%
PS–GNP showed a conductivity value of ∼8.26 × 10⁻⁷ S cm−1. The MWCNT
concentration in the in situ polymerized PS increases if PS−GNP is present and
35Electrical Properties of Graphene Polymer Nanocomposites
thus develops a continuous GNP−CNT−GNP conductive network path. These
interactions that occur in the composite are schematically shown in Fig. 8c [54],
where the π–π interaction between the phenyl rings of the PS and GNP sheets
and the MWCNT is clear. For the excluded volume of PS–GNP beads in PS, the
stick-like MWCNTs cannot enter, and thus the concentration of MWCNT will be
high in the region of the in situ polymerized continuous PS phase adjoining the
PS–GNP beads. These continuous GNP–CNT–GNP conductive network paths
and π–π interactions with PS throughout the matrix cause the DC conductivity to
enhance. In the case of PET/graphene composites electrical conductivity increases
rapidly to 7.4 × 10⁻² S m−1 from 2.0 × 10⁻¹³ S m−1 with a slight increase in
graphene content from 0.47 to 12 vol%. Here the percolation of the graphene
filled composites was achieved at a 2.4 % loading [55]. At this filler concentra-
tion PET/graphene exhibits higher increment in electrical conductivity compared
to PET/graphite composites.
Yue et al. [56] prepared epoxy/GNP/CNT hybrid composites at different mix-
ing ratios by dissolving the fillers in the epoxy resin using simultaneous magnetic
stirring and sonication in warm bath. The electrical conductivity studies for the
composites with different filler content reported a percolation threshold of about
Fig. 8 DC conductivity of PS/MWCNT/GNP nanocomposites (a) at different wt% of PS–GNP
beads and GNP loading with various MWCNT loadings (b) with MWCNT loading. (inset) log–
log plot of σDC versus (p–pc) for the nanocomposites. Straight line in the inset is the model fit
with the values pc = 0.041 and t = 5.93. c Schematic representation shows π–π interactions
between GNP, MWCNT, and PS in the composites [54]. Copyright 2013. Reproduced with per-
mission from American Chemical Society
36 P.N. Khanam et al.
0.84 % for the CNT and 0.88 wt% for the GNP single filler epoxy composites.
At 4 wt% the GNP/epoxy nanocomposite shows an electrical conductivity of
2.1 × 10⁻⁵ S m−1 which is almost 7 times the conductivity of neat epoxy. This
substantiates GNP’s excellent capacity in conduction at low concentration and
good conductivity network was formed for both filler systems at low filler con-
centration. Low percolation threshold of graphene is also observed at 0.1 vol%
for PS/graphene composites [48]. Moreover in RGO filled PVC/vinyl acetate
copolymer composite and in PET composite the percolation values were 0.15
and 0.47 vol% respectively [46]. This is concluded to be due to the large surface
area of graphene and also filler/matrix interaction mediated by surface functional
groups of graphene which has a moderate role in this operation.
3.2 Effect of Fabrication Process
The mode of synthesis of graphene filled composites influence the filler distribu-
tion within the polymer matrix and thus regulate the electrical conductivity. It is
reported that the electrical conductivity is higher for in situ polymerized and solvent
blended samples than melt blended at the same filler volume fraction. This indi-
cates better dispersion from solvent based strategies [46]. However the conductivity
observed for melt processed samples is attributed to the annealing happened during
the process by which particles disorient and regain contacts between one another.
The static and electrical conductivity of the polyvinylidene difluoride (PVDF)
composites containing two different fillers, solvothermally reduced graphene
(SRG) and RGO were checked and a lower percolation threshold was observed for
the SRG/PVDF composites [57, 58] compared to the graphene/PVDF composite
prepared by direct blending of chemically/thermally reduced GO sheets with poly-
mers [59]. In the composite [57] the SRG sheets were homogeneously dispersed,
which is attributed to the low pc value. Additionally, the SRGs remain stable in the
PVDF solution for weeks, whereas without PVDF, they precipitate in dymethyl
formamide (DMF) after 1 day. During the fabrication step of the solvothermal pro-
cess, the GO sheets enclosed by the PVDF chains were reduced and did not fold
easily or form aggregates. This behavior facilitated the formation of a conducting
network and resulted in a low percolation threshold. The large aspect ratios of the
SRGs make the percolation threshold even smaller and its value calculated math-
ematically yield a percolation value at 0.31 vol%. Equation 1 gives the mathemati-
cal formula used for calculating the percolation threshold.
where pc is the percolation threshold, p is the filler content, and t is the critical
exponent.
It is found that at 2.2 wt% RGO, the electrical conductivity of the RGO-filled
PVDF increases enormously to 0.04 S m−1, which is 14 orders of magnitude
higher than that of neat PVDF. However at high concentrations of RGO, con-
ductivity was notably low due to poor dispersion of the nanofiller in the polymer.
(1)σ(p) = σ0(P − P0)t, for P > Pc
37Electrical Properties of Graphene Polymer Nanocomposites
Once percolation is achieved, the RGO-PVDF shows high conductivity, and this
material finds many electrical applications. The electrical conductivities of the
RGO-PVDF composite again increase with the amount of RGOs due to the above-
mentioned conductivity and percolation effects. He et al. [57] reported a very low
percolation threshold of 0.31 vol% for the chemically reduced GO filled PVDF
prepared by direct blending, which is lower than that of graphene/PVDF compos-
ites due to the homogeneous graphene dispersion achieved in the former case.
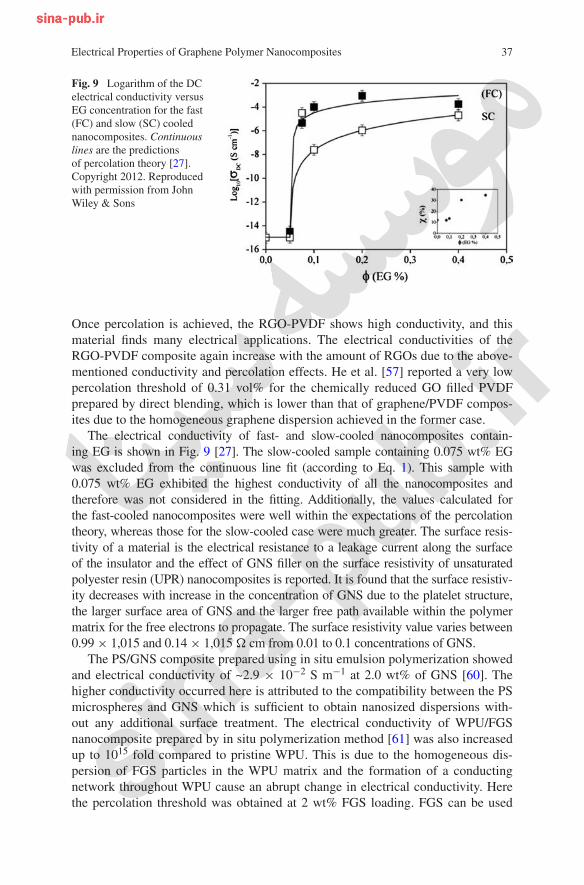
The electrical conductivity of fast- and slow-cooled nanocomposites contain-
ing EG is shown in Fig. 9 [27]. The slow-cooled sample containing 0.075 wt% EG
was excluded from the continuous line fit (according to Eq. 1). This sample with
0.075 wt% EG exhibited the highest conductivity of all the nanocomposites and
therefore was not considered in the fitting. Additionally, the values calculated for
the fast-cooled nanocomposites were well within the expectations of the percolation
theory, whereas those for the slow-cooled case were much greater. The surface resis-
tivity of a material is the electrical resistance to a leakage current along the surface
of the insulator and the effect of GNS filler on the surface resistivity of unsaturated
polyester resin (UPR) nanocomposites is reported. It is found that the surface resistiv-
ity decreases with increase in the concentration of GNS due to the platelet structure,
the larger surface area of GNS and the larger free path available within the polymer
matrix for the free electrons to propagate. The surface resistivity value varies between
0.99 × 1,015 and 0.14 × 1,015 Ω cm from 0.01 to 0.1 concentrations of GNS.
The PS/GNS composite prepared using in situ emulsion polymerization showed
and electrical conductivity of ~2.9 × 10⁻² S m−1 at 2.0 wt% of GNS [60]. The
higher conductivity occurred here is attributed to the compatibility between the PS
microspheres and GNS which is sufficient to obtain nanosized dispersions with-
out any additional surface treatment. The electrical conductivity of WPU/FGS
nanocomposite prepared by in situ polymerization method [61] was also increased
up to 1015 fold compared to pristine WPU. This is due to the homogeneous dis-
persion of FGS particles in the WPU matrix and the formation of a conducting
network throughout WPU cause an abrupt change in electrical conductivity. Here
the percolation threshold was obtained at 2 wt% FGS loading. FGS can be used
Fig. 9 Logarithm of the DC
electrical conductivity versus
EG concentration for the fast
(FC) and slow (SC) cooled
nanocomposites. Continuous
lines are the predictions
of percolation theory [27].
Copyright 2012. Reproduced
with permission from John
Wiley & Sons
38 P.N. Khanam et al.
to improve the electrical conductivity of WPU as effectively as that of CNTs. The
percolation threshold observed for PVDF were 2 wt% FGS and 5 wt% EG load-
ing respectively and these nanocomposites were prepared by solution processing
and compression molding method [30]. The higher aspect ratio of FGS compared
to EG, makes better conductive network leading to a lower percolation threshold.
Polycarbonate composites reinforced with graphite and FGS produced by melt
compounding also results in high electrical conductivity with lower percolation
threshold for FGS than graphite [62].
3.3 Effect of Filler Modification
There are two factors limiting the application of graphene based polymer compos-
ites, i.e. (1) poor dispersion of graphene in the given matrix due to their high spe-
cific surface area and strong intermolecular interactions between graphene sheets
(2) at low filler content, graphene sheets are covered by polymer chains and thus
difficult to achieve the percolation. These issues can be solved by the modification
of graphene which impart the desired properties to the platelets. Generally covalent
or noncovalent functionalization is employed to increase the effective dispersion
of graphene sheets within the polymer. It is established that the chemical function-
alization facilitates the dispersion, stabilize graphene and prevent agglomeration
[63, 64]. The functional groups attached to graphene can be small molecules or
sometimes large polymer chains. The chemical functionalization of graphene is
particularly attractive as it can improve the solubility and processability as well
as enhance the interactions with organic polymers [65]. Amination, esterification
[65], isocyanate modification [66] and polymer wrapping were used in the litera-
ture for the functionalization. The electrochemical modification of graphene using
ionic liquids has also been reported [67]. Other than the covalent [65, 66] and non
covalent modifications [68], other methods such as reduction of GO in a stabilized
medium [69], nucleophilic substitution to epoxy groups [70], and diazonium salt
coupling [71] are also being practiced.
A homogeneous aqueous suspension of chemically modified graphene in water
by means of strong base reduction of graphite oxide in a stabilization medium is
reported by Park et al. [69]. Electrostatic stabilization used by Li et al. [72] ena-
bles the development of a facile approach to the large scale production of aqueous
graphene dispersions. The different surface modifying agents like organic amines,
alkyl lithium reagents, isocyanates, and diisocyanate compounds reduce the hydro-
philic character of GO sheets by forming amide and carbamate ester bonds with
the carboxyl and hydroxyl groups, respectively [66]. Graphite fluoride with alkyl
lithium reagents were used for preparation of soluble graphene layers with cova-
lent attachment of alkyl chains to the graphene layers [73].
In another work, the two dimensional GO was modified by isocyanation and
dispersed in PS using compression molding and a low percolation threshold at 0.1
vol% was achieved [48]. This value was about 3 times lower than that obtained
39Electrical Properties of Graphene Polymer Nanocomposites
for other fillers. The reasons for this high electrical conductivity is attributed to the
high aspect ratio of the graphene sheets and their homogenous dispersion in PS
as that reported for epoxy/graphene composites [3]. Conductivity of these com-
posites satisfied the approximately 0.15 vol% loading of the antistatic criterion
(10−6 S m−1) for the films. The value increased rapidly over a 0.4 vol% range
and at 2.5 vol% loading, the electrical conductivity of composites showed ~0.1 to
~1 S m−1. GNP also enhances the electrical conductivity as seen in its PS com-
posite where 0.38 vol% GNP enhance the value to 5.77 S m−1 [46]. Eda et al. pre-
pared PS/FGS composite thin films by [74] a solution blending method and the
films exhibited a semi conducting and ambipolar behavior. These composites thin
films were electrically conducting with a conductivity ranging from 1 to 24 S m−1.
The electrical conductivity of Poly Aniline (PANI), PANI/GO and
PANI/graphene prepared using the chemically modified graphene and PANI nano
fibre by in situ polymerization of aniline monomer in the presence of GO under
acidic conditions were reported to be 10.6, 23.12 and 168.7 S m−1 respectively.
The conductivity of PANI/graphene composites was slightly lower than that of the
PANI/GO composites, probably due to decrease in the degree of doping in PANI
and a change in the morphology of the composite during the reduction, reoxida-
tion and reprotanation processes [75].
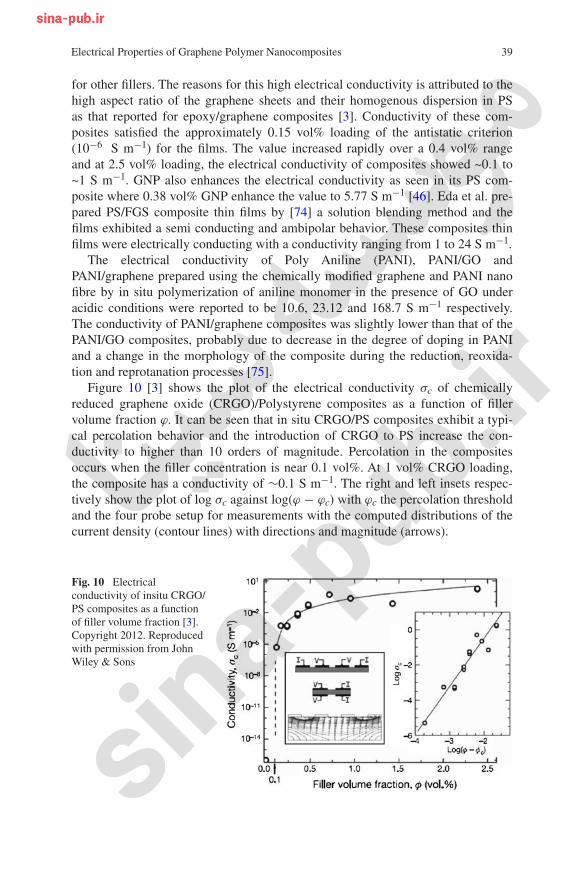
Figure 10 [3] shows the plot of the electrical conductivity σc of chemically
reduced graphene oxide (CRGO)/Polystyrene composites as a function of filler
volume fraction ϕ. It can be seen that in situ CRGO/PS composites exhibit a typi-
cal percolation behavior and the introduction of CRGO to PS increase the con-
ductivity to higher than 10 orders of magnitude. Percolation in the composites
occurs when the filler concentration is near 0.1 vol%. At 1 vol% CRGO loading,
the composite has a conductivity of ∼0.1 S m−1. The right and left insets respec-
tively show the plot of log σc against log(ϕ − ϕc) with ϕc the percolation threshold
and the four probe setup for measurements with the computed distributions of the
current density (contour lines) with directions and magnitude (arrows).
Fig. 10 Electrical
conductivity of insitu CRGO/
PS composites as a function
of filler volume fraction [3].
Copyright 2012. Reproduced
with permission from John
Wiley & Sons
40 P.N. Khanam et al.
In another work by Chen et al. the electrical properties of both CRGO and ther-
mally reduced graphene oxide (TRGO)/Poly dimethyl siloxane (PDMS) compos-
ites observed are much lower than CVD graphene/PDMS composites [76]. They
directly synthesized three-dimensional graphene by template directed CVD, in
which an interconnected flexible network of graphene exist as the fast transport
channel of charge carriers for high electrical conductivity. Even with 0.5 wt% of
graphene loading, the PDMS composite shows a very high electrical conductivity
of 1,000 S m−1, which is much higher than CRGO and TRGO/PDMS. This good
conductivity with a low graphene loading is mainly due to the high electrical con-
ductivity of CVDG and the interconnected 3D network structure in which all the
graphene sheets are in direct contact with one another without breaks.
Xu et al. [77] modified graphene via the covalent attachment of a porphyrin
ring on the GO surfaces. Thionyl chloride was used to activate the carboxylic acid
group in the presence of porphyrin using DMF. Organic isocyanates were used for
graphene modification by DMF solvent with methylene chloride and these iso-
cyanate compound was attached to the hydroxyl and carboxyl groups of GO via
the formation of carbamate and amide functionalities [66]. The lowest percolation
occurred at 0.1 vol% in situ of CRGO reported by Stankovich et al. [68] is attrib-
uted to the excellent homogeneous dispersion with solution phase mixing of exfo-
liated phenyl isocyanate-treated GO sheets with PS.
Modification of graphene was also done by nucleophilic substitution in which ali-
phatic amine was used to modify GO [68] and the substitution occurs on the epoxy
groups of GO and grafting was completed at room temperature [70]. For long chain
aliphatic amines (octadecylamine), the reaction mixture was heated under reflux for
24 h. These modified GO derivatives were dispersed more easily in organic solvents.
Bourlinos et al. [70] also used an alkaline solution of amino acids was used to mod-
ify GO. Nucleophilic attack of the –NH2 end group on the epoxide groups of GO
suggests a flat orientation of the amino acid molecules in the interlayer zone of GO.
Dodecyl benzene sulfonate was used in reduction of GO with hydrazine and func-
tionalized by a treatment with aryl diazonium salts [71]. Epitaxial graphene grown
on SiC wafers were modified chemically with aryl groups via the formation of
covalent bonds to the conjugated carbon atoms [78]. Electrochemical modification
is also employed for graphene where graphite is electrochemically treated to pro-
duce a colloidal suspension of chemically modified graphene. The pyrene treatment
done on graphene by Kim et al. reveals the capability of polycyclic aromatic hydro-
carbon, pyrene/perylene to adsorb strongly on the graphene surface through π–π
interactions [79]. As a result the conductivity was significantly improved.
Since ultrasonic treatment failed to achieve a good dispersion of graphene in
water soluble polymer in the presence of surfactants, polymeric anions were used
in the reduction which results the stable aqueous dispersion polymer-grafted dis-
persion of graphene [80]. High quality water soluble and organic solvent solu-
ble graphene sheets for a range of applications were obtained from EG using
7,7,8,8-tetracyanoquinodimethane (TCNQ) anion as a stabilizer [81]. Water solu-
ble pyrene derivative,1-pyrenebutyrate (PB) also acted as a stabilizer for the prep-
aration of aqueous dispersions of graphene sheets [82].
41Electrical Properties of Graphene Polymer Nanocomposites
3.4 Other Factors
In addition to the three factors discussed in the previous sub sections, several
miscellaneous points also influence electrical conductivity of graphene and its
derivative filled polymers. Zhang and co-workers [80] studied the effect of oxy-
gen content on graphene sheets on the electrical property of graphene-PMMA
nanocomposites. The percolation threshold increased with increasing oxygen con-
tent and the composite with lowest oxygen content (graphene-13.2) show a dra-
matic increment in electrical conductivity of over 12 orders of magnitude, from
3.33 × 10⁻¹⁴ S m−1 with 0.4 vol% of graphene to 2.38 × 10⁻² S m−1 with 0.8 %
of graphene. At 2.67 vol% the electrical conductivity reached up to 10 S m−1
indicating interconnected graphene network. Moreover the composite with low-
est oxygen content exhibited much higher conductivity, in the percolation tran-
sition range than composites with higher content of oxygen (graphene-9.6 and
graphene-5.0). The presence of oxygen-containing groups on graphene has been
proved to disrupt its graphitic sp2 network and decrease its intrinsic conductivity
leading to a final conclusion that the higher the oxygen content, the lower the
intrinsic conductivity.
Orientation of graphene platelets in polymer is another factor influencing composite
conductivity. When graphene sponge containing randomly distributed graphene sheets
are added to epoxy (insulator with conductivity around at 10−13 S cm−1) [83] the mag-
nitude of conductivity increased 12 times attributed to the compactly interconnected
graphene network constructed within the polymer. Further improvement was also
noticed upon graphene sponge treatment [84]. The filler surface area is yet another fac-
tor which causes the conductivity variation as noticed in the case of PVA/RGO nano-
composites [85]. Both large area (LRGO) and small area RGOs (SRGO) were used to
fabricate the nanocomposites and found higher electrical conductivity for PVA/LRGO
than that of SRGO at the same filler content. Percolation happened at 0.189 wt% of
filler. The conductivity increased with specific surface area as well as with the reduc-
tion temperature. Conductivity improves when thermal reduction temperature exceeds
critical temperature. Also high temperature is more efficient for reducing the GO
sheets than low temperature. The electrical conductivity increased to the highest value
at the reduction temperature 200 °C which indicating that the critical temperature for
the thermal reduction in PVA/GO system is 200 °C. Swelling was also employed to
understand the mechanism involved and found a decrease in conductivity after swell-
ing due to the destroyed conductive networks. During swelling, water molecules inter-
act between the RGO sheets and destroy the electrical networks and the conductivity is
lower for PVA/LRGO than PVA/SRGO nanocomposites after swelling. This indicates
easy destruction of the SRGO network after treatment [85].
Thermal reduction is an efficient way to produce the nanocomposite with low
percolation threshold and high electrical conductivity and also it’s suitable for pre-
paring the thermoset or thermoplastic polymer/RGO nanocomposites through reduc-
tion of GO sheets at appropriate temperature. The long reduction time improves the
electrical conductivity of nanocomposites [85]. It is reported that thermally reduced
42 P.N. Khanam et al.
GO has higher electrical conductivity than chemically reduced GO due to the
absence of oxygenated functional groups in TRGO [45, 46]. This effect of thermal
and chemical reduction of GO on the electrical properties of graphene/PU compos-
ites was studied by Kim et al. [53]. The electrical properties of graphene and graph-
ite in terms of conductivity or sheet resistance can be modulated by controlling the
number of graphene layers [86]. For this purpose, the sheet resistance values were
checked for graphene and graphite films containing different numbers of layers. The
sheet resistance was reduced by a factor of approximately 25 as the number of lay-
ers increased from 24 to 850 layers. Additionally, the current versus back-gate char-
acteristics showed much stronger modulation in 24-layer graphene compared with
a negligible change in the thick graphite (850 layers) due to the stronger screening
effect as the number of layers increases. The low sheet resistance and field-effect
response of graphite are advantageous for applications in conductive films or elec-
trodes. In contrast, the superior transconductance level of the 24-layer graphene is
appropriate for the active channels of field-effect transistors (FETs).
On the basis of the above results, we can conclude that many factors includ-
ing filler aspect ratio, surface area, concentration, dispersion state, mode of syn-
thesis and contact resistance are key factors affecting the electrical properties of
graphene/polymer composites.
4 Applications
Based on this chapter, it is clear that the reinforcement of graphene and its poly-
mer nanocomposites have shown very promising results in enhancing the electrical
conductivity at low percolation threshold. The discovery of graphene as nanofiller
has opened a new dimension for the production of light weight, low cost, and high
performance composite materials for a range of applications. The electrically con-
ductive polymer/graphene nanocomposites have been widely used for making var-
ious sensors, memory and energy storage, antistatic coatings, EMI etc. and have
potential applications in the biomedical fields, such as ultraminiaturized low cost
sensors for the analysis of blood and urine. Moreover the polymer/graphene flex-
ible electrode has some commercial applications in LEDs, transparent conducting
coatings for solar cells and displays.
5 Conclusion
The development of a nanolevel dispersion of graphene particles in a poly-
mer matrix has opened a new and interesting area in materials science in recent
years. Its unique properties make it suitable to improve the electrical properties
of polymer composites. This chapter summarizes the electrical properties of vari-
ous polymer/graphene composites and the different factors affecting electrical
43Electrical Properties of Graphene Polymer Nanocomposites
conductivity. We discussed the percolation threshold based on filler volume frac-
tion, processing methods, aspect ratio, surface area, orientation etc. In order to
improve conductivity, the dispersion of graphene in polymer matrices and the
graphene–polymer interaction needs to be improved, which are achieved by the
surface modification of graphene. Finally a few electronic applications of these
high-performance graphene composite materials is mentioned.
References
1. Huang X, Yin Z, Wu S, Qi X, He Q, Zhang Q, Yan Q, Boey F, Zhang H (2011) Graphene-
Based Materials: Synthesis, Characterization, Properties, and Applications. Small 7:
1876–1902.
2. Dong L X, Chen Q (2010) Properties, synthesis, and characterization of grapheme. Frontiers
of Materials Science in China 4: 45–51.
3. Du J, Cheng H M (2012) The Fabrication, Properties, and Uses of Graphene/Polymer
Composites. Macromolecular Chemistry and Physics 213: 1060–1077.
4. Cai W W, Piner R D, Stadermann F J, Park S, Shaibat M A, Ishii Y, Yang D X, Velamakanni
A, An S J, Stoller M, An J H, Chen D M, Ruoff R S S (2008) Synthesis and solid-state NMR
structural characterization of C-labeled graphite oxide. Science 321: 1815–1817.
5. Li X S, Cai W W, An J H, Kim S, Nah J, Yang D X, Piner R, Velamakanni A, Jung I, Tutuc
E, Banerjee S K, Colombo L, Ruoff R S (2009) Large-area synthesis of high-quality and uni-
form graphene films on copper foils. Science 324: 1312–1314.
6. Novoselov K S, Geim A K, Morozov S V, Jiang D, Zhang Y, Dubonos S V, Grigorieva I V,
Firsov A A (2004) Electric field effect in atomically thin carbon films. Science 306: 666–669.
7. Novoselov K S, Geim A K, Morozov S V, Jiang D, Katsnelson M I, Grigorieva I V, Dubonos
S V, Firsov A A (2005) Two-dimensional gas of massless Dirac fermions in grapheme.
Nature 438: 197–200.
8. Zhang Y, Tan Y W, Stormer H L, Kim P (2005) Experimental observation of the quantum
Hall effect and Berry’s phase in grapheme. Nature 438: 201–204.
9. Geim A K, Novoselov K S (2007) The rise of graphene. Nature Mater 6: 183–191.
10. Dreyer D R, Ruoff R S, Bielawski C W (2010) From conception to realization: an historial
account of graphene and some perspectives for its future. Agnewandle Chemie International
Edition 49: 9336–9345.
11. Boehm H P, Setton R, Stumpp E (1986) Nomenclature and terminology of graphite intercala-
tion compounds. Carbon 24: 241–245.
12. Novoselov K S, Jiang D, Schedin F, Booth T, Khotkevich V V, Morozov S V, Geim A K
(2005) Two-dimensional atomic crystals. Procedings of the National Academy of Sciences
102: 10451–10453.
13. Park S, Ruoff R S (2009) Chemical methods for the production of graphenes. Nature
Nanotechnology 4: 217–224.
14. Fujita D, Yoshihara K(1994) Surface precipitation process of epitaxially grown graphite
(0001) layers on carbon‐doped nickel(III) surface. J Vac Sci Technol A 1994, 12, 2134–2139.
15. Gao J H, Fujita D, Xu M S (2010) Unique synthesis of few-layer graphene films on carbon-
doped Pt83Rh17 surfaces. ACS Nano 4: 1026–1032.
16. Xu M S, Fujita D, Chen H Z, Hanagata N(2011) Formation of monolayer and few-layer hex-
agonal boron nitride nanosheets via surface segregation. Nanoscale 3: 2854–2858.
17. Fujita D (2011) Nanoscale synthesis and characterization of graphene-based objects. Science
and Technology of Advanced Materials 12: 044611 (1–10).
18. Xu M S, Fujita D, Sagisaka K, Watanable E, Hanagata N (2011) Production of extended sin-
gle-layer graphene. ACS Nano 5: 1522–1528.
44 P.N. Khanam et al.
19. Xu M S, Endres R G, Tsukamoto S, Kitamura M, Ishida S, Arakawa Y (2005) Conformation
and local environment dependent conductance of DNA molecules. Small 1: 1168–1172.
20. Xu M S, Tsukamoto S, Ishida S, Kitamura M, Arakawa Y, Endres R G, Shimoda M (2005)
Conductance of single thiolated poly(GC)-poly(GC) DNA molecules. Applied Physics
Letters 87: 083902 (1–3).
21. Merino P, Svec M, Pinardi A L, Otero G, Martin-Gago J A (2011) Strain-driven moiré super-
structures of epitaxial graphene on transition metal surfaces. ACS Nano 5: 5627–5634.
22. Zhou S X, Zhu Y, Du H D, Li B H, Kang F Y (2012) Preparation of oriented graphite/poly-
mer composite sheets with high thermal conductivities by tape casting. New Carbon Mater
27: 241–249.
23. Zhou S, Chiang S, Xu J, Du H, Li B, Xu C, Kang F (2012) Modeling the in-plane thermal
conductivity of a graphite/polymer composite sheet with a very high content of natural flake
graphite. Carbon 50: 5052–5061.
24. Zhang W, Xu H, Chen Y, Cheng S, Fan L (2013) Polydiacetylene-polymethylmethacrylate/
graphene composites as one-shot, visually observable, and semiquantative electrical current
sensing materials. ACS Applied Materials & Interfaces 5: 4603–4606.
25. Gudarzi M M, Sharif F (2012) Enhancement of dispersion and bonding of graphene-
polymer through wet transfer of functionalized graphene oxide. Express Polymer Letters
6: 1017–1031.
26. Yu H Y, Xu M Q, Yu S H, Zhao G C (2013) A novel non-enzymatic glucose sensor based
on CuO - graphene nanocomposites. International Journal of Electrochemical Science
8: 8050–8057.
27. Paszkiewicz S, Szymczyk A, Spitalsky S, Soccio M, Mosnacek J, Ezquerra T A, Roslaniec
Z (2012) Electrical conductivity of poly(ethylene terephthalate)/expanded graphite nano-
composites prepared by in situ polymerization. Journal of Polymer Science Part B: Polymer
Physics 50: 1645–1652.
28. Wei H, Zhu J, Wu S, Wei S, Guo Z (2013) Electrochromic polyaniline/graphite oxide nano-
composites with endured electrochemical energy storage. Polymer 54: 1820–1831.
29. Chen G L, Shau S M, Juang T Y, Lee R H, Chen C P, Suen S Y, Jeng R J (2011) Single-
layered graphene oxide nanosheet/polyaniline hybrids fabricated through direct molecular
exfoliation. Langmuir 27: 14563–14569.
30. Ansari S, Emmanuel P G (2009) Functionalized graphene sheet-poly(vinylidene fluo-
ride) conductive nanocomposites. Journal of Polymer Science Part B: Polymer Physics 47:
888–897.
31. Chandra S, Bag S, Das P, Bhattacharya D, Pramanik P (2012) Fabrication of magnetically
separable palladium–graphene nanocomposite with unique catalytic property of hydrogena-
tion. Chemical Physics Letters 519: 59–63.
32. Matusinovic Z, Rogosic M, Sipusic J (2009) Synthesis and characterization of poly(styrene-
co-methyl methacrylate)/layered double hydroxide nanocomposites via in situ polymeriza-
tion. Polymer Degradation and Stability 94: 95–101.
33. Aldosari M, Othman A, Alsharaeh E (2013) Synthesis and characterization of the in situ
bulk polymerization of PMMA containing graphene sheets using microwave irradiation.
Molecules 18: 3152–3167 (3).
34. Nuvoli D, Alzari V, Sanna R, Scognamillo S, Piccinini M, Peponi L, Kenny J M, Mariani A
(2012) The production of concentrated dispersions of few-layer graphene by the direct exfo-
liation of graphite in organosilanes. Nanoscale Research Letters 7: 674 (1–7).
35. Wu W, Liu Z, Jauregui L A, Yu Q, Pillai R, Cao H, Bao J, Chen Y P, Pei S S (2010) Wafer-
scale synthesis of graphene by chemical vapor deposition and its application in gas sensing.
Sensors and Actuators B 150: 296–300.
36. Wang Y, Yang R, Shi Z, Zhang L, Shi D, Wang E, Zhang G (2011) Super-elastic graphene
ripples for flexible strain sensors. ACS Nano 5: 3645–3650.
37. Sojoudi H, Graham S (2013) Transfer-free selective area synthesis of graphene using
solid-state self-segregation of carbon in Cu/Ni bilayers. ECS Journal of Solid State
Science and Technology 2: M17–M21.
45Electrical Properties of Graphene Polymer Nanocomposites
38. Kim K S, Zhao Y, Jang H, Lee S Y, Kim J M, Kim K S, Ahn J H, Kim P, Choi J Y, Hong B
H (2009) Large-scale pattern growth of graphene films for stretchable transparent electrodes.
Nature 457: 706–710.
39. Reina A, Jia X T, Ho J, Nezich D, Son H B, Bulovic V, Dresselhaus M S, Kong J (2009)
Large area, few-layer graphene films on arbitrary substrates by chemical vapor deposition.
Nano Letters 9: 30–35.
40. Berciaud S, Ryu S, Brus L E, Heinz T F (2009) Probing the intrinsic properties of exfoliated
graphene: Raman spectroscopy of free-standing monolayers. Nano Letters 9: 346–352.
41. Cao H, Yu Q, Jauregui L A, Tian J, Wu W, Liu Z, Jalilian R, Benjamin D K, Jiang Z, Bao J, Pei
S S, Chen Y P (2010) Electronic transport in chemical vapor deposited graphene synthesized
on Cu: quantum Hall effect and weak localization. Applied Physics Letters 96: 122106 (1–3).
42. Ferrari A C, Meyer J C, Scardaci V, Casiraghi C, Lazzeri M, Mauri F S, Piscanec F S, Jiang
D, Novoselov K S, Roth S, Geim A K (2006) Raman spectrum of graphene and graphene
layers. Physical Review Letters 97: 187401 (1–4).
43. Peng Xu, James Loomis, and Balaji Panchapakesana. load transfer and mechanical proper-
ties of chemically derived single layer graphene reinforcements in polymer composites.
Nanotechnology. 2012 December 21; 23(50): 505713
44. Mohiuddin T M G, Lombardo A, Nair R R, Bonetti A, Savini G, Jalil R, Bonini N, Basko D
M, Galiotis C, Marzari N, Novoselov K S, Geim A K, Ferrari A C (2009) Uniaxial strain in
graphene by Raman spectroscopy: G peak splitting, Grüneisen parameters, and sample orien-
tation. Physical Review B 79: 205433.
45. Galpaya D, Wang M, Liu M, Motta N, Waclawik E, Yan C (2012) Recent advances in fabri-
cation and characterization of graphene-polymer nanocomposites. Graphene 1: 30–49
46. Kuilla T, Bhadrab S, Yao D, Kim N H, Bose S, Lee J H (2010) Recent advances in graphene
based polymer composites. Progress in Polymer Science 35: 1350–1375
47. Xie S H, Liu Y Y, Li J Y (2008) Comparison of the effective conductivity between compos-
ites reinforced by graphene nanosheets and carbon nanotubes. Applied Physics Letters 92 :
243121 (1–3).
48. Stankovich S, Dikin D A, Dommett G H B, Kohlhaas K M, Zimney E J, Stach E A, Piner R
D, Nguyen S T, Ruoff R S (2006) Graphene-based composite materials. Nature 442: 282–286.
49. Alamusi N H, Hisao F, Satoshi A, Yaolu L, Jinhua L (2011) Piezoresistive strain sensors
made from carbon nanotubes based polymer nanocomposites. Sensor 11: 10691–10723.
50. Liang J J, Wang Y, Huang Y, Ma Y, Liu Z, Cai J, Zhang C, Gao H, Chen Y (2009)
Electromagnetic interference shielding of graphene/epoxy composites. Carbon 47: 922–925.
51. Pang H, Chen T, Zhang G, Zeng B, Li Z M (2010) An electrically conducting polymer/graphene
composite with a very low percolation threshold. Materials Letters 64: 2226–2229.
52. Zhang H B, Zheng W G, Yan Q, Yang Y, Wang J W, Lu Z H, Ji G Y, Yu Z Z (2010)
Electrically conductive polyethylene terephthalate/graphene nanocomposites prepared by
melt compounding. Polymer 51: 1191–1196.
53. Kim H, Y. Miura Y, Macosko C W (2010) Graphene/Poly- urethane Nanocomposites for
Improved Gas Barrier and Electrical Conductivity. Chemistry of Materials 22: 3441–3450.
54. Maiti S, Shrivastava N K, Suin S, Khatua B B (2013) Polystyrene/MWCNT/graphite nan-
oplate nanocomposites: efficient electromagnetic interference shielding material through
graphite nanoplate–MWCNT–graphite nanoplate networking. ACS Applied Materials
& Interfaces 5: 4712–4724.
55. Zhang H B, Zheng W G, Yan Q, Yang Y, Wang J W, Lu Z H, Ji G Y, Yu Z Z (2010)
Electrically conductive polyethylene terephthalate/graphene nanocomposites prepared by
melt compounding. Polymer 51: 1191–1196.
56. Liang Y, Gholamerza P, Seyed A Monemian, Ica M Zioczowe (2014) Epoxy composites
with carbon nanotubes and graphene nanoplatetletes-dispersion and synergy effects. Carbon
78: 268–278.
57. He L, Tjong S C (2013) Low percolation threshold of graphene/polymer composites prepared by
solvothermal reduction of graphene oxide in the polymer solution. Nanoscale Research Letters
8: 132 (1–7).
46 P.N. Khanam et al.
58. Nan C W, Shen Y, Ma J (2010) Physical properties of composites near percolation.
Annual Review of Materials Research 40: 131–151.
59. Cui L L, Lu X F, Chao D M, Liu H T, Li Y X, Wang C (2011) Graphene-based compos-
ite materials with high dielectric permittivity via an in situ reduction method. physica status
solidi (a) 208: 459–461.
60. Hu H, Wang X, Wang J, Wan L, Liu F, Zheng H, Chen R, Xu C (2010) Preparation and prop-
erties of graphene nanosheets-polystyrene nanocomposites via in situ emulsion polymeriza-
tion. Chemical Physics Letters 484 : 247–253.
61. Lee Y R, Raghu A V, Jeong H M, Kim B K (2009) Properties of waterborne polyurethane/
functionalized graphene sheet nanocomposites prepared by an in situ method. Macromolecul
ar Chemistry and Physics 210 : 1247–1254.
62. Kim H, Macosko C W (2009) Processing–property relationships of polycarbonate/ graphene
nanocomposites. Polymer 50:3797– 3809.
63. Geng Y, Wang S J, Kim J K (2009) Preparation of graphite nanoplatelets and graphene
sheets. Journal of Colloid and Interface Science 336 : 592–598.
64. Wei T, Luo G, Fan Z, Zheng C, Yan J, Yao C, Li W, Zhang C (2009) Preparation of gra-
phene nanosheet/polymer composites using in situ reduction-extractive dispersion. Carbon
47:2296–2299.
65. Niyogi S, Bekyarova E, Itkis M E, McWilliams J L, Hamon M A, Haddon R C (2006)
Solution properties of graphite and graphene. Journal of American Chemical Society
128:7720–7721.
66. Stankovich S, Piner R D, Nguyen S T, Ruoff R S (2006) Synthesis and exfoliation of isocy-
anate-treated graphene oxide nanoplatelets. Carbon 44:3342–3347.
67. Liu N, Luo F, Wu H, Liu Y, Zhang C, Chen J (2008) One step ionic-liquid assisted elec-
trochemical synthesis of ionic-liquid-functionalized graphene sheets directly from graphene.
Advanced Functional Materials 18:1518–1525.
68. Stankovich S, Piner R D, Chen X, Wu N, Nguyen S T, Ruoff R S (2006) Stableaqueous dis-
persions of graphitic nanoplatelets via the reductionof exfoliated graphite oxide in the pres-
ence of poly(sodium 4-styrenesulfonate). Journal of Materials Chemistry 16:155–158.
69. Park S, An J, Piner R D, Jung I, Yang D, Velamakanni A, Nguyen S T, Ruoff R S (2008)
Aqueous suspension and characterization of chemically modified grapheme sheets. Chemistry
of Materials 20:6592–6594.
70. Bourlinos A B, Gournis D, Petridis D, Szabo T, Szeri A, Dekany I (2003) Graphite oxide:
chemical reduction to graphite and surface modificationwith primary aliphatic amines and
amino acids. Chemistry of Materials 19: 6050–6055.
71. Lomeda J R, Doyle C D, Kosynkin D V, Hwang W F, Tour J M (2008) Diazonium function-
alization of surfactant-wrapped chemically converted graphene sheets. Journal of American
Chemical Society 130:16201–16206.
72. Li D, Muller M B, Gilje S, Kaner R B, Wallac G G (2007) Processable aqueous dispersions
of graphene nanosheets. Nature Nanotechnology 3:101–105.
73. Worsley K A, Ramesh P, Mandal S K, Niyogi S, Itkis M E, Haddon R C (2007) Soluble gra-
phene derived from graphite fluoride. Chemical Physics Letters 445: 51–56.
74. Eda G, Chhowalla M (2009) Graphene-based composite thin films for electronics. Nano
Letters 9: 814–818.
75. Bhadra S, Khstagir D, Singh A K, Lee J H (2009) Progress in preparation, processing and
applications of polyaniline. Progress in Polymer Science 34:783–810.
76. Chen Z, Ren W, Gao L, Liu B, Pei S, Cheng H M (2011) Three-dimensional flexible and
conductive interconnected graphene networks grown by chemical vapour deposition. Nature
Materials 10: 424–428.
77. Xu Y, Liu Z, Zhang X,Wang Y, Tian J, Huang Y (2009) A graphene hybrid material cova-
lently functionalized with porphyrin: synthesis and optical limiting property. Advanced Mater
21: 1275–1279.
47Electrical Properties of Graphene Polymer Nanocomposites
78. Berger C, Song Z, Li T, Li X, Ogbazghi AY, Feng R (2004) Ultrathin epitaxial graphite:
2D electron gas properties and a route toward graphene-based nanoelectronics. Journal of
Physics and Chemistry B 108:19912–19916.
79. Kim SC, Lee H, Jeong HM (2010) Effect of pyrene treatment on the properties of graphene/
epoxy nanocomposites. Macromolecular Research 18(11): 1125–1128.
80. Zhang H B, Zheng W G, Yan Q, Yang Y, Wang J W, Lu Z H, Ji G Y, Yu Z Z (2010)
Electrically conductive polyethylene terephthalate/graphene nanocomposites prepared by
melt compounding. Polymer 51:1191–1196.
81. Hao R, Qian W, Zhang L, Hou Y (2008) Aqueous dispersions of TCNQ-anion stabilized gra-
phene sheets. Chem Commun 48: 6576–6578.
82. Xu Y, Bai H, Lu G, Li C, Shi G (2008) Flexible graphene films via the filtration of water-
soluble noncovalent functionalized graphene sheets. Journal of American Chemical Society
130:5856–5857.
83. Wang T X, Liang G Z, Yuan L, Gu A (2014) Unique hybridized graphene and its high dielec-
tric constant composites with enhanced frequency stability, low dielectric loss and percola-
tion threshold. Carbon 77: 920–932.
84. Li Y, Samad Y A, Polychronopoulou K, Alhassan S M, Liao K (2014) Highly Electrically
Conductive Nanocomposites Based on PolymerInfused Graphene Sponges. Scientific
Reports 4:4652 (1–6).
85. Zhou T N, Qi X D, Fu Q (2013) The preparation of the poly(vinyl alcohol)/graphene nano-
composites with low percolation threshold and high electrical conductivity by using the
large-area reduced graphene oxide sheets. Express Polymer Letters 7: 747–755.
86. Park J U, Nam S W, Lee M S, Lieber C M (2012) Synthesis of monolithic graphene–graphite
integrated electronics. Nature Materials 11: 120–125.