Embed Size (px)
Citation preview
International Journal of Electrical Components and Energy Conversion 2017; 3(3): 40-62
http://www.sciencepublishinggroup.com/j/ijecec
doi: 10.11648/j.ijecec.20170303.11
ISSN: 2469-8040 (Print); ISSN: 2469-8059 (Online)
Electrical Power Quality Analysis and Hydraulic Performance for Photo Voltaic Surface Water Pumping Unit
Khaled Mohamed Kotb Fetyan
Mechanical and Electrical Research Institute, National Water Research Center, Ministry of Water Resources and Irrigation, Cairo, Egypt
Email address:
To cite this article: Khaled Mohamed Kotb Fetyan. Electrical Power Quality Analysis and Hydraulic Performance for Photo Voltaic Surface Water Pumping Unit.
International Journal of Electrical Components and Energy Conversion. Vol. 3, No. 3, 2017, pp. 40-62. doi: 10.11648/j.ijecec.20170303.11
Received: August 13, 2017; Accepted: August 21, 2017; Published: November 1, 2017
Abstract: Photovoltaic now used in new irrigation system as a source of renewable energy to run the pumps. It’s can be used in
remote areas, which it’s very difficult and more expensive to establish power stations or to install transmission lines to connect
these areas with the electrical grid. Surface pump can be used in modern irrigations systems and connected to PV power supply to
save energy and water. In this paper a system contains 10 hp surface pump and 15 kW PV system uses to drive the pump unit are
studied. The paper investigates mathematical models for surface PV pumping system component. The performance of this
system is studied by using this mathematical model during a long time, and the effect of solar radiations values on the system
performance is estimated. The paper introduced a simulations and experimental results of the PV pumping in daily hourly
average during one year. A good agreement between the simulations results and experimental results are found. The paper
investigates the overall performance foxing on the water flow rate values obtained from the unit during one year. Also the
electrical power quality analysis of the AC voltage feeds for the pump unit are measured and calculated. Due to solar radiations
variation during day hours, and during different months the electrical performance such as; voltage current, power and also
harmonic contents is changed depends on the values of solar radiations. The electrical signals and power quality are measured on
the field by using power quality devices in different days and statues of operations. The results showed that; during low radiations
periods the voltage and frequency are varied in a constant relation to reduce the pump speed and hence reduce the water flow rate
to be proportional to input energy come from the PV panels. In case of high solar radiations the inverter runs the pump at constant
frequency values depend on pump specifications. And during clouds occurred the system is stopped.
Keywords: Power Quality Analysis, Surface Pump, Photovoltaic, Hydraulic Performance
1. Introductions
Egypt is located in a semi-arid climatic zone characterized
by hot, dry summers and temperate winters with limited
rainfall. The Nile River is the almost exclusive source of
freshwater to meet all needs; agricultural, industrial and
domestic. Egypt is facing increasing demand for water from
these sectors at a time when supply is fully allocated: Egypt’s
share of water from the Nile has been fixed at 55.5 billion m3
per year since the 1959. Agricultural production in Egypt
occurs exclusively in the Nile Delta and a narrow corridor
along the Nile River [1]. The agricultural sector is the largest
user of water in the Egyptian economy, as crop production is
entirely dependent on irrigation. Water is diverted from the
Nile into the main (primary) canals, before passing into the
branch (secondary) canals. Water from the branch canals is
subsequently distributed to farmers via tertiary canals
(mesqas), usually located below ground level, from where it is
lifted to irrigated fields. The agricultural sector is now facing
an energy crisis, as increasing electricity demand from urban
areas is resulting in frequent shortages and blackouts. In
addition, the Government of Egypt is controlling subsidies for
fuel, and the cost of pumping is set to change. A low-cost,
sustainable source of energy is required for farmers to
continue pumping water for irrigations purposes. So it’s very
important to use renewable energy sources such as solar and
wind. In Egypt, it can be use solar-powered water lifting for
irrigation, with the use of solar panels covering irrigation
canals thereby also reducing evaporation losses. This system
can provide sustainable source of energy for the lifting of
41 Khaled Mohamed Kotb Fetyan: Electrical Power Quality Analysis and Hydraulic Performance for
Photo Voltaic Surface Water Pumping Unit
irrigation water and reduces evaporation losses from irrigation
canals, thus increase efficiency and strengthen local capacities
in Egypt to adopt, operate and maintain new techniques for the
lifting of irrigation water from canals.
1.1. Solar Energy Applications for Water Pumping
Photovoltaic (PV) water pumping is one of the most typical
PV applications in developing countries and has the potential
to become a major force for social and economic development
[1]. Many remote villages in the world are not yet connected to
the electric grid and face severe problems of water for
drinking and irrigation purposes [1]. designed and developed a
solar photovoltaic pump operated drip irrigation system for
growing plantations in and region considering different design
parameters, like pumps size, water requirements, and the
variation in the pressure of the pump due to change in
irradiance and pressure compensation in the emitters [2]. Solar
powered water pumping has the potential to bring sustainable
supplies of potable water to millions of people in developing
countries [3]. Performances of a photovoltaic pumping system
based on an induction motor are degraded once insolation
varies far from the value called nominal, where the system
was sized [4]. Solar PV can provide cost effectively at least
some proportion of energy needs. Benefits to implementing
solar as a source of power for irrigation pumping include:
Reduced bills for mains electricity and diesel, reduced
connection and infrastructure costs when new power lines and
rods can be avoided if fully replacing mains electricity, no
noise, fumes or fuelling runs if replacing diesel, Scalable –
additional panels can be added to increase output, Flexible –
solar power can be integrated with mains electricity supply if
desired, Low maintenance. Protection from rising energy
costs. Sunshine is free so generating energy on farm reduces
exposure to rising electricity and diesel prices [5].
Photovoltaic (PV) panels are often used for agricultural
operations, especially in remote areas or where the use of an
alternative energy source is desired. In particular, they have
been demonstrated time and time again to reliably produce
sufficient electricity directly from solar radiation (sunlight) to
power livestock and irrigation watering systems. A benefit of
using solar energy to power agricultural water pump systems
is that increased water requirements for livestock and
irrigation tend to coincide with the seasonal increase of
incoming solar energy [6]. All energy forms derive directly or
indirectly from solar energy. Crop drying, solar-thermal
electric power generation, solar heat collection, and direct
conversion of solar energy into electricity are direct forms.
Solar energy can be directly converted into electricity using
either thermoelectricity or PV cells. A PV pump is one of the
most reliable technologies for pumping water from boreholes,
rivers, lakes, shallow wells, and canals. Because of the PV
array’s modularity, the pumps can be redesigned as the
demand increases by changing the motor-pump subsystem as
long as the whole yield is sufficient [7]. PV water pumping
systems represent a very attractive, long-term, cost-effective
alternative to hauling water, diesel pumps, and even traditional
windmills for drinking water and many irrigation application
such as; drip/trickle, and hose/basin.. The technology for solar
water pumping is exceeding all expectations, and will
continue to be a viable choice for more and more users as its
capabilities, reliability, and versatility increase while costs
decrease [8].
PV systems for the pumping of groundwater are also used in
Upper Egypt, proving the cost of the water unit pumped by PV
systems is significantly less than that pumped by diesel
systems. Solar PV pumps are becoming a preferred choice in
remote locations to replace hand-pumps, grid connected
electrical pumps and diesel pumps. In such places, solar PV
pumps are even viable economically in comparison to
conventionally run pumps [9]. Solar water pumps offer
Egyptians the opportunity to live in off-grid desert
communities and have access to essential groundwater
resources will help to pull population away from an
overcrowded Nile and take advantage of the desert’s
abundance of sun and soil. It will open up a chance for
Egyptians to find a new ways of making a living without
having to depend on an unreliable electrical grid [10]. The
area of the PV array can be decided according to the required
total quantity of daily water demand and the pump power [11].
The output power from the photovoltaic panels is proportional
to the amount of the incidental solar radiation and
photovoltaic cell temperature. The use of booster reflectors is
a promising solution to raising the intensity of incidental
irradiance on the PV panel surface [12]. A solar water
pumping system is ideal in remote locations where grid
electricity does not exist or it is cumbersome to carry in
gasoline or diesel to feed a pump. The drawback of solar
pumping systems is a lot low costly than fossil fuel or
grid-based systems to establish[13].
1.2. Electrical Power Quality Analyses
Power quality means the status of voltage and current wave
shape at different operating conditions. In PV system due to
using of inverter there are many problems occurred due to
poor power quality such as: voltage disturbances for example
voltage surges and impulses, voltage sags; harmonic invasion,
flickering, and PF quality. The Harmonics contents and total
harmonic distortions(THD) can be calculated by measuring
the voltage and current signal and their values represent the
status of power quality. Harmonics have destructive effects
like torque pulsation, acoustic noise and increase power
losses[14]. Modern power quality analysis is being used to
measure and calculate the harmonic contents such as; 3rd
, 5th
,
and 7th
harmonics, and flickers and also calculate the THD.
1.2.1. Total Harmonic Distortion
The series of harmonic components that represent a
distorted waveform are often described by the THD. THD can
be calculated from the following equations
��� = �∑ ����� (1)
Where; n is an order of the harmonic; V1 is the rms value of
the fundamental voltage and Vn is the rms value of the voltage

International Journal of Electrical Components and Energy Conversion 2017; 3(3): 40-62 42
harmonic with order n.
The voltage distortion limits in IEEE519 are fairly straight
forward, as shown in Table 1. There are only three levels
recommended, depending on the voltage level.
Table 1. THD limits according to voltage level (IEEE519).
Bus voltage at PCC
(Vn)
Individual harmonic
voltage distortion (%)
Total Voltage Distortion
– THD Vn(%)
Vn ≤ 69kv 3.0 5.0
69kv < Vn ≤ 161kv 1.5 2.5
Vn > 161kv 1.0 1.5
1.2.2. Flicker Problem
The power supply network voltage varies over time due to
disturbance that occurs in the processes of electricity
generation, transmission and distribution [15]. High power
loads that draw fluctuating current, such as large motor drives
and arc furnaces, cause low frequency cyclic voltage
variations that result in flickering of light sources this flickers
cause significant physiological discomfort, physical and
psychological tiredness, and even pathological effects for
human beings. Also can cause problems with the stability of
electrical devices and electronic circuits.
Flicker is expressed in terms of two parameters: short term
flicker severity PST normally fixed at 10 min, during which
short-term flicker severity is assessed, and long term flicker
severity PLT usually 2h, during which long-term flicker
severity is assessed. The equations used to calculate flicker is
explained in Eq.(2,3) [16]:
�����.������.���.����������.����� ���.�!����"�.�#$%�� (2)
&� = �∑ ��'( )(�*
(3)
where N is the number of PS periods within the observation
time of PLT. Measurements would be required to calculate the
PLT (2h). In the following part, these parameters are denoted as
P0.1, P1S, P3S, etc., while the subscript ‘s’ (e.g. P1S, P3S)
indicates that averaging has been applied according to the
following formulas:
���+��.,������ -/� (4)
���+��� ��/-/� (5)
����+�0��#������� ���,-/� (6)
����+� ���%���#�-/� (7)
2. Simulations Performance of Surface
PV Pump System
To study the performance of PV pump, it’s required to make
a simulation models for each part of the system. By using a
Matlab program, a simulation models for each part of the
system are establish. By using this model the system
performance can be estimated. Such as the output water flow
rate of the unit according to the soar radiations values during
one year can be calculated. These results can help the designer
to estimate the water output from the unit. These estimated
water quantity used to calculate the irrigations areas, and the
crops pattern. In the following parts a simulation model for
each part are introduce and the hole system performance and
the output water flow are calculated and compared with the
field measurements done on the experimental system.
2.1. Mathematical Modeling of Surface PV Pumping
Systems
The overall simulation models of PV pumping system are
shown in Figure 1 the load is an induction motor connected
directly to the PV system. The system uses an inverter to
convert the DC voltage output from the PV array into AC
voltage to drive the induction motor and pump unit. A
maximum power point model is used to obtain the operating
maximum voltage value at each radiation level. A weather
model uses some parameters and equations including; the
latitude, longitude, time, date, and array fixing angle, to
calculate the solar radiations falls on the PV array. In the
following parts simulations models for each part are introduce
and the full system simulation model to find the system
performance during one year is introduced also. Finally a
comparison between experimental results and simulation
results are introduces.
Figure 1. Simulation models of PV pump system.
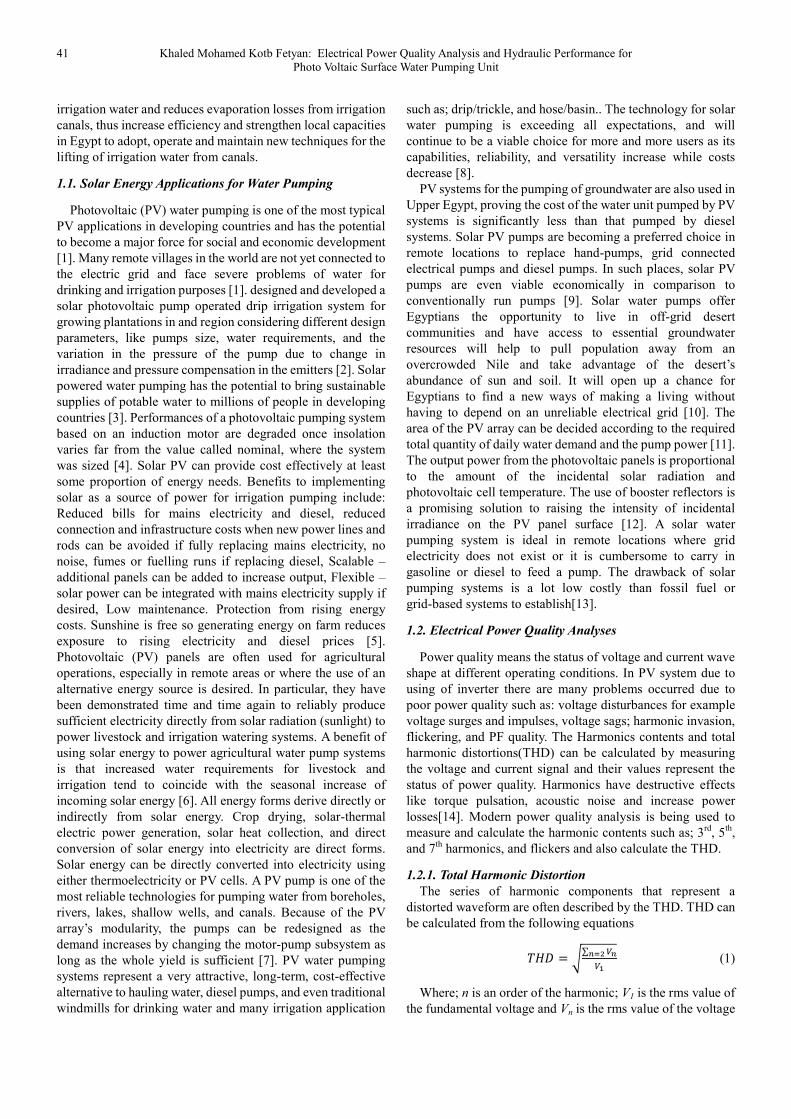
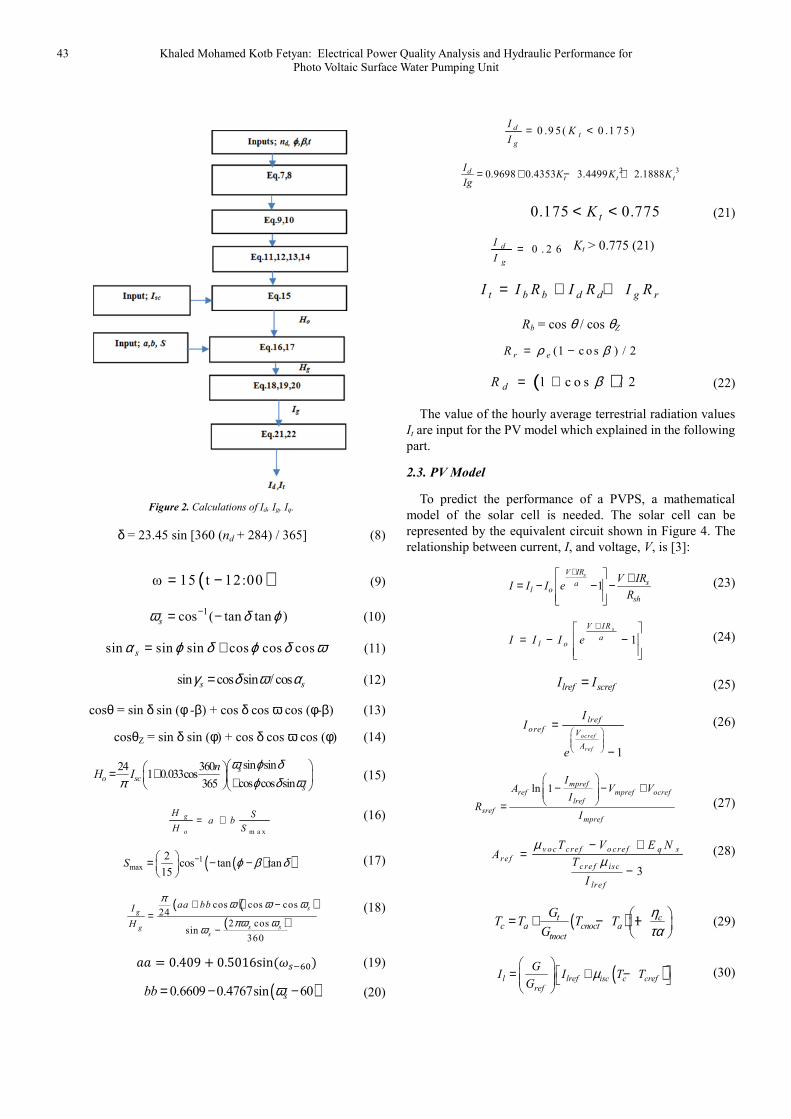
2.2. Solar Radiations Calculations
According to the following equations; (8) to (22); and by
following the sequence shown in Figure 2 the solar radiations
components; Ig, Id, and It can be calculated and the results
during one year is shown in Figure 3
43 Khaled Mohamed Kotb Fetyan: Electrical Power Quality Analysis and Hydraulic Performance for
Photo Voltaic Surface Water Pumping Unit
Figure 2. Calculations of Id, Ig, Iq.
δ = 23.45 sin [360 (nd + 284) / 365] (8)
( )ω 15 t 12:00= − (9)
1cos ( tan tan )sω δ ϕ−= − (10)
sin sin sin cos cos cossα ϕ δ ϕ δ ω= + (11)
sin cos sin / coss sγ δ ω α= (12)
cosθ = sin δ sin (φ -β) + cos δ cos ω cos (φ-β) (13)
cosθZ = sin δ sin (φ) + cos δ cos ω cos (φ) (14)
sin sin24 3601 0.033cos
cos cos sin365
so sc
s
nH I
ω ϕ δϕ δ ωπ
= + + (15)
m a x
g
o
H Sa b
H S= + (16)
( )( )1max
2cos tan tan
15S ϕ β δ− = − −
(17)
( ) ( )( )
cos cos cos24
2 cossin
360
sg
s sgs
aa bbI
H
π ω ω ω
πω ωω
+ −=
−
(18)
11 = 0.409 5 0.5016sin+<=>��- (19)
( )0.6609 0.4767sin 60sbb ω= − − (20)
0 .9 5( 0 .1 7 5 )dt
g
IK
I= <
2 30.9698 0.4353 3.4499 2.1888dt t t
IK K K
Ig= + − +
0.175 0.775tK< < (21)
0 . 2 6d
g
I
I= Kt > 0.775 (21)
t b b d d g rI I R I R I R= + +
Rb = cos θ / cos θZ
(1 c o s ) / 2r eR ρ β= −
( )1 c o s / 2dR β= + (22)
The value of the hourly average terrestrial radiation values
It are input for the PV model which explained in the following
part.
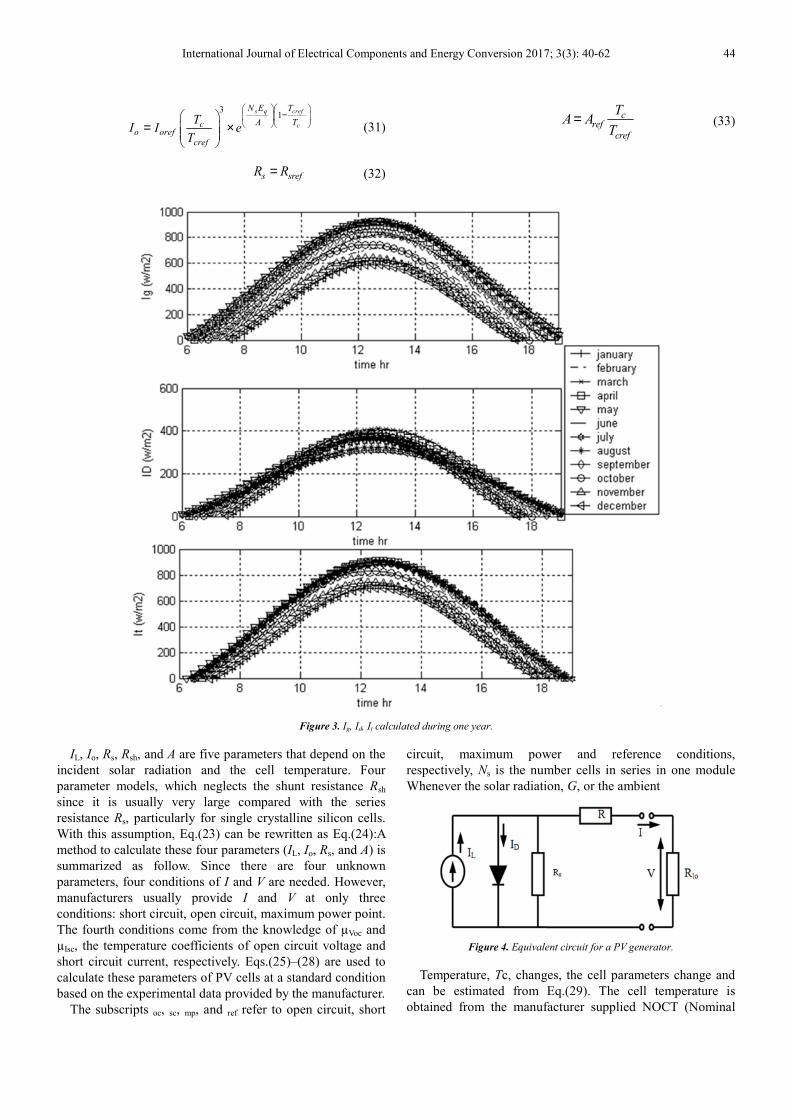
2.3. PV Model
To predict the performance of a PVPS, a mathematical
model of the solar cell is needed. The solar cell can be
represented by the equivalent circuit shown in Figure 4. The
relationship between current, I, and voltage, V, is [3]:
1sV IR
sal o
sh
V IRI I I e
R
+ += − − −
(23)
1sV IR
al oI I I e
+ = − −
(24)
lref screfI I= (25)
1
ocref
ref
lreforef V
A
II
e
=
−
(26)
ln 1mpref
ref mpref ocreflref
srefmpref
IA V V
IR
I
− − +
= (27)
3
v oc cre f o cre f q sre f
c re f isc
lre f
T V E NA
T
I
µµ
− +=
−
(28)
( ) 1t cc a cnoct a
tnoct
GT T T T
G
ητα
= + − −
(29)
( )l lref isc c crefref
GI I T T
Gµ
= + −
(30)
International Journal of Electrical Components and Energy Conversion 2017; 3(3): 40-62 44
31
s q cref
c
N E T
A Tco oref
cref
TI I e
T
−
= ×
(31)
s srefR R= (32)
cref
cref
TA A
T= (33)
Figure 3. Ig, Id, It calculated during one year.
IL, Io, Rs, Rsh, and A are five parameters that depend on the
incident solar radiation and the cell temperature. Four
parameter models, which neglects the shunt resistance Rsh
since it is usually very large compared with the series
resistance Rs, particularly for single crystalline silicon cells.
With this assumption, Eq.(23) can be rewritten as Eq.(24):A
method to calculate these four parameters (IL, Io, Rs, and A) is
summarized as follow. Since there are four unknown
parameters, four conditions of I and V are needed. However,
manufacturers usually provide I and V at only three
conditions: short circuit, open circuit, maximum power point.
The fourth conditions come from the knowledge of µVoc and
µIsc, the temperature coefficients of open circuit voltage and
short circuit current, respectively. Eqs.(25)–(28) are used to
calculate these parameters of PV cells at a standard condition
based on the experimental data provided by the manufacturer.
The subscripts oc, sc, mp, and ref refer to open circuit, short
circuit, maximum power and reference conditions,
respectively, Ns is the number cells in series in one module
Whenever the solar radiation, G, or the ambient
Figure 4. Equivalent circuit for a PV generator.
Temperature, Tc, changes, the cell parameters change and
can be estimated from Eq.(29). The cell temperature is
obtained from the manufacturer supplied NOCT (Nominal
45 Khaled Mohamed Kotb Fetyan: Electrical Power Quality Analysis and Hydraulic Performance for
Photo Voltaic Surface Water Pumping Unit
Operating Cell Temperature) conditions. At NOCT conditions
of the cell parameters at the operating cell temperature and
solar radiation are then found from Eqs.[29: 33] The cell
model is summarized as follows: Eqs. [25–28] are used to find
values of the four parameters at reference conditions. These
four parameters are corrected for environmental conditions
with Eqs. [29–33], and use in Eq. (25) which relates cell
current to cell voltage. A MATLAB model uses equations and
the solution steps explained above to obtain the cell
characteristics at different solar radiations values. The
manufactures data of the PV array module are listed in
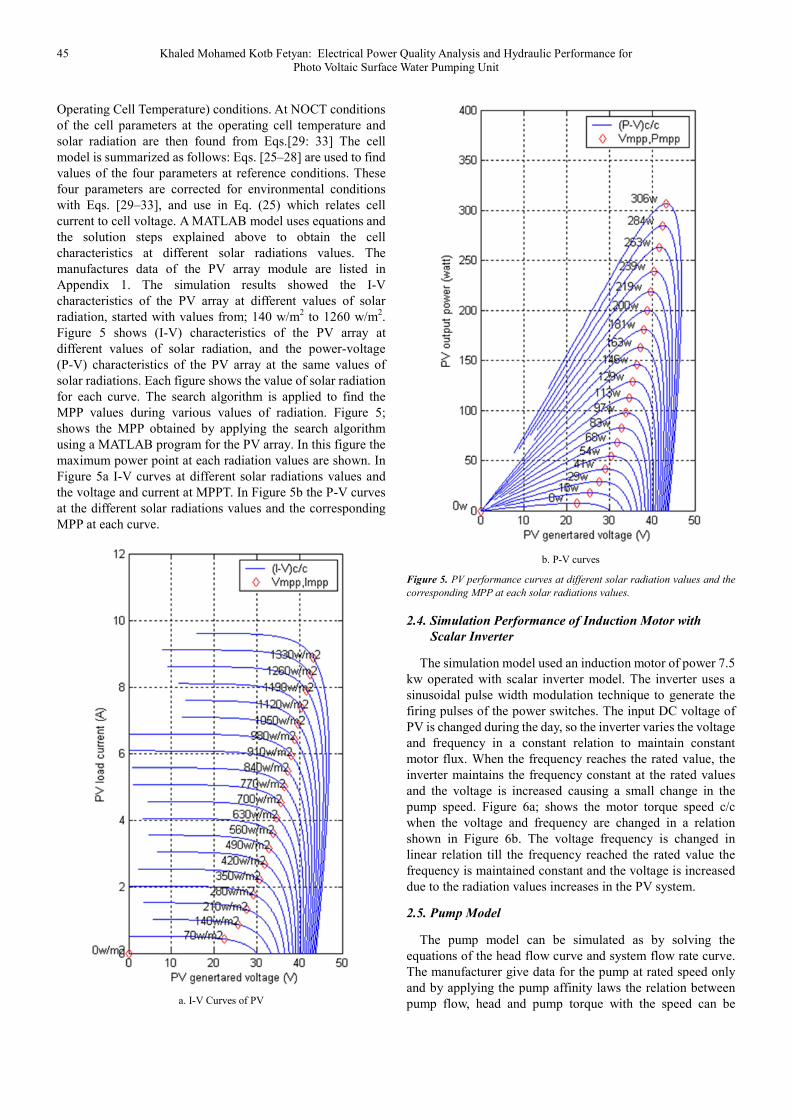
Appendix 1. The simulation results showed the I-V
characteristics of the PV array at different values of solar
radiation, started with values from; 140 w/m2 to 1260 w/m
2.
Figure 5 shows (I-V) characteristics of the PV array at
different values of solar radiation, and the power-voltage
(P-V) characteristics of the PV array at the same values of
solar radiations. Each figure shows the value of solar radiation
for each curve. The search algorithm is applied to find the
MPP values during various values of radiation. Figure 5;
shows the MPP obtained by applying the search algorithm
using a MATLAB program for the PV array. In this figure the
maximum power point at each radiation values are shown. In
Figure 5a I-V curves at different solar radiations values and
the voltage and current at MPPT. In Figure 5b the P-V curves
at the different solar radiations values and the corresponding
MPP at each curve.
a. I-V Curves of PV
b. P-V curves
Figure 5. PV performance curves at different solar radiation values and the
corresponding MPP at each solar radiations values.
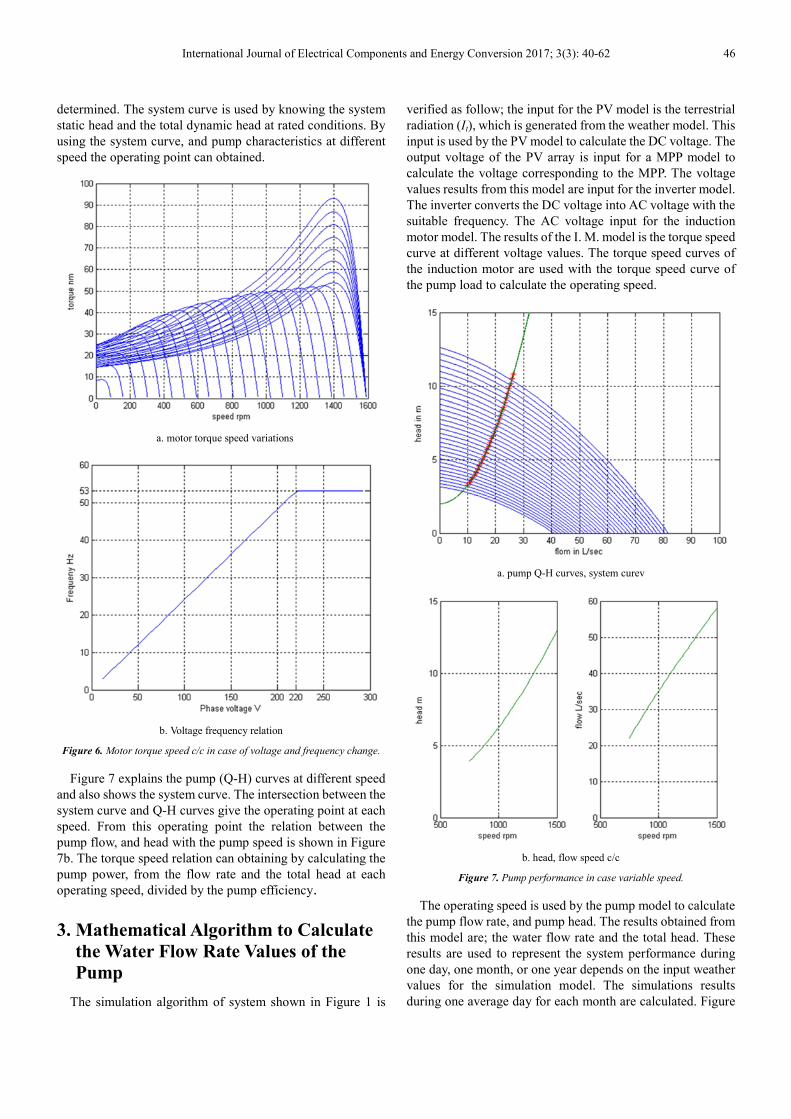
2.4. Simulation Performance of Induction Motor with
Scalar Inverter
The simulation model used an induction motor of power 7.5
kw operated with scalar inverter model. The inverter uses a
sinusoidal pulse width modulation technique to generate the
firing pulses of the power switches. The input DC voltage of
PV is changed during the day, so the inverter varies the voltage
and frequency in a constant relation to maintain constant
motor flux. When the frequency reaches the rated value, the
inverter maintains the frequency constant at the rated values
and the voltage is increased causing a small change in the
pump speed. Figure 6a; shows the motor torque speed c/c
when the voltage and frequency are changed in a relation
shown in Figure 6b. The voltage frequency is changed in
linear relation till the frequency reached the rated value the
frequency is maintained constant and the voltage is increased
due to the radiation values increases in the PV system.
2.5. Pump Model
The pump model can be simulated as by solving the
equations of the head flow curve and system flow rate curve.
The manufacturer give data for the pump at rated speed only
and by applying the pump affinity laws the relation between
pump flow, head and pump torque with the speed can be
International Journal of Electrical Components and Energy Conversion 2017; 3(3): 40-62 46
determined. The system curve is used by knowing the system
static head and the total dynamic head at rated conditions. By
using the system curve, and pump characteristics at different
speed the operating point can obtained.
a. motor torque speed variations
b. Voltage frequency relation
Figure 6. Motor torque speed c/c in case of voltage and frequency change.
Figure 7 explains the pump (Q-H) curves at different speed
and also shows the system curve. The intersection between the
system curve and Q-H curves give the operating point at each
speed. From this operating point the relation between the
pump flow, and head with the pump speed is shown in Figure
7b. The torque speed relation can obtaining by calculating the
pump power, from the flow rate and the total head at each
operating speed, divided by the pump efficiency.
3. Mathematical Algorithm to Calculate
the Water Flow Rate Values of the
Pump
The simulation algorithm of system shown in Figure 1 is
verified as follow; the input for the PV model is the terrestrial
radiation (It), which is generated from the weather model. This
input is used by the PV model to calculate the DC voltage. The
output voltage of the PV array is input for a MPP model to
calculate the voltage corresponding to the MPP. The voltage
values results from this model are input for the inverter model.
The inverter converts the DC voltage into AC voltage with the
suitable frequency. The AC voltage input for the induction
motor model. The results of the I. M. model is the torque speed
curve at different voltage values. The torque speed curves of
the induction motor are used with the torque speed curve of
the pump load to calculate the operating speed.
a. pump Q-H curves, system curev
b. head, flow speed c/c
Figure 7. Pump performance in case variable speed.
The operating speed is used by the pump model to calculate
the pump flow rate, and pump head. The results obtained from
this model are; the water flow rate and the total head. These
results are used to represent the system performance during
one day, one month, or one year depends on the input weather
values for the simulation model. The simulations results
during one average day for each month are calculated. Figure
47 Khaled Mohamed Kotb Fetyan: Electrical Power Quality Analysis and Hydraulic Performance for
Photo Voltaic Surface Water Pumping Unit
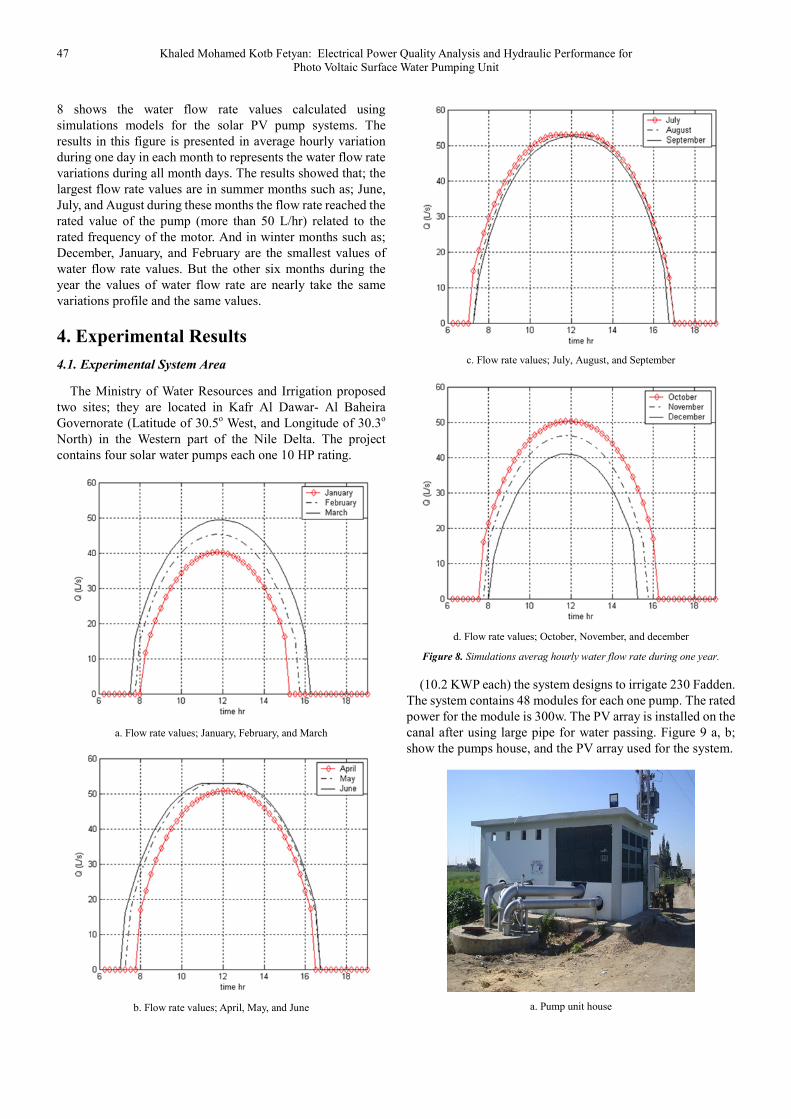
8 shows the water flow rate values calculated using
simulations models for the solar PV pump systems. The
results in this figure is presented in average hourly variation
during one day in each month to represents the water flow rate
variations during all month days. The results showed that; the
largest flow rate values are in summer months such as; June,
July, and August during these months the flow rate reached the
rated value of the pump (more than 50 L/hr) related to the
rated frequency of the motor. And in winter months such as;
December, January, and February are the smallest values of
water flow rate values. But the other six months during the
year the values of water flow rate are nearly take the same
variations profile and the same values.
4. Experimental Results
4.1. Experimental System Area
The Ministry of Water Resources and Irrigation proposed
two sites; they are located in Kafr Al Dawar- Al Baheira
Governorate (Latitude of 30.5o West, and Longitude of 30.3
o
North) in the Western part of the Nile Delta. The project
contains four solar water pumps each one 10 HP rating.
a. Flow rate values; January, February, and March
b. Flow rate values; April, May, and June
c. Flow rate values; July, August, and September
d. Flow rate values; October, November, and december
Figure 8. Simulations averag hourly water flow rate during one year.
(10.2 KWP each) the system designs to irrigate 230 Fadden.
The system contains 48 modules for each one pump. The rated
power for the module is 300w. The PV array is installed on the
canal after using large pipe for water passing. Figure 9 a, b;
show the pumps house, and the PV array used for the system.
a. Pump unit house
International Journal of Electrical Components and Energy Conversion 2017; 3(3): 40-62 48
b. PV panel installed on the canal
Figure 9. Surface PV pump unit in Al-Afeer area.
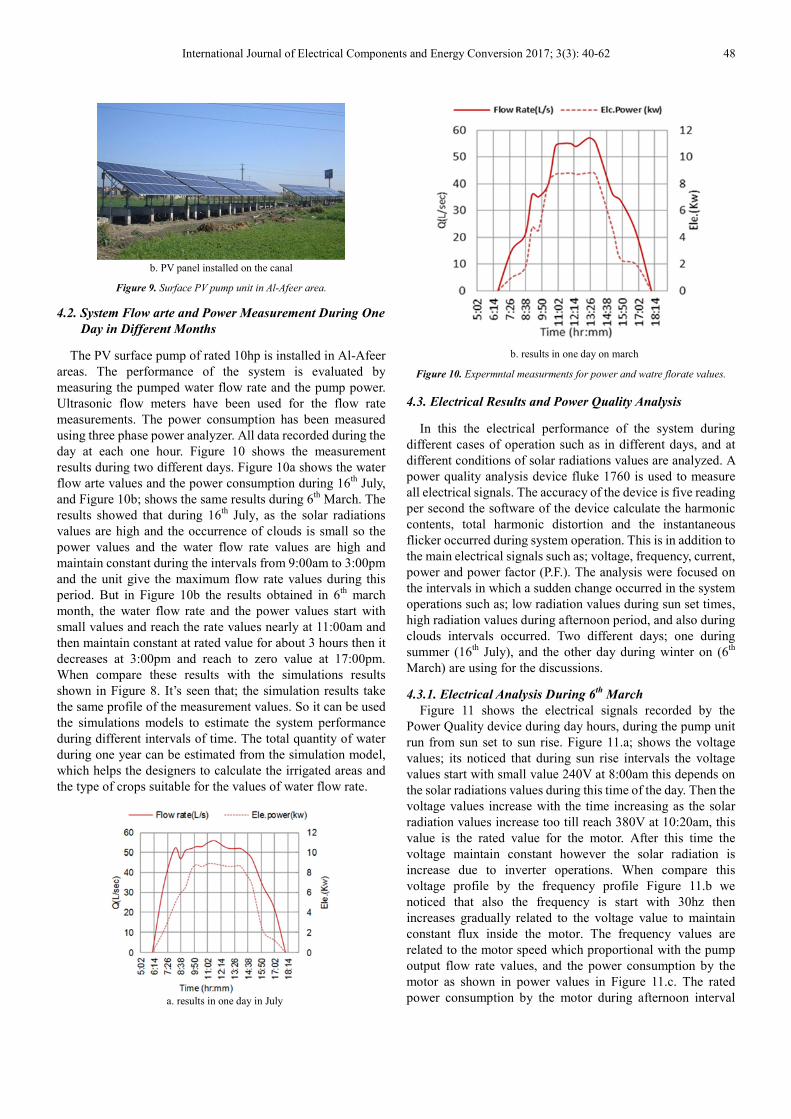
4.2. System Flow arte and Power Measurement During One
Day in Different Months
The PV surface pump of rated 10hp is installed in Al-Afeer
areas. The performance of the system is evaluated by
measuring the pumped water flow rate and the pump power.
Ultrasonic flow meters have been used for the flow rate
measurements. The power consumption has been measured
using three phase power analyzer. All data recorded during the
day at each one hour. Figure 10 shows the measurement
results during two different days. Figure 10a shows the water
flow arte values and the power consumption during 16th
July,
and Figure 10b; shows the same results during 6th
March. The
results showed that during 16th
July, as the solar radiations
values are high and the occurrence of clouds is small so the
power values and the water flow rate values are high and
maintain constant during the intervals from 9:00am to 3:00pm
and the unit give the maximum flow rate values during this
period. But in Figure 10b the results obtained in 6th
march
month, the water flow rate and the power values start with
small values and reach the rate values nearly at 11:00am and
then maintain constant at rated value for about 3 hours then it
decreases at 3:00pm and reach to zero value at 17:00pm.
When compare these results with the simulations results
shown in Figure 8. It’s seen that; the simulation results take
the same profile of the measurement values. So it can be used
the simulations models to estimate the system performance
during different intervals of time. The total quantity of water
during one year can be estimated from the simulation model,
which helps the designers to calculate the irrigated areas and
the type of crops suitable for the values of water flow rate.
a. results in one day in July
b. results in one day on march
Figure 10. Expermntal measurments for power and watre florate values.
4.3. Electrical Results and Power Quality Analysis
In this the electrical performance of the system during
different cases of operation such as in different days, and at
different conditions of solar radiations values are analyzed. A
power quality analysis device fluke 1760 is used to measure
all electrical signals. The accuracy of the device is five reading
per second the software of the device calculate the harmonic
contents, total harmonic distortion and the instantaneous
flicker occurred during system operation. This is in addition to
the main electrical signals such as; voltage, frequency, current,
power and power factor (P.F.). The analysis were focused on
the intervals in which a sudden change occurred in the system
operations such as; low radiation values during sun set times,
high radiation values during afternoon period, and also during
clouds intervals occurred. Two different days; one during
summer (16th
July), and the other day during winter on (6th
March) are using for the discussions.
4.3.1. Electrical Analysis During 6th
March
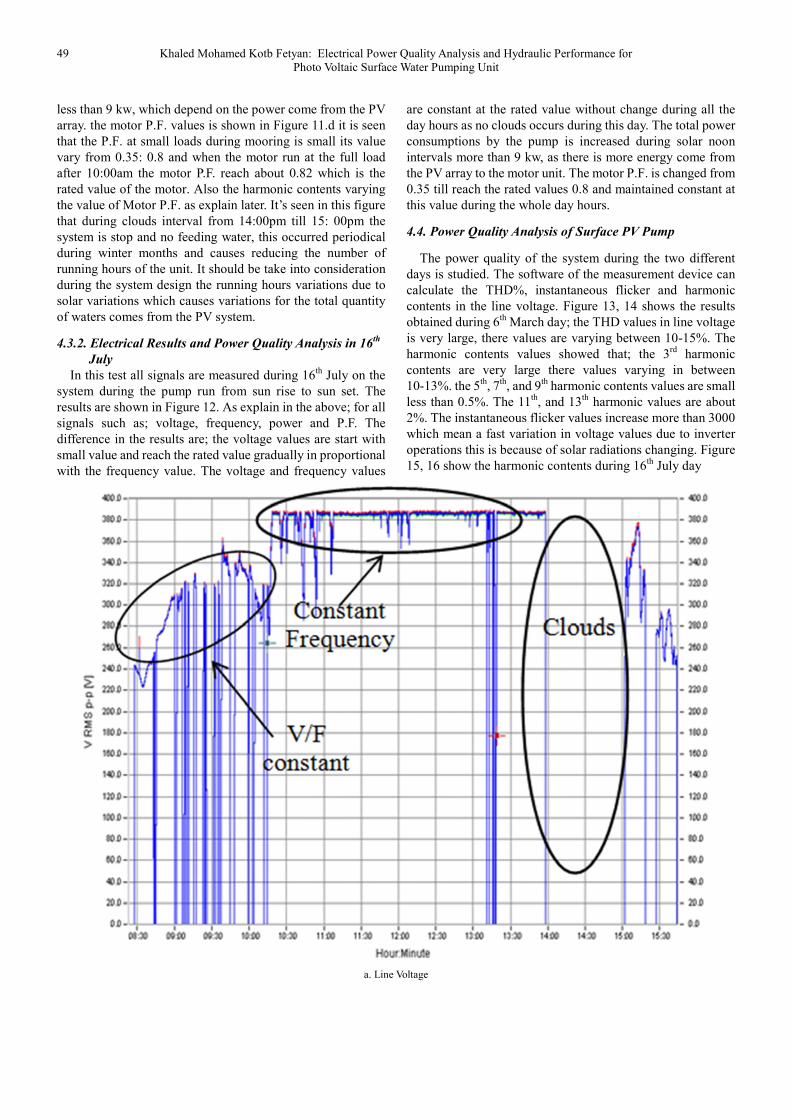
Figure 11 shows the electrical signals recorded by the
Power Quality device during day hours, during the pump unit
run from sun set to sun rise. Figure 11.a; shows the voltage
values; its noticed that during sun rise intervals the voltage
values start with small value 240V at 8:00am this depends on
the solar radiations values during this time of the day. Then the
voltage values increase with the time increasing as the solar
radiation values increase too till reach 380V at 10:20am, this
value is the rated value for the motor. After this time the
voltage maintain constant however the solar radiation is
increase due to inverter operations. When compare this
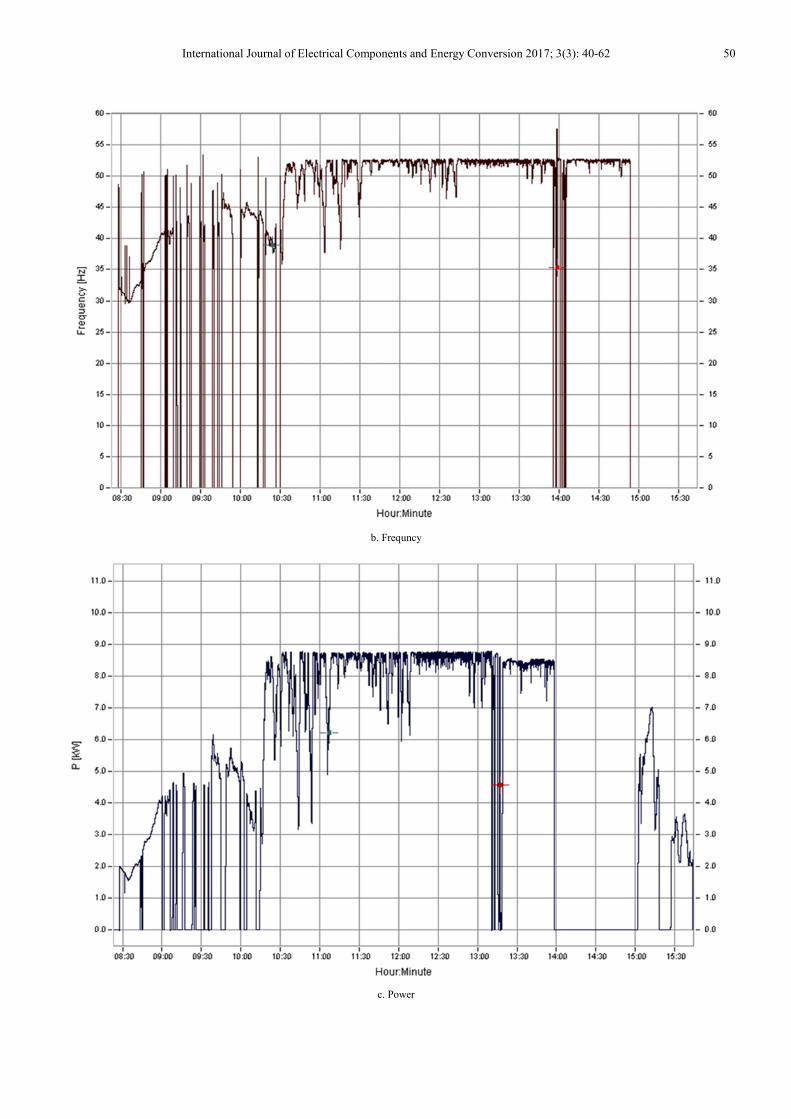
voltage profile by the frequency profile Figure 11.b we
noticed that also the frequency is start with 30hz then
increases gradually related to the voltage value to maintain
constant flux inside the motor. The frequency values are
related to the motor speed which proportional with the pump
output flow rate values, and the power consumption by the
motor as shown in power values in Figure 11.c. The rated
power consumption by the motor during afternoon interval
49 Khaled Mohamed Kotb Fetyan: Electrical Power Quality Analysis and Hydraulic Performance for
Photo Voltaic Surface Water Pumping Unit
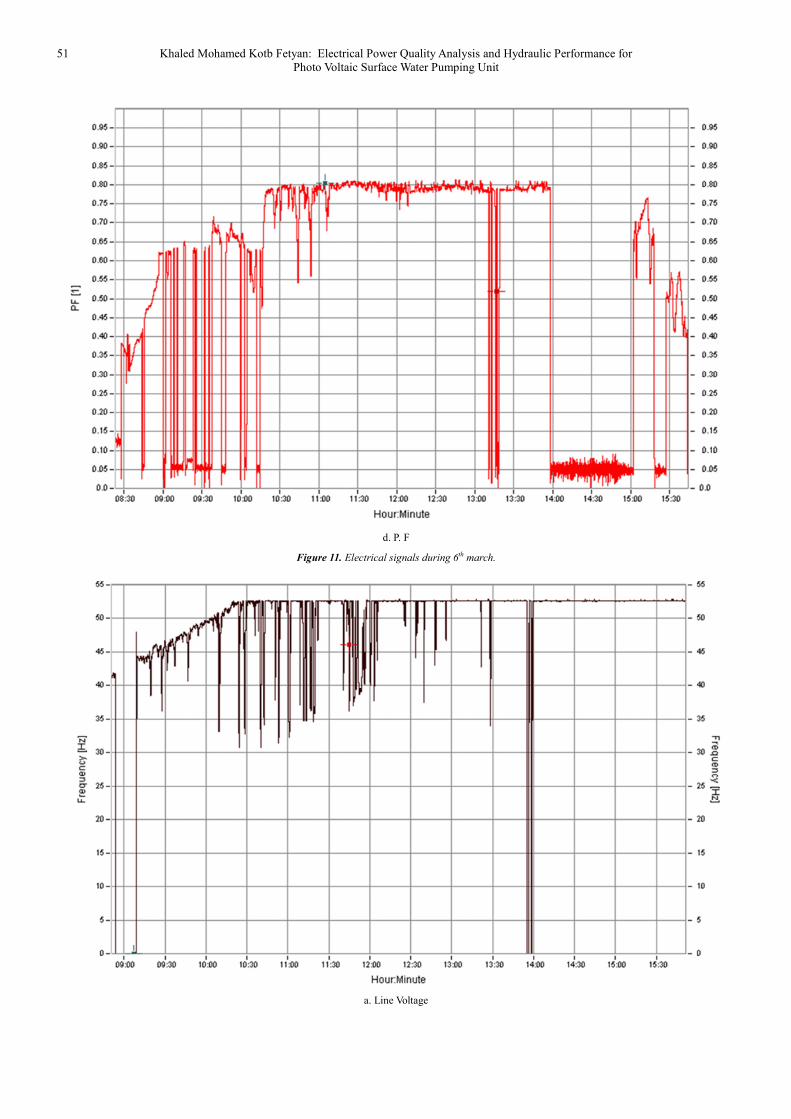
less than 9 kw, which depend on the power come from the PV
array. the motor P.F. values is shown in Figure 11.d it is seen
that the P.F. at small loads during mooring is small its value
vary from 0.35: 0.8 and when the motor run at the full load
after 10:00am the motor P.F. reach about 0.82 which is the
rated value of the motor. Also the harmonic contents varying
the value of Motor P.F. as explain later. It’s seen in this figure
that during clouds interval from 14:00pm till 15: 00pm the
system is stop and no feeding water, this occurred periodical
during winter months and causes reducing the number of
running hours of the unit. It should be take into consideration
during the system design the running hours variations due to
solar variations which causes variations for the total quantity
of waters comes from the PV system.
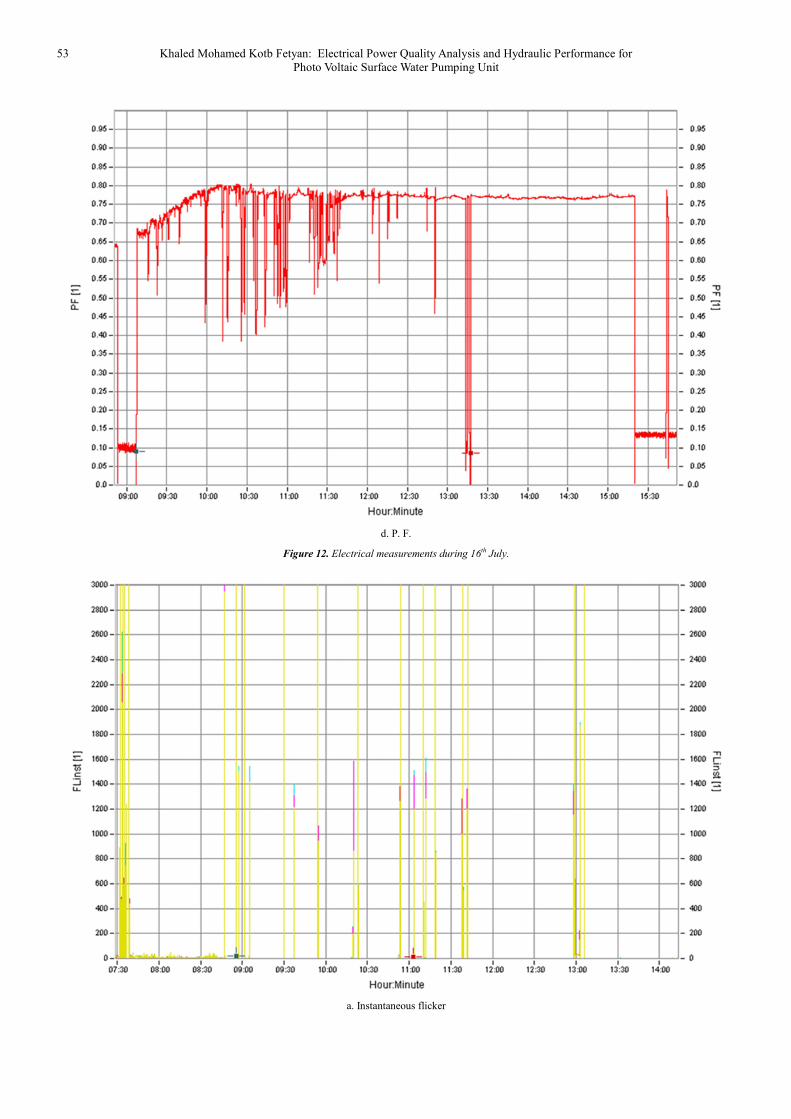
4.3.2. Electrical Results and Power Quality Analysis in 16th
July
In this test all signals are measured during 16th
July on the
system during the pump run from sun rise to sun set. The
results are shown in Figure 12. As explain in the above; for all
signals such as; voltage, frequency, power and P.F. The
difference in the results are; the voltage values are start with
small value and reach the rated value gradually in proportional
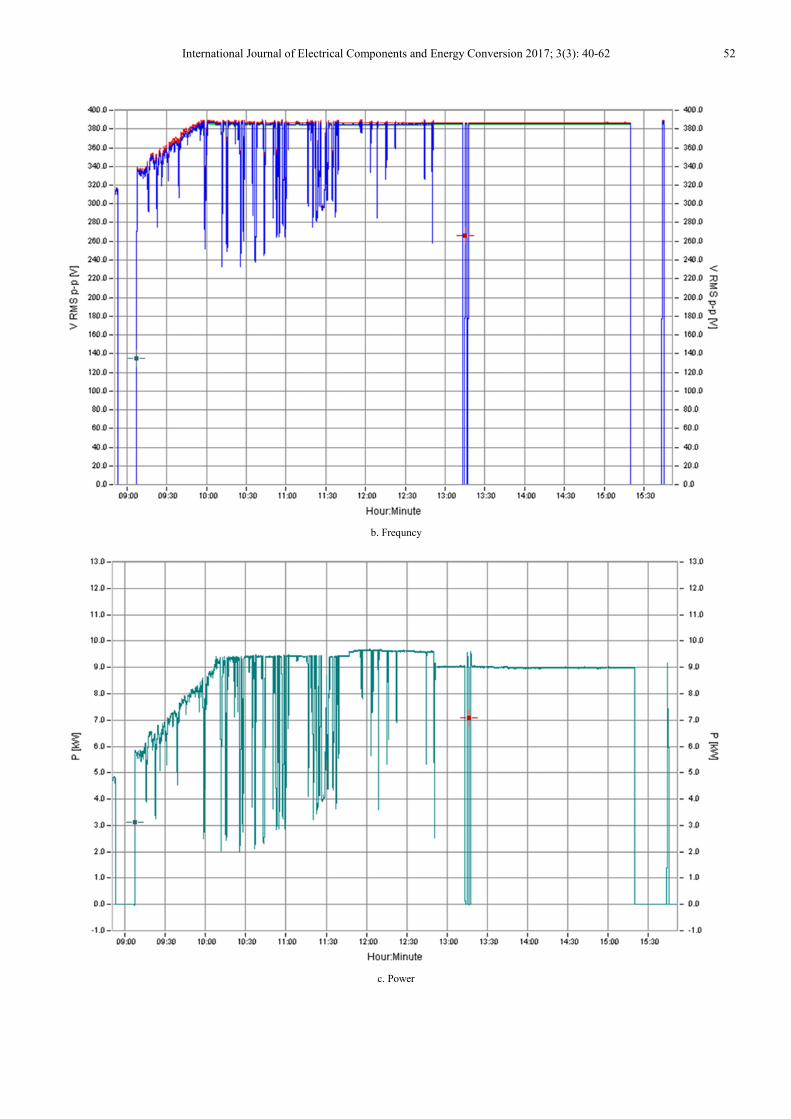
with the frequency value. The voltage and frequency values
are constant at the rated value without change during all the
day hours as no clouds occurs during this day. The total power
consumptions by the pump is increased during solar noon
intervals more than 9 kw, as there is more energy come from
the PV array to the motor unit. The motor P.F. is changed from
0.35 till reach the rated values 0.8 and maintained constant at
this value during the whole day hours.
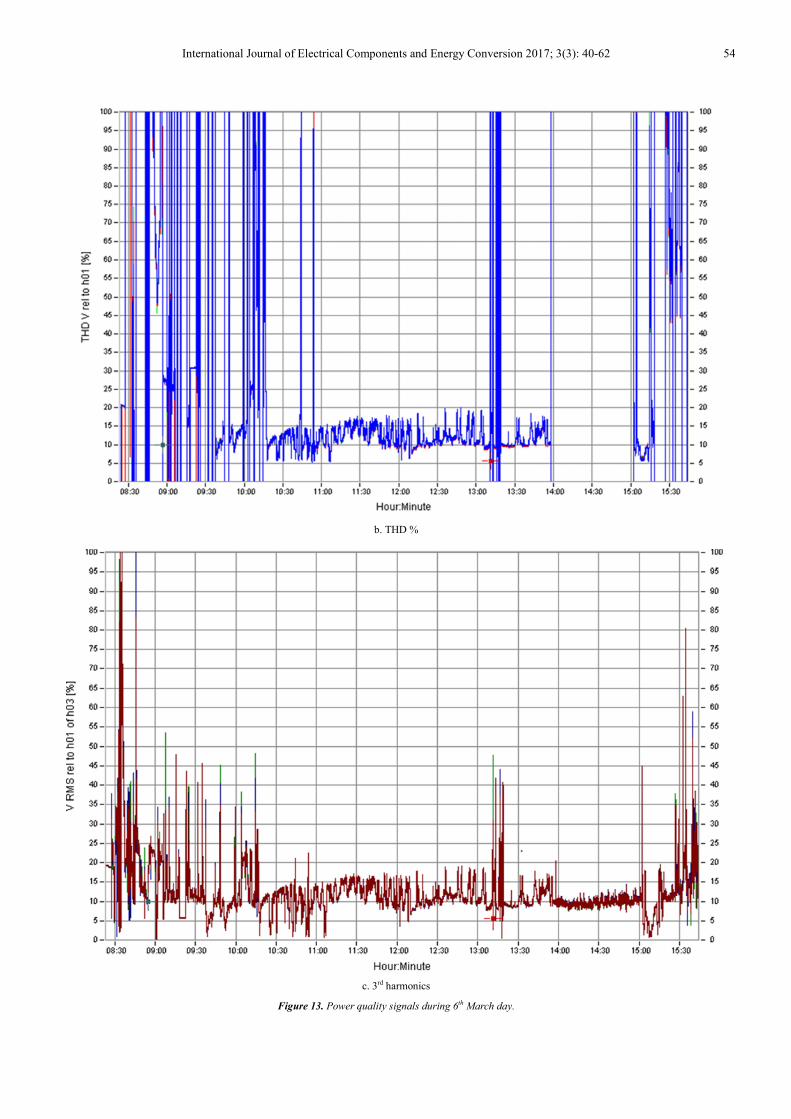
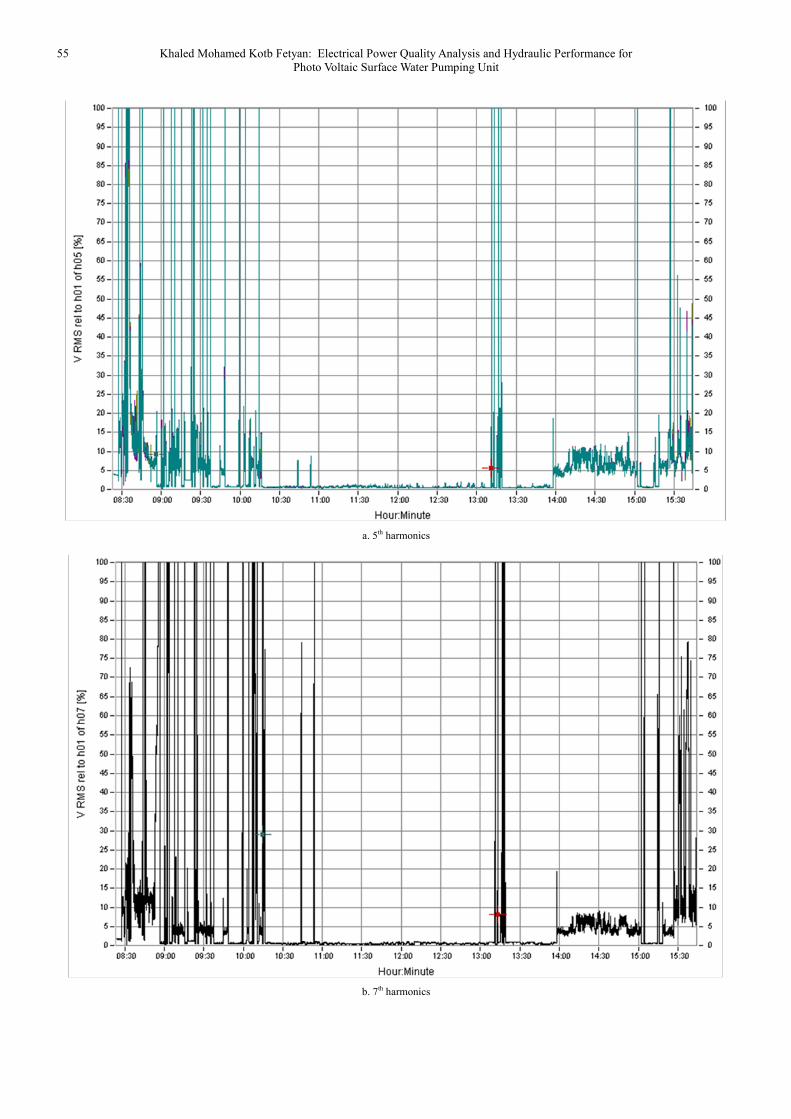
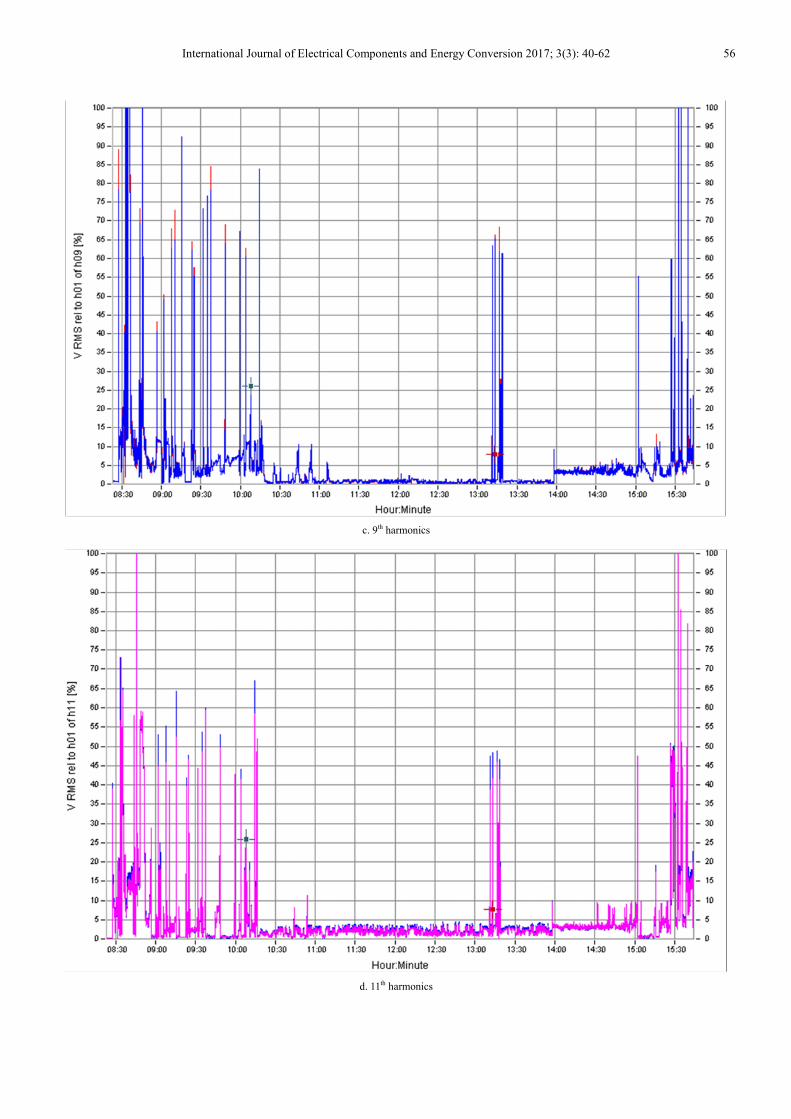
4.4. Power Quality Analysis of Surface PV Pump
The power quality of the system during the two different
days is studied. The software of the measurement device can
calculate the THD%, instantaneous flicker and harmonic
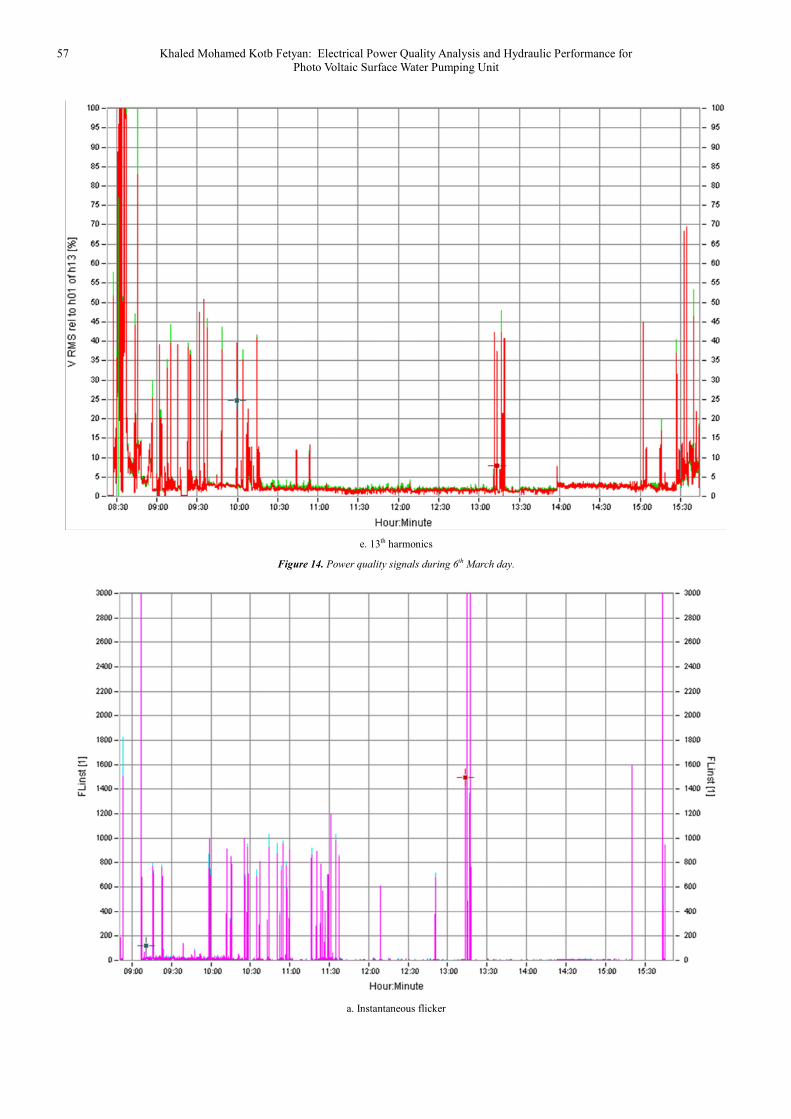
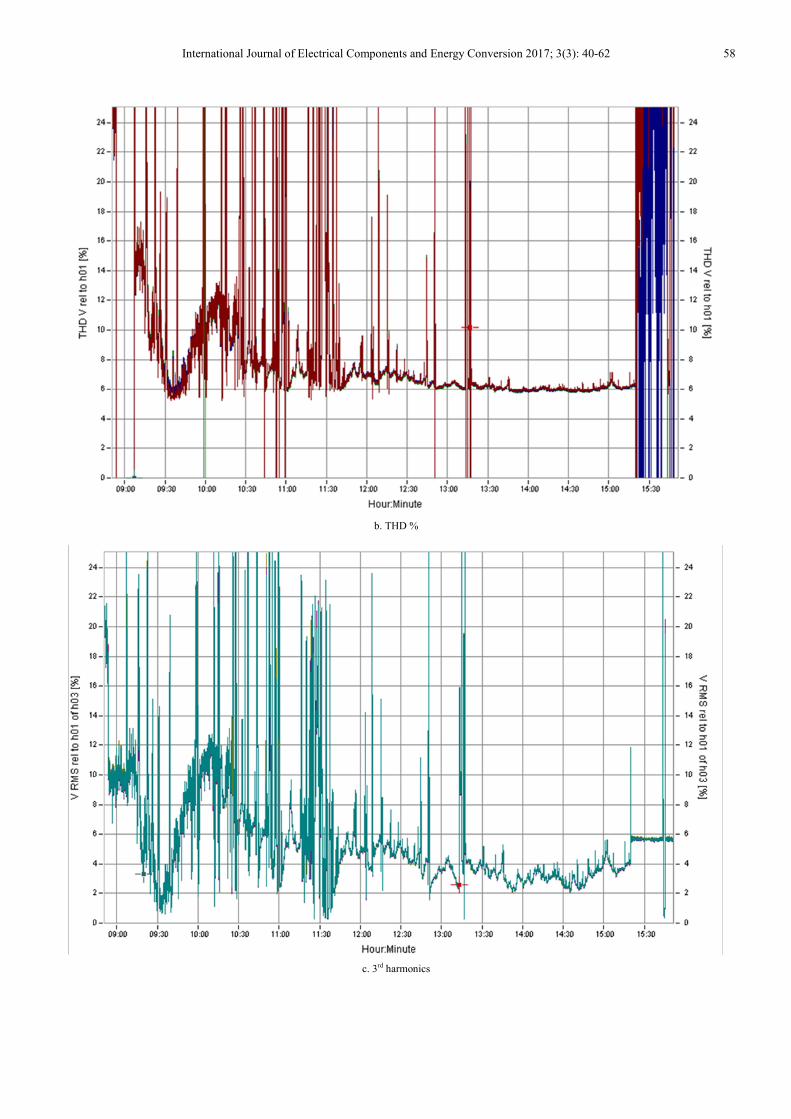
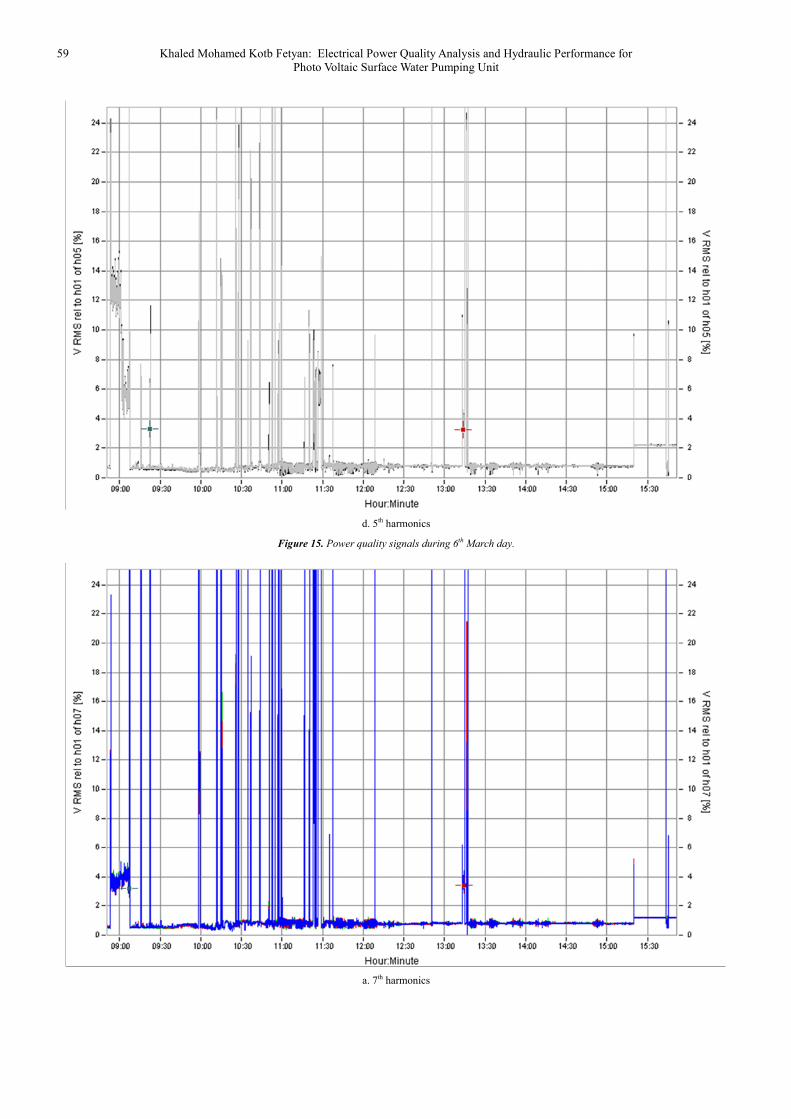
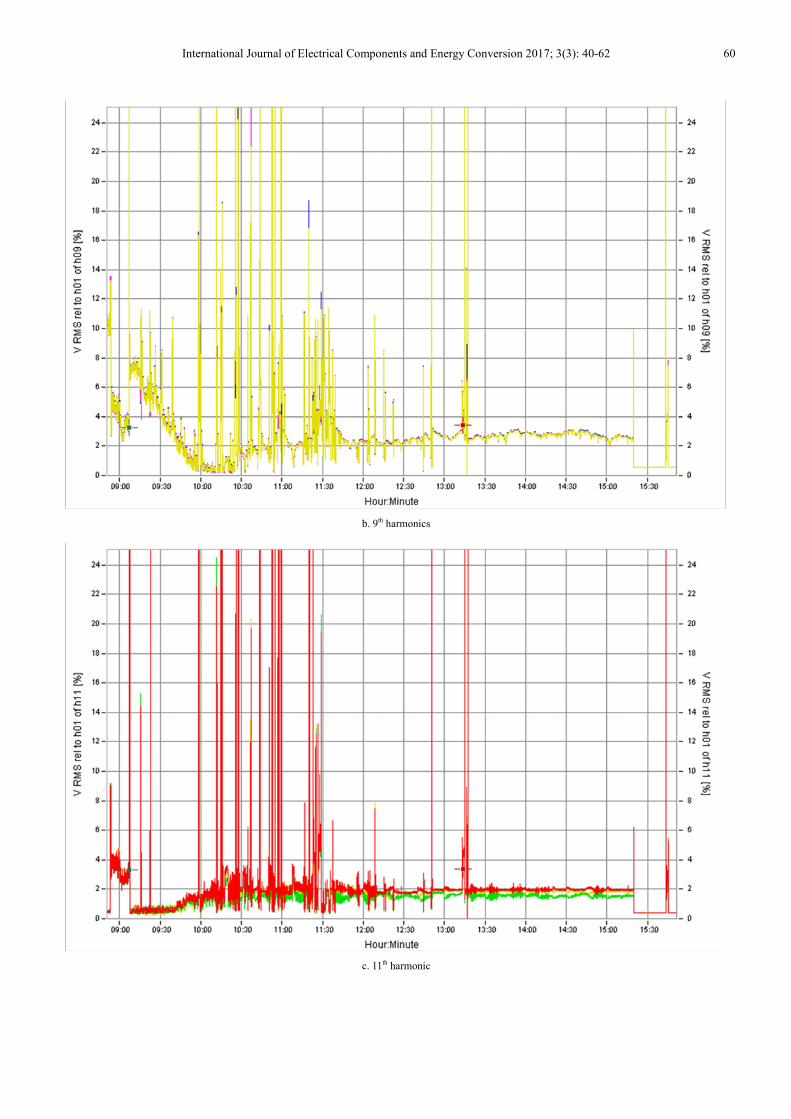
contents in the line voltage. Figure 13, 14 shows the results
obtained during 6th
March day; the THD values in line voltage
is very large, there values are varying between 10-15%. The
harmonic contents values showed that; the 3rd
harmonic
contents are very large there values varying in between
10-13%. the 5th
, 7th
, and 9th
harmonic contents values are small
less than 0.5%. The 11th
, and 13th
harmonic values are about
2%. The instantaneous flicker values increase more than 3000
which mean a fast variation in voltage values due to inverter
operations this is because of solar radiations changing. Figure
15, 16 show the harmonic contents during 16th
July day
a. Line Voltage
International Journal of Electrical Components and Energy Conversion 2017; 3(3): 40-62 50
b. Frequncy
c. Power
51 Khaled Mohamed Kotb Fetyan: Electrical Power Quality Analysis and Hydraulic Performance for
Photo Voltaic Surface Water Pumping Unit
d. P. F
Figure 11. Electrical signals during 6th march.
a. Line Voltage
International Journal of Electrical Components and Energy Conversion 2017; 3(3): 40-62 52
b. Frequncy
c. Power
53 Khaled Mohamed Kotb Fetyan: Electrical Power Quality Analysis and Hydraulic Performance for
Photo Voltaic Surface Water Pumping Unit
d. P. F.
Figure 12. Electrical measurements during 16th July.
a. Instantaneous flicker
International Journal of Electrical Components and Energy Conversion 2017; 3(3): 40-62 54
b. THD %
c. 3rd harmonics
Figure 13. Power quality signals during 6th March day.
55 Khaled Mohamed Kotb Fetyan: Electrical Power Quality Analysis and Hydraulic Performance for
Photo Voltaic Surface Water Pumping Unit
a. 5th harmonics
b. 7th harmonics
International Journal of Electrical Components and Energy Conversion 2017; 3(3): 40-62 56
c. 9th harmonics
d. 11th harmonics
57 Khaled Mohamed Kotb Fetyan: Electrical Power Quality Analysis and Hydraulic Performance for
Photo Voltaic Surface Water Pumping Unit
e. 13th harmonics
Figure 14. Power quality signals during 6th March day.
a. Instantaneous flicker
International Journal of Electrical Components and Energy Conversion 2017; 3(3): 40-62 58
b. THD %
c. 3rd harmonics
59 Khaled Mohamed Kotb Fetyan: Electrical Power Quality Analysis and Hydraulic Performance for
Photo Voltaic Surface Water Pumping Unit
d. 5th harmonics
Figure 15. Power quality signals during 6th March day.
a. 7th harmonics
International Journal of Electrical Components and Energy Conversion 2017; 3(3): 40-62 60
b. 9th harmonics
c. 11th harmonic
61 Khaled Mohamed Kotb Fetyan: Electrical Power Quality Analysis and Hydraulic Performance for
Photo Voltaic Surface Water Pumping Unit
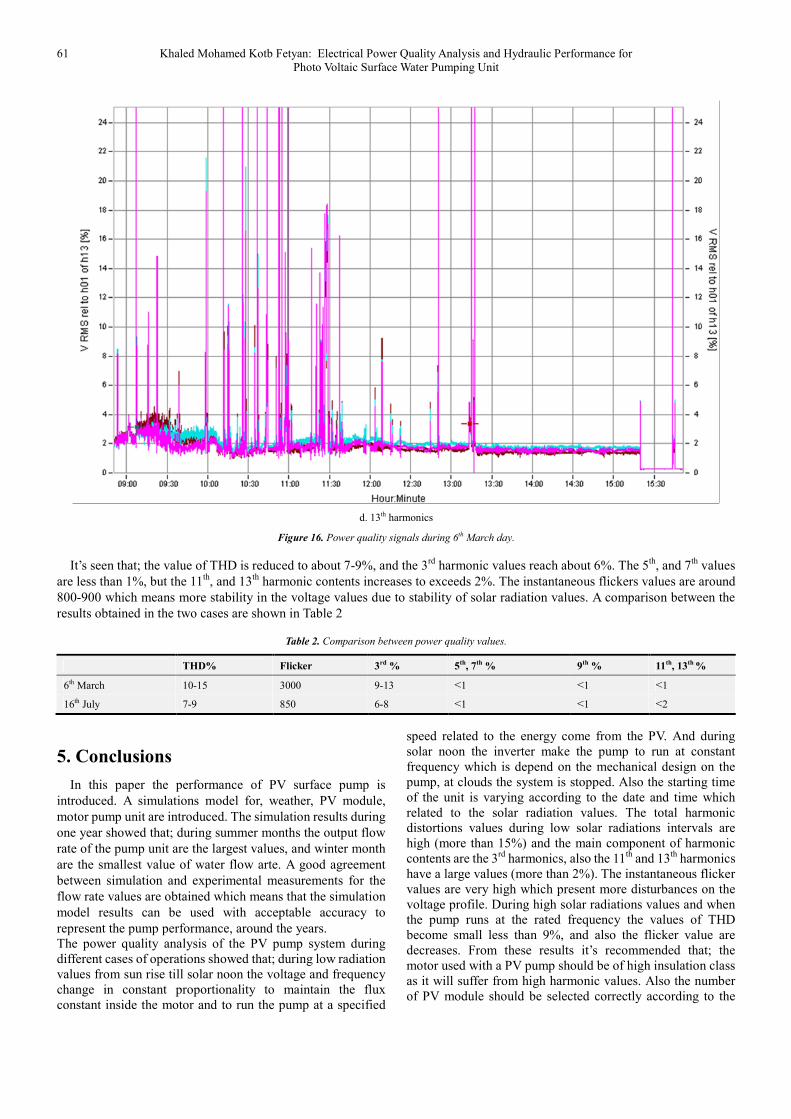
d. 13th harmonics
Figure 16. Power quality signals during 6th March day.
It’s seen that; the value of THD is reduced to about 7-9%, and the 3rd
harmonic values reach about 6%. The 5th
, and 7th
values
are less than 1%, but the 11th
, and 13th
harmonic contents increases to exceeds 2%. The instantaneous flickers values are around
800-900 which means more stability in the voltage values due to stability of solar radiation values. A comparison between the
results obtained in the two cases are shown in Table 2
Table 2. Comparison between power quality values.
THD% Flicker 3rd % 5th, 7th % 9th % 11th, 13th %
6th March 10-15 3000 9-13 <1 <1 <1
16th July 7-9 850 6-8 <1 <1 <2
5. Conclusions
In this paper the performance of PV surface pump is
introduced. A simulations model for, weather, PV module,
motor pump unit are introduced. The simulation results during
one year showed that; during summer months the output flow
rate of the pump unit are the largest values, and winter month
are the smallest value of water flow arte. A good agreement
between simulation and experimental measurements for the
flow rate values are obtained which means that the simulation
model results can be used with acceptable accuracy to
represent the pump performance, around the years.
The power quality analysis of the PV pump system during
different cases of operations showed that; during low radiation
values from sun rise till solar noon the voltage and frequency
change in constant proportionality to maintain the flux
constant inside the motor and to run the pump at a specified
speed related to the energy come from the PV. And during
solar noon the inverter make the pump to run at constant
frequency which is depend on the mechanical design on the
pump, at clouds the system is stopped. Also the starting time
of the unit is varying according to the date and time which
related to the solar radiation values. The total harmonic
distortions values during low solar radiations intervals are
high (more than 15%) and the main component of harmonic
contents are the 3rd
harmonics, also the 11th
and 13th
harmonics
have a large values (more than 2%). The instantaneous flicker
values are very high which present more disturbances on the
voltage profile. During high solar radiations values and when
the pump runs at the rated frequency the values of THD
become small less than 9%, and also the flicker value are
decreases. From these results it’s recommended that; the
motor used with a PV pump should be of high insulation class
as it will suffer from high harmonic values. Also the number
of PV module should be selected correctly according to the
International Journal of Electrical Components and Energy Conversion 2017; 3(3): 40-62 62
pump rating power to maintain the unit run at low radiation
values giving small amount of water.
Nomenclature
Φ latitude angle L longitude angle
δ declination angle nd day number
ω solar hour angle t local apparent time
αs solar altitude γs solar azimuth angle
ωs sunset hour angle, θ solar incidence angle
β tilt (slope) angle θZ zenith angle
S sunshine hours Isc solar constant = 1367
W/m2
Ib Beam radiation Id Diffuse radiation
Ig Global radiation It terrestrial radiation
Rb tilt factor of the beam
radiation
Rd tilt factor of the diffuse
radiation.
Rr tilt factor of the ground
reflected radiation ρe ground reflectivity.
IL light current (A); Io dark current (A);
I operation curtent (A); V operation voltage (V);
Rs series resistance (V Rsh shunt resistance (V)
A thermal voltage (V) Eq is the band gap of
silicon, (eV) and
τ is the cell cover transmittance
for solar radiation
α is the cell absorption for
the transmitted solar
ηc is the cell efficiency
Appendix
PV: Pm=300w, Voc=45.35 Isc=8.93, Vmp=35.87, Imp=8.36,
Type: EMMVEE,
Motor: 7.5kw, 380v, 50hz, 0.88pf, 1480rpm, 15A,
Pump: 162M3/h=45l/s, 12.7m, 1460rpm.
References
[1] Posorski R. “Photovoltaic water pumps, an attractive tool for rural drinking water supply”, Solar Energy 1996; 58(4:6):155:63.
[2] Pande P. C., A. K. Singh, S. Ansari, S. K. Vyas and B. K. Dave; “Design development and testing of a solar PV pump based drip system for orchards”, Renewable Energy, 2003, 28, 385–396.
[3] Short, T. D. and P. Thompson; “Breaking the mould: solar water pumping -the challenges and the reality”, Solar Energy, 2003, 75: 1–9.
[4] Betka A. and A. Moussi; “Performance optimization of a photovoltaic induction motor pumping system”, Renewable Energy, 2004, 29:2167-2181.
[5] GSES, “Solar-powered pumping in agriculture: A guide to system selection and design”, First edition, August 2014, ISBN: 978-0-9942464-1-7, Citation: NSW Farmers, 2015,
[6] Teresa D. Morales, “Design of Small Photovoltaic (PV) Solar-Powered Water Pump Systems, Natural Resources Conservation Service”, Technical Note No. 28, October 2010.
[7] Villages, N. Argaw R. Foster and A. Ellis, “Renewable Energy for Water Pumping Applications in Rural Villages”, NREL/SR-500-30361, July 2003.
[8] Thomas Jenkins, “Designing Solar Water Pumping Systems for Livestock”, Circular 670, Las Cruces, NM, December 2014.
[9] Centre for Technology Alternatives for Rural Areas, Indian Institute of Technology. Application of Solar PV based Pumping for irrigation: A survey Report. Bombay Powai, Mumbai 400 076. December 2012. http://www.ctara.iitb.ac.in/tdsl/pastreports/autumn2012/solarpvpumpingsurvey.pdf
[10] A Green and Prosperous Middle East. Thursday, January 24, 2013. http://greenandprosperousmiddleeast.blogspot.com/2013/01/solar panelsirrigation-and-local.html
[11] Helmy E. Gad and Safya M. El-Gayar, “Using Photovoltaic Array for Solar Water Pumping in Toshka Region”, Egypt Fifteenth International Water Technology Conference, IWTC 2011, Alexandria, Egypt.
[12] H. Tabaei, and M. Ameri, “Improving the effectiveness of a photovoltaic water pumping System by using booster reflector and cooling array surface by a film of water”, transactions of mechanical engineering, vol. 39, no. M1, pp 51-60, 2015.
[13] Ben Wat erman, “Solar Water Pumping Basics”, http://new farme rproject. word press.com/2012/06/14/solar-water-pumping-basics/ May 16, 2013.
[14] Küc¸üker, A., Bayrak, M., “Detection of Mechanical Imbalances of Induction Motors with Instantaneous Power Signature Analysis”. Electr. Eng. Technol. 8, 742, 2013.
[15] Liang, X., Luy, L., “Harmonic analysis for induction motors. In: Canadian Conf. Electrical and Computer Engineering”, pp: 172–177. 2006.
[16] Wiley, Jones, Araceli Hernández Bayo “Voltage Fluctuations and Flicker; Case Study”, Handbook of Power Quality, 2008.
[17] John A. Duffe, William A. Beckman, “Solar engineering of thermal processes”; Second Edition;, 1980.
[18] T. Markvart &L. Castaner, “Practical handbook of photovoltaic fundamentals and applications”; 2003 Elsevier Ltd.
[19] M. Iqbal, “An introduction to solar radiation”, Academic Press, London, UK, 1993.
[20] A. A. Ghoneim, “Design optimization of photovoltaic powered water pumping systems”; Energy Conversion and Management, vol.47, 2006.
[21] Robert K. Snakes, “Theory of variable speed pump”; Second Edition; 1998.
[22] McGraw Hill, “Principles and applications of Electrical Engineering”; 2003.