Embed Size (px)
Citation preview
Large-Scale Network and System Integration of Electric Vehicles: A Techno-Economic Perspective Electric Vehicle Uptake and Charging
— Large-Scale Network and System Integration of Electric
Vehicles: A Techno-Economic Perspective
Milestone 3: Literature Review Report for Energy Networks
Australia, Centre for New Energy Technologies, and the Australian
Power Institute
Electric Vehicle Uptake and Charging
A CONSUMER-FOCUSED REVIEW
28 April 2021
By Patricia Lavieri and Carmen Bas Domenech
Page 2 of 55
Project:
Large-Scale Network and System Integration of Electric Vehicles: A Techno-
Economic Perspective
Document:
Milestone 3 - Literature Review: Electric Vehicle Uptake and Charging: A Consumer-
Focused Review – V02
Prepared for:
Energy Networks Australia (ENA)
The Australian Power Institute (API)
Centre for New Energy Technologies (C4NET)
Disclaimer:
This document is provided to Networks Australia (ENA) and the Centre for New
Energy Technologies (C4NET) under and subject to the terms of the Research
Agreement for the project “Large-Scale Network and System Integration of Electric
Vehicles: A Techno-Economic Perspective”.
Prepared by:
Dr Patricia Lavieri
Lecturer in Transport Engineering
Department of Infrastructure Engineering
The University of Melbourne
Carmen Bas Domenech
Research Assistant
Department of Electrical and Electronic Engineering
The University of Melbourne
Contact:
Dr Patricia Lavieri
The University of Melbourne
Faculty of Engineering and Information Technology
Level 2, 700 Swantson St
Carlton, VIC 3053
+61 3 9035 3274
Large-Scale Network and System Integration of Electric Vehicles: A Techno-Economic Perspective Electric Vehicle Uptake and Charging Page 3 of 55
As EV uptake increases worldwide, a main area of research focuses on understanding the characteristics of current EV owners and consumers most interested in transitioning to EV technology. The findings and evidence provided by such studies generate insights on the behaviour, socio-demographic characteristics, and location of these consumers, allowing the assessment of the impacts of EVs on transport and electrical networks. They also facilitate the development of policies and strategies to accelerate EV uptake in less established markets and promote charging patterns that balance electricity usage.
This report presents the results of a literature review of national and international experience with the objectives of understanding:
• Who the current and future EV consumers are and how to support and increase EV adoption.
• What the preferred charging patterns are and how to best manage charging behaviour.
The Context • EV technology is quicky evolving and long-
range battery electric vehicles are gaining most market traction globally.
• Despite significant growth in sales, the Australian market remains very limited when compared to other developed economies in Europe and North America.
• The current ratio between the number of public charging stations and the number of EVs in Australia can be considered high (1:9). Still, current public infrastructure might not be large enough to be noticed by potential mainstream consumers.
• Policies to stimulate EV adoption can be in the form of monetary incentives, charging infrastructure deployment, transport related policies and regulations, and consumer awareness and education programs. Governments usually implement a combination of these incentives. Most Australian states have developed or are developing EV strategies but actual incentives to EV purchase are still limited.
The Consumer • Globally, EV owners are still considered early
adopters. In Australia, EV sales accounted for only 0.6% of all new sales in 2019, showing that this technology is being adopted only by innovators.
• In both Europe and USA, the average EV owner is male, approaching middle age, with high income and education, living in family households with multiple vehicles. The EV is usually the main car.
• There is a lack of information about current EV owners in Australia.
• There is clear evidence of a latent demand for EVs conditional on price reductions both in Australia and globally.
Purchase Decisions • According to the Diffusion of Innovations
Theory (Rogers, 2003), ‘perceived relative advantage’ is the main determinant of adoption of innovations.
• EVs are cleaner, quieter, and have lower running costs than internal combustion engine vehicles (ICEVs). However, they also have higher purchase costs, shorter driving ranges (or at least are perceived as having) and require new users to get accustomed to charging practices.
• To the mainstream consumer, perceived relative disadvantages, such as higher purchase costs, still outweigh advantages, which calls for strategies and incentives to increase EV attractiveness.
• Consumers prefer monetary incentives over non-monetary incentives. There is special preference for purchase monetary incentives, either as purchase rebates or tax discounts.
• International experience shows that phase-out of incentives is likely to be implemented before EV technology reaches mainstream consumers. Targeting incentives at low-end long-range EVs can maximise the impacts of available funds.
• Anticipated lack of access to efficient public charging stations or home charging is a significant barrier to EV purchase. However, as
Executive Summary
Page 4 of 55
consumers become more familiar with and educated about EVs, the less they perceive public charging infrastructure as an EV purchase barrier.
• Empirical research and government incentives underestimate the importance of increasing EV information availability and trialability. User knowledge about EVs is not only important as the start of the decision process but also throughout the persuasion phase.
Charging Decisions • Preferred charging locations:
o 1st home, o 2nd work, o 3rd other destinations, and o 4th service stations.
• Long-range EVs and solar panel owners more likely to charge only at home.
• Home charging is likely to prevail in most areas in Australia where dwellings have off-street parking.
• Fast public charging infrastructure is required in long-distance travel corridors and it has been proven to contribute to an overall increase in electric vehicle kilometres travelled.
• Convenience vs. monetary savings: growing substitution of home charging by free charging at the workplace or other destinations. Free public charging infrastructure can be used to manage electricity demand spatially.
• Supermarkets are the preferred alternative destination for charging.
• The penetration of Level 2 residential and destination charging is increasing with the increase in long-range EV ownership.
• On average, EV users charge their vehicles between three and four and a half times per week and the average session does not exceed four hours. Even though these values are likely to change as the penetration of long-range EVs increase, such results are an evidence of habitual charging behaviour rather than irregular “empty-to-full” recharges.
• Even though users are receptive of Time-of-Use (ToU) tariffs, they tend to charge their vehicles in the initial hours of the price drop. Together with an uneven spatial distribution of households owning EVs, this behaviour may
cause second or local peaks. Dynamic and semi-dynamic ToU tariffs (for example, updated every 24 hours) may help avoid such peaks by continuously adjusting the price relative to the demand. However, tariffs that change dynamically, require good user interface so that users can easily learn and adapt to price fluctuations.
• Smart charging can also be accepted by users. However, user interface that allows overriding is necessary. Further, back-up public fast charging near residences can help compensate for potential increase in uncertainty and loss of control experienced by users.
• Public charging use:
o Flat fees are likely to induce long charging sessions, which might lead to inefficient use of public charging resources – especially of fast chargers.
o Parking rules and enforcement together with tariff structure can play an important role in preventing congestion and underutilisation of public charging infrastructure.
o There is a need for empirical evidence on users’ preferences and responses to more complex charging tariff structures and dynamic pricing.
EV consumer behaviour data and research need to be continuously expanded to track and predict changes brought by the evolution of battery and charging technologies as well as the transition of the adoption curve toward mainstream consumers. Both technological and consumer transitions may bring changes to EV usage and charging patterns that should be identified in advance to inform planning and promote efficient management of resources. Australia, in specific, has very limited empirical evidence on consumer preferences and behaviours regarding EV adoption, use, and charging. In this sense, there is room for empirical research based on stated and revealed preference surveys as well as charging infrastructure usage data.
Large-Scale Network and System Integration of Electric Vehicles: A Techno-Economic Perspective Electric Vehicle Uptake and Charging
Table of Contents
1 Introduction ............................................................................................................ 7
1.1 Study Objectives and Scope ............................................................................................. 7
1.2 Study Framework and Report Structure .......................................................................... 8
1.3 Methodology .................................................................................................................... 9
2 The Context ........................................................................................................... 12
2.1 Electric Vehicle Technology ............................................................................................ 12
2.2 Global and Local Market ................................................................................................. 13
2.3 Charging Technology ...................................................................................................... 16
2.4 Charging Locations.......................................................................................................... 17
2.5 Charging Infrastructure .................................................................................................. 19
2.6 Incentives and Policies .................................................................................................... 20
3 The Consumer ....................................................................................................... 22
3.1 Who is Currently Buying EVs?......................................................................................... 23
3.2 How Are Socio-demographic Profiles Changing? ........................................................... 23
4 Purchase Decisions ................................................................................................ 25
4.1 What Are the Preferred Incentives and Policies?........................................................... 26
4.2 Is Charging a Barrier to Uptake? ..................................................................................... 28
5 Charging Decisions ................................................................................................ 31
5.1 Where Do Users Prefer to Charge? ................................................................................ 32
5.2 What Are the Most Used Levels of Charging and Preferred Charging Durations? ........ 34
5.3 How Frequently Do Users Charge? ................................................................................. 36
5.4 When Do Users Charge? ................................................................................................. 38
5.5 Preferences Regarding Public Charging Infrastructure .................................................. 41
6 Conclusions ........................................................................................................... 46
References ..................................................................................................................... 50
Page 6 of 55
List of Acronyms
AC Alternate-Current ACT Australian Capital Territory AEMC Australian Energy Market Commission API Australian Power Institute BEVs Battery Electric Vehicles C4NET Centre for New Energy Technologies COVID-19 Coronavirus pandemic DC Direct-Current DCFC Direct-Current Fast Charging DR Demand Response eKMT Electric Kilometres Travelled ENA Energy Networks Australia EVC Electric Vehicle Council EV Electric Vehicle GHG Greenhouse Gas HEV Hybrid Electric Vehicles HOV High Occupancy Vehicle ICE Internal Combustion Engine ICEV Internal Combustion Engine Vehicle IEA International Energy Agency NSW New South Wales NT Northern Territories P2P Peer-to-Peer PEV Plug-in Electric Vehicle PHEV Plug-in Hybrid Electric Vehicle QHES Queensland Household Energy Survey QLD Queensland SA South Australia SEPA Smart Electric Power Alliance SMC System Managed Charging SOC State of Charge ToU tariff Time-of-Use tariff UK United Kingdom UMC User Managed Charging USA United States of America V1G Unidirectional Controlled Charging V2G Vehicle-to-Grid VIC Victoria WA Western Australia
Large-Scale Network and System Integration of Electric Vehicles: A Techno-Economic Perspective Electric Vehicle Uptake and Charging Page 7 of 55
1 Introduction
Electric vehicles (EVs) have the potential to bring substantial economic and environmental benefits
as they are less polluting and more efficient than most internal combustion vehicles. Large numbers
of EVs, if appropriately integrated to electricity networks, may provide benefits to the grid through
increased asset utilisation, demand management, and energy storage and redistribution. However,
if unmanaged, EVs have the potential to increase peak demand leading to significant network and
generation investment, and cause network security issues. In this sense, policy making that
incentivises EV uptake and proactive planning that anticipates electricity network needs must be
based on the understanding of consumer preferences and behaviours associated with EV adoption,
use, and charging.
The project “Large-Scale Network and System Integration of Electric Vehicles: A Techno-Economic
Perspective” has the objective of investigating potential impacts of EV uptake on electricity
networks under different future scenarios. The project is divided into four main research areas:
1. Consumer acceptance and charging of EVs
2. Distribution network impacts from unmanaged EVs
3. Distribution network integration of EVs using management strategies
4. Techno-economic network and system integration of EVs
Findings from the project will provide strategic inputs about the effects of EVs on the network and
the role of EV management in mitigating potential negative impacts. These results aim to inform a
roadmap for EV deployment, including an updated view on how to drive positive consumer response
to charging management, and insights into potential commercial and regulatory changes.
This report is part of Research Area 1 and presents a review of national and international literature
on preferences and behaviours of potential and current EV users regarding uptake and vehicle
charging. The outcomes of this report will be used to guide the development of a consumer survey,
which will be distributed in Australia to provide insights into future electricity demand scenarios
that will be analysed in the following steps of the project.
1.1 Study Objectives and Scope
As EV uptake increases worldwide, a main area of research focuses on understanding the
characteristics of current EV owners and consumers most interested in transitioning to EV
technology. The findings and evidence provided by such studies generate insights on the behaviour,
socio-demographic characteristics, and location of these consumers, allowing the assessment of the
impacts of EVs on transport and electrical networks. They also facilitate the development of policies
and strategies to accelerate EV uptake in less established markets and promote charging patterns
that balance electricity usage. This literature review draws information from national and
international experience with the objectives of understanding:
Page 8 of 55
• Who the current and future EV consumers are and how to support and increase EV adoption.
• What the preferred charging patterns are and how to manage charging behaviour.
In specific, the scope of this review includes:
• Identification and definition of key components involved in the decisions to purchase and charge
EVs.
• A global overview of EV uptake and charging infrastructure deployment.
• A characterisation of the EV consumer.
• Examination of the relationship between policies and incentives and EV adoption.
• Examination of the relationship between charging access and EV adoption.
• General preferences and behaviours of potential and current EV users regarding EV charging,
including preferred locations, levels, durations, frequencies, and times of day for charging.
• Specific preferences associated with public charging infrastructure, such as spatial distribution,
experienced challenges, and willingness to pay.
• Perceptions and responses to electricity demand management programs and other charging
related policies.
Recently, there is a growing interest in the relationship between automated vehicles and electric
vehicles as well as vehicle-to-grid (V2G) systems. These are newer technologies in trialling stages
(nationally and internationally) and not necessarily available to consumers yet, hence they are not
in the scope of this document. For a recent review on V2G from an Australian perspective, see Jones
et al., (2021).
1.2 Study Framework and Report Structure
Many studies have addressed the future of EV uptake through analytical models, mainly considering
EV purchase prices or price ratios between EVs and traditional internal combustion engine vehicles
(ICEVs). However, a more holistic behavioural perspective is required to fully understand the
technology adoption phenomenon and its implications to energy demand and related infrastructure
systems.
From an energy and transport systems perspective, two types of consumer decisions are of
particular interest: the decision to purchase the EV and the choices associated with charging it.
Such decisions are determined based on characteristics particular to the individual (e.g., socio-
demographics, values and beliefs, travel patterns) but are also influenced by the environment or
context surrounding the individual. In this case, the most relevant contextual aspects are:
• Vehicle technology availability and market.
• Charging technology and infrastructure availability.
• Policies and incentives provided by governments.
Large-Scale Network and System Integration of Electric Vehicles: A Techno-Economic Perspective Electric Vehicle Uptake and Charging Page 9 of 55
Purchase
Charging
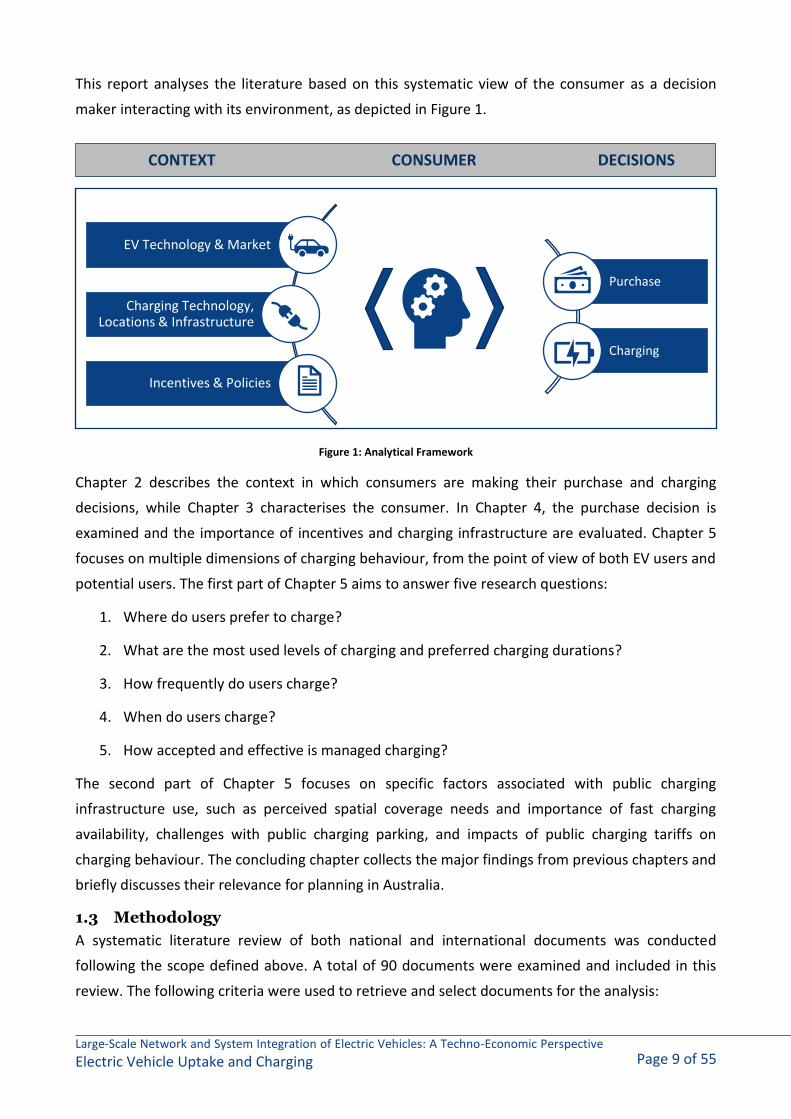
This report analyses the literature based on this systematic view of the consumer as a decision
maker interacting with its environment, as depicted in Figure 1.
Figure 1: Analytical Framework
Chapter 2 describes the context in which consumers are making their purchase and charging
decisions, while Chapter 3 characterises the consumer. In Chapter 4, the purchase decision is
examined and the importance of incentives and charging infrastructure are evaluated. Chapter 5
focuses on multiple dimensions of charging behaviour, from the point of view of both EV users and
potential users. The first part of Chapter 5 aims to answer five research questions:
1. Where do users prefer to charge?
2. What are the most used levels of charging and preferred charging durations?
3. How frequently do users charge?
4. When do users charge?
5. How accepted and effective is managed charging?
The second part of Chapter 5 focuses on specific factors associated with public charging
infrastructure use, such as perceived spatial coverage needs and importance of fast charging
availability, challenges with public charging parking, and impacts of public charging tariffs on
charging behaviour. The concluding chapter collects the major findings from previous chapters and
briefly discusses their relevance for planning in Australia.
1.3 Methodology
A systematic literature review of both national and international documents was conducted
following the scope defined above. A total of 90 documents were examined and included in this
review. The following criteria were used to retrieve and select documents for the analysis:
EV Technology & Market
Charging Technology, Locations & Infrastructure
Incentives & Policies
CONTEXT CONSUMER DECISIONS

Page 10 of 55
• Diversity and timeliness: retrieved documents ranged from private and public agency reports
and commentary (including from consultants and think thanks) to academic literature, ensuring
that the most up to date information was included.
• Empirical evidence: only studies that provided empirical evidence on consumer preferences or
behaviours were included. These could be studies based on unique data sets and data analyses
(based on surveys or observational data) or could involve literature review material
summarising empirical findings. There are currently multiple ongoing research and trialling
efforts within the scope of this review; however, they are not included if empirical results are
yet to be published.
• EV technologies: both battery electric vehicles (BEVs) and plug-in hybrid electric vehicles
(PHEVs) were considered and, when appropriate and feasible, these two technologies were
differentiated. Even though BEVs are more relevant for in terms of electric grid impacts, most
of the currently available literature includes PHEVs, which justifies the inclusion of this vehicle
category.
• Geographic coverage: The specific geographic coverage of the review was defined based on
literature availability. Ideally, the review would have focused on studies from Australia and New
Zealand, as these would be directly applicable. However, local consumer behaviour studies are
scarce. Countries with larger EV markets tend to have more empirical evidence on consumer
preferences and use of EVs. For this reason, an emphasis was given to North American and
European studies. Australia’s urbanisation patterns (e.g., urban density) and vehicle ownership
rates can be placed in between those from North American and European countries. In this
sense, insights into the Australian context can be extracted by comparing the results of both
sources. While Asian countries, such as China and Japan, have rather developed EV markets,
their urbanisation and travel behaviour patterns present greater dissimilarity to Australia when
compared to North America and Europe. For this reason, while some results from China and
Japan are discussed, they are expected to be less applicable to guide local planning.
• Revealed and stated preference data. Measuring, understanding, and later predicting
consumer behaviour regarding the adoption and use of new technologies is an arduous task
because of the challenges associated with sampling, overall data quality, and
representativeness. Such sampling and representativeness issues arise from: (1) the difficulty
in recruiting study participants from a reduced and sparse population, such as EV owners; and
(2) the fact that individuals who are on the forefront of technology adoption are usually
intrinsically different than mainstream consumers, as explained in Chapter 3.
In the absence of observational data from mainstream consumers, stated preference surveys or
experimental studies are used. Stated preference surveys are addressed to potential EV consumers,
eliciting their preferences and attitudes toward EVs and related infrastructure, and sometimes their
Large-Scale Network and System Integration of Electric Vehicles: A Techno-Economic Perspective Electric Vehicle Uptake and Charging Page 11 of 55
stated choices under hypothetical scenarios. The limitation with this approach is that what
respondents state as a preference may not reflect their true behaviour in a real-world situation.
Experimental studies, on the other hand, allow participants to experience EVs during a certain
period of time while they are observed. An example of an experimental study is lending EVs to
individuals characterised as mainstream consumers for a couple of weeks or months and collecting
data on their distances travelled and charging behaviour through onboard computers. This type of
study is the least prevalent in the literature due to high associated costs. Additionally, although
experimental studies generate observational data from mainstream consumers, participants may
not act naturally because of the observational setting or they may not have enough time to adapt
to the new technology.
This literature review reports on studies that are based on either of the three approaches described
above: revealed EV owner behaviour and usage patterns, stated preferences from potential users,
and experimental.
Page 12 of 55
2 The Context
This chapter presents definitions and background information that are essential to understand
consumers’ decisions to purchase and charge EVs. Six key contextual elements that influence these
decisions are explored:
• EV technology,
• EV global and local market, including recent impacts of the COVID-19 pandemic,
• charging technology,
• charging locations, including factors that influence residential charging availability,
• deployed charging infrastructure, and
• government incentives and policies.
2.1 Electric Vehicle Technology
An electric vehicle may be defined as any vehicle that uses electric motors for propulsion. This class
of vehicles may include trains, trucks, automobiles, and even electric bicycles. However, it is
common in the literature that the term “electric vehicle” or EV be used as a synonym to electric
passenger vehicles, also known as electric cars. This report focuses exclusively on passenger cars
but uses the common and general terminology, ‘EV’.
There are three types of cars that utilise electric (or partially electric) propulsion systems. They are
classified based on their degree of reliance on electricity as the main energy source:
• Battery electric vehicles (BEVs), also known as plug-in electric vehicles (PEVs), are fully electric
and have no internal combustion engines (ICE). BEVs/PEVs rely exclusively on batteries that
need to be charged via electrical outlets.
• Plug-in hybrid electric vehicles (PHEVs) utilise batteries that can be recharged both by electrical
outlets and the vehicle’s ICE. These vehicles can operate in all-electric mode or in mixed mode,
depending on the required acceleration and speeds as well as the battery state of charge.
• Hybrid electric vehicles (HEVs) also combine an ICE system with an electric propulsion system,
but they cannot be charged through an electric power source or be “plugged-in”. In this sense,
HEV technology simply uses the electric propulsion system to improve conventional fuel
efficiency and vehicle performance. While HEVs can run about three kilometres before engaging
the ICE, PHEVs can run from 15 to 65 kilometres on all-electric mode (EVgo, 2020).
In this report, we focus exclusively on BEVs and PHEVs, as these are the vehicles that can impact the
demand for electricity. The term State of Charge (SOC) is used to characterise the percentage
estimate of how full the vehicle’s battery is.
BEVs can be further segmented into short-range and long-range. Long-range BEVs are newer to the
market and have battery capacity of more than 50kWh, which enables driving ranges of more than
250 kilometres in a single charge. The most popular example of long-range BEV is Tesla’s Model 3,
Large-Scale Network and System Integration of Electric Vehicles: A Techno-Economic Perspective Electric Vehicle Uptake and Charging Page 13 of 55
which entered the United States (USA) market in 2017 as the first Tesla Motors car aimed for mass
market. In 2019, the Tesla Model 3 already represented 47% of all yearly EV sales in the USA
(Fleetcarma, 2020).
Long-range BEVs cater to a much larger market than traditional short-range BEVs and allow for
significantly different travel and charging patterns by their users. In this sense, the transition from
short-range to long-range EVs is likely to cause significant changes in EV electricity consumption
patterns. Therefore, caution is required when planning for future electricity demand scenarios
based on past EV usage data. As an illustration, in a large-scale study in North America by
Fleetcarma, when comparing charging data from 2014 and 2019, it was observed that even though
users would charge their vehicles for the same amount of time, the charging load for each session
had doubled, from 4.5kW, on average in 2014, to 9.7kW, on average in 2019. They also observed
that long-range BEV owners drive on average 50% more kilometres per month than short-range BEV
owners (Fleetcarma, 2020). Similar differences were observed by Hu et al. (2019) when analysing
data from the 2017 American National Household Travel Survey. Daily average distances travelled
by long-range BEV owners are statistically equivalent to those travelled by ICE vehicles (ICEVs), and
close to 60% longer than distances travelled by short-range BEVs.
Similarly to what is being observed in the USA, Australia’s developing EV market is likely to have
long-range EVs as the standard. However, since the literature on EV consumer behaviour is still
limited, the current review includes PHEVs and short and long-range EVs, identifying relevant
differences when feasible.
2.2 Global and Local Market
Recent studies suggest current consumers form many countries have strong interest in EVs;
however, markets have yet to translate these interests into actual sales and use of EVs (Alix Partners,
2019). Several factors, including charging infrastructure, are believed to currently inhibit consumer
EV use and ownership. Nevertheless, demand trends and technological advancements forecast an
increase in EV presence globally.
Data compiled by IEA (2020, 2021) show deployment of EVs globally in 2013 at 230,000 units with a
more than steady increase to 10 million EVs deployed by the end of 2020. The Australian Energy
Market Commission affirms the trend of increasing EV purchase, citing a 46% increase in sales in the
first half of 2019, compared to the same period in 2018 (AEMC, 2020). China, Europe and the United
States have shown the largest cumulative demand for EVs to date by country/region (IEA, 2019). It
is suggested that with densely populated cities, and therefore shorter average distances travelled,
China has predominantly purchased short-range EVs. In the USA, long-range EVs are quickly taking
over the market, as their sales share has increased in proportion from 14% in 2014 to 66% in 2019
(Fleetcarma, 2020).
Page 14 of 55
Although Australian EV uptake has a lower trajectory than global EV sale trends, the growing
momentum of EV sales in Australia has been demonstrated. 1,530 EVs were sold in 2016, while the
number steadily increased each year through 2019 with 6,718 EVs purchased (AEMC, 2020). The
current number of EVs in the country is estimated to be close to 20,100 units (IEA, 2020). The Electric
Vehicle Council conducted surveys to understand consumer awareness and purchase intentions of
EVs both in 2017 and in 2019 (EVC, 2019). While 19% of respondents stated they had undertaken
research into purchasing an EV in 2017, this fraction increased to 45% in 2019. In 2019, all
respondents surveyed were aware of EVs existence, 2% already owned an EV and another 6% were
currently in the process of purchasing one. The survey showed that Australians have high awareness
of EV availability with an increasing level of interest in EV ownership. Like in the USA, it is presumed
that Australian interest may continue to increase as longer range BEVs become available.
Even with the periodic increases in EV sales and demonstrated consumer interest in EVs year-on-
year, Australian EV market penetration is only a fraction of the traditional ICE vehicles. In 2019, over
one-million ICE vehicles were sold in Australia compared to the previously stated 6,718 EVs sold in
the same period (AEMC, 2020). As percentage of new car sales, the ACT outperforms other states
with 83 EVs purchased for every 10,000 vehicles sold, while in Victoria there are 27 EVs purchased
for every 10,000 vehicles sold (EVC, 2020). The time required to charge, current purchase costs for
EVs, battery range capability, concerns regarding an inadequate number of charging stations, and
servicing costs of EVs have been inhibiting EV ownership (New Zealand Ministry for the
Environment, 2018).
The higher cost for EVs versus comparable ICE vehicles is a considerable factor limiting EV uptake
by Australians. The Electric Vehicle Council survey of 2019 found that 69% of respondents would
consider buying an EV if prices were equivalent to ICE vehicles (EVC, 2019). 28 EV models are
currently sold in the Australian market and only eight are under $65,000 AUD (EVC, 2020). However,
it has been forecasted (prior to COVID-19 crisis) that EV purchase prices will be competitive with
their ICE counterparts by 2024 (Bloomberg New Energy Finance, 2020). The increased affordability
coupled with technological improvements in range capability will reduce consumer concerns and
increase EV demand, contributing for the adoption “tipping point” (AEMC, 2020).
A distance-based road-user charge to zero and low-emission light vehicles will be implemented in
the State of Victoria in mid-2021 and is currently under consultation in South Australia (VicRoads,
2021; Government of South Australia, 2021). The road-user charge has been proposed as a long-
term tax-reform solution to ensure future resources for funding transport infrastructure, including
EV charging facilities. In Victoria, increases in EV operating costs are expected to be under AUD $400
per year for most users (VicRoads, 2021). There is significant debate on whether the proposed
charging mechanism is adequate, and thus, it is unclear if it will last or gain traction across other
States. The potential magnitude of the impacts on EV sales and market penetration are also
unknown at this stage.
Large-Scale Network and System Integration of Electric Vehicles: A Techno-Economic Perspective Electric Vehicle Uptake and Charging Page 15 of 55
2.2.1 COVID-19 Impacts on the EV Market
The COVID-19 pandemic has caused a significant economic crisis across the world, which
contributed to a global contraction in car sales of around 14% in 2020. The EV market, on the other
hand, continued to grow, with Europe leading the way (IEA, 2021).
• EV sales in Europe more than doubled between 2019 and 2020. Such increase was achieved by
maintaining strict GHG emission targets and adopting response measures to the economic crisis
that incentivised EV uptake. For example, countries like France, Germany, and Italy increased
the subsidies to BEV and PHEV purchase as part of their package of stimuli to the automotive
sector (IEA, 2021). The strict emission targets also contributed to car manufacturers prioritising
EV production, with 42 new EV models being introduced in Europe in 2020 (McKinsey &
Company, 2020).
• The USA adopted a different economic recovery strategy, decreasing fuel-economy standards
and relaxing GHG emission targets. Together with a transient fall in oil prices due to lower
demand, the regulatory context discouraged EV manufacturing and purchase (McKinsey &
Company, 2020). Consequently, EV sales in the USA remained practically constant between 2019
and 2020 (IEA, 2021).
• China had experienced an EV market deceleration from 2018 to 2019 because of EV purchase
subsidies phase-out. Subsidies were re-established right before the pandemic and enabled the
market to recover in the second half of 2020 resulting in a year-by-year increase in sales of 12%.
Additionally, China kept strong federal fleet-emission targets and developed an emission credit
system that rewards manufacturers producing zero emission vehicles (McKinsey & Company,
2020; IEA, 2021).
• Australia experienced a similar stagnation in EV sales as the one observed in the USA, with no
significant growth between 2019 and 2020 (EVC, 2021). While the pandemic crisis may have
contributed to such figures, the absence of fuel efficiency standards or aggressive GHG emission
reduction targets, together with reduced incentives for EV purchase are also probable causes
for such stagnation.
Overall, it is observed that nations that are seeking economic recovery from the pandemic based on
measures that also tackle climate change are heavily investing in actions that contribute to EV
uptake. According to a study by McKinsey, such actions are having the expected effect and 2021
should continue to see an EV market growth in Europe and China. On the other hand, the American
market is likely to present a slower recovery (McKinsey & Company, 2020). Projections for the
Australian market are not available. Yet, mirroring some of the European initiatives would certainly
benefit the national uptake of EVs.
Page 16 of 55
2.3 Charging Technology
EVs require recharging points or charging stations to recharge their batteries. There are different
classes of chargers available in the market, allowing for varying charging speeds, which impose
different loads to the electricity distribution system. Chargers are classified based on three main
characteristics: level, mode, and type.
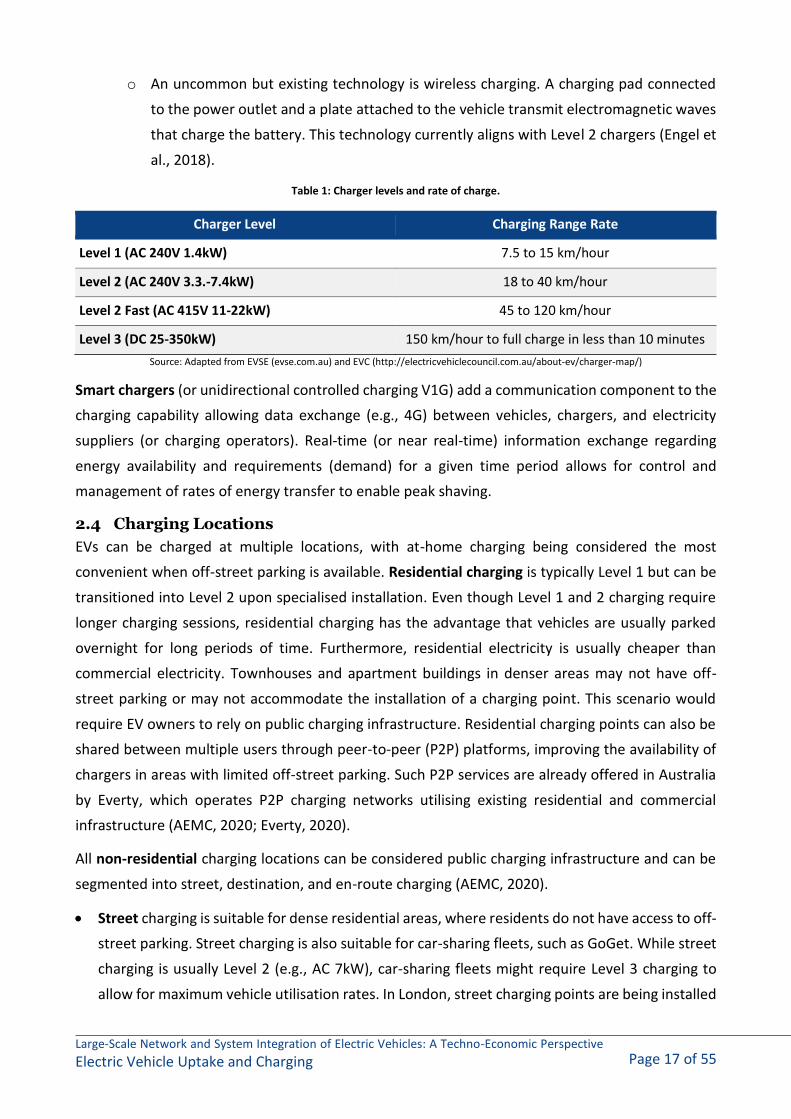
• Level is the power output range of the charger, as shown in Table 1. Currently there are three
levels of chargers; Level 1, Level 2, and Level 3 offering progressively faster charging capabilities,
respectively.
o Levels 1 and 2 provide alternate-current (AC) charging that is converted into direct
current (DC) by an inverter in the vehicle. Level 1 requires a standard power point, while
Level 2 requires specialised installation equipment.
o Level 3 chargers, also known as direct-current fast charging (DCFC), convert AC from the
power grid to DC before sending electricity to the vehicle. They require a specialised
charging station.
• Mode is strongly associated with level and defines the communication protocol between the
vehicle and the charger. Currently there are four Modes: Mode 1, Mode 2, Mode 3, and Mode
4.
o Mode 1 represents charging through a standard AC outlet (such as the electrical outlets
found in residences) and cable. This mode is considered obsolete due to heating and fire
hazard as well as protection limits.
o Mode 2 uses a standard AC outlet but incorporates an in-cable charge controller that
ensures that the cable is only live when the vehicle is charging.
o Mode 3 requires a dedicated AC circuit, and the controller is installed as part of the
outlet.
o Mode 4 requires a DC installation. Both modes 3 and 4 require control systems as part
of the installation to manage the communication between charging station and vehicle.
• Type represents the model of socket and plug/connector used for charging. Different countries
have standardised different charger types.
o Type 1 (SAE J1772) is the standard plug type across Australia and can be connected
directly to most USA and Japanese car brands.
o Type 2 accommodates both AC and DC charging and is directly compatible with Tesla
Motors and European vehicles available in Australia.
o Super-fast Level 3 charging uses CHAdeMO plugs that have recently been incorporated
in USA and Japanese car models.
o A combination of Type 2 and CHAdeMO, called SAE Combo, is also available as a more
universal alternative (EVSE, 2020).
Large-Scale Network and System Integration of Electric Vehicles: A Techno-Economic Perspective Electric Vehicle Uptake and Charging Page 17 of 55
o An uncommon but existing technology is wireless charging. A charging pad connected
to the power outlet and a plate attached to the vehicle transmit electromagnetic waves
that charge the battery. This technology currently aligns with Level 2 chargers (Engel et
al., 2018).
Table 1: Charger levels and rate of charge.
Charger Level Charging Range Rate
Level 1 (AC 240V 1.4kW) 7.5 to 15 km/hour
Level 2 (AC 240V 3.3.-7.4kW) 18 to 40 km/hour
Level 2 Fast (AC 415V 11-22kW) 45 to 120 km/hour
Level 3 (DC 25-350kW) 150 km/hour to full charge in less than 10 minutes
Source: Adapted from EVSE (evse.com.au) and EVC (http://electricvehiclecouncil.com.au/about-ev/charger-map/)
Smart chargers (or unidirectional controlled charging V1G) add a communication component to the
charging capability allowing data exchange (e.g., 4G) between vehicles, chargers, and electricity
suppliers (or charging operators). Real-time (or near real-time) information exchange regarding
energy availability and requirements (demand) for a given time period allows for control and
management of rates of energy transfer to enable peak shaving.
2.4 Charging Locations
EVs can be charged at multiple locations, with at-home charging being considered the most
convenient when off-street parking is available. Residential charging is typically Level 1 but can be
transitioned into Level 2 upon specialised installation. Even though Level 1 and 2 charging require
longer charging sessions, residential charging has the advantage that vehicles are usually parked
overnight for long periods of time. Furthermore, residential electricity is usually cheaper than
commercial electricity. Townhouses and apartment buildings in denser areas may not have off-
street parking or may not accommodate the installation of a charging point. This scenario would
require EV owners to rely on public charging infrastructure. Residential charging points can also be
shared between multiple users through peer-to-peer (P2P) platforms, improving the availability of
chargers in areas with limited off-street parking. Such P2P services are already offered in Australia
by Everty, which operates P2P charging networks utilising existing residential and commercial
infrastructure (AEMC, 2020; Everty, 2020).
All non-residential charging locations can be considered public charging infrastructure and can be
segmented into street, destination, and en-route charging (AEMC, 2020).
• Street charging is suitable for dense residential areas, where residents do not have access to off-
street parking. Street charging is also suitable for car-sharing fleets, such as GoGet. While street
charging is usually Level 2 (e.g., AC 7kW), car-sharing fleets might require Level 3 charging to
allow for maximum vehicle utilisation rates. In London, street charging points are being installed
Page 18 of 55
in lamp posts next to parking bays. Australian city councils are still working to develop on-street
charging solutions (AEMC, 2020; Milligan, 2018; REVWG, 2018).
• Destination charging locations are places where individuals go to perform activities and thus are
likely to stay parked for more than half an hour. Examples are workplaces, shopping or dining
facilities, as well as parks and other recreational sites. Many retail locations offer free EV
charging as a way to attract customers and promote longer stays. Other destination charging
locations opt for a pay-for-use model in which charging, and parking are sold together.
Destination charging locations usually offer Level 2 chargers (AEMC, 2020; REVWG, 2018).
• En-route charging locations are the most similar to the current service stations and are likely to
be co-located with them. This type of infrastructure may be located within urban areas but is
more suitable for highways to enable long-distance EV travel. Since en-route charging locations
have the single purpose of providing electricity to vehicles, such places have to offer fast
charging options, and thus, require Level 3 chargers. The deployment of this type of
infrastructure is still limited but likely to grow fast as EV uptake increases in Australia. The use
of such fast-charging facilities is likely to present higher costs to users compared to other public
charging services (AEMC, 2020; REVWG, 2018).
2.4.1 Residential Charging Potential
Home charging is the most preferred and frequently used charging location among current and
potential EV users in North America and Europe. However, several different factors can affect the
availability and feasibility of home charging. Understanding these factors is crucial for estimating
the percentage of households that can have access to home charging in emerging markets and plan
for the necessary infrastructure.
In regions where most households have their own dedicated off-street parking such as a driveway
or garage, home charging prevails as the preferred charging method as these individuals are able to
plug-in the EV to their home’s electrical system. This is demonstrated in Norway and California, USA,
where 90% and 86% (respectively) of EV driving households prefer and use home charging (Funke
et al., 2019; Lee at al., 2020). However, for apartment residents, even when off-street parking is
available, power sources are usually of difficult access and individual energy metering is not feasible,
which hinders the potential for residential charging (Lee et al., 2020).
Based on Axsen and Kurani’s (2012) survey on residential access to home charging in the USA, living
in a detached house and having a private garage increases the likelihood of home charging access.
While 59% of residents living in detached houses have access to Level 1 charging, only one-in-six
apartment buildings could potentially have access to Level 1 charging. In terms of Level 2 charging,
while it also depends on dwelling type and parking availability, it requires investments in electrical
installations, which are more likely to happen when individuals own the residence. As observed by
Wolff and Madlener (2019) and Lee et al. (2020) homeowners have higher willingness to invest in
home charging facilities.
Large-Scale Network and System Integration of Electric Vehicles: A Techno-Economic Perspective Electric Vehicle Uptake and Charging Page 19 of 55
Although availability of home parking can be an indicator of potential access to home charging, data
pertaining to home parking is not always available. Therefore, the share of detached and semi-
detached houses can be used as an approximation to parking availability and, consequently, home
charging feasibility. Population density can also be a proxy to availability of home parking. This is
because the proportion of detached houses decreases as populations density increase (Funke et al.,
2019).
Daily driving distance and driving range of EVs are two important factors in defining charging
infrastructure needs (Funke et al., 2019). If a household has residential charging available and is able
to meet all its vehicular travel needs within a single battery charge, the dependence on public
charging will be significantly lower. In this sense, analysing household travel patterns in conjunction
with potential for home charging can provide initial insights into a city or region’s degree of public
charging reliance.
2.5 Charging Infrastructure
At the end of 2019, approximately 7.3 million charging points were estimated worldwide with the
number of private charging points growing faster than public charging points from the previous year.
Understanding the specifics of private charging stations, whether Level 1 and/or Level 2, is
challenging, as electrical outlets at home may not have been exclusively dedicated to EV charging.
Further, it is difficult to track the installation of specialised equipment for Level 2 charging on private
properties. Based on the observation of major EV markets, the estimated ratio of private charging
points to EVs about 1.1 charger per car. In China and Japan, where cities are denser, the ratio is
lower, around one private charger per 1.5 EVs (IEA, 2020). Countries with a ratio near 1:1 are
believed to be doing most EV charging at home, which can enable better power system
management as charging events can occur during lower electricity demand hours. The International
Energy Agency estimates that about 60% of total electricity consumed by EVs worldwide by 2030
will be through Level 1 and Level 2 private charging points (IEA, 2019).
In 2019, a total of 862,000 publicly accessible EV chargers were in operation globally. The growth
rate of new public EV charging point installations has been on the decline. There was a 60% increase
in the number of public chargers between 2018 and 2019. With 60% of all publicly accessible
charging points located in China, other countries on the forefront of EV deployment have less than
one public charger per 10 EVs. The United States and Norway have one charger per 20 EVs. China
also leads in terms of fast (Level 3) public charging infrastructure. The international Energy Agency
estimates that half of the new public chargers installed in China in 2018 were fast chargers, or Level
3 chargers, while only about a third of public chargers installed elsewhere in the world were Level 3
(IEA, 2019, 2020). As land availability constraints in densely populated areas restrict home charging,
countries like China and Japan present greater needs and stronger reliance on public fast charging
infrastructure.
Page 20 of 55
In Australia, in 2020, there were 1,950 standard public charging stations and 350 fast charging
stations (EVC, 2020). Considering the 20,100 EV fleet, the ratio between public charging stations and
EVs was 1:9. In 2019, the State of Victoria had 356 Level1/2 public chargers and another 47 Level 3
charging points distributed across 17 different sites. New South Wales is the only state with more
public charging infrastructure than Victoria (EVC, 2019).
2.6 Incentives and Policies
Governments around the world have set goals to transition the transport sector into a more
environmentally sustainable future. For example, greenhouse gas (GHG) reduction targets, fuel
efficiency standards, EV sales targets, among others (see IEA, 2020, for an overview). To reach these
targets, multiple strategies have been proposed and implemented to increase the market
penetration of EVs. Strategies may include monetary incentives, charging infrastructure
deployment, transport related policies and regulations, and consumer awareness and education
programs.
• Monetary incentives can be at the time of purchase or recurring.
o One-off incentives:
▪ purchase cost discounts or rebates,
▪ tax (e.g., stamp duty) exemption, discounts, or credits, and
▪ residential charger or smart charger purchase and installation discounts
o Recurring incentives:
▪ licensing discounts, and
▪ electricity discounts
• Charging infrastructure deployment is a strategy adopted to reduce range anxiety among
potential EV buyers. Investments can be towards the increase in number of charging stations
and fast chargers, or the provision of free public charging.
• Transport policies and regulations can either increase the transport system level of service
for EVs or restrict and penalise the use of ICE vehicles. For example:
o free, discounted, or preferential parking,
o toll road fee waivers or discounts,
o special lane access, such as high occupancy vehicle lanes (HOVs) and bus lanes,
o increased petrol taxes, and
o congestion pricing or other circulation restrictions exemption for EVs.
Transport policies and regulations usually aim at broader impacts than only EV adoption, for
example, alleviation of traffic and air quality improvement. These measures may not be
perceived directly during the purchase, but they reduce the running costs and improve the
travel experience of EV users.
Large-Scale Network and System Integration of Electric Vehicles: A Techno-Economic Perspective Electric Vehicle Uptake and Charging Page 21 of 55
• Consumer awareness can be brought by increasing EV visibility in the reads by having
government, taxi, shared vehicles, and public transport fleets electrified. Awareness of both
EV technology, charging infrastructure, and incentives available can be raised through news
channels and publicity campaigns, trials, test drive and short rental opportunities.
Educational campaigns can be used to inform consumers about EV ranges and charging.
Electric vehicle policies in Australia are still limited. The Federal Government is still developing a
National EV Strategy, while some states (QLD, NSW, ACT) have already developed or are developing
(VIC, SA, WA, NT) a transition plan. None of these plans include EV sales targets or substantial
purchase incentives. Instead, most of them rely on charging infrastructure deployment and
discounted registration rates. ACT has the most ambitious plan including government and bus fleet
transition as well as transport policies, such as allowing EVs to use bus lanes until 2023. Further
details on the federal and state strategies are available in the State of Electric Vehicles 2020
published by the Electric Vehicle Council (EVC, 2020).
Page 22 of 55
3 The Consumer
As with any other innovation, EV uptake is gradually increasing, and the profile of consumers
interested and adopting such technology is changing. This chapter presents a theoretical
perspective on the evolution of adopter characteristics relative to technology maturity.
Subsequently, socio-demographic profiles of current EV buyers are discussed together with
perspectives on how these profiles are likely to change in the near future.
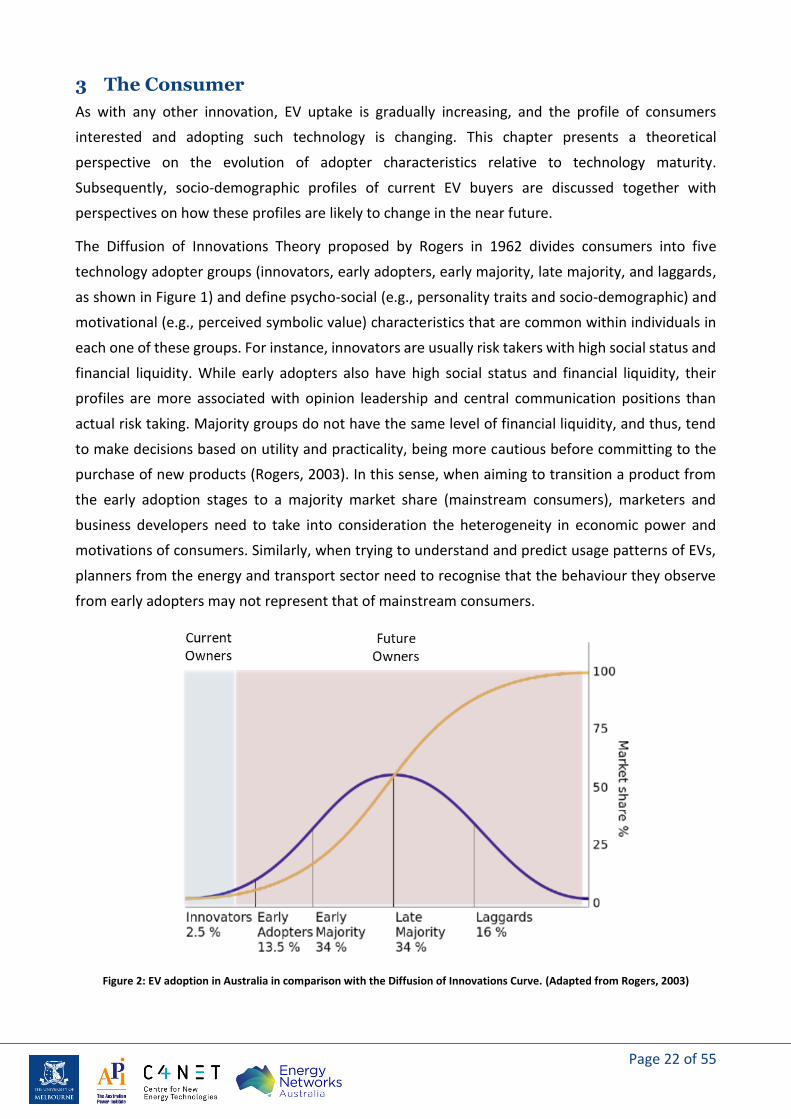
The Diffusion of Innovations Theory proposed by Rogers in 1962 divides consumers into five
technology adopter groups (innovators, early adopters, early majority, late majority, and laggards,
as shown in Figure 1) and define psycho-social (e.g., personality traits and socio-demographic) and
motivational (e.g., perceived symbolic value) characteristics that are common within individuals in
each one of these groups. For instance, innovators are usually risk takers with high social status and
financial liquidity. While early adopters also have high social status and financial liquidity, their
profiles are more associated with opinion leadership and central communication positions than
actual risk taking. Majority groups do not have the same level of financial liquidity, and thus, tend
to make decisions based on utility and practicality, being more cautious before committing to the
purchase of new products (Rogers, 2003). In this sense, when aiming to transition a product from
the early adoption stages to a majority market share (mainstream consumers), marketers and
business developers need to take into consideration the heterogeneity in economic power and
motivations of consumers. Similarly, when trying to understand and predict usage patterns of EVs,
planners from the energy and transport sector need to recognise that the behaviour they observe
from early adopters may not represent that of mainstream consumers.
Figure 2: EV adoption in Australia in comparison with the Diffusion of Innovations Curve. (Adapted from Rogers, 2003)
Large-Scale Network and System Integration of Electric Vehicles: A Techno-Economic Perspective Electric Vehicle Uptake and Charging Page 23 of 55
In most countries where EVs are available, consumers are still within the innovator and early
adopter groups. In Australia, EV sales accounted for only 0.6% and 0.7% of all new sales in 2019 and
2020, respectively (EVC,2020, 2021). The total fleet share is even lower, showing that this
technology is being adopted only by innovators. Norway is possibly the only country where the
ownership of EVs by individuals is starting to hit the early majority group. BEVs in Norway already
account for almost 56% of annual sales of new passenger vehicles and the combined number of
BEVs and PHEVs is close to 14% of the total stock of vehicles registered (IEA,2020; Statistics Norway,
2020). In this sense, most of the literature investigating EV charging behaviour through actual usage
patterns (observed behaviour or revealed choices) may not provide a broad enough picture of what
will happen when EVs are used by the majorities.
3.1 Who is Currently Buying EVs?
Car ownership is influenced by the contextual variables discussed in Chapter 2 as well as cultural
factors, such as lifestyles, ideologies, and social statuses. Since these characteristics vary from one
place to another, socio-demographic profiles of consumers from one country may not be directly
translated into other nations. Nevertheless, in this early stage of market development, studies
focusing on different regions have reached similar conclusions regarding socio-demographic
characteristics of EV early adopters. Australia lacks information characterising its current EV owners.
In both Europe and USA, most studies have identified that early adopters are men approaching
middle age who have high incomes and education and are part of a family households, often
referred to as an “educated suburban family” (Brook Lyndhurst, 2015; Higueras-Castillo et al., 2020;
Lee et al., 2019; Sovacool et al., 2018). These individuals also tend to be homeowners who can
charge their cars at home, have relatively high annual mileage and more than one car available in
their homes (usually ICEVs). For instance, in Norway 75% of the households with EVs also have an
additional car, the numbers are even higher for the UK and California, with 80% and 94%,
respectively. Yet, in most of these multi-car households, the EV is used as the main car (Brook
Lyndhurst, 2015; Lee et al., 2019; Lee et al., 2020).
3.2 How Are Socio-demographic Profiles Changing?
While in an immediate future most new buyers are likely to be people with same or similar
demographic characteristics of current buyers, insights from the Californian and Nordic markets
show that the relationship between age, income, gender, and EV ownership is weakening (Lee et
al., 2019; Sovacool et al., 2018). In California, Lee et al. (2019) identified that from 2012 to 2017 the
fastest growing socio-demographic group of EV owners was of middle-income individuals who are
renters or live in multi-unit buildings (2.1% to 7.9% market share). While this was the fastest growing
socio-demographic group, most EV owners in the state still have higher incomes, own a home
and/or reside in a detached dwelling.
There is clear evidence of a latent demand for EVs conditional on price reductions. Younger
individuals and lower income families interested in environmental benefits or lower running costs

Page 24 of 55
of EVs show strong purchase interest but are currently kept out of the market due to insufficient
incentives and/or lack of low-end long-range models (Brook Lyndhurst, 2015; Deloitte, 2020; Jia and
Chen, 2021). In Australia, this latent demand waiting for a price drop seems to be formed by young
families and couples with active lifestyles living in metro areas. While less than half of this group
commutes by car, they tend to drive their kids around every day (Nielsen Company, 2019).
Large-Scale Network and System Integration of Electric Vehicles: A Techno-Economic Perspective Electric Vehicle Uptake and Charging Page 25 of 55
4 Purchase Decisions
This chapter frames the EV purchase decision according to The Diffusion of Innovations Theory. This
theory poses that, to attract attention from consumers, innovations need to show clear advantages
relative to the product being substituted. In this regard, the role of policies, incentives, and charging
infrastructure as mechanisms to increase consumer perceptions of EV advantages are discussed.
Rogers’ Diffusion of Innovations Theory divides the adoption process in five stages: (1) knowledge,
(2) persuasion, (3) decision, (4) implementation, and (5) confirmation (Rogers, 2003). Viewed in this
way, the EV purchase decision depends on consumers acquiring knowledge and being persuaded
(forming a positive opinion) about this technology. The persuasion phase is reported by Rogers as
the most influential in determining adoption rates (explaining 49-87% of the variance in rates of
adoption) and is characterised by five attributes: (1) relative advantage, (2) compatibility, (3)
complexity, (4) trialability, and (5) observability (Rogers, 2003). Relative advantage is considered
the most important of these attributes and, together with compatibility, characterises what the EV
literature usually refers to as consumers’ motivations.
Examples of potential EV advantages relative to ICEVs may be the lower running costs and lower
environmental footprint, providing a specific social status associated with being the latest
technology, or even the ability to charge the vehicle overnight at home instead of refuelling in a
petrol station. Examples of compatibility may be subjective, associated with values and lifestyle
(e.g., green lifestyle), or objective, such as diversity of models and vehicle ranges that fulfill
households’ travel needs. The Queensland Household Energy Survey of 2019 (QHES 2019) reported
that the top three advantages perceived by EV users in the state are smooth and quiet driving,
power and acceleration, and reduction of greenhouse gas emissions (Colmar Brunton, 2019). While
a Deloitte survey showed that the main EV disadvantages for Australians are the price premium
followed by perceived lack of charging infrastructure (Deloitte, 2021).
Policies and incentives toward EV adoption, such as the examples described in Section 2.6, usually
target the increase of EVs relative advantage, or decrease in disadvantage. For instance, monetary
purchase incentives reduce cost disadvantages, while charging infrastructure deployment reduces
potential range anxiety or charging concerns. Consumer research in the UK and California show that
such incentives can play a major role in the decision to buy an EV. In the UK, 90% of EV owners
surveyed considered that public incentives played a very or fairly important role in their decision to
purchase an EV, while in California this number was around 75% for different federal and state
incentives (Brook Lyndhurst, 2015). Section 4.1 provides a review of consumer preferences for
different incentives, while section 4.2 focuses in specific on the perceived need of charging
infrastructure deployment.
User knowledge about EVs is not only important as the start of the decision process but also
throughout the persuasion phase. Even in leading markets, such as California, lack of awareness

Page 26 of 55
about EVs and incentives remains a powerful barrier hindering adoption. Between 2014 and 2017,
despite the significant market growth, the level of knowledge and awareness between mainstream
consumers in California remained very low (Contestabile et al., 2020). Jia and Chen (2021) compared
preferences for EV and charging attributes between owners and non-owners in Virginia (US) and
concluded that knowledge and awareness were among the main differences between the two
segments. Even though the Electric Vehicle Council survey shows that Australians are aware of EV
existence, there may be a lack of widespread knowledge about operational aspects of this
technology. When asked if different factors would encourage or discourage the purchase of an EV,
a large portion of respondents (between 18% and 53% among all factors) was neutral or unsure of
their effect in their decision. Further, 80% of participants underestimated the driving range of EVs
available in the market, supporting the hypothesis that knowledge is limited (EVC, 2020).
Dini (2018) points out that empirical research and government incentives underestimate the
importance of increasing the EV information availability to consumers and facilitating access to
product experience (trialability). The author argues that Australian consumers lack on product and
market confidence. Confidence can be built by programs that provide knowledge and user
experience. Indeed, results from the QHES 2019 show that the greatest two challenges experienced
by individuals who bought EVs were the fact that salespeople were not informed enough and there
was a lack of information available regarding pros and cons of electric cars (Colmar Brunton, 2019).
While opportunities to experience EVs tend to lead to positive attitudes about the technology and
real-life experience is a promising marketing strategy, for the mainstream consumer, barriers such
as acquisition costs still need to be addressed for the purchase decision to happen (Bühler et al.,
2014).
4.1 What Are the Preferred Incentives and Policies?
The effects of policies and incentives on EV purchase and purchase intention have been investigated
both through stated preference surveys and actual ownership and market penetration analyses. A
summary of main findings is provided in Table 2. In Australia, there is a prevalence of studies based
on consumer preference elicitation. The Electric Vehicle Council publishes yearly updates on
consumers’ preferred incentives, which have been consistent since 2018. In 2020, their survey with
almost three thousand Australians (from ACT, NSW, VIC, and SA) observed that three incentives are
perceived as most important by two thirds of the respondents (EVC, 2020):
1. subsidies to reduce cost of purchase,
2. public charging infrastructure provision (discussed in Section 4.2.), and
3. subsidies to reduce the costs of installation for home charging.
A different survey with more than a thousand residents of NSW investigated the effects of one-off
and recurring monetary incentives, charging infrastructure provision, and transport measures on EV
purchase intention. In terms of one-off incentives, upfront cost reductions and rebates were
Large-Scale Network and System Integration of Electric Vehicles: A Techno-Economic Perspective Electric Vehicle Uptake and Charging Page 27 of 55
preferred compared to tax (stamp duty) discounts. Energy bill discounts were the preferred
recurring monetary incentive, while special lane access (e.g., bus lanes) was the most valued
transport measure. This study also showed that, in terms of return of dollar invested by the
government, parking discounts could be the most effective measure to increase EV adoption
(Gong et al., 2020). Despite the preference for direct cost reductions compared to tax relief, it is
estimated that half of the Australian population believes that EVs should pay less tax than ICEVs
because they are less polluting (The Australia Institute, 2017).
Studies investigating actual sales and market penetration response to incentives in the USA, Europe,
and China also point to the effectiveness of purchase related monetary incentives (Hardman et al.,
2017; IEA, 2020; Jenn et al., 2018; Jenn et al., 2020; Münzel et al., 2019). While tax exemptions seem
to be more effective than tax credit, there is no clear difference in the performance of purchase cost
rebates compared to tax discounts. For the USA market, Jenn et al. (2018) found that every
US$1,000 offered as a rebate or tax credit increased average sales of electric vehicles by 2.6%. While
Münzel et al. (2019) found that, in Europe (only 32 countries considered), for every EUR 1,000 in
purchase incentives, there is 5-7% increase in sales share. The effects of such incentives on sales are
strongly associated with consumer awareness levels (Hardman et al., 2017). In the USA, states with
similar incentives show large variations in per capita sales, which are attributed to differences in
consumer awareness about incentives (Jenn et al., 2018).
In terms of transport measures, access to high occupancy vehicle (HOV) lanes is the most significant
contributor to EV adoption in locations that have high density of such lanes (Jenn et al. 2018; Jenn
et al., 2020). However, in locations where parking is at a premium, parking priority and discounts
also show significant value to consumers (Wolbertus et al., 2018). In this sense, as observed by
Hardman (2019), the impacts of transport measures on EV uptake are usually context specific. On
the other hand, charging infrastructure (discussed in section 4.2) and monetary incentives seem to
have more homogeneous widespread effects. Hardman (2019) also notes that a combination of
policies and incentives is necessary to create an EV-prone environment. In Norway, for instance,
petrol prices are high, BEVs receive purchase discounts, free parking rights, and toll fee waivers.
They also have access to special lanes, well developed charging infrastructure, and are exempt of
annual tax.
While incentives have been a strategy used by many governments to kickstart EV diffusion,
resources are usually limited, and phase-out plans are likely to be implemented before EV
technology reaches mainstream consumers (the majorities). As discussed in Chapter 3, early
adopters usually have higher incomes and financial liquidity than the majorities, which means that
reduction in purchase costs is of ultimate importance for the mainstream consumer and incentive
phase-outs may stagnate EV adoption. In China, subsidies cuts in 2019 together with COVID-19
economic impacts caused a downfall in EV sales. This substantial market impact led China to revisit
Page 28 of 55
the decision and resume subsidies targeted at low-end long-range vehicles until 2022 (IEA, 2020;
Koty, 2020).
Subsidies impacts can be maximised, and phase-outs delayed, if incentives are targeted. By targeting
incentives to low-end long-range vehicles and/or targeting incentive eligibility based on income,
subsidies can have more lasting benefits and reach mainstream consumers (Jenn et al., 2020).
Gradual increases in ICEV taxes are another option to fund EV subsidies for extended time periods.
This strategy has been successfully adopted in Norway, France, and Netherlands but may face
political resistance in some countries (Hardman et al., 2017).
Even though targeted subsidies may help transition the diffusion of EV technology to the
mainstream consumer, actual reductions in EV purchase costs may also be necessary. As technology
evolves and its production becomes more cost effective, subsidies may enable a market bubble that
delays a natural price reduction. Indeed, Whitehead et al. (2019) observed that for HEVs, purchase
monetary incentives may be beneficiating vehicle manufacturers and dealers more than users, as
they contribute to the continuing higher purchase prices. The authors estimated that, on average,
premiums were 11.3% higher in markets where purchase price rebates were available.
4.2 Is Charging a Barrier to Uptake?
Current automobile consumers have either used or been exposed to ICEVs, therefore they are
familiar with driving and maintaining such vehicles. For example, consumers are accustomed with
refuelling practices and the driving range of a petrol tank (400-600 km). In this sense, it is natural
that the change in habits associated with charging needs and the initial introduction of short-range
EVs to the market were received with scepticism and perceived as a relative disadvantage by
mainstream consumers worldwide (New Zealand Ministry for the Environment, 2018).
McKinsey’s 2016 EV consumer survey of potential EV buyers in China, Germany, and the USA
identified that driving range and perceived lack of access to efficient charging stations were the
second and third main barriers to EV purchase. The consulting company argues that perceived lack
of access to charging infrastructure may become the number one barrier as long-range BEV
technology evolves and EV prices drop (McKinsey, 2018). Similar results were observed by Deloitte
in Australia (Deloitte, 2021). A literature review by Hardman and colleagues, identified that the
inability to charge at home is also perceived a major barrier to BEV purchase (Hardman et al., 2018).
While both studies show the relevance of charging perceptions on EV uptake, some argue that these
perceived barriers may not be warranted.
Based on a large-scale global survey, AlixPartners observed that potential users think that they need
more charging infrastructure than what is actually necessary. For instance, half of the respondents
stated that charging stations should be as common as petrol stations and most respondents were
unaware of the prevalence of Level 2 and Level 3 charging (AlixPartners, 2019). Indeed, in most
countries, except for China and Japan, EV owners mostly charge at home and find that dense urban
public charging networks are not as necessary as what is suggested by potential users (Skippon and
Large-Scale Network and System Integration of Electric Vehicles: A Techno-Economic Perspective Electric Vehicle Uptake and Charging Page 29 of 55
Garwood, 2011; Plötz et al., 2014; IEA, 2019). The differences in perceptions of potential users and
actual users show that as consumers become more familiar with and educated about EVs, the less
they will perceive public charging infrastructure as an EV purchase barrier. Yet, it should be
mentioned that countries such as Norway, which invested heavily in public charging as an EV uptake
incentive, did see investments pay off (Energeia, 2018). Data from the UK and the Netherlands also
indicate that public infrastructure availability has the potential to increase EV market size by 20%
and overall EV rate of adoption by 50% (Energeia, 2018). It is also argued that Level 3 DC charging,
especially super-fast chargers, can make EV charging experience more similar to petrol refuelling,
and thus, facilitate the behavioural adaptation required for EV adoption (Motoaki and Shirk, 2017).
Battery driving ranges, which are lower than ICE ranges (especially in the case of short-range BEVs),
have generated consumer ‘range anxiety’, which is a fear that the vehicle will not be able to reach
the destination or the next charging point before running out of power. Range anxiety is associated
with the exaggerated perceived need for charging stations and is mentioned by multiple Australian
studies as a significant inhibitor to EV purchase (AEMC, 2020; Broadbent and Matternicht, 2020). A
study in Sweden elicited EV drivers regarding their experience with range anxiety during everyday
EV use. Even though such results are probably personality dependent, almost two thirds of
respondents stated that they experience range anxiety less than once a month or never. Another
26% experience range anxiety at most once a week, suggesting that most respondents do not find
range anxiety to be a significant issue (Sunnerstedt et al., 2019). A recent survey with 1,500 EV
drivers in the USA also found that range anxiety is no longer an issue. 89% of respondents said that
the range of their EV is sufficient for their daily needs and 79% are comfortable travelling to new
destinations with minimal planning (Geotab Energy, 2020).
Another clear difference between potential and actual EV users is their perception of charging
inconvenience. For example, the time required for EV charging, especially when compared to petrol
refuelling duration, and the apparent complexity of charging technology prove to be daunting for
prospective EV consumers (National Research Council, 2015). However, when users become familiar
with EV charging, their perceptions change. Studies in the United Kingdom (UK), Germany, and New
Zealand found that most respondents felt that charging EVs at home is more convenient than
refuelling their ICE vehicles at the traditional petrol station. One such study stating that 71% of those
surveyed preferred to charge at home versus refuelling an ICE vehicle (Graham-Rowe et al., 2012;
Bunce et al, 2014; Franke and Krems, 2013; Flip the Fleet, 2017).

Page 30 of 55
Table 2: Summary of main studies investigating incentive impacts on EV uptake.
Reference (Location)
Methodology (Document)
Sample Incentives Analysed
Results
Hardman et al., 2017
(Global)
Literature Review
(Academic Article)
35 studies • Monetary
• Most effective incentive is subsidies for EV purchase.
• Tax credits are less effective but if combined with higher tax on ICEVs can contribute to a sustainable transition.
Wolbertus et al., 2018
(Netherlands)
Survey and data analysis
(Academic Article)
149 respondents
• Transport
• Free parking can have a positive effect on EV adoption in regions where parking is scarce (i.e., dense urban areas)
• Limiting EV dedicated parking to specific periods may reduce interest in EV adoption.
Hardman et al., 2019
(Global)
Literature Review
(Academic Article)
104 studies
• Monetary
• Charging Infra.
• Transport
The effectiveness of incentives varies regionally:
• HOV lane access is more effective in congested regions.
• Charging infrastructure is important in areas with limited residential charging availability (high density).
• Parking incentives are important in areas where parking is scarce.
• Tax discounts have stronger effects in regions with high annual taxes.
• Licensing priority is effective in places with limited permitting (China).
Münzel et al., 2019
(Europe)
Data analysis and regression
modelling (Academic
Article)
Data from 32 countries in
Europe
• Monetary
• Charging Infra.
• Transport
• For most incentives, different models estimated that every incentive of EUR $1000 generates 5-7% relative sales share increase.
• Except for income tax incentives. The effects of these incentives are less clear.
EVC, 2020 (Australia)
Survey and data analysis (Report)
2,902 respondents
(NSW, ACT, VIC, SA)
• Monetary
• Charging Infra.
• Transport
Mainstream consumer preferences:
• Subsidies for EV purchase.
• Subsidies for home charging.
• Public charging infrastructure.
Gong et al., 2020 (NSW, Australia)
Survey and data analysis
(Academic Article)
1,180 respondents from NSW
• Monetary
• Transport
Mainstream consumer preferences:
• One-off incentive: subsidies for EV purchase.
• Recurring incentive: energy bill discounts.
• Transport incentive: special lane access. Most effective measure (cost/benefit):
• Rebates on parking fees.
Jenn et al., 2020 (California, USA)
Survey and data analysis
(Academic Article)
15,275 respondents
• Monetary
• Transport
• Most owners find federal and state tax credits and HOV lane access important.
• First adopters less sensitive to incentive availability.
• Incentives have become increasingly important over time.
• There is a need to find sustainable funding mechanisms to support EV adoption in more developed markets.
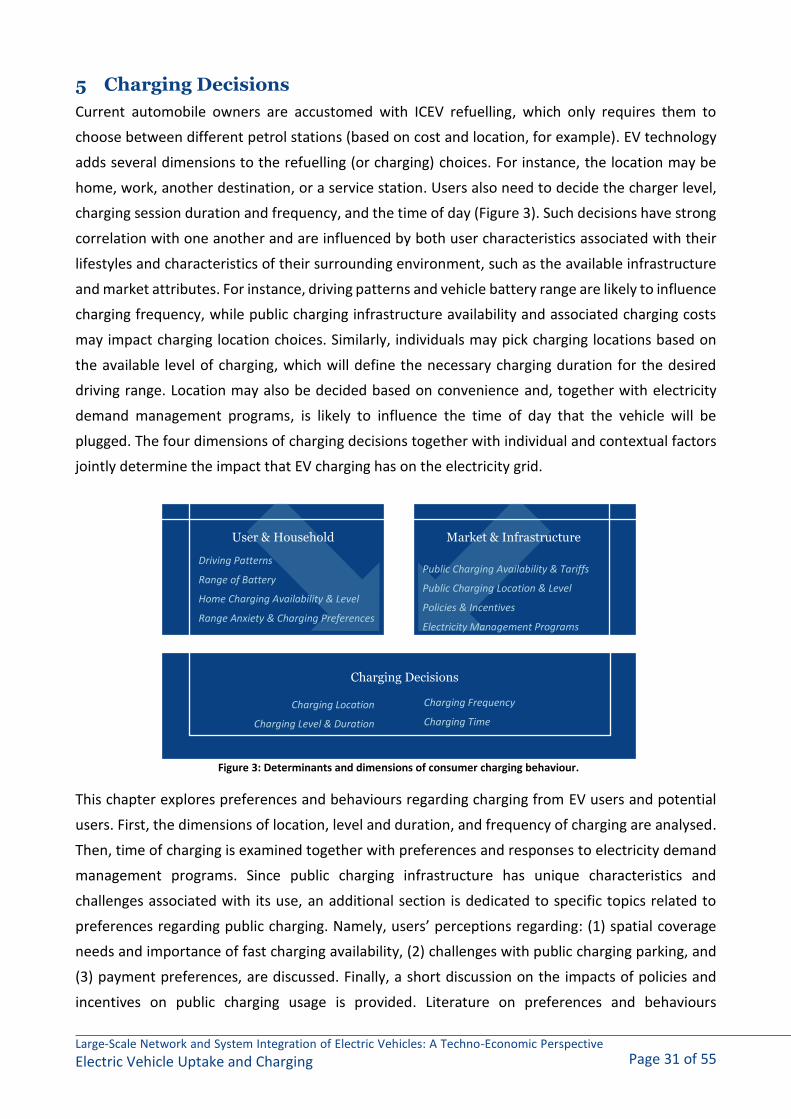
Large-Scale Network and System Integration of Electric Vehicles: A Techno-Economic Perspective Electric Vehicle Uptake and Charging Page 31 of 55
5 Charging Decisions
Current automobile owners are accustomed with ICEV refuelling, which only requires them to
choose between different petrol stations (based on cost and location, for example). EV technology
adds several dimensions to the refuelling (or charging) choices. For instance, the location may be
home, work, another destination, or a service station. Users also need to decide the charger level,
charging session duration and frequency, and the time of day (Figure 3). Such decisions have strong
correlation with one another and are influenced by both user characteristics associated with their
lifestyles and characteristics of their surrounding environment, such as the available infrastructure
and market attributes. For instance, driving patterns and vehicle battery range are likely to influence
charging frequency, while public charging infrastructure availability and associated charging costs
may impact charging location choices. Similarly, individuals may pick charging locations based on
the available level of charging, which will define the necessary charging duration for the desired
driving range. Location may also be decided based on convenience and, together with electricity
demand management programs, is likely to influence the time of day that the vehicle will be
plugged. The four dimensions of charging decisions together with individual and contextual factors
jointly determine the impact that EV charging has on the electricity grid.
This chapter explores preferences and behaviours regarding charging from EV users and potential
users. First, the dimensions of location, level and duration, and frequency of charging are analysed.
Then, time of charging is examined together with preferences and responses to electricity demand
management programs. Since public charging infrastructure has unique characteristics and
challenges associated with its use, an additional section is dedicated to specific topics related to
preferences regarding public charging. Namely, users’ perceptions regarding: (1) spatial coverage
needs and importance of fast charging availability, (2) challenges with public charging parking, and
(3) payment preferences, are discussed. Finally, a short discussion on the impacts of policies and
incentives on public charging usage is provided. Literature on preferences and behaviours
Charging Decisions
User & Household Market & Infrastructure
Driving Patterns
Range of Battery
Home Charging Availability & Level
Range Anxiety & Charging Preferences
Public Charging Availability & Tariffs
Public Charging Location & Level
Policies & Incentives
Electricity Management Programs
Charging Location
Charging Level & Duration
Charging Frequency
Charging Time
Figure 3: Determinants and dimensions of consumer charging behaviour.

Page 32 of 55
associated with novel technologies, such as inductive (wireless) charging and vehicle-to-grid (V2G)
energy provision, is still incipient, and thus, is not part of the current review.
5.1 Where Do Users Prefer to Charge?
EV users and potential users show similar preferences for charging locations, with home charging
(or overnight charging near home when home charging is not available) being the preferred location.
The second most popular charging location is the workplace or other commute related charging
points (e.g., public transport hubs, park and ride facilities), followed by other destination charging
locations (e.g., supermarkets, retail centres). En-route service station charging is the least desirable
and utilised charging location for urban settings. However, service station charging is perceived as
essential in travel corridors to enable long-distance trips and reduce range anxiety (Hardman et al.,
2018; Wolff and Madlener, 2019). Tables 3 and 4 present a summary of studies that investigate
charging location preferences.
In terms of numbers, studies based on international data show that between 50% and 90% of
charging events occur at home and between 15% and 40% of the charging episodes for commuters
takes place at work (Idaho National Laboratory, 2015; National Research Council, 2015; Hardman et
al., 2018; Funke et al., 2019). Studies from Austria and Norway show the highest proportions of
home charging, 88% and 90%, respectively (Baresch and Moser 2019; Funke et al., 2019), while in
the UK, USA, and Canada, the share is closer to 70% (Funke et al., 2019; Fleetcarma, 2020). A study
with almost 8,000 EV drivers in California, USA, showed that 86% used residential charging, 53%
exclusively charged at home, and another 30% used workplace charging facilities. Owners of BEVs
with driving ranges greater than 320 kilometres, such as Tesla models, are more likely to only use
home charging (Lee et al., 2020). Individuals who have solar panels at home are also more likely to
rely exclusively on home charging since they have diminished electricity costs (Jabeen et al., 2013;
Tal et al., 2020).
In terms of residential charging, a large-scale study of charging behaviour in Canada showed spatial
differences in charging load associated with rural, suburban, and urban areas. Suburban residents
tended to have longer commutes and drive around 80% longer distances than their urban
counterparts. The distribution of EVs in suburbs also occurred in clusters (probably because people
tend to choose neighbourhoods that match their lifestyles). The combination of these factors
increases the volatility of charging load curves and creates higher localised peaks, which can affect
the distribution network (Fleetcarma, 2019).
Fleetcarma’s study also observed that the reliance on residential charging in Canada had reduced
between 2014 and 2019 from 90% to 72% mainly due to workplace charging opportunities, where
80% of the cases charged their EVs at work for free (Fleetcarma, 2019). The trade-off between
convenience and monetary savings translated into the substitution of home charging by free
workplace charging is also observed by other studies (Wu, 2018; Tal et al., 2020). Besides monetary
savings, factors that make workplace charging attractive are the number of chargers available,
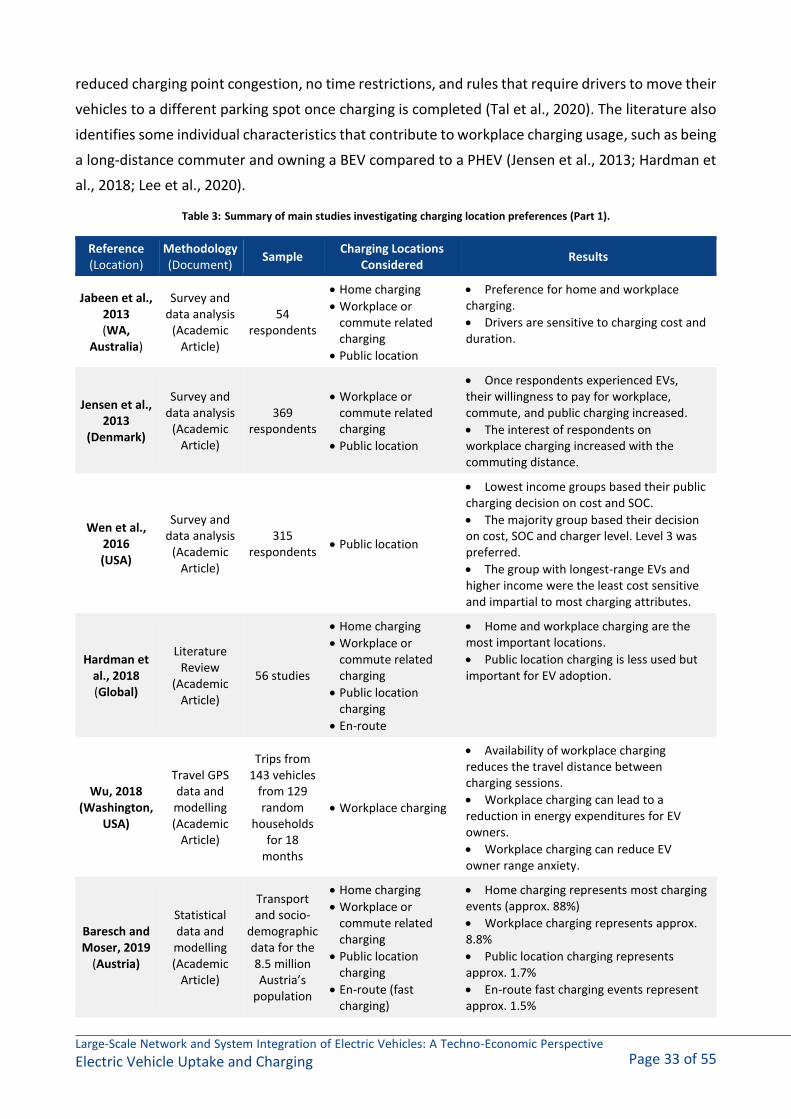
Large-Scale Network and System Integration of Electric Vehicles: A Techno-Economic Perspective Electric Vehicle Uptake and Charging Page 33 of 55
reduced charging point congestion, no time restrictions, and rules that require drivers to move their
vehicles to a different parking spot once charging is completed (Tal et al., 2020). The literature also
identifies some individual characteristics that contribute to workplace charging usage, such as being
a long-distance commuter and owning a BEV compared to a PHEV (Jensen et al., 2013; Hardman et
al., 2018; Lee et al., 2020).
Table 3: Summary of main studies investigating charging location preferences (Part 1).
Reference (Location)
Methodology (Document)
Sample Charging Locations
Considered Results
Jabeen et al., 2013 (WA,
Australia)
Survey and data analysis
(Academic Article)
54 respondents
• Home charging
• Workplace or commute related charging
• Public location
• Preference for home and workplace charging.
• Drivers are sensitive to charging cost and duration.
Jensen et al., 2013
(Denmark)
Survey and data analysis
(Academic Article)
369 respondents
• Workplace or commute related charging
• Public location
• Once respondents experienced EVs, their willingness to pay for workplace, commute, and public charging increased.
• The interest of respondents on workplace charging increased with the commuting distance.
Wen et al., 2016 (USA)
Survey and data analysis
(Academic Article)
315 respondents
• Public location
• Lowest income groups based their public charging decision on cost and SOC.
• The majority group based their decision on cost, SOC and charger level. Level 3 was preferred.
• The group with longest-range EVs and higher income were the least cost sensitive and impartial to most charging attributes.
Hardman et al., 2018 (Global)
Literature Review
(Academic Article)
56 studies
• Home charging
• Workplace or commute related charging
• Public location charging
• En-route
• Home and workplace charging are the most important locations.
• Public location charging is less used but important for EV adoption.
Wu, 2018 (Washington,
USA)
Travel GPS data and modelling (Academic
Article)
Trips from 143 vehicles
from 129 random
households for 18
months
• Workplace charging
• Availability of workplace charging reduces the travel distance between charging sessions.
• Workplace charging can lead to a reduction in energy expenditures for EV owners.
• Workplace charging can reduce EV owner range anxiety.
Baresch and Moser, 2019
(Austria)
Statistical data and modelling (Academic
Article)
Transport and socio-
demographic data for the 8.5 million Austria’s
population
• Home charging
• Workplace or commute related charging
• Public location charging
• En-route (fast charging)
• Home charging represents most charging events (approx. 88%)
• Workplace charging represents approx. 8.8%
• Public location charging represents approx. 1.7%
• En-route fast charging events represent approx. 1.5%
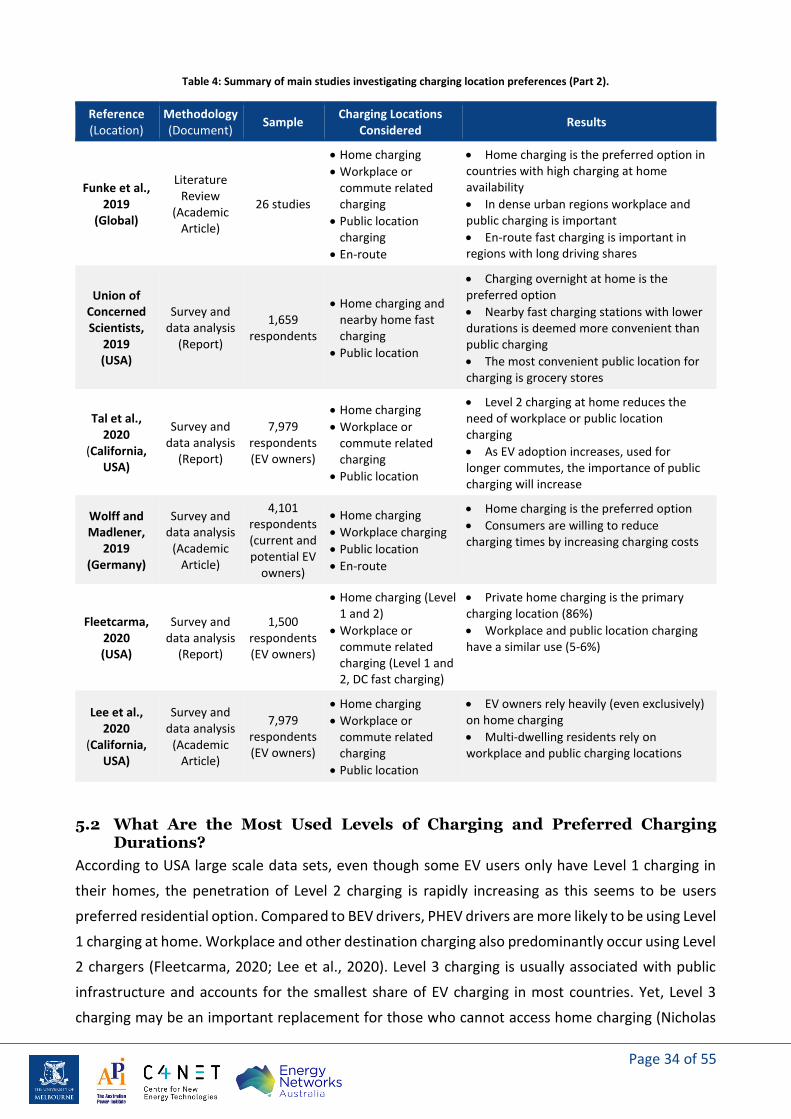
Page 34 of 55
Table 4: Summary of main studies investigating charging location preferences (Part 2).
Reference (Location)
Methodology (Document)
Sample Charging Locations
Considered Results
Funke et al., 2019
(Global)
Literature Review
(Academic Article)
26 studies
• Home charging
• Workplace or commute related charging
• Public location charging
• En-route
• Home charging is the preferred option in countries with high charging at home availability
• In dense urban regions workplace and public charging is important
• En-route fast charging is important in regions with long driving shares
Union of Concerned Scientists,
2019 (USA)
Survey and data analysis
(Report)
1,659 respondents
• Home charging and nearby home fast charging
• Public location
• Charging overnight at home is the preferred option
• Nearby fast charging stations with lower durations is deemed more convenient than public charging
• The most convenient public location for charging is grocery stores
Tal et al., 2020
(California, USA)
Survey and data analysis
(Report)
7,979 respondents (EV owners)
• Home charging
• Workplace or commute related charging
• Public location
• Level 2 charging at home reduces the need of workplace or public location charging
• As EV adoption increases, used for longer commutes, the importance of public charging will increase
Wolff and Madlener,
2019 (Germany)
Survey and data analysis
(Academic Article)
4,101 respondents (current and potential EV
owners)
• Home charging
• Workplace charging
• Public location
• En-route
• Home charging is the preferred option
• Consumers are willing to reduce charging times by increasing charging costs
Fleetcarma, 2020 (USA)
Survey and data analysis
(Report)
1,500 respondents (EV owners)
• Home charging (Level 1 and 2)
• Workplace or commute related charging (Level 1 and 2, DC fast charging)
• Private home charging is the primary charging location (86%)
• Workplace and public location charging have a similar use (5-6%)
Lee et al., 2020
(California, USA)
Survey and data analysis
(Academic Article)
7,979 respondents (EV owners)
• Home charging
• Workplace or commute related charging
• Public location
• EV owners rely heavily (even exclusively) on home charging
• Multi-dwelling residents rely on workplace and public charging locations
5.2 What Are the Most Used Levels of Charging and Preferred Charging Durations?
According to USA large scale data sets, even though some EV users only have Level 1 charging in
their homes, the penetration of Level 2 charging is rapidly increasing as this seems to be users
preferred residential option. Compared to BEV drivers, PHEV drivers are more likely to be using Level
1 charging at home. Workplace and other destination charging also predominantly occur using Level
2 chargers (Fleetcarma, 2020; Lee et al., 2020). Level 3 charging is usually associated with public
infrastructure and accounts for the smallest share of EV charging in most countries. Yet, Level 3
charging may be an important replacement for those who cannot access home charging (Nicholas
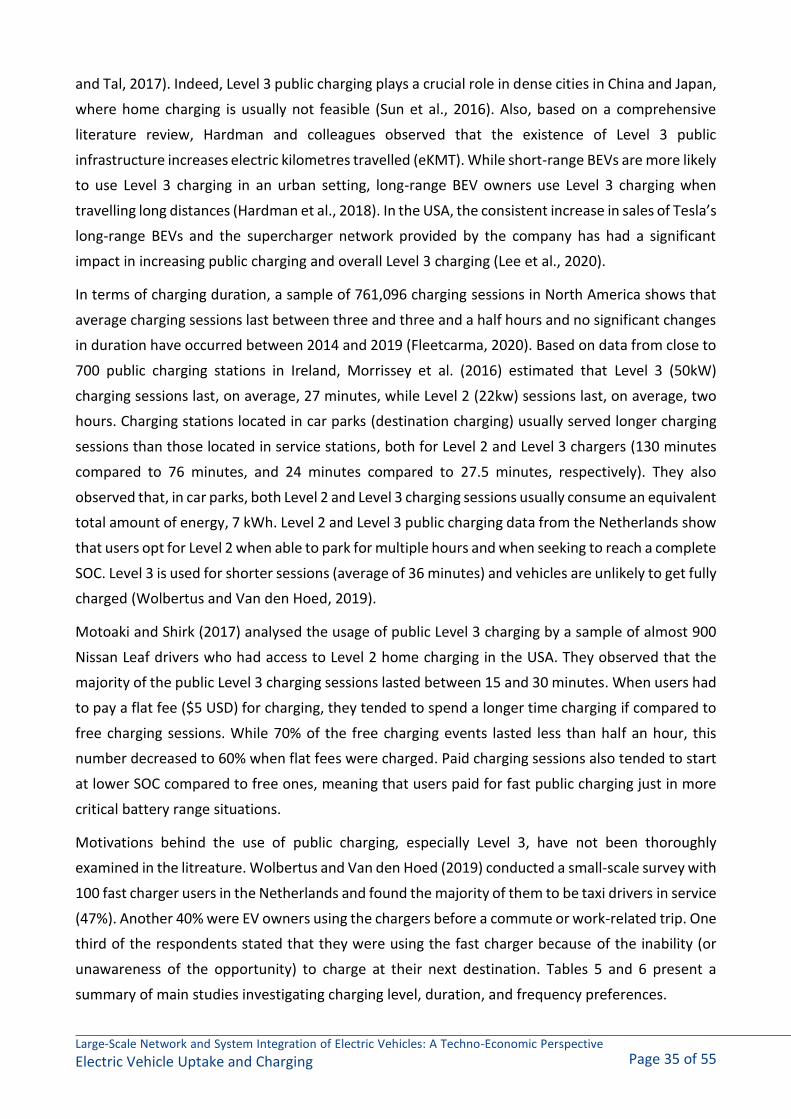
Large-Scale Network and System Integration of Electric Vehicles: A Techno-Economic Perspective Electric Vehicle Uptake and Charging Page 35 of 55
and Tal, 2017). Indeed, Level 3 public charging plays a crucial role in dense cities in China and Japan,
where home charging is usually not feasible (Sun et al., 2016). Also, based on a comprehensive
literature review, Hardman and colleagues observed that the existence of Level 3 public
infrastructure increases electric kilometres travelled (eKMT). While short-range BEVs are more likely
to use Level 3 charging in an urban setting, long-range BEV owners use Level 3 charging when
travelling long distances (Hardman et al., 2018). In the USA, the consistent increase in sales of Tesla’s
long-range BEVs and the supercharger network provided by the company has had a significant
impact in increasing public charging and overall Level 3 charging (Lee et al., 2020).
In terms of charging duration, a sample of 761,096 charging sessions in North America shows that
average charging sessions last between three and three and a half hours and no significant changes
in duration have occurred between 2014 and 2019 (Fleetcarma, 2020). Based on data from close to
700 public charging stations in Ireland, Morrissey et al. (2016) estimated that Level 3 (50kW)
charging sessions last, on average, 27 minutes, while Level 2 (22kw) sessions last, on average, two
hours. Charging stations located in car parks (destination charging) usually served longer charging
sessions than those located in service stations, both for Level 2 and Level 3 chargers (130 minutes
compared to 76 minutes, and 24 minutes compared to 27.5 minutes, respectively). They also
observed that, in car parks, both Level 2 and Level 3 charging sessions usually consume an equivalent
total amount of energy, 7 kWh. Level 2 and Level 3 public charging data from the Netherlands show
that users opt for Level 2 when able to park for multiple hours and when seeking to reach a complete
SOC. Level 3 is used for shorter sessions (average of 36 minutes) and vehicles are unlikely to get fully
charged (Wolbertus and Van den Hoed, 2019).
Motoaki and Shirk (2017) analysed the usage of public Level 3 charging by a sample of almost 900
Nissan Leaf drivers who had access to Level 2 home charging in the USA. They observed that the
majority of the public Level 3 charging sessions lasted between 15 and 30 minutes. When users had
to pay a flat fee ($5 USD) for charging, they tended to spend a longer time charging if compared to
free charging sessions. While 70% of the free charging events lasted less than half an hour, this
number decreased to 60% when flat fees were charged. Paid charging sessions also tended to start
at lower SOC compared to free ones, meaning that users paid for fast public charging just in more
critical battery range situations.
Motivations behind the use of public charging, especially Level 3, have not been thoroughly
examined in the litreature. Wolbertus and Van den Hoed (2019) conducted a small-scale survey with
100 fast charger users in the Netherlands and found the majority of them to be taxi drivers in service
(47%). Another 40% were EV owners using the chargers before a commute or work-related trip. One
third of the respondents stated that they were using the fast charger because of the inability (or
unawareness of the opportunity) to charge at their next destination. Tables 5 and 6 present a
summary of main studies investigating charging level, duration, and frequency preferences.
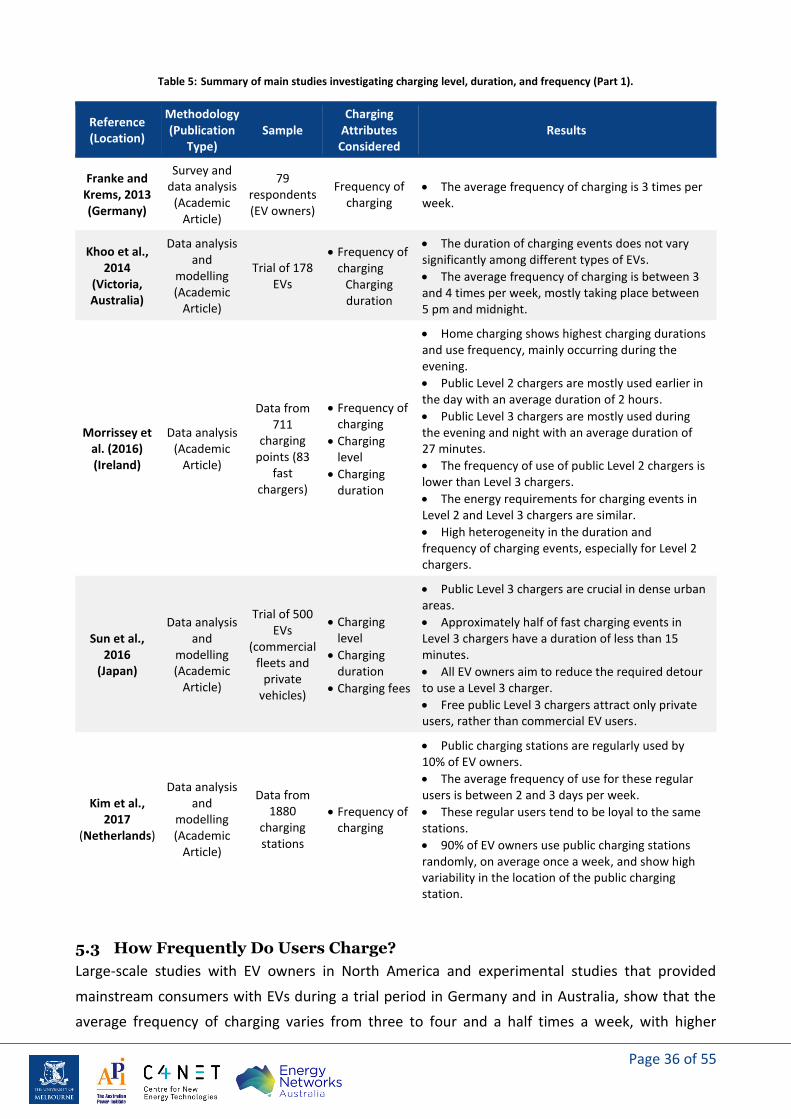
Page 36 of 55
Table 5: Summary of main studies investigating charging level, duration, and frequency (Part 1).
Reference (Location)
Methodology (Publication
Type) Sample
Charging Attributes
Considered Results
Franke and Krems, 2013 (Germany)
Survey and data analysis
(Academic Article)
79 respondents (EV owners)
Frequency of charging
• The average frequency of charging is 3 times per week.
Khoo et al., 2014
(Victoria, Australia)
Data analysis and
modelling (Academic
Article)
Trial of 178 EVs
• Frequency of charging
Charging duration
• The duration of charging events does not vary significantly among different types of EVs.
• The average frequency of charging is between 3 and 4 times per week, mostly taking place between 5 pm and midnight.
Morrissey et al. (2016) (Ireland)
Data analysis (Academic
Article)
Data from 711
charging points (83
fast chargers)
• Frequency of charging
• Charging level
• Charging duration
• Home charging shows highest charging durations and use frequency, mainly occurring during the evening.
• Public Level 2 chargers are mostly used earlier in the day with an average duration of 2 hours.
• Public Level 3 chargers are mostly used during the evening and night with an average duration of 27 minutes.
• The frequency of use of public Level 2 chargers is lower than Level 3 chargers.
• The energy requirements for charging events in Level 2 and Level 3 chargers are similar.
• High heterogeneity in the duration and frequency of charging events, especially for Level 2 chargers.
Sun et al., 2016
(Japan)
Data analysis and
modelling (Academic
Article)
Trial of 500 EVs
(commercial fleets and
private vehicles)
• Charging level
• Charging duration
• Charging fees
• Public Level 3 chargers are crucial in dense urban areas.
• Approximately half of fast charging events in Level 3 chargers have a duration of less than 15 minutes.
• All EV owners aim to reduce the required detour to use a Level 3 charger.
• Free public Level 3 chargers attract only private users, rather than commercial EV users.
Kim et al., 2017
(Netherlands)
Data analysis and
modelling (Academic
Article)
Data from 1880
charging stations
• Frequency of charging
• Public charging stations are regularly used by 10% of EV owners.
• The average frequency of use for these regular users is between 2 and 3 days per week.
• These regular users tend to be loyal to the same stations.
• 90% of EV owners use public charging stations randomly, on average once a week, and show high variability in the location of the public charging station.
5.3 How Frequently Do Users Charge?
Large-scale studies with EV owners in North America and experimental studies that provided
mainstream consumers with EVs during a trial period in Germany and in Australia, show that the
average frequency of charging varies from three to four and a half times a week, with higher
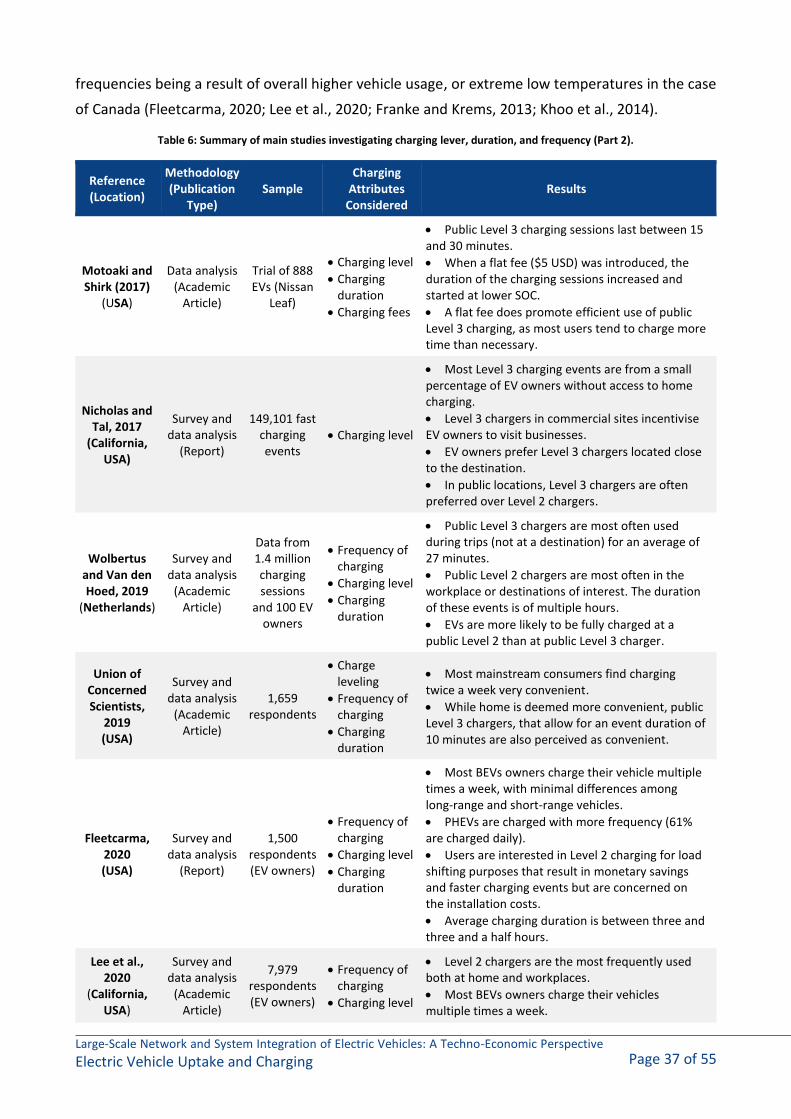
Large-Scale Network and System Integration of Electric Vehicles: A Techno-Economic Perspective Electric Vehicle Uptake and Charging Page 37 of 55
frequencies being a result of overall higher vehicle usage, or extreme low temperatures in the case
of Canada (Fleetcarma, 2020; Lee et al., 2020; Franke and Krems, 2013; Khoo et al., 2014).
Table 6: Summary of main studies investigating charging lever, duration, and frequency (Part 2).
Reference (Location)
Methodology (Publication
Type) Sample
Charging Attributes
Considered Results
Motoaki and Shirk (2017)
(USA)
Data analysis (Academic
Article)
Trial of 888 EVs (Nissan
Leaf)
• Charging level
• Charging duration
• Charging fees
• Public Level 3 charging sessions last between 15 and 30 minutes.
• When a flat fee ($5 USD) was introduced, the duration of the charging sessions increased and started at lower SOC.
• A flat fee does promote efficient use of public Level 3 charging, as most users tend to charge more time than necessary.
Nicholas and Tal, 2017
(California, USA)
Survey and data analysis
(Report)
149,101 fast charging events
• Charging level
• Most Level 3 charging events are from a small percentage of EV owners without access to home charging.
• Level 3 chargers in commercial sites incentivise EV owners to visit businesses.
• EV owners prefer Level 3 chargers located close to the destination.
• In public locations, Level 3 chargers are often preferred over Level 2 chargers.
Wolbertus and Van den Hoed, 2019
(Netherlands)
Survey and data analysis
(Academic Article)
Data from 1.4 million charging sessions
and 100 EV owners
• Frequency of charging
• Charging level
• Charging duration
• Public Level 3 chargers are most often used during trips (not at a destination) for an average of 27 minutes.
• Public Level 2 chargers are most often in the workplace or destinations of interest. The duration of these events is of multiple hours.
• EVs are more likely to be fully charged at a public Level 2 than at public Level 3 charger.
Union of Concerned Scientists,
2019 (USA)
Survey and data analysis
(Academic Article)
1,659 respondents
• Charge leveling
• Frequency of charging
• Charging duration
• Most mainstream consumers find charging twice a week very convenient.
• While home is deemed more convenient, public Level 3 chargers, that allow for an event duration of 10 minutes are also perceived as convenient.
Fleetcarma, 2020 (USA)
Survey and data analysis
(Report)
1,500 respondents (EV owners)
• Frequency of charging
• Charging level
• Charging duration
• Most BEVs owners charge their vehicle multiple times a week, with minimal differences among long-range and short-range vehicles.
• PHEVs are charged with more frequency (61% are charged daily).
• Users are interested in Level 2 charging for load shifting purposes that result in monetary savings and faster charging events but are concerned on the installation costs.
• Average charging duration is between three and three and a half hours.
Lee et al., 2020
(California, USA)
Survey and data analysis
(Academic Article)
7,979 respondents (EV owners)
• Frequency of charging
• Charging level
• Level 2 chargers are the most frequently used both at home and workplaces.
• Most BEVs owners charge their vehicles multiple times a week.
Page 38 of 55
Based on four years of charging transactions in the Netherlands, Kim et al. (2017) identified two
distinct groups of public charging users: regular chargers and random (sporadic) chargers. Regular
chargers represented only 10% of the public charging point users. They tended to use stations every
2.75 days and were loyal to the same stations. Random chargers, on the other hand, used public
charging points once a week on average, presented high variability in station locations used, and
were more likely to own a PHEV. Interestingly, PHEV owners in North America show some significant
behavioural changes over time. While older studies show that many PHEV owners would not charge
their vehicles at all, more recent studies observe that they charge more frequently than BEV owners
(Tal et al., 2014; Fleetcarma, 2020; Lee et al., 2020; Geotab Energy, 2020).
In terms of mainstream consumer opinions, a stated preference survey in the USA shows that 72%
of potential EV users indicated that charging a BEV two-times per week overnight would be highly
convenient. Charging in a public Level 3 station for 30 minutes once-a-week was perceived as very
convenient by only 36% of the potential users (Union of Concerned Scientists, 2019).
5.4 When Do Users Charge?
Results from observational and experimental studies across the globe, including Australia, suggest
that when no demand management is in place, EV users are likely to charge their vehicles when they
arrive at work or when they arrive home after work, usually in the evening between 5 and 8 pm
(Khoo et al., 2014; Idaho National Laboratory, 2015; Morrissey et al., 2016; Hardman et al., 2018;
PWC, 2018; Energy Technologies Institute, 2019; Fleetcarma, 2019). Such times coincide with
electricity utilisation peaks for other activities and, as EV deployment grows, can cause undesired
demand spikes and grid overload. For this reason, some utility companies and researchers have
proposed and tested different demand management strategies to incentivise off-peak charging and
to spread the network load more evenly across time.
For public charging infrastructure, based on data from charging stations in Ireland, Morrissey et al.
(2016) identified significant differences between Level 2 and Level 3 charging events times. Level 2
chargers had a higher number of charging events starting in the morning (9 am) than fast chargers,
while in the evening, the relationship was the opposite. The authors note that Level 3 chargers had
high usage throughout the day but, in the evening, there was a decrease in Level 2 public charging
usage (note that these are not street chargers in residential areas). Using data from the Netherlands,
Sadeghianpourhamami et al. (2018) noted that during spring and summer public charging sessions
tended to start earlier than in the colder seasons. Similarly, weekdays present earlier arrival times
at charging stations than weekend days.
5.4.1 How Accepted and Effective Is Managed Charging?
Demand management can be user managed (User Managed Charging – UMC) or system managed,
also known as smart charging (TRL, 2019; Delmonte et al., 2020). The most common UMC is based
on varying time-of-use (ToU) tariffs, such as for peak, off-peak, and super off-peak consumption.
Users determine the time they will charge their vehicles based on price information, which can be
Large-Scale Network and System Integration of Electric Vehicles: A Techno-Economic Perspective Electric Vehicle Uptake and Charging Page 39 of 55
fixed or dynamic (half-hour updates on tariffs based on real-time supply-demand balance). Another
UMC strategy is the use of reward systems, that is, a game-based approach in which users are
rewarded for charging during low demand times (Fleetcarma, 2020). Smart charging requires a more
sophisticated system on the supplier side, as users leave the vehicle plugged-in and specify how
much charge they require and/or the time of their next trip, and the supplier defines the charging
plan. Smart charging programs can be in a demand response (DR) format or controlled charging
(V1G) format. DR consists in pausing charging at times of peak demand. V1G allows pausing and
scheduling of charging as well as adjustments of charging power to balance the demand in the grid
(International Council on Clean Transportation, 2017).
The literature shows that users tend to prefer managed charging over unmanaged charging
because of potential monetary savings. However, there is not a consensus yet on whether UMC or
smart charging is preferred. Users who have not experienced smart charging seem less willing to
engage with this type of management compared to UMC due to perceived lack of control and
perceived risk of not having the vehicle charged when needed (Axsen et al., 2017; Hardman et al.,
2018; Energy Technologies Institute, 2019; Delta-EE, 2019; Delmonte et al., 2020). However, users
who have experienced smart charging state that they would continue with this type of program
rather than changing to UMC (TRL, 2019; Western Power Distribution, 2019). A summary of recently
completed large-scale EV residential managed charging trials is presented in Table 71.
TRL (UK) performed a charging management experiment in which mainstream consumers were
provided with EVs (BEVs or PHEVs) for eight weeks and randomly allocated to a charging program:
ToU tariff based UMC, DR, or unmanaged (control group). As expected, the control group was more
likely to charge their vehicles right after returning home from work (at 5 pm). The UMC group was
observed to charge around two hours after the regular peak creating a second peak (at 7 pm), while
the SMC users had their charging sessions evenly spread throughout the night, mostly after 10 pm.
Participants of both management schemes were satisfied or very satisfied with their charging
programs, and those who were in the control group expressed that they would prefer managed
charging versus unmanaged. Attitudes toward DR were more positive when individuals had access
to a nearby public charging station, suggesting that having a back-up charging alternative facilitates
the acceptance of loss of control over charging (TRL, 2019). The ability to override smart charging
(at no additional cost) is another strong contributor to its acceptance (Delta-EE, 2019; Western
Power Distribution, 2019).
The effectiveness of ToU tariff schemes seems variable, with higher levels of adhesion being
reported by more recent studies. For instance, in the Victorian EV trial in 2013, only around 20% of
the residential charging sessions started after 11pm, indicating that just a small share of participants
1 There are currently multiple smart charging trials being planned or implemented in Australia and worldwide. These are outside the scope of this review since they have not published empirical results yet. Trials prior to 2015 were not included because there has been a significant evolution in EV technology and market penetration since then.
Page 40 of 55
was mindful of off-peak tariff advantages (Khoo et al., 2014). In 2019, the Smart Electric Power
Allience (SEPA) surveyed 3,000 EV drivers across the USA to investigate their preferences regarding
ToU tariffs. They found that 65% of them were enrolled in ToU plans, and only 2% had experimented
but given up these plans. 87% of ToU tariff users charged off-peak between 95 and 100% of the time.
Most users who did not enrol in ToU plans indicated that they were comfortable with charging
expenditures associated with flat tariffs. The other two most frequent reasons mentioned were that
ToU tariffs would incur more expensive bills, or would make charging too inconvenient (SEPA, 2019).
A comparison between utility providers showed that ToU plan enrolment was higher when there
were associated marketing campaigns, enrolment was free, and bill savings were achieved by
average EV users (SEPA, 2019). A large-scale study with more than 4,000 participants in San Diego,
California, tested the effectiveness of different ratios between peak and super off-peak (after
midnight) tariffs and used the results to simulate the ideal ratio. They observed that a ratio of 6:1
between peak and super off-peak may be able to shift 90% of the demand to super off-peak charging
(Idaho National Laboratory, 2015).
As mentioned earlier, in the case of UMS, ToU tariff schemes may create second peaks (as most
users plug their vehicles as soon as the price drops), which may become problematic as EV fleets
grow. In that sense, reward systems would be preferable as they could utilise games to spread the
demand more evenly (Fleetcarma, 2020). Another alternative would be the use of dynamic tariffs.
However, UMS may become cumbersome depending on the volatility of dynamic tariffs, and thus,
these may be more suitable for smart charging. Nevertheless, semi-dynamic ToU tariffs (updated
every 24 hours) implemented by Octopus Energy in the UK resulted in a 47% reduction in peak
consumption by EV owners undertaking UMS (Octopus Energy, 2018).
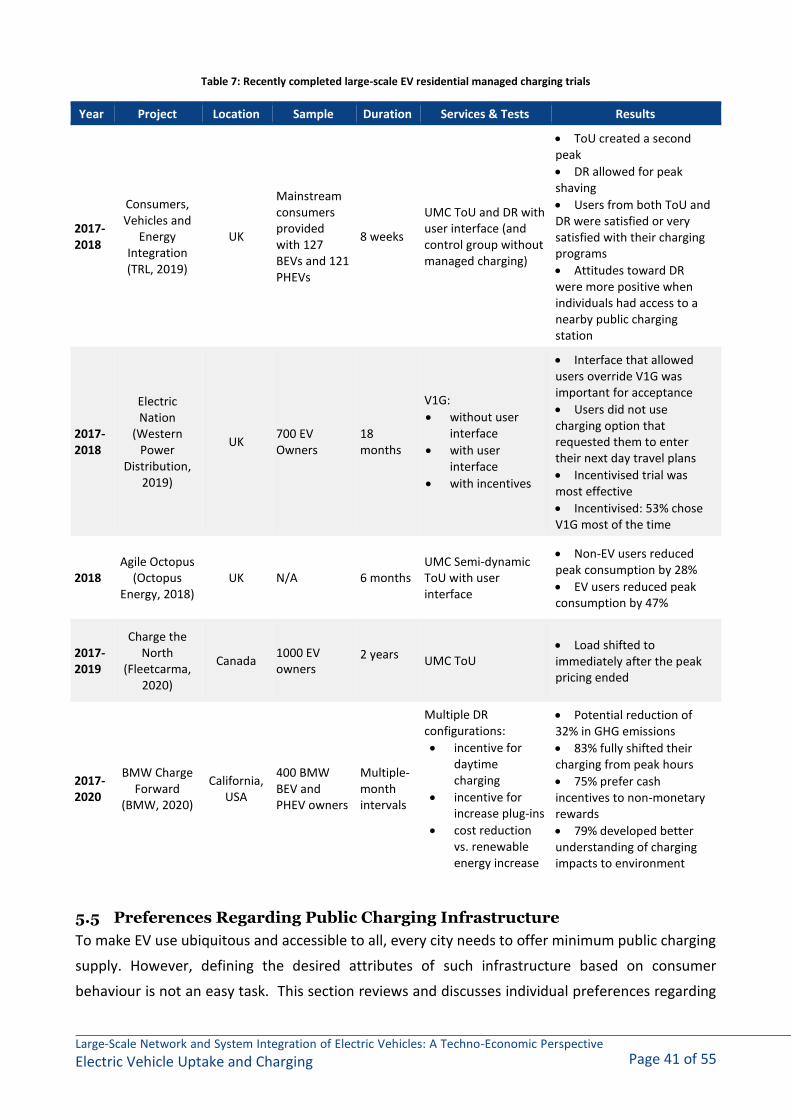
Large-Scale Network and System Integration of Electric Vehicles: A Techno-Economic Perspective Electric Vehicle Uptake and Charging Page 41 of 55
Table 7: Recently completed large-scale EV residential managed charging trials
Year Project Location Sample Duration Services & Tests Results
2017-2018
Consumers, Vehicles and
Energy Integration (TRL, 2019)
UK
Mainstream consumers provided with 127 BEVs and 121 PHEVs
8 weeks
UMC ToU and DR with user interface (and control group without managed charging)
• ToU created a second peak
• DR allowed for peak shaving
• Users from both ToU and DR were satisfied or very satisfied with their charging programs
• Attitudes toward DR were more positive when individuals had access to a nearby public charging station
2017-2018
Electric Nation
(Western Power
Distribution, 2019)
UK 700 EV Owners
18 months
V1G:
• without user interface
• with user interface
• with incentives
• Interface that allowed users override V1G was important for acceptance
• Users did not use charging option that requested them to enter their next day travel plans
• Incentivised trial was most effective
• Incentivised: 53% chose V1G most of the time
2018 Agile Octopus
(Octopus Energy, 2018)
UK N/A 6 months UMC Semi-dynamic ToU with user interface
• Non-EV users reduced peak consumption by 28%
• EV users reduced peak consumption by 47%
2017-2019
Charge the North
(Fleetcarma, 2020)
Canada 1000 EV owners
2 years UMC ToU • Load shifted to immediately after the peak pricing ended
2017-2020
BMW Charge Forward
(BMW, 2020)
California, USA
400 BMW BEV and PHEV owners
Multiple- month intervals
Multiple DR configurations:
• incentive for daytime charging
• incentive for increase plug-ins
• cost reduction vs. renewable energy increase
• Potential reduction of 32% in GHG emissions
• 83% fully shifted their charging from peak hours
• 75% prefer cash incentives to non-monetary rewards
• 79% developed better understanding of charging impacts to environment
5.5 Preferences Regarding Public Charging Infrastructure
To make EV use ubiquitous and accessible to all, every city needs to offer minimum public charging
supply. However, defining the desired attributes of such infrastructure based on consumer
behaviour is not an easy task. This section reviews and discusses individual preferences regarding
Page 42 of 55
spatial coverage, challenges associated with public parking and charging, as well as preferences and
impacts of pricing strategies and policies.
5.5.1 Spatial Distribution and Value of Fast Charging
There are essentially three purposes that may guide user preference regarding the location of public
charging infrastructure and their perceived need for fast charging:
1. For those who live in dense urban areas and do not have access to home charging, public
charging can serve as the main charging resource.
2. For those who are risk averse and experience range anxiety, public charging infrastructure
serve as reassurance that they will be able to complete their trips.
3. Public charging infrastructure may serve to enable long distance travel by extending EV
driving range.
These three purposes have distinct impacts on how the spatial distribution of charging stations
should be planned. In the first case, stations need to be located close to residences and allow for
convenient parking during times that individuals are home. In the second case, stations need to be
evenly distributed across the space and easily accessible, while in the third situation, they need to
be strategically positioned in long-distance travel corridors (Hardman et al., 2018). Intuitively, fast-
charging (Level 3) infrastructure would be more important in this last case, but also in the first case
if demand is high.
There is not a consensus in the literature about which one of the infrastructure deployment
strategies above is preferred by users, which is expected considering that such preferences are
context dependent. Similarly, the perceived importance of Level 3 charging also seems to vary. In
Germany, Anderson et al. (2018) and Krause et al. (2018) elicited preferences from both EV users
and potential users and concluded that Level 3 was considered important only for a small fraction
of trips, especially long-distance travel for business or leisure purposes. In the same country,
Globisch et al. (2019) investigated the opinion of potential EV users to understand the relative
importance of spatial coverage and fast charging to mainstream consumers and concluded that
Level 3 charging should be prioritised over dense coverage. That is, potential users are more willing
to take detours to charge than to spend long periods of time at service stations. Similar results were
also observed by Philipsen et al. (2015, 2016). Results from Sun et al. (2016, 2017), on the other
hand, indicate that in countries with denser cities, such as China and Japan, where large shares of
EV owners do not have access to residential charging and rely on public charging for everyday
charging, detours are not acceptable.
Variability in results emerge not only from differences in context, but also from the use of varied
data sources. The literature review conducted by Hardman et al. (2018) concludes that different
guidelines to determine optimal location for charges, especially Level 3, are a consequence of
conflicting results being observed by studies with different data sources (GPS travel behaviour,
Large-Scale Network and System Integration of Electric Vehicles: A Techno-Economic Perspective Electric Vehicle Uptake and Charging Page 43 of 55
questionnaire survey, and data from actual charging stations). Further, Nicholas et al. (2017)
compared EV users stated preferences and actual usage (of Level 3 public charging GPS and station
data) and showed that in the survey users chose ideal charging station locations significantly farther
away from their homes than what was revealed in their actual observed usage patterns.
5.5.2 Parking Duration vs. Charging Duration
Charge point congestion or “hogging” is a frequent problem depicted in the literature about public
charging usage. In other words, it is common that EV users plug and park their vehicles at charging
stations for a period that is longer than the charging time (Wolbertus and Hoed, 2017;
Sadeghianpourhamami et al., 2018; Southgate, 2019; Sunnerstedt et al., 2019).
A study based on one-year data from destination and street public chargers (Level 2 and 3) in
Stockholm, Sweden, show that in 38% of the Level 2 charging sessions, vehicles stay parked for
longer than the maximum allowed charging duration (three hours). Exceeded parking durations are
longer and more frequent in destination charging compared to street charging. For Level 3 charging,
where maximum charging session is capped at 30 minutes, 41% of vehicles exceed parking time,
suggesting the need for stricter enforcement to guarantee the desired turn around or the need for
time-based access fees (Sunnerstedt et al., 2019).
Similarly, Netherlands data from over one million Level 2 public charging sessions in 2016 show that
vehicles are on average charging for only 20% of their parking duration. Station hogging is higher on
weekends compared to weekdays, and most of the hogging (86%) is attributed to less than half of
the users. Compared to PHEV, BEVs are more likely to be left for longer periods at stations, and so
are vehicles from shared fleets. Occupation due to hogging varies across stations from 0% to 80%,
being more prevalent in large cities such as Amsterdam, where parking spots are scarce. In other
words, the lack of parking spots is an important contributor to station congestion (Wolbertus and
Van den Hoed, 2017).
Sadeghianpourhamami et al. (2018) further analyse the Netherlands’ data and conclude that station
hogging in public chargers close to business centres (areas with high employment density) is far
more significant than at other public charging locations. In business districts, observed idle times
are on average 5.5 hours compared to 48 minutes in other areas.
Congestion at charging stations due to hogging is also being observed in Australia. Based on personal
experience, Southgate (2019) attributes such problem to the free cost for charging and chargers not
being equipped with timers and protocols to educate users.
5.5.3 Willingness to Pay for Public Charging Infrastructure Use
Reduced operating costs is a common motivation for consumers to purchase EVs. In Australia, the
Electric Vehicle Council estimates that users who drive on average 12,600 kilometres per year save
close to $1,300 dollars yearly (EVC, 2019). While home charging may be able to guarantee such
Page 44 of 55
savings and keep EV operating costs attractive, free or cheap public charging may also contribute
but will unlikely sustain as a long-term business model. Further, as pointed by Hardman and
colleagues, even though free public charging can serve as an incentive to increase EV market
penetration, free Level 3 charging may have negative behavioural consequences. For example,
overnight charging at home may be substituted by free Level 3 public charging, not only creating
station congestion problems, but also intensifying peak power demand (Hardman et al., 2018).
The literature suggests five tariff models for public charging:
1. by time connected and parked at the charging point,
2. by energy used (kWh),
3. by means of monthly subscription fees or flat fees,
4. a combination of 1 and 3, and
5. a combination of 2 and 3.
Research comparing users and potential users’ preferences for these five types of public charging
tariffs is still scarce and only limited results are available. A stated preference survey with potential
EV users in Germany comparing schemes 2, 3 and 4 pointed that payment by energy used and fixed
monthly fees (3) are the most preferred alternatives, with 47% and 42% shares respectively (Wolff
and Madlener, 2019). Based on data from public Level 3 charging sessions, Motoaki and Shirk (2017)
observed that flat tariffs (3) may induce inefficient fast public charger usage when compared to free
charging. The authors indicate that when users pay a flat fee to charge, they leave their vehicles
charging for a longer time (compared to free charging), expecting to obtain a higher SOC. However,
fast charging rates are not constant over time, that is, they decrease with the increase of SOC.
Therefore, there is a diminished return to time spent occupying the fast charger. Since using fast
chargers for long sessions is inefficient and may contribute to congestion in stations, tariff models
should discourage this behaviour.
Another layer of complexity in charging tariffs can be added by the introduction of dynamic pricing.
Dynamic pricing involves tariffs that vary over time depending on the real time balance between
electricity supply and demand. Together with smart charging, dynamic pricing can play a
fundamental role in avoiding consumption peaks and in leveraging the usage of electricity produced
by renewable sources, both in residential and public charging settings (Limmer, 2019). In a literature
review about dynamic pricing for EV charging, Limmer (2019) observed that, even though current
dynamic pricing studies consider that users are maximising their charging utility (which is usually
characterised by the maximisation of the amount charged minus costs), they are not based on actual
elicited user preferences or observed charging behaviour.
Public charging tariff structures and dynamic pricing schemes are important not only to increase the
feasibility of charging infrastructure provision business models but also as a demand management
Large-Scale Network and System Integration of Electric Vehicles: A Techno-Economic Perspective Electric Vehicle Uptake and Charging Page 45 of 55
tool. Therefore, empirical evidence on user response to pricing is of strategic relevance to electricity
supply planning and operations. This relevance is likely to become even more significant with the
transition to renewable energy resources, as energy production becomes more unevenly distributed
over time. Yet, empirical results on consumers’ willingness to pay to use public charging
infrastructure and their response to different tariff structures and dynamic pricing are still scarce in
the literature.
Finally, other challenges associated with public charging use are the lack of clarity on how payment
works and the adoption of different payment schemes by different public charging providers. A
similar problem is associated with providers having different membership cards. In this sense, there
is a need for public charging interoperability regulations, such as the ones implemented in the
Netherlands, Portugal, and Germany (Hardman et al., 2018).
5.5.4 Response to Public Charging Policies
While certain policies may contribute to EV uptake, they may also influence the charging behaviour
of those who already own EVs. Wolbertus et al. (2018) investigated the effect of two EV-parking
policies on both EV purchase intentions and charging behaviour in the Netherlands. They combined
revealed and stated preference data to investigate (1) daytime charging policies that reserve parking
spots close to chargers exclusively for charging vehicles during a specific time of the day (10am-
7pm, for example) and allow non-EVs to use these spots to park in the remaining hours of the day;
and (2) policies that offer free parking to EVs charging while non-EVs still need to pay. The authors
observed that daytime charging policies had little impact on charging station usage and actual
charging behaviour, as the reserved parking spots were being used for EV parking rather than EV
charging during the night. However, such policy had a negative impact on EV purchase intention as
it increased prospective users’ uncertainty of charging infrastructure availability. In terms of free
parking policies, while they did show a positive effect on EV purchase intention, they resulted in
elongated connection durations. That is, to take advantage of free parking, EVs would remain
connected to chargers even after reaching full SOC (Wolbertus et al., 2018).
In conclusion, while policies associated with public charging infrastructure provision might be valued
by prospective EV users and considered important in their purchase decision, such incentives should
be evaluated comprehensively by taking into consideration potential effects on the charging
behaviour of current EV users.
Page 46 of 55
6 Conclusions
EV uptake is steadily increasing globally and in Australia. Electricity networks in Australia have a
fundamental role in enabling efficient EV adoption, which, if effectively achieved can provide huge
opportunities for improved network utilisation, decarbonisation of transport, integration of
renewable energy resources, and economic growth. However, if EV utilisation is unmanaged, there
is a potential for increases in peak demand, leading to significant network and generation
investment and causing network security issues.
In Australia, there is significant uncertainty around consumers expectations and future EV charging
behaviour. Data gaps also make the impacts on the grid unknown, which hinders proactive actions
to prepare the network for the EV adoption “tipping point”. The EV Integration Project aims to
contribute to such gaps and investigate potential impacts of EV uptake on electricity networks under
different future scenarios. The first step of this project is to understand consumers expectations and
behaviours associated with EV usage. In this sense, this report presented the results of a literature
review of national and international experience with the objectives of understanding:
• Who the current and future EV consumers are and how to support and increase EV adoption.
• What the preferred charging patterns are and how to best manage charging behaviour.
The Context Technology: EV technology is quicky evolving and long-range battery electric vehicles are gaining
most market traction.
The Australian market for EVs remains very limited. In Australia, the EV market is still timid
compared to other developed economies, and so is the availability of information on EV users.
Significant growth in EV sales in 2019 shows that the market might start to quickly evolve, which
calls for a rapid adaptation. Further, there is some evidence in the literature that Australians are
increasingly undertaking EV purchase research.
The rollout of Australian charging infrastructure is progressing but may not yet be at a
point to stimulate mainstream uptake of EVs. Charging infrastructure is being deployed to
encourage market growth. The ratio between the number of public charging stations and the
number of EVs in Australia in 2020 can be considered high (1:9) if compared with other countries,
like the USA. Still, current public infrastructure deployment may not be large enough to be noticed
by potential mainstream consumers.
Policies and incentives: Policies to stimulate EV adoption can be in the form of monetary
incentives, charging infrastructure deployment, transport related policies and regulations, and
consumer awareness and education programs. Governments usually implement a combination of
these incentives. Most Australian states have developed or are developing EV strategies but actual
incentives to EV purchase are still limited.
Large-Scale Network and System Integration of Electric Vehicles: A Techno-Economic Perspective Electric Vehicle Uptake and Charging Page 47 of 55
The Consumer Limited data around mainstream EV consumer preferences and behaviours is currently a
major challenge to proactive planning. Although EVs have been available in some countries for
about a decade, uncertainty around customer expectations, usage patterns, and charging behaviour
is still a reality. This is because even in countries like Norway, where EVs account for more than 50%
of annual sales of new passenger vehicles, the total EV fleet share is still around 15%. In this sense,
just a small fraction of the population, which is likely not representative of the majority of
mainstream consumers, has been experiencing such technology. In Australia, EV sales accounted
for only 0.6% of all new sales in 2019, showing that this technology is being adopted only by
innovators. Such scarcity in data and limited understanding of EV consumer behaviour makes it
difficult for planners and electricity suppliers to prepare for the EV transition ‘tipping point’.
Demographics of current owners: In both Europe and USA, the average EV owner is male,
approaching middle age, with high income and education, living in family households with multiple
vehicles. The EV is usually the main car. There is a lack of information on current EV owners in
Australia.
If the price is right: There is clear evidence of a latent demand for EVs conditional on price
reductions both in Australia and globally.
Purchase Decisions Perceived advantages are the main determinants of adoption of innovations. EVs are
cleaner, quieter, and have lower running costs than internal combustion engine vehicles (ICEVs).
However, they also have higher purchase costs, shorter driving ranges (or at least are perceived as
having) and require behavioural adaptation from refuelling to charging practices.
Empirical research and government incentives underestimate the importance of
increasing EV information availability to consumers and facilitating access to product
experience. User knowledge about EVs is not only important as the start of the decision process
but also throughout the persuasion phase. Even in leading markets, such as California, lack of
awareness about EVs and incentives remains a powerful barrier hindering adoption.
Increasing EV advantages: To the mainstream consumer, perceived disadvantages still outweigh
advantages, which calls for strategies and incentives to increase EV desirability. Consumers prefer
monetary incentives over non-monetary incentives. There is special preference for purchase
monetary incentives, either as purchase rebates or tax discounts. International experience shows
that phase-out of incentives is likely to be implemented before EV technology reaches mainstream
consumers. Targeting incentives at low-end long-range EVs can maximise the impacts of funding
resources.
The deployment of public fast charging has been found to contribute to more electric
vehicle travel, but planners should also consider how these chargers are being used.

Page 48 of 55
Potential EV users perceive lack of public charging infrastructure as one of the main barriers to EV
adoption. Yet, as consumers become more familiar with and educated about EVs, the less they
perceive public charging infrastructure as an EV purchase barrier. Fast public charging infrastructure
has, however, been proven to contribute to an overall increase in electric vehicle kilometres
travelled. Further, even though policies associated with public charging infrastructure are valued by
prospective EV users and are considered important in their purchase decision, such incentives
should be evaluated comprehensively by taking into consideration potential effects on the charging
behaviour of current EV users.
Charging Decisions Consumers’ preferred charging location is at home and, with the growth of long-range EV
popularity, Level 2 residential charging is likely to grow: Current EV users (in North America
and Europe) strongly rely on home charging and find it to be the most convenient charging location.
North American and European countries that are currently experiencing rapid growth in the number
of long-range EVs are also seeing increases in Level 2 home charging. The expansion in the range of
EV batteries has also been accompanied by an increase in vehicle utilisation rates, which have
increased overall electricity demand per household.
Home charging is likely to prevail in most areas in Australia where dwellings have off-
street parking. Since Australia’s developing EV market is likely to have long-range EVs as the
standard, facilitated installation of Level 2 home charging should be considered together with
potential impacts on the grid.
Users are likely to trade residential charging by free destination charging when looking
for monetary savings: A growing substitution of home charging by free charging at the workplace
or other destinations is observed in both North America and Europe, indicating that users are willing
to trade convenience by monetary savings. In Australia, free charging can be used as a strategy not
only to incentivise EV uptake but also to manage charging demand spatially and proactively avoid
localised electricity demand peaks in specific suburban areas. Such peaks are expected based on
evidence from North American literature, which indicates that the distribution of EVs in suburban
areas tends to occur in clusters and EV usage rates among suburban dwellers also tend to be higher.
The combination of these factors increases the volatility of charging load curves and creates higher
localised peaks, which can affect the distribution network.
Fast-charging infrastructure should be context driven: In very dense urban areas, where the
share of EV users with home charging is very low, Level 3 public charging is highly valued by users.
Otherwise, in places where home charging is common, Level 3 charging is seen as relevant mostly
in long-distance travel corridors. Such preferences suggest that, in Australia, Level 3 charging
infrastructure should target dense residential areas as well as freeways and major rural highways.
Urban fast-charging infrastructure should, however, be planned in alignment with overall transport
Large-Scale Network and System Integration of Electric Vehicles: A Techno-Economic Perspective Electric Vehicle Uptake and Charging Page 49 of 55
and land use planning strategies to avoid undesired increase in private vehicle usage and congestion
in central dense areas.
Parking and tariff structure can play an import role in promoting efficient use of fast
public charging infrastructure: Flat charging tariffs are likely to induce longer Level 3 charging
sessions, which might lead to inefficient use of public charging resources. Parking rules and
enforcement together with tariff structure can play an important role in preventing congestion and
underutilisation of public charging infrastructure. User education about the fact that charging rates
decrease with the increase of SOC might also help avoid congestion at fast chargers.
Users are receptive of time-of-use tariffs, but smart charging strategies or more dynamic
tariff structures may be necessary to avoid second peaks: There is national and international
empirical evidence that when no demand management is in place, EV users are likely to charge their
vehicles when they arrive at work or when they arrive home after work. Although users are
receptive of ToU tariffs, they tend to charge their vehicles in the initial hours of the price drop, which
may cause secondary peaks. Local peaks might be accentuated by the uneven spatial distribution of
EV ownership mentioned earlier.
Smart charging acceptance can be magnified by user interface that allows overriding.
Back-up public fast charging near residences can help compensate for potential increase in
uncertainty and loss of control felt by users. Current smart charging trials taking placing in Australia
are of utmost importance.
Charging frequency and duration vary across different EV technologies and may change
as the prevalence of long-range BEV increases. On average, North American and European BEV
users charge their vehicles between three and four and a half times per week and the average
session does not exceed four hours. Even though these values are likely to change as the penetration
of long-range EVs increase, such results are an evidence of habitual charging behaviour rather than
irregular “empty-to-full” recharges. Charging sessions using Level 3 chargers are usually shorter than
30 minutes. Indeed, longer sessions in Level 3 public chargers might be inefficient since charging
rates decrease with the increase of state of charge.
EV consumer behaviour data and research need to be continuously expanded to track and
predict changes brought by the evolution of battery and charging technologies as well as the
transition of the adoption curve toward mainstream consumers. Both technological and consumer
transitions may bring changes to EV usage and charging patterns that should be identified in
advance to inform planning and promote efficient management of resources. Australia, in specific,
has very limited empirical evidence on consumer preferences and behaviours regarding EV
adoption, use, and charging. In this sense, there is room for empirical research based on stated and
revealed preference surveys as well as charging infrastructure usage data.

Page 50 of 55
References
AEMC, 2020. 2020 Retail energy competition review: electric vehicles. Available at: https://www.aemc.gov.au/sites/default/files/documents/rpr0012_-_2020_retail_energy_competition_review_-_electric_vehicles_-_issues_paper.pdf. Accessed on: 24/05/2020.
AlixPartners, 2019. INTERNATIONAL ELECTRIC-VEHICLE CONSUMER SURVEY: Are battery electric vehicles here to stay?. Available at: https://www.alixpartners.com/insights-impact/insights/international-electric-vehicle-consumer-survey/. Accessed on: 24/05/2020.
Anderson, J.E., Lehne, M. and Hardinghaus, M., 2018. What electric vehicle users want: Real-world preferences for public charging infrastructure. International Journal of Sustainable Transportation, 12(5), pp.341-352.
Axsen, J. and Kurani, K.S., 2012. Who can recharge a plug-in electric vehicle at home?. Transportation Research Part D: Transport and Environment, 17(5), pp.349-353.
Axsen, J., Langman, B. and Goldberg, S., 2017. Confusion of innovations: mainstream consumer perceptions and misperceptions of electric-drive vehicles and charging programs in Canada. Energy research & social science, 27, pp.163-173.
Baresch, M. and Moser, S., 2019. Allocation of e-car charging: Assessing the utilization of charging infrastructures by location. Transportation Research Part A: Policy and Practice, 124, pp.388-395.
Bloomberg NEF, 2020. Electric Vehicle Outlook 2020. Available at: https://about.bnef.com/electric-vehicle-outlook/#toc-viewreport. Accessed on: 24/05/2020.
BMW, 2020. BMW ChargeForward Report. Available at: https://bmwmovement.org/bmw-releases-chargeforward-report/. Accessed on: 18/03/2021.
Broadbent, G. and Matternicht, G., 2020. Electric car sales tripled last year. Here’s what we can do to keep them growing. The Conversation. Available at: https://theconversation.com/electric-car-sales-tripled-last-year-heres-what-we-can-do-to-keep-them-growing-131372. Accessed on: 24/05/2020.
Bunce, L., Harris, M. and Burgess, M., 2014. Charge up then charge out? Drivers’ perceptions and experiences of electric vehicles in the UK. Transportation Research Part A: Policy and Practice, 59, pp.278-287.
Bühler, F., Cocron, P., Neumann, I., Franke, T. and Krems, J.F., 2014. Is EV experience related to EV acceptance? Results from a German field study. Transportation Research Part F: traffic psychology and behaviour, 25, pp.34-49.
Colmar Brunton, 2019. Queensland Household Energy Survey 2019 - Insights Report. Available at: https://www.powerlink.com.au/sites/default/files/2020-04/2019%20Queensland%20Household%20Energy%20Survey%20Report.pdf. Accessed on: 18/03/2021.
Contestabile, M., Tal, G. and Turrentine, T., 2020. Who's Driving Electric Cars. Springer International Publishing.
Delmonte, E., Kinnear, N., Jenkins, B. and Skippon, S., 2020. What do consumers think of smart charging? Perceptions among actual and potential plug-in electric vehicle adopters in the United Kingdom. Energy Research & Social Science, 60, p.101318.
Deloitte, 2020. Electric vehicles: Setting a course for 2030. Available at: https://www2.deloitte.com/uk/en/insights/focus/future-of-mobility/electric-vehicle-trends-2030.html/#endnote-sup-38. Accessed on: 18/03/2021.
Deloitte, 2021. Global Automotive Consumer Study 2021 - Australian perspective: Electric vehicles? Virtual sales? Maybe not so fast! Available at: https://www2.deloitte.com/au/en/pages/consumer-industrial-products/articles/global-automotive-consumer-study.html. Accessed on: 18/03/2021.
Delta-EE, 2019. Consumer Insight on Smart Charging Survey Report. Available at:
https://innovation.ukpowernetworks.co.uk/wp-content/uploads/2020/05/Delta-EE-Survey-Report-for-
Shift-UK-Power-Networks.pdf. Accessed on: 18/03/2021.
Large-Scale Network and System Integration of Electric Vehicles: A Techno-Economic Perspective Electric Vehicle Uptake and Charging Page 51 of 55
Dini, A.L., 2018. Influence of new car buyers' purchase experience on plug-in electric vehicle demand (Doctoral
dissertation, Queensland University of Technology).
Energeia, 2018. Australian Electric Vehicle Market Study. Available at: https://arena.gov.au/assets/2018/06/australian-ev-market-study-report.pdf. Accessed on: 24/05/2020.
Engel, H., Hensley, R., Knupfer, S. and Sahdev, S., 2018. Charging ahead: Electric-vehicle infrastructure demand. McKinsey & Company. Available at: https://www.mckinsey.com/~/media/McKinsey/Industries/Automotive%20and%20Assembly/Our%20Insights/Charging%20ahead%20Electric-vehicle%20infrastructure%20demand/Charging-ahead-electric-vehicle-infrastructure-demand-final.ashx. Accessed on: 24/05/2020.
EVgo, 2020. TYPES OF ELECTRIC VEHICLES: BEV, PHEV AND HEV. Available at: https://www.evgo.com/why-evs/types-of-electric-vehicles/. Accessed on: 24/05/2020.
EVSE, 2020. What plug does my EV require in Australia? Available at: https://evse.com.au/blog/rightevconnector/. Accessed on: 24/05/2020.
EVC, 2019. State of Electric Vehicles. August 2019. Available at: https://electricvehiclecouncil.com.au/wp-content/uploads/2019/09/State-of-EVs-in-Australia-2019.pdf. Accessed on: 24/05/2020.
EVC, 2020. State of Electric Vehicles. August 2020. Available at: https://electricvehiclecouncil.com.au/reports/state-of-electric-vehicles-2020/. Accessed on: 18/03/2021.
EVC, 2021. New electric car sales figures show Australia stalled with hazards flashing. Available at: https://electricvehiclecouncil.com.au/new-electric-car-sales-figures-show-australia-stalled-with-hazards-flashing/. Accessed on: 24/04/2021.
Fleetcarma, 2019. Charge the North: Results from the world's largest EV charging study. Available at: https://www.fleetcarma.com/resources/charge-the-north-summary-report/. Accessed on: 24/05/2020.
Fleetcarma, 2020. EV Growing Pains: Electric vehicles are evolving and up-to-date data is critical for demand-side management. Available at: https://www.fleetcarma.com/resources/electric-vehicle-growing-pains/. Accessed on: 24/05/2020.
Flip the Fleet, 2017. Convenience of home charging compared to filling up with petrol. Available at: https://flipthefleet.org/2017/convenience-home-charging-compared-filling-petrol-1-click-survey-10/. Accessed on: 24/05/2020.
Franke, T. and Krems, J.F., 2013. Understanding charging behaviour of electric vehicle users. Transportation Research Part F: Traffic Psychology and Behaviour, 21, pp.75-89.
Funke, S.Á., Sprei, F., Gnann, T. and Plötz, P., 2019. How much charging infrastructure do electric vehicles need? A review of the evidence and international comparison. Transportation Research Part D: Transport and Environment, 77, pp.224-242.
Geotab Energy, 2020. EV driver insights: Understanding the experiences powering electric vehicle driver behavior. Available at: https://image.info.fleetcarma.com/lib/fe321171716404797c1674/m/1/14dc7fa3-567c-4b0b-85d9-a10e94a6b8fa.pdf. Accessed on: 21/03/2021.
Globisch, J., Plötz, P., Dütschke, E. and Wietschel, M., 2019. Consumer preferences for public charging infrastructure for electric vehicles. Transport Policy, 81, pp.54-63.
Gong, S., Ardeshiri, A. and Rashidi, T.H., 2020. Impact of government incentives on the market penetration of electric vehicles in Australia. Transportation Research Part D: Transport and Environment, 83, p.102353.
Government of South Australia, 2021. Electric Vehicle Road User Charge consultation to begin. Available at: https://www.premier.sa.gov.au/news/media-releases/news/electric-vehicle-road-user-charge-consultation-to-begin. Accessed on: 21/04/2021.
Page 52 of 55
Graham-Rowe, E., Gardner, B., Abraham, C., Skippon, S., Dittmar, H., Hutchins, R. and Stannard, J., 2012. Mainstream consumers driving plug-in battery-electric and plug-in hybrid electric cars: A qualitative analysis of responses and evaluations. Transportation Research Part A: Policy and Practice, 46(1), pp.140-153.
Hardman, S., 2019. Understanding the impact of reoccurring and non-financial incentives on plug-in electric vehicle adoption–a review. Transportation Research Part A: Policy and Practice, 119, pp.1-14.
Hardman, S., Chandan, A., Tal, G. and Turrentine, T., 2017. The effectiveness of financial purchase incentives for battery electric vehicles–A review of the evidence. Renewable and Sustainable Energy Reviews, 80, pp.1100-1111.
Hardman, S., Jenn, A., Tal, G., Axsen, J., Beard, G., Daina, N., Figenbaum, E., Jakobsson, N., Jochem, P., Kinnear, N. and Plötz, P., 2018. A review of consumer preferences of and interactions with electric vehicle charging infrastructure. Transportation Research Part D: Transport and Environment, 62, pp.508-523.
Higueras-Castillo, E., Molinillo, S., Coca-Stefaniak, J.A. and Liébana-Cabanillas, F., 2020. Potential Early Adopters of Hybrid and Electric Vehicles in Spain—Towards a Customer Profile. Sustainability, 12(11), p.4345.
Hu, L., Dong, J. and Lin, Z., 2019. Modeling charging behavior of battery electric vehicle drivers: A cumulative prospect theory based approach. Transportation Research Part C: Emerging Technologies, 102, pp.474-489.
Idaho National Laboratory, 2015. Plug-in Electric Vehicle and Infrastructure Analysis. Available at: https://inldigitallibrary.inl.gov/sites/sti/sti/6799570.pdf. Accessed on: 24/05/2020.
IEA, 2019. Global EV Outlook 2019: Scaling-up the transition to electric mobility. Available at: https://www.iea.org/reports/global-ev-outlook-2019. Accessed on: 24/05/2020.
IEA, 2020. Global EV Outlook 2020: Entering the decade of electric drive? Available at: https://www.iea.org/reports/global-ev-outlook-2020. Accessed on: 24/02/2021.
IEA, 2021. How global electric car sales defied Covid-19 in 2020. Available at: https://www.iea.org/commentaries/how-global-electric-car-sales-defied-covid-19-in-2020. Accessed on: 24/04/2021.
Jabeen, F., Olaru, D., Smith, B., Braunl, T. and Speidel, S., 2013, October. Electric vehicle battery charging behaviour: findings from a driver survey. In Proceedings of the Australasian Transport Research Forum.
Jenn, A., Springel, K. and Gopal, A.R., 2018. Effectiveness of electric vehicle incentives in the United States. Energy Policy, 119, pp.349-356.
Jenn, A., Lee, J.H., Hardman, S. and Tal, G., 2020. An in-depth examination of electric vehicle incentives: Consumer heterogeneity and changing response over time. Transportation Research Part A: Policy and Practice, 132, pp.97-109.
Jensen, A.F., Cherchi, E. and Mabit, S.L., 2013. On the stability of preferences and attitudes before and after experiencing an electric vehicle. Transportation Research Part D: Transport and Environment, 25, pp.24-32.
Jia, W. and Chen, T.D., 2021. Are Individuals’ stated preferences for electric vehicles (EVs) consistent with real-world EV ownership patterns?. Transportation Research Part D: Transport and Environment, 93, p.102728.
Jones, L., Lucas-Healey, K., Sturmberg, B., Temby, H. and Islam, M., 2021. Available at: https://arena.gov.au/assets/2021/01/revs-the-a-to-z-of-v2g.pdf. Accessed on: 15/03/2021.
Khoo, Y.B., Wang, C.H., Paevere, P. and Higgins, A., 2014. Statistical modeling of Electric Vehicle electricity consumption in the Victorian EV Trial, Australia. Transportation Research Part D: Transport and Environment, 32, pp.263-277.
Kim, S., Yang, D., Rasouli, S. and Timmermans, H., 2017. Heterogeneous hazard model of PEV users charging intervals: Analysis of four year charging transactions data. Transportation Research Part C: Emerging Technologies, 82, pp.248-260.
Large-Scale Network and System Integration of Electric Vehicles: A Techno-Economic Perspective Electric Vehicle Uptake and Charging Page 53 of 55
Koty, A. C., 2020. Incentives for China’s New Energy Vehicles Industry. China Briefing. Available at: https://www.china-briefing.com/news/china-electric-vehicles-hybrid-vehicles-industry-incentives-extended-investment-new-infrastructure/. Accessed on: 18/03/2021.
Krause, J., Ladwig, S. and Schwalm, M., 2018. Statistical assessment of EV usage potential from user’s perspective considering rapid-charging technology. Transportation Research Part D: Transport and Environment, 64, pp.150-157.
Lee, J.H., Chakraborty, D., Hardman, S.J. and Tal, G., 2020. Exploring electric vehicle charging patterns: Mixed usage of charging infrastructure. Transportation Research Part D: Transport and Environment, 79, p.102249.
Lee, J.H., Hardman, S.J. and Tal, G., 2019. Who is buying electric vehicles in California? Characterising early adopter heterogeneity and forecasting market diffusion. Energy Research & Social Science, 55, pp.218-226.
Limmer, S., 2019. Dynamic Pricing for Electric Vehicle Charging—A Literature Review. Energies, 12(18), p.3574.
McKinsey, 2018. CHARGING AHEAD: ELECTRIC VEHICLE INFRASTRUCTURE DEMAND. Available at: https://www.mckinsey.com/~/media/McKinsey/Industries/Automotive%20and%20Assembly/Our%20Insights/Charging%20ahead%20Electric-vehicle%20infrastructure%20demand/Charging-ahead-electric-vehicle-infrastructure-demand-final.ashx. Accessed on: 29/05/2020.
Milligan, B., 2018. Electric cars: what if you live in a flat? BBC News. Available at: https://www.bbc.com/news/business-42944523. Accessed on: 24/05/2020.
Motoaki, Y. and Shirk, M.G., 2017. Consumer behavioral adaption in EV fast charging through pricing. Energy Policy, 108, pp.178-183.
Morrissey, P., Weldon, P. and O’Mahony, M., 2016. Future standard and fast charging infrastructure planning: An analysis of electric vehicle charging behaviour. Energy Policy, 89, pp.257-270.
Münzel, C., Plötz, P., Sprei, F. and Gnann, T., 2019. How large is the effect of financial incentives on electric vehicle sales?–A global review and European analysis. Energy Economics, 84, p.104493.
National Research Council, 2015. Overcoming barriers to deployment of plug-in electric vehicles. National Academies Press.
New Zealand Ministry for the Environment, 2018. Reducing barriers to Electric Vehicle uptake: Behavioural insights analysis and review. Wellington: Ministry for the Environment. Available at: https://www.mfe.govt.nz/publications/climate-change/reducing-barriers-electric-vehicle-uptake-behavioural-insights-analysis. Accessed on: 24/05/2020.
Nicholas, M. and Tal, G., 2017. Survey and Data Observation on Consumer Motivations to DC Fast Charge. In Proceedings of EVS30 International Battery, Hybrid and Fuel Cell Electric Vehicle Symposium (pp. 9-11).
Nicholas, M., Tal, G. and Ji, W., 2017. Lessons from in-use fast charging data: why are drivers staying close to home. Inst. Transp. Stud.
Nielsen Company, 2019. Caught in the slow lane: Australians adoption of electric vehicles report 2019. Available at: https://www.nielsen.com/wp-content/uploads/sites/3/2019/10/nielsen-australia-adoption-electric-vehicles-caught-in-the-slow-lane-report.pdf. Accessed on: 21/03/2021.
Octopus Energy, 2018. Agile Octopus: A consumer-led shift to a low carbon future. Available at: https://octopus.energy/static/consumer/documents/agile-report.pdf. Accessed on: 21/03/2021.
Philipsen, R., Schmidt, T., Van Heek, J. and Ziefle, M., 2016. Fast-charging station here, please! User criteria for electric vehicle fast-charging locations. Transportation research part F: traffic psychology and behaviour, 40, pp.119-129.
Philipsen, R., Schmidt, T. and Ziefle, M., 2015. A Charging Place to Be-Users’ Evaluation Criteria for the Positioning of Fast-charging Infrastructure for Electro Mobility. Procedia Manufacturing, 3, pp.2792-2799.
Plötz, P., Schneider, U., Globisch, J. and Dütschke, E., 2014. Who will buy electric vehicles? Identifying early adopters in Germany. Transportation Research Part A: Policy and Practice, 67, pp.96-109.
Page 54 of 55
PWC, 2018. Charging ahead! The need to upscale UK electric vehicle charging infrastructure. Available at: https://www.pwc.co.uk/power-utilities/assets/electric-vehicle-charging-infrastructure.pdf. Accessed on: 24/05/2020.
REVWG, 2018. Building awareness, accelerating adoption and coordinating the development of charging infrastructure throughout the Greater Wellington Region - Coordination Update 03. Accessed on: 24/05/2020.
Rogers, E.M., 2003. Diffusion of innovations, 5th Edition. Simon and Schuster.
Sadeghianpourhamami, N., Refa, N., Strobbe, M. and Develder, C., 2018. Quantitive analysis of electric vehicle flexibility: A data-driven approach. International Journal of Electrical Power & Energy Systems, 95, pp.451-462.
SEPA, 2019. Residential Electric Vehicle Rates That Work: attributes that increase enrolment. Available at: https://sepapower.org/resource/residential-electric-vehicle-time-varying-rates-that-work-attributes-that-increase-enrollment/. Accessed on: 21/03/2021.
Skippon, S. and Garwood, M., 2011. Responses to battery electric vehicles: UK consumer attitudes and attributions of symbolic meaning following direct experience to reduce psychological distance. Transportation Research Part D: Transport and Environment, 16(7), pp.525-531.
Southgate, D., 2019. Australia’s emerging issue of congestion at electric vehicle charging stations. The Driven. Available at: https://thedriven.io/2019/10/26/congestion-pax-how-to-behave-at-electric-vehicle-charging-stations/. Accessed on: 24/05/2020.
Sovacool, B.K., Kester, J., Noel, L. and de Rubens, G.Z., 2018. The demographics of decarbonizing transport: The influence of gender, education, occupation, age, and household size on electric mobility preferences in the Nordic region. Global Environmental Change, 52, pp.86-100.
Statistics Norway, 2020. Nesten 1 av 10 personbiler er en elbil. Available at: https://www.ssb.no/transport-og-reiseliv/artikler-og-publikasjoner/nesten-1-av-10-personbiler-er-en-elbil. Accessed on: 24/05/2020.
Sun, L., Huang, Y., Liu, S., Chen, Y., Yao, L. and Kashyap, A., 2017. A completive survey study on the feasibility and adaptation of EVs in Beijing, China. Applied Energy, 187, pp.128-139.
Sun, X.H., Yamamoto, T. and Morikawa, T., 2016. Fast-charging station choice behavior among battery electric vehicle users. Transportation Research Part D: Transport and Environment, 46, pp.26-39.
Sunnerstedt, E., Xylia, M. and Sjögren, A., 2019. The City of Stockholm experiences with charging infrastructure for EVs. In 32nd Electric Vehicle Symposium (EVS32) Lyon, France, May 19 - 22, 2019.
Tal, G., Chakraborty, D., Jenn, A. and Lee, J.H., 2020. Factors Affecting Demand for Plug-in Charging Infrastructure: An Analysis of Plug-in Electric Vehicle Commuters. Institute of Transportation Studies UC Davis. DOI:10.7922/G2ST7N3K. Available at: https://escholarship.org/uc/item/1jh8127j. Accessed on: 20/06/2020.
Tal, G., Nicholas, M.A., Davies, J. and Woodjack, J., 2014. Charging behavior impacts on electric vehicle miles traveled: who is not plugging in?. Transportation Research Record, 2454(1), pp.53-60.
The Australia Institute, 2017. If you build, they will charge. Available at: https://www.tai.org.au/sites/default/files/P233%20If%20you%20build%20it%20they%20will%20charge%20FINAL%20-%20October%202017.pdf. Accessed on: 29/05/2020.
TRL, 2019. Consumer Charging Trials Report: Mainstream consumers' attitudes and behaviours under Managed Charging Schemes for BEVs and PHEVs. Available at: https://trl.co.uk/publications/cvei---d5-3-consumer-charging-trials-report. Accessed on: 24/05/2020.
Union of Concerned Scientists, 2019. Electric Vehicle Survey Findings and Methodology. Available at: https://www.ucsusa.org/sites/default/files/attach/2019/07/2019-EV-Survey.pdf. Accessed on: 29/05/2020.
VicRoads, 2021. ZLEV Road-user charge. Available at: https://www.vicroads.vic.gov.au/registration/registration-fees/zlev-road-user-charge. Accessed on: 21/04/2021.
Large-Scale Network and System Integration of Electric Vehicles: A Techno-Economic Perspective Electric Vehicle Uptake and Charging Page 55 of 55
Wen, Y., MacKenzie, D. and Keith, D.R., 2016. Modeling the charging choices of battery electric vehicle drivers by using stated preference data. Transportation Research Record, 2572(1), pp.47-55.
Whitehead, J., Washington, S.P. and Franklin, J.P., 2019. The impact of different incentive policies on hybrid electric vehicle demand and price: An international comparison. World Electric Vehicle Journal, 10(2), p.20.
Wolbertus, R., Kroesen, M., van den Hoed, R. and Chorus, C.G., 2018. Policy effects on charging behaviour of electric vehicle owners and on purchase intentions of prospective owners: Natural and stated choice experiments. Transportation Research Part D: Transport and Environment, 62, pp.283-297.
Wolbertus, R. and van den Hoed, R., 2017, October. Charging station hogging: A data-driven analysis. In in Proceedings of the Electric Vehicle Symposium (Vol. 30).
Wolbertus, R. and Van den Hoed, R., 2019. Electric vehicle fast charging needs in cities and along corridors. World Electric Vehicle Journal, 10(2), p.45.
Wolff, S. and Madlener, R., 2019, May. Charged Up? Preferences For Electric Vehicle Charging And Implications For Charging Infrastructure Planning. In Local Energy, Global Markets, 42nd IAEE International Conference, May 29-June 1, 2019. International Association for Energy Economics.
Wu, X., 2018. Role of workplace charging opportunities on adoption of plug-in electric vehicles–Analysis based on GPS-based longitudinal travel data. Energy Policy, 114, pp.367-379.