Embed Size (px)
Citation preview
Electoral Systems and Corruption∗
Julie K. Faller†, Adam N. Glynn‡, and Nahomi Ichino§
August 21, 2013
Abstract
What is the effect of electoral systems on corruption? Persson, Tabellini and Trebbi (2003)proposed that plurality electoral systems should lead to lower corruption compared to propor-tional representation (PR) systems because the former creates a direct link between voters andpoliticians whom voters can hold accountable for corruption. The empirical question remainsunresolved, however, in part due to the endogeneity of the electoral institutions and difficultiesin measuring corruption. Using nonparametric methods and new data to reduce sensitivity tothese problems, we find no evidence for this hypothesis. Instead, we find some evidence in theopposite direction, that PR leads to less corruption.
∗Prepared for the 2013 Annual Meeting of the American Political Science Association, Chicago, 29 August – 1September 2013. Earlier versions were presented at the Annual Meetings of the Midwest Political Science Association,Chicago, 11–14 April 2013, and the 3rd Annual General Conference of the European Political Science Association,20–22 June 2013.†Ph.D. Candidate, Department of Government, Harvard University. E-mail: [email protected]‡Associate Professor, Department of Government, Harvard University. E-mail: [email protected]§Associate Professor, Department of Government, Harvard University. E-mail: [email protected]
1
1 Introduction
What is the effect of electoral systems on corruption? A Petition to Restore Power to the People
currently circulating in the Republic of South Africa calls for electoral system reform to create a
closer connection between voters and their elected representatives in order to help prevent “public
servants [... from] us[ing] their position to enrich themselves and their families” (Agang South
Africa 2013). This follows a 2009 report from the Independent Panel of Assessment of Parliament
to the National Assembly, which argued that South Africa’s party list system makes Members of
Parliament more accountable to party leaders than to the electorate (Independent Panel Assessment
of Parliament 2009). Adding a “constituency-based element into the electoral system” to connect
representatives more closely to voters is now part of the platform of the opposition party Democratic
Alliance (Democratic Alliance 2013).
Corruption – defined as the misuse of public office for private gain (Treisman 2000) – is a serious
and urgent problem in South Africa and around the world (Transparency International 2012). It
has been linked to greater income inequality (Gupta, Davoodi and Alonso-Terme 2002), and at the
micro level, with lower levels of socially-productive innovation (Murphy, Shleifer and Vishny 1993),
inefficient investment by firms (Choi and Thum 2004, Svensson 2003), and lower human capital
(Reinikka and Svensson 2005).1 Corruption is also associated with less trust in and satisfaction with
the political system (Anderson and Tverdova 2003, Chang and Chu 2006, Morris and Klesner 2010,
Pharr 2000, Seligson 2002) and lower voter turnout (De La O, Chong, Karlan and Wantchekon 2012,
Davis, Camp and Coleman 2004, Kostadinova 2009, McCann and Domınguez 1998). Although
reformers cannot easily change the cultural and religious traditions and historical-institutional
legacies associated with corruption (Serra 2006, Treisman 2000, Treisman 2007), changes to the
electoral system might dislodge this political-economic equilibrium of low public engagement and
high corruption.
The logic behind this call for electoral reform in South Africa echoes the dominant view in the
literature, that citizens want to vote out corrupt politicians and that political institutions that
empower citizens to do so will lead to lower corruption. Persson, Tabellini and Trebbi (2003)
contends that plurality systems should lead to lower corruption than proportional representation
(PR) systems, because the former creates a direct link between voters and politicians whom voters
can hold accountable for corruption. In the same framework, Kunicova and Rose-Ackerman (2005)
argues that while the rank-and-file politicians have more opportunities for corruption in plurality
systems, party leaders have those opportunities in PR systems. Because voters are less able to
monitor and sanction party leaders in a PR system, corruption will be greater in PR systems.
While both works present supporting statistical analyses, Treisman (2007) casts some doubt on
their robustness, while still noting that the evidence is stronger for the comparison between plurality
1Although the influence of corruption on economic growth at the country level has not been well-established, thismay be due to poor measurement of corruption (Mauro 1995, Graf Lambsdorff 2005, Svensson 2005).
2
and closed list PR systems than for other institutions considered in the literature on corruption.
There is currently little consensus on how these institutions that structure political competition
affect the extent of politicians’ misuse of public office for private gain.
This question remains unresolved due to several difficulties. First, it is extremely difficult to
measure corruption (Apaza 2009, Arndt and Oman 2006, Langbein and Knack 2008, Treisman
2007, Thomas 2010). Several indices of perceptions of corruption are available, but they measure
slightly different concepts, and scholars have been rightly cautious about results from regression
models that use these measures. Second, the endogeneity of a country’s electoral system to its
politics is generally not sufficiently addressed. Although cross-sectional analyses of corruption
generally include control variables for colonial heritage and other factors that likely affect the
choice of electoral systems (Treisman 2007), the calculations of strategic actors highlighted in the
theoretical and case-specific literature on electoral system choice are varied and difficult to capture.
Consequently, the estimated causal effects may be biased, and it is difficult to characterize the
direction of this bias. Moreover, overlooking the treatment assignment process and the point in
time at which an electoral system was adopted means that some control variables are measured pre-
treatment for some units and post-treatment for other units. The estimated average effect in these
cross-sectional studies is then a weighted average of different types of treatment effects. Persson
et al. (2003) uses panel data and fixed effects to address some of these problems in a secondary
analysis, but Treisman (2007) questions the reliability of the corruption measure that was available
to Persson et al. (2003) at the time of its writing.
We address these difficulties in several ways. First, as in a fixed effects analysis, we focus
on within-country changes from one electoral system to another. This clarifies the point in time
at which a treatment is applied and hence when the confounding variables should be measured.
Requiring that we have information on the pre-transition electoral system also effectively limits the
analysis to countries that did not simultaneously transition to democracy and change various other
political institutions. Due to data availability, this leaves us with 9 countries that adopted closed
list PR systems between 1998 and 2009, and to accommodate this small number of observations,
we adopt a Fisherian randomization inference framework for the statistical analysis. Second, to
ameliorate confounding issues, we construct a synthetic control unit to match to each of our treated
units using pre-treatment values of corruption (Abadie, Diamond and Hainmueller 2010). A country
that changes its electoral system is only compared to a weighted average of countries that have the
same pre-transition electoral system and is in the same region of the world and hence share similar
cultural and historical backgrounds. Third, to address some of the concerns with measurement
of the outcome variable, we use the nonparametric signed rank statistic to test for statistical
significance as explained in Glynn and Ichino (2013). The data issues and methods are described
in greater detail in the following sections.
3
We find no support for the hypothesis that PR leads to more corruption. In fact, we find
some evidence suggesting that PR might lead to less corruption, although this evidence is not
statistically significant at traditional levels. We also conduct two robustness checks. First, we
improve the matches with a differences-in-differences approach and obtain similar results. Second,
we introduce a dose-weighted version of the signed rank statistic (Rosenbaum 2002, 2009) in order
to account for the heterogeneity in the pre-transition electoral systems and the number of years a
country has been under the new electoral system. Our results are only further strengthened with
these methods. Despite using several different approaches, we were unable to replicate the findings
of Persson et al. (2003).
There are a number of important caveats to this result. First, these results are limited in
scope to the countries for which we observed the adoption of closed list PR. It is possible that the
Persson et al. (2003) hypothesis will hold for countries out of this sample. Second, not enough time
may have passed for effects to accrue in these nine countries. Third, our analyses use measures of
corruption based upon expert surveys. We have used a nonparametric approach so as to be less
sensitive to measurement problems, and the results are stable across a couple of different measures.
But a different measure of corruption that relies less on perceptions may still reverse these findings.
Finally, it is possible that the synthetic control and difference-in-differences approaches have
not eliminated all bias due to unmeasured confounding. This especially true if the measures of
corruption we use are poor. It would be relatively straightforward to run a Rosenbaum (2002)
style sensitivity analysis on these results that would raise the reported p-values. However, such a
sensitivity analysis would only weaken our confidence that PR might be reducing corruption for
these countries, it would not strengthen the evidence for the Persson et al. (2003) hypothesis.
Despite these caveats, these results suggest that further work must be conducted before the
Persson et al. (2003) hypothesis should be accepted or used for policy advice. Either new measures
of corruption need to be developed or extant theories should be re-examined for what and under
what conditions voters hold politicians accountable for corruption. New theory more appropriate
for conditions in new democracies can contribute to the scholarship on corruption.
In the following section, we discuss the existing theoretical perspectives on how electoral systems
affect corruption, and in Section 3 discuss three broad difficulties with current empirical analyses of
this question. We describe a methodological approach to address these issues in Section 4, before
presenting our results in Section 5.
2 Electoral Rules, Accountability, and Corruption
Electoral rules for legislative bodies define how votes are converted into a set of legislators following
an election. These rules may be very complex, but the most basic distinction is between PR systems
and plurality systems. Legislative seats are allocated to political parties on the basis of the total
votes won by each party in PR systems. In an open list PR system, voters may express preferences
4
over particular candidates within a party, while in a closed list PR system, party leaders determine
the order in which individual politicians are ranked on the party list. Once the total number of
seats awarded to a party is determined, that number of politicians from the top of the list are
elected. By contrast, in plurality or majoritarian systems, the candidate or party with the greatest
number of votes wins all the seats in a district. These districts will often only have one seat, and in
some cases, the candidate or party must also meet a majoritarian vote threshold such as 50%. As
we describe in more detail in Section 5.2, a mixed system uses both of these systems for elections
to the same legislative body. While we focus on this broad distinction between plurality and PR
systems, electoral systems can also vary in the number of total seats in the legislature, number
of districts, and district magnitudes, as well as the exact formula for allocating seats within these
broad categories.
Persson et al. (2003) proposes that electoral systems affect corruption by changing the incentives
for politicians to engage in corruption and the tools by which voters can sanction politicians for
doing so. Since party leaders determine the placement of politicians on party lists, political parties
intervene in the chain of delegation from voters to politicians in PR systems. Voters therefore
have greater difficulty holding particular politicians accountable for corruption in PR systems.2
Furthermore, because the number of seats won by a party in PR systems depends upon the total
number of votes won by the party’s candidates, neither the negative electoral consequences of
engaging in corruption nor the electoral rewards from refraining from corruption are internalized
by an individual politician as fully as they would be in plurality systems. Consequently, they expect
PR to lead to more corruption than do plurality systems, and mixed systems to lead to a middle
level of corruption less than with a PR system but more than with a plurality system.
With a similar logic, Kunicova and Rose-Ackerman (2005) argues that corruption should be
worse under closed list than open list PR systems, since political rents are primarily extracted by
party leaders rather than by rank-and-file politicians, and voters are less able to hold these party
leaders accountable in the former than in the latter. Gingerich (2009) also associates closed list PR
systems with more corruption than open list PR systems, but for a different reason. The key point
in this work is that party leaders in closed list PR systems can entice bureaucrats to engage in
corruption by promising rewards of positions within the party, a power party leaders lack in open
list PR systems.
However, Golden and Chang (2001) and Chang (2005) note that open list PR and plurality
systems could lead to more, not less, corruption than closed list PR, since the former allow voters
to favor or disfavor individual politicians. This gives incentives for politicians to “cultivate the
personal vote” (Carey and Shugart 1995) and pressures to turn to corruption to finance these
activities, with greater pressure where politicians face greater competition such as in high district
magnitude systems (Mainwaring 1991, Reed 1994). This contrasts sharply with Myerson (1993)
2In a similar vein, Tavits (2007) argues that institutions that contribute to “clarity of responsibility” reducecorruption by enabling voters to know whom to hold accountable.
5
and Persson et al. (2003) which argue that systems that reduce barriers to entry and offer more
alternative options to voters, like PR systems which usually have higher district magnitude than
plurality systems, create more competitive pressures on incumbents to refrain from corruption.
In statistical analyses of cross-national data, Persson et al. (2003), Kunicova and Rose-Ackerman
(2005), and Tavits (2007) have found that plurality systems with personal ballots have the lowest
levels of corruption, whereas open list PR systems have more corruption than plurality systems, and
closed list PR systems have the highest levels of corruption. However, the electoral system is not
among the factors that Serra (2006) finds to be consistently associated with corruption. Similarly,
Treisman (2007) notes that this effect of electoral system on corruption appears fragile. These
results were not robust to the inclusion of control variables or the use of data from different years
than the original analyses (232). In the next section, we describe several general difficulties with
assessing the effect of electoral systems on corruption in cross-national analyses before discussing
our approach to ameliorating these issues.
3 Challenges for Empirical Analysis
There are three major issues for empirical analysis on this question. The first is an imprecise
definition of treatment effects due to the fact that electoral systems are adopted at different points
in time. The second is unmeasured confounding due to non-random treatment assignment. The
third is the difficulty in measuring corruption. Each may contribute to the inconsistency and
fragility of empirical assessments of the causal effects of electoral systems on corruption.
3.1 Timing of treatment and post-treatment bias
Most empirical studies of the effects of electoral systems on corruption, including the main analysis
in Persson et al. (2003), are cross-sectional analyses with a recent measure of perceived corruption
as the outcome (Y ), an indicator of some aspect of the electoral system as the treatment (T ), and
a set of control variables such as degree of democracy, economic development and freedom of the
press (X), that previous studies suggest also affect the outcome. One problem with this setup
is that the countries in the analysis adopted their electoral systems at different points in time.
Some are well-established democracies that have maintained the same type of electoral systems for
many years (Group 1), like the United States, while others are countries that have recently made
a transition to democracy or adopted significant electoral reforms (Group 2), such as the former
Soviet republics. By analyzing these two groups together, these studies estimate an average of the
long-run effects for Group 1 countries and short-run effects for Group 2 countries.
Moreover, if control variables X are measured at the same point in time for all countries, they
are likely measured before the adoption of the electoral system (treatment) for Group 2, but after
adoption for Group 1 (Figure 1). Many of these covariates are likely affected by the electoral system
6
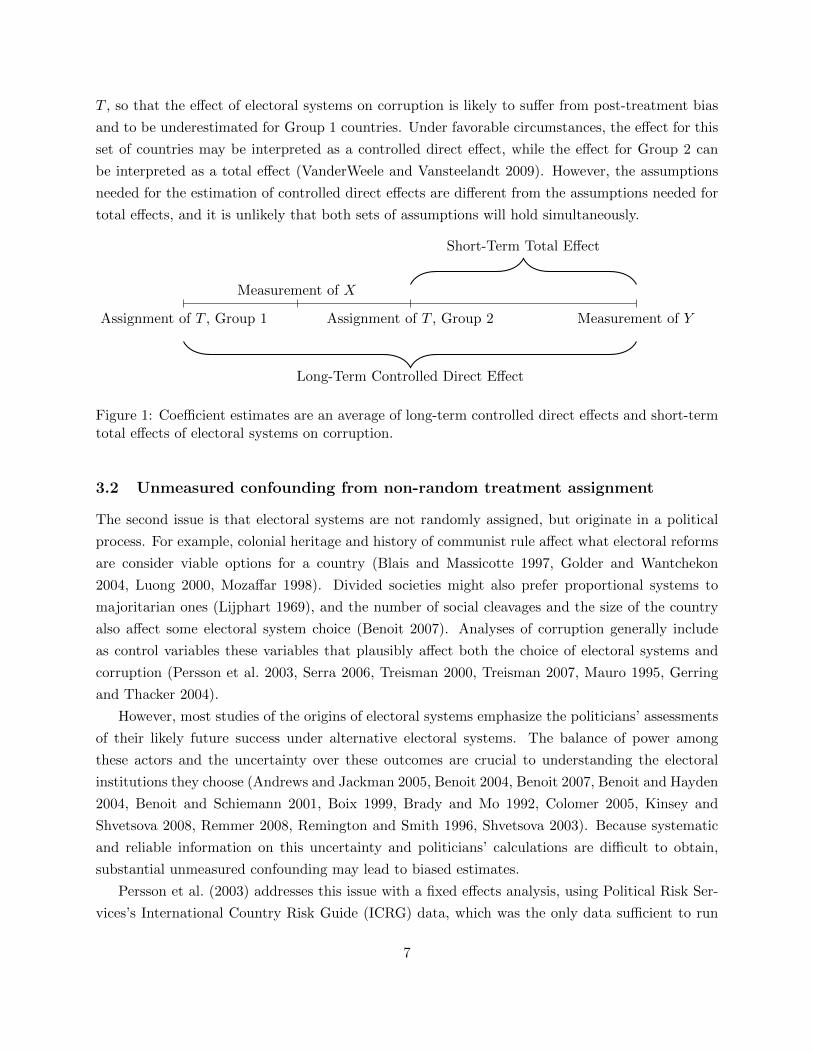
T , so that the effect of electoral systems on corruption is likely to suffer from post-treatment bias
and to be underestimated for Group 1 countries. Under favorable circumstances, the effect for this
set of countries may be interpreted as a controlled direct effect, while the effect for Group 2 can
be interpreted as a total effect (VanderWeele and Vansteelandt 2009). However, the assumptions
needed for the estimation of controlled direct effects are different from the assumptions needed for
total effects, and it is unlikely that both sets of assumptions will hold simultaneously.
Assignment of T , Group 1
Long-Term Controlled Direct Effect
Measurement of X
Assignment of T , Group 2
Short-Term Total Effect
Measurement of Y
Figure 1: Coefficient estimates are an average of long-term controlled direct effects and short-termtotal effects of electoral systems on corruption.
3.2 Unmeasured confounding from non-random treatment assignment
The second issue is that electoral systems are not randomly assigned, but originate in a political
process. For example, colonial heritage and history of communist rule affect what electoral reforms
are consider viable options for a country (Blais and Massicotte 1997, Golder and Wantchekon
2004, Luong 2000, Mozaffar 1998). Divided societies might also prefer proportional systems to
majoritarian ones (Lijphart 1969), and the number of social cleavages and the size of the country
also affect some electoral system choice (Benoit 2007). Analyses of corruption generally include
as control variables these variables that plausibly affect both the choice of electoral systems and
corruption (Persson et al. 2003, Serra 2006, Treisman 2000, Treisman 2007, Mauro 1995, Gerring
and Thacker 2004).
However, most studies of the origins of electoral systems emphasize the politicians’ assessments
of their likely future success under alternative electoral systems. The balance of power among
these actors and the uncertainty over these outcomes are crucial to understanding the electoral
institutions they choose (Andrews and Jackman 2005, Benoit 2004, Benoit 2007, Benoit and Hayden
2004, Benoit and Schiemann 2001, Boix 1999, Brady and Mo 1992, Colomer 2005, Kinsey and
Shvetsova 2008, Remmer 2008, Remington and Smith 1996, Shvetsova 2003). Because systematic
and reliable information on this uncertainty and politicians’ calculations are difficult to obtain,
substantial unmeasured confounding may lead to biased estimates.
Persson et al. (2003) addresses this issue with a fixed effects analysis, using Political Risk Ser-
vices’s International Country Risk Guide (ICRG) data, which was the only data sufficient to run
7
a fixed effects analysis at the time of its writing. But Treisman (2007, 221) highlights sudden,
unexplained changes in the ICRG scores for particular countries and inconsistencies in the scor-
ing across countries, and it appears to be less reliable than the alternative measures. Imai and
Kim (2013) has also recently shown that country-year fixed-effects estimators rely on questionable
implicit comparisons.
3.3 Measurement of corruption
As noted in the previous section, the enduring challenge to the empirical study of corruption is its
definition and measurement. While most scholars agree that corruption is “the misuse of public
office for private gain,” they disagree on what constitutes misuse and how to measure it (Della Porta
and Vannucci 2012, Philp 1997). Those engaged in illicit activities also have incentives to hide
corruption, compounding the difficulty of measuring corruption.
Most cross-national empirical studies have used two indices of corruption: Transparency In-
ternational’s Corruption Perception Index (CPI) and the World Bank’s Worldwide Governance
Indicator for “control of corruption” (Treisman 2007).3 Both indices aggregate information from
several sources, including expert surveys and business group risk reports. Scholars have registered
various concerns with these indicators: they measure perceptions of corruption, not corruption
itself; treat expert opinions as independent although experts may rely on the same sources; en-
courage cross-country comparisons although the relationship between experienced corruption and
reported corruption could be heterogenous across countries; and have changed their methodologies
thus making inter-temporal comparisons difficult (Apaza 2009, Arndt and Oman 2006, Langbein
and Knack 2008, Treisman 2007, Thomas 2010).
More objective indicators may be available for specific countries. For example, Gagliarducci,
Nannicini and Natichhioni (2011), Golden and Chang (2001), and Golden and Picci (2005) have
used legislator absenteeism, formal complaints against legislators, and an index measuring the gap
between funds disbursed for infrastructure and infrastructural quality to measure corruption in
Italy. But such measures may indicate different things in different contexts and are difficult to
obtain, so they are not well-suited for cross-national comparative studies.
4 Definitions, Methods, and Data
We take several steps to address these challenges in our analysis of the effect of electoral systems
on corruption. We use the World Bank’s Control of Corruption (CCE) index like most cross-
national empirical studies of corruption. However, we use nonparametric methods and rank-based
statistics that are less sensitive to measurement errors in the outcome variable, which we describe
in greater detail in Section 5. We also define treatment to be applied when a country changes
3The latter variable is sometimes referred to as “GRAFT.”
8
its electoral system, similar in spirit to Persson et al. (2003)’s secondary fixed effects analysis,
although more transparent in the implicit comparisons used. This allows us to use synthetic control
methods (Abadie, Diamond and Hainmueller 2011) and later a differences-in-differences approach
to ameliorate confounding and estimate short-run total effects for the treated countries. We discuss
the data and construction of the synthetic controls below.
First, we simplify our analysis by following Persson et al. (2003) and classifying electoral systems
as (a) proportional representation (PR), which may be open list or closed list; (b) plurality or
majoritarian (plurality, henceforth); or (c) mixed. We define treatment as being applied when
there is a change from one of the latter systems to closed list PR, and investigate the effect of this
new electoral system on corruption for nominally democratic countries that adopted closed list PR.4
We exclude from our analysis changes in electoral rules that were simultaneous with transitions
to democracy. This is in keeping with the cross-national literature that excludes non-democracies
and allows us to separate the change in electoral system from other changes to political institutions
that might affect corruption. We date the treatment to the adoption of these rules rather than
when a new legislature is elected and seated under the new rules, because we expect forward-
looking politicians to decide whether to engage in or refrain from corruption by considering their
consequences for their prospects for election under the new rules.
We use three variables from the World Bank’s Database of Political Institutions compiled as
part of the Quality of Governance (QoG) time-series dataset (Teorell, Samanni, Holmberg and
Rothstein 2011, 6 April 2011 version). The first is a dummy variable for plurality, which takes the
value of 1 if plurality is used as the electoral rule to select any candidate in any chamber of the
national legislature or if there is competition for the seats in a one-party state, and 0 otherwise. The
second is a dummy variable for PR, which takes the value of 1 if proportional representation is the
electoral rule to select any candidate in any chamber of the national legislature, and 0 otherwise.
The third is a dummy variable for closed list, which is defined only when the PR variable is 1. We
define a country as having a plurality system in a given year when plurality is coded 1 and PR is
coded 0 and as having a PR system in a given year when plurality is coded 0 and PR is coded 1.
When both variables take the value 1, we consider the country to have a mixed system.
Second, we initially examine the difference between plurality and closed list PR, the comparison
for which Persson et al. (2003) expects the largest effect, and then supplement the analysis by
looking at the difference in corruption between mixed systems and closed list PR. Because of data
constraints described below, we investigate changes in electoral systems between the years 1998
and 2009. A country must have information on both the pre-transition and new electoral systems
to be included in the analysis. This effectively excludes countries that transition to democracy and
adopt a variety of new political institutions along with a new electoral system. In this time period,
Kazakhstan, Kyrgyzstan, Mongolia, and Togo changed from plurality to closed list PR systems. We
4The choice of the direction of this change (moving to closed list PR) was dictated by data availability.
9
also find transitions in Algeria, El Salvador, Macedonia, Niger, and Ukraine from mixed systems
to closed list PR systems.5
Third, having defined treatment and identified the treated countries, we must find appropriate
control countries because electoral systems were not randomly assigned. We use the Synth package
v. 1.1-3 (Abadie, Diamond and Hainmueller 2011) in R v.2.15.3 (R Core Team 2013) to construct
a synthetic control unit that is as similar as possible to each of the treated units on pre-treatment
values of the outcome variable (corruption) for the three years preceding the electoral system
change.6 Under assumptions that are generally weaker than the assumptions required for linear
regression or fixed effects, this approach ameliorates some of the problems due to non-random
treatment assignment (Abadie, Diamond and Hainmueller 2010).
This synthetic control is a weighted average of control units drawn from a donor pool of countries
in the same region as the treated country that had and maintained the treated country’s pre-reform
electoral system. This restriction to the same region helps account for factors such as shared colonial
heritage, culture, and diffusion of policies that affect both electoral system choice and corruption.
For our study, the potential donor countries for Kazakhstan, Kyrgyzstan, Mongolia, and Togo are
those countries in the same region as the treated country that had plurality systems from 1996
through 2011. The potential donor countries for Algeria, El Salvador, Macedonia, and Ukraine
are those countries in the same region as the treated country that maintained mixed closed list
systems from 1996 to 2011. Niger used open list in its PR tier before the change in electoral
system, but very few African countries used and maintained this system. We prioritize matching
on pre-treatment values of the outcome variable, and therefore allow the donor pool for Niger to be
composed of countries which maintained any mixed system from 1996 to 2011. Niger is consequently
matched to a country with a mixed system with closed list in its PR tier. We use data from Teorell
and Hadenius (2005), also in the QoG dataset, to define region. We use the alternative region
coding (ht region2) which considers Mongolia’s post-Communist legacy and groups it with Eastern
Europe. The countries used as controls and the weights put on them are presented in Appendix A.
As noted above, our primary measure of corruption is the World Bank Worldwide Governance
Indicator for Control of Corruption (CCE) (Kaufman, Kraay and Mastruzzi 2013), also included in
the QoG time series dataset. This indicator measures perceptions of the extent of use of public office
for private gain, including petty corruption, grand corruption, and state “capture.” It aggregates 30
data sources, comprising expert assessments from governmental, commercial and non-governmental
organizations and surveys of citizens (Kaufman, Kraay and Mastruzzi 2010). The variable CCE
ranges from -2.5 to 2.5 with higher values indicating less perceived corruption. It was measured
biennially from 1996 until 2002, after which it has been measured annually. The QoG dataset only
5We exclude Russia, which changed from a mixed to a closed list PR system, because we are unable to achievesufficient balance to create a synthetic control. The removal of Russia implicitly restricts the population of interestto those countries for which we have sufficient information to address the hypothesis of interest.
6Kyrgyzstan is an exception. Because it transitioned to a plurality electoral system two years before transitioningto closed list PR, we include only two years preceding its transition in the construction of its synthetic control.
10
includes CCE through 2009, so we supplement this dataset with 2010 and 2011 measures from the
World Bank’s Worldwide Governance Indicators series.7 Because we need the outcome variable
measured both before and after treatment, we only examine countries that adopted closed list PR
between 1998 and 2009. Appendix A presents a summary of balance on pre-treatment values of
the outcome variable.
We prefer this CCE measure to Transparency International’s Corruption Perceptions Index
(CPI), which similarly takes business group and country expert surveys and creates a 0-10 score
with higher scores indicating less corruption (Transparency International 2010). While CPI and
CCE use similar data sources, CPI differs from CCE in that scores are standardized based on
each country’s percentile rank within the larger sample of countries. CPI is a relative score by
construction and was not designed to be compared across years since the scores depend on the
sample of countries. CCE also covers more countries for more years than CPI.8
In order to assess the effects of the treatment, we take the difference in CCE scores between the
treated and control countries, averaged over time. Because the donor pool is relatively small for
each treated country, we cannot use the inferential approach presented in Abadie, Diamond and
Hainmueller (2010). Instead we treat each country that adopted closed list PR and its synthetic
control as exchangeable– i.e., we treat the synthetic control as if it were a country and assume that
treatment was as-if randomly assigned between the treated country and its synthetic control.
This allows us to conduct Fisherian randomization inference (Rosenbaum 2002, Ch. 2) and
calculate p-values without assuming a parametric model or assuming that these countries were
sampled from some larger population. Specifically, if the synthetic controls are sufficiently compa-
rable to the treated units, then the exchangeability assumption holds, which allows us to evaluate
the sharp null hypothesis of no effect of electoral system for any country with pairwise random-
ization inference. Sufficiently comparable in this case means that each synthetic control acts as
if it were matched to each treated unit in a pairwise randomized experiment. This is a strong
assumption, but it is generally weaker than the assumptions required for linear regression or fixed
effects which are used in current cross-national analyses of corruption.
Following this initial analysis, we conduct a series of robustness tests. First, we note that
some of the synthetic controls are not sufficiently comparable their associated treated units, so we
augment this approach with a difference-in-difference adjustment. If there is a difference between
the treated country and the synthetic control in the average pre-treatment outcome values, we adjust
the synthetic control in order to remove this discrepancy. As we report below, this adjustment only
strengthens the result. Second, we note that the transition from plurality to closed list PR may be
considered a larger “dose” of treatment than the transition from a mixed system to closed list PR,
7The World Bank corrected errors in its 2011 estimates for CCE in February 2013 (Kraay 2013). We use thecorrected version.
8Neither measure was available for enough years for Persson et al. (2003) to use in its fixed effects analysis at thetime of writing.
11
so that we expect a larger effect with the former than with the latter change. In order to account
for this, we put greater weight on pairs with larger “doses” in the statistic (Rosenbaum 2002, 2009).
This adjustment again only strengthens the result. We describe these methods in more detail as
we report findings from our analysis below.
5 Analysis
With this synthetic control analysis, we find no support for Persson et al. (2003)’s hypothesis that
the move to closed list PR from plurality increases corruption. In fact, the analysis suggests that
either there is no effect, or even the opposite – that this change leads to lower corruption.
5.1 Plurality Systems to Closed List PR
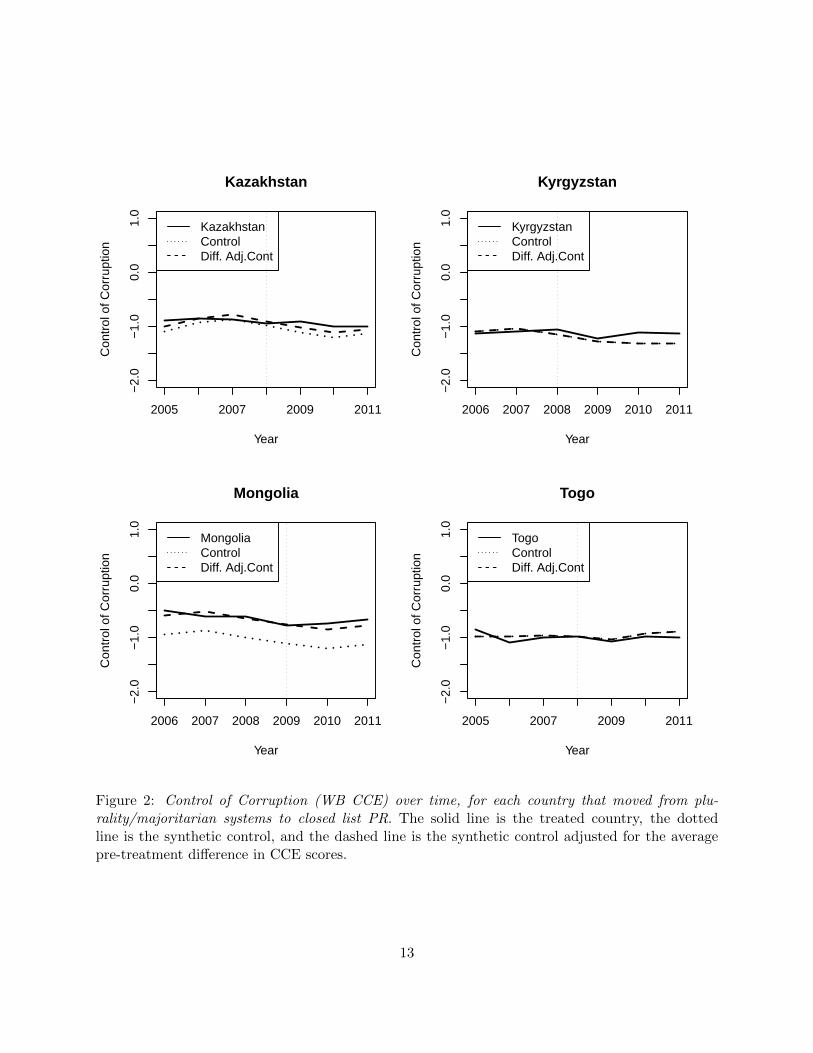
Figure 2 presents the results of this analysis for the four countries that changed from plurality
systems to closed list PR systems. For each country the vertical line marks the change in the
electoral system and the dark solid line is the country’s score on the World Bank’s control of
corruption (CCE) measure, with higher values indicating less corruption. The dotted line is the
CCE score of the synthetic control for each country. The dashed line, to be discussed in detail below,
is CCE for the diff-in-diff adjusted synthetic control, vertically adjusting for the average difference
between the treated unit and the synthetic control for the three years before the treatment. For
Kyrgyzstan and Togo, there is no difference between the dotted line and the dashed line. This
indicates good fit for the synthetic control for these countries.
The estimated effect using the Synth package for each treated country is the average vertical
distance between the solid and the dotted lines after treatment. These average differences are
reported in Table 1 along with the number of years of data that make up these averages.
Synth Estimate Post-Treatment Years
1 Kazakhstan 0.17 32 Kyrgyzstan 0.14 33 Mongolia 0.47 24 Togo -0.07 3
Table 1: Synth estimates for countries that move from plurality/majoritarian systems to closed listPR
If the move to closed list PR from plurality were to increase corruption as Persson et al. (2003) ex-
pects, then we would expect the estimates in Table 1 to be positive, and the dark solid lines in
Figure 2 to be below the dashed line after the point of treatment. Only Togo, a small former
French colony in West Africa, fits this pattern, and Togo also shows the smallest difference with
its synthetic control of these four countries. The other three countries – Kazakhstan, Kyrgyzstan,
12
2005 2007 2009 2011
−2.
0−
1.0
0.0
1.0
Kazakhstan
Year
Con
trol
of C
orru
ptio
n
KazakhstanControlDiff. Adj.Cont
2006 2007 2008 2009 2010 2011
−2.
0−
1.0
0.0
1.0
Kyrgyzstan
Year
Con
trol
of C
orru
ptio
n
KyrgyzstanControlDiff. Adj.Cont
2006 2007 2008 2009 2010 2011
−2.
0−
1.0
0.0
1.0
Mongolia
Year
Con
trol
of C
orru
ptio
n
MongoliaControlDiff. Adj.Cont
2005 2007 2009 2011
−2.
0−
1.0
0.0
1.0
Togo
Year
Con
trol
of C
orru
ptio
n
TogoControlDiff. Adj.Cont
Figure 2: Control of Corruption (WB CCE) over time, for each country that moved from plu-rality/majoritarian systems to closed list PR. The solid line is the treated country, the dottedline is the synthetic control, and the dashed line is the synthetic control adjusted for the averagepre-treatment difference in CCE scores.
13
and Mongolia – indicate positive effects of plurality on CCE, although these effects are also small.
Even when the synthetic controls are difference-adjusted for Kazakhstan and Mongolia so as to
better match the pre-treatment values of these countries, the estimated effects are still contrary to
the Persson et al. (2003) hypothesis (Table 2).9 The results in Figure 2 and in Tables 1 and 2 are
fairly strong evidence against the Persson et al. (2003) hypothesis for these countries.10
Country Diff-in-Diff Estimate Post-Treatment Years
1 Kazakhstan 0.09 32 Kyrgyzstan 0.14 33 Mongolia 0.12 24 Togo -0.07 3
Table 2: Diff-in-Diff Synth estimates for countries that move from plurality/majoritarian systemsto closed list PR
5.2 Mixed Systems to Closed List PR
We conduct the same synthetic control analysis for the five countries that changed from mixed
electoral systems to closed list PR systems in this period. Mixed systems (or mixed member
systems) are those in which both plurality/majoritarian and PR rules are used for election to the
national legislature, or where there is more than one chamber, for elections to the lower chamber
(Massicotte and Blais 1999).11 While Persson et al. (2003) highlights the proportion of seats that
are elected by one formula or the other, scholarship on political outcomes in mixed systems has
tended to focus on whether and how the seats in the different tiers are linked. It considers whether
the different rules apply in geographically distinct areas so a voter votes either in a PR system
or in a plurality system, or whether legislators elected in different systems represent the same
geographical area (Moser and Scheiner 2012). Because our primary purpose is to compare PR and
plurality systems, we treat mixed systems as falling in between these two “pure” systems.
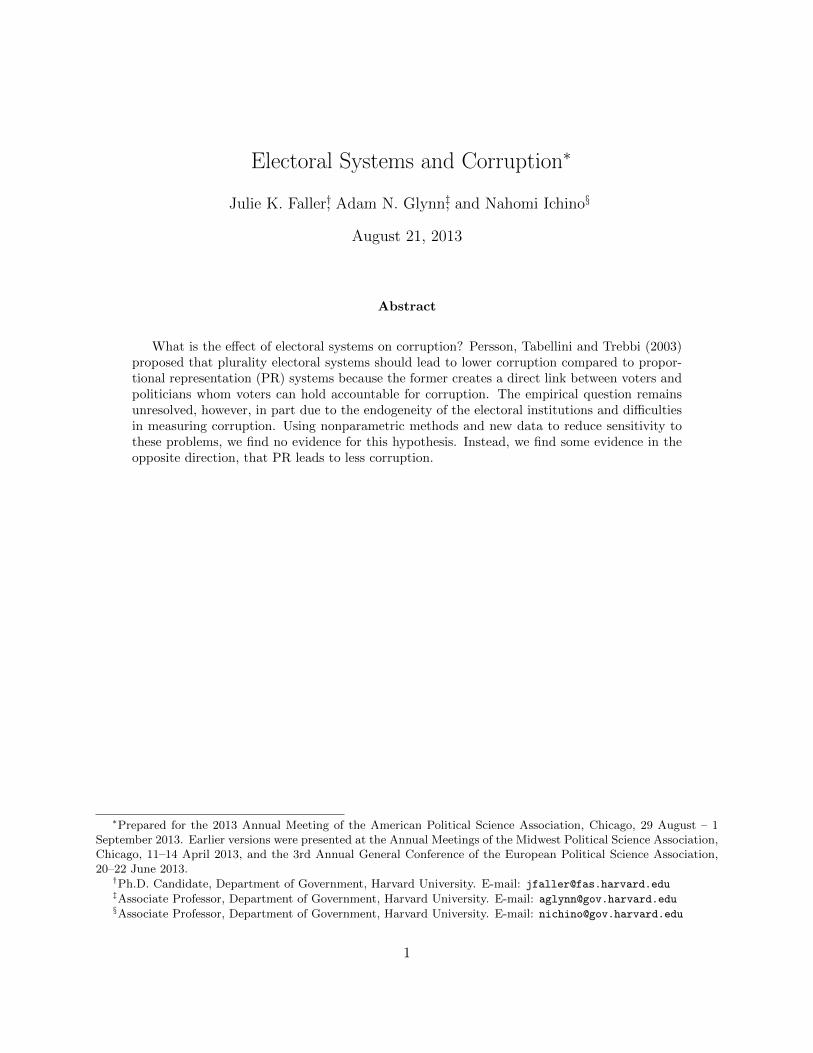
If we restrict the analysis to this set of countries, there appears to be mild, but insignificant,
support for the Persson et al. (2003) argument (Figure 3 and Table 3). Algeria, Niger, and Ukraine
have lower CCE than their synthetic controls after adopting closed list PR, and Ukraine has the
largest difference in average CCE scores for any pair.12 The other two countries that moved from a
9Mongolia moved to closed list PR from a block vote (multiple non-transferable vote) system, which is an extremelydisproportional form of plurality system. Under the previous system, fairly small changes in vote share led to largechanges in the composition of the legislature (Schafferer 2005), which Persson et al. (2003) note as a conditionthat should strongly incentivize politicians to refrain from corruption. It may be that the block vote created acollective action problem for incumbent legislators that weakened this incentive, but we do not find any support forthe hypothesis that PR increases corruption.
10We find similar results using Transparency International’s Corruption Perception Index (CPI) instead of CCE.11See Nishikawa and Herron (2004) for a review of other definitions.12Unlike the other treated countries which started out using closed list for its PR seats within a mixed electoral
system, Niger moved from a mixed system using open list for its PR seats to “pure” PR using closed lists. Open
14
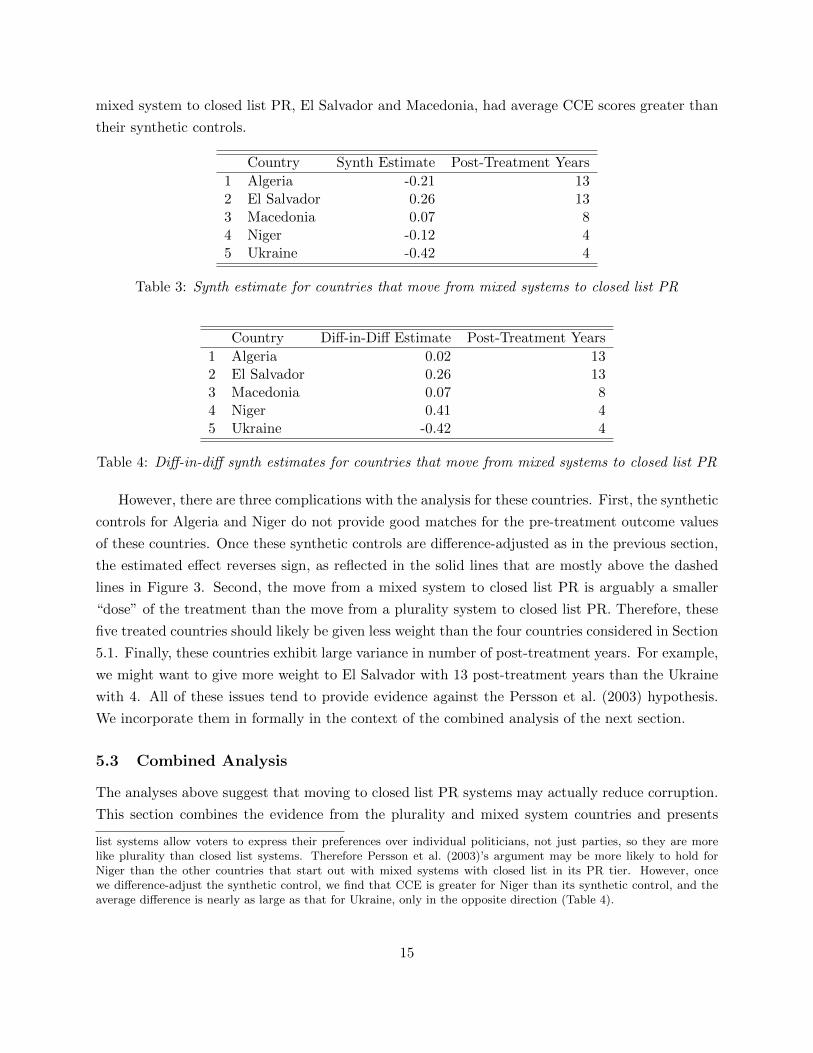
mixed system to closed list PR, El Salvador and Macedonia, had average CCE scores greater than
their synthetic controls.
Country Synth Estimate Post-Treatment Years
1 Algeria -0.21 132 El Salvador 0.26 133 Macedonia 0.07 84 Niger -0.12 45 Ukraine -0.42 4
Table 3: Synth estimate for countries that move from mixed systems to closed list PR
Country Diff-in-Diff Estimate Post-Treatment Years
1 Algeria 0.02 132 El Salvador 0.26 133 Macedonia 0.07 84 Niger 0.41 45 Ukraine -0.42 4
Table 4: Diff-in-diff synth estimates for countries that move from mixed systems to closed list PR
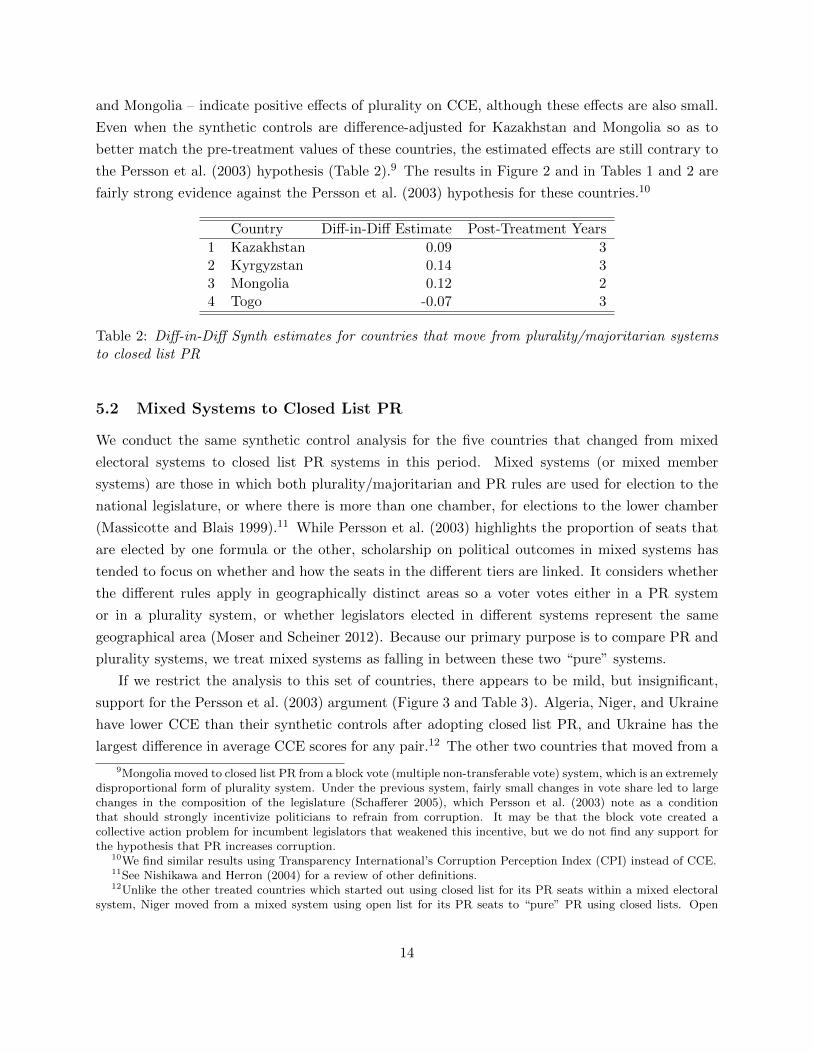
However, there are three complications with the analysis for these countries. First, the synthetic
controls for Algeria and Niger do not provide good matches for the pre-treatment outcome values
of these countries. Once these synthetic controls are difference-adjusted as in the previous section,
the estimated effect reverses sign, as reflected in the solid lines that are mostly above the dashed
lines in Figure 3. Second, the move from a mixed system to closed list PR is arguably a smaller
“dose” of the treatment than the move from a plurality system to closed list PR. Therefore, these
five treated countries should likely be given less weight than the four countries considered in Section
5.1. Finally, these countries exhibit large variance in number of post-treatment years. For example,
we might want to give more weight to El Salvador with 13 post-treatment years than the Ukraine
with 4. All of these issues tend to provide evidence against the Persson et al. (2003) hypothesis.
We incorporate them in formally in the context of the combined analysis of the next section.
5.3 Combined Analysis
The analyses above suggest that moving to closed list PR systems may actually reduce corruption.
This section combines the evidence from the plurality and mixed system countries and presents
list systems allow voters to express their preferences over individual politicians, not just parties, so they are morelike plurality than closed list systems. Therefore Persson et al. (2003)’s argument may be more likely to hold forNiger than the other countries that start out with mixed systems with closed list in its PR tier. However, oncewe difference-adjust the synthetic control, we find that CCE is greater for Niger than its synthetic control, and theaverage difference is nearly as large as that for Ukraine, only in the opposite direction (Table 4).
15
2000 2005 2010
−2.
0−
1.0
0.0
1.0
Algeria
Year
Con
trol
of C
orru
ptio
n
AlgeriaControlDiff. Adj.Cont
2000 2005 2010
−2.
0−
1.0
0.0
1.0
El Salvador
Year
Con
trol
of C
orru
ptio
n
El SalvadorControlDiff. Adj.Cont
2000 2002 2004 2006 2008 2010
−2.
0−
1.0
0.0
1.0
Macedonia
Year
Con
trol
of C
orru
ptio
n
MacedoniaControlDiff. Adj.Cont
2004 2005 2006 2007 2008 2009 2010 2011
−2.
0−
1.0
0.0
1.0
Niger
Year
Con
trol
of C
orru
ptio
nNigerControlDiff. Adj.Cont
2004 2005 2006 2007 2008 2009 2010 2011
−2.
0−
1.0
0.0
1.0
Ukraine
Year
Con
trol
of C
orru
ptio
n
UkraineControlDiff. Adj.Cont
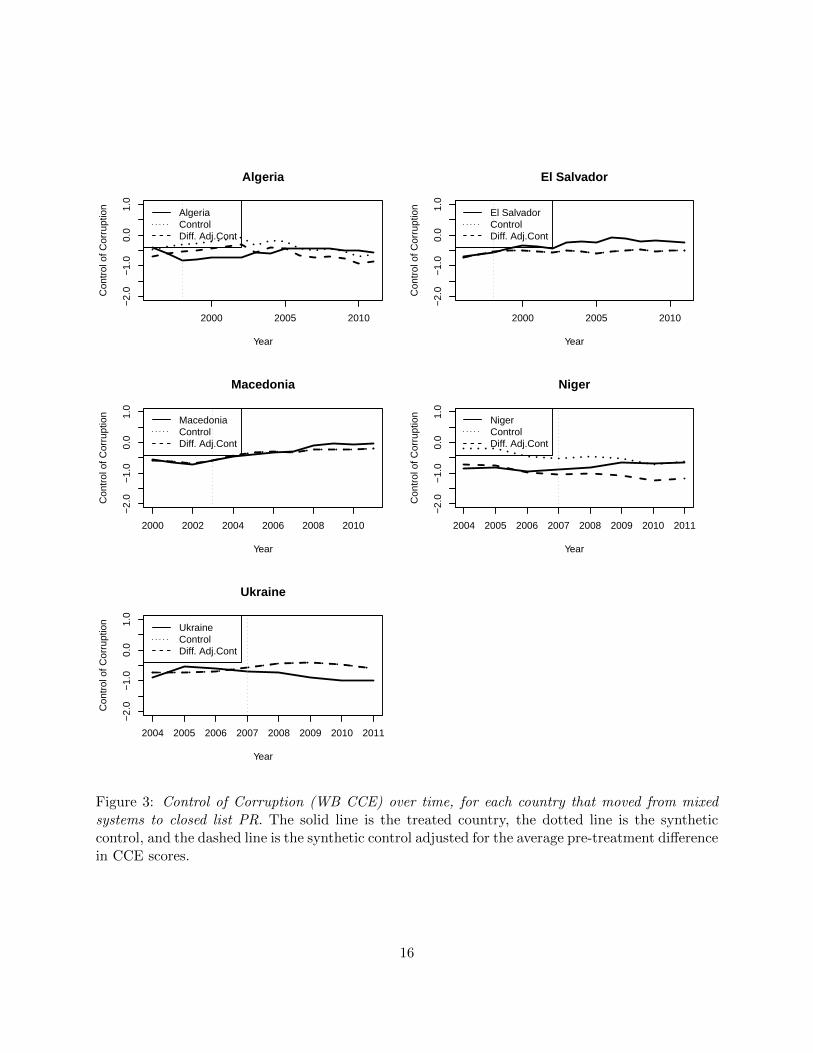
Figure 3: Control of Corruption (WB CCE) over time, for each country that moved from mixedsystems to closed list PR. The solid line is the treated country, the dotted line is the syntheticcontrol, and the dashed line is the synthetic control adjusted for the average pre-treatment differencein CCE scores.
16
nonparametric tests based on weighted and unweighted signed rank statistics in order to assess the
strength of this evidence. Although we prefer this approach to standard fixed effects models, we
note that all of the substantive points here are robust to the use of standard fixed effects models.
We start with the analysis that is most sympathetic to the Persson et al. (2003) hypothesis.
Note that the combined mean of the Synth estimates in Tables 1 and 3 is 0.03 and the median
is 0.07, hence the overall evidence points away from the Persson et al. (2003) hypothesis. In
order to consider the strength of this evidence with such small sample sizes and without resorting
to parametric assumptions, we use the exchangeability assumption discussed earlier to conduct a
nonparametric signed rank test. The Wilcoxon signed rank statistic assigns the ranks 1 (smallest)
through 9 (largest) to each of the 9 pairs according to the size of absolute difference in post-
treatment CCE scores (averaged over time) between the treated country and synthetic control
countries. The statistic then sums the ranks associated with the pairs where the post-treatment
CCE scores are larger for the treated country than for the synthetic control (averaged over time).
This statistic is described in detail in Rosenbaum (2002) and Glynn and Ichino (2013).
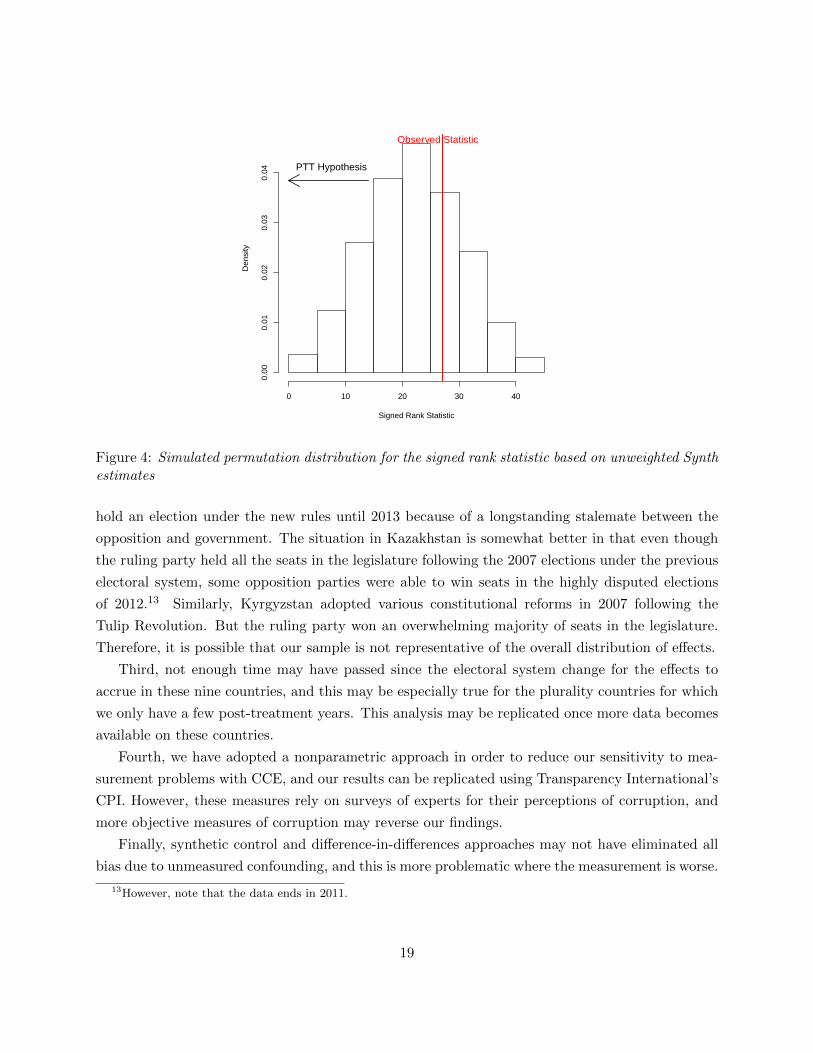
This process is presented in Table 5, and the signed rank statistic calculated from our data
is 27. If all of the ranks had been positive, it would have been 45. This statistic is difficult
to interpret, but we can generate a p-value under the sharp null hypothesis of “no effect,” by
provisionally assuming that electoral system is irrelevant for corruption and permuting treatment
status between the treated countries and their synthetic controls within pairs. Because we have
9 pairs, there are 29 = 512 different within-pair permutations of treatment status, of which our
observed data represents just one option. For each permutation, we can re-calculate the signed
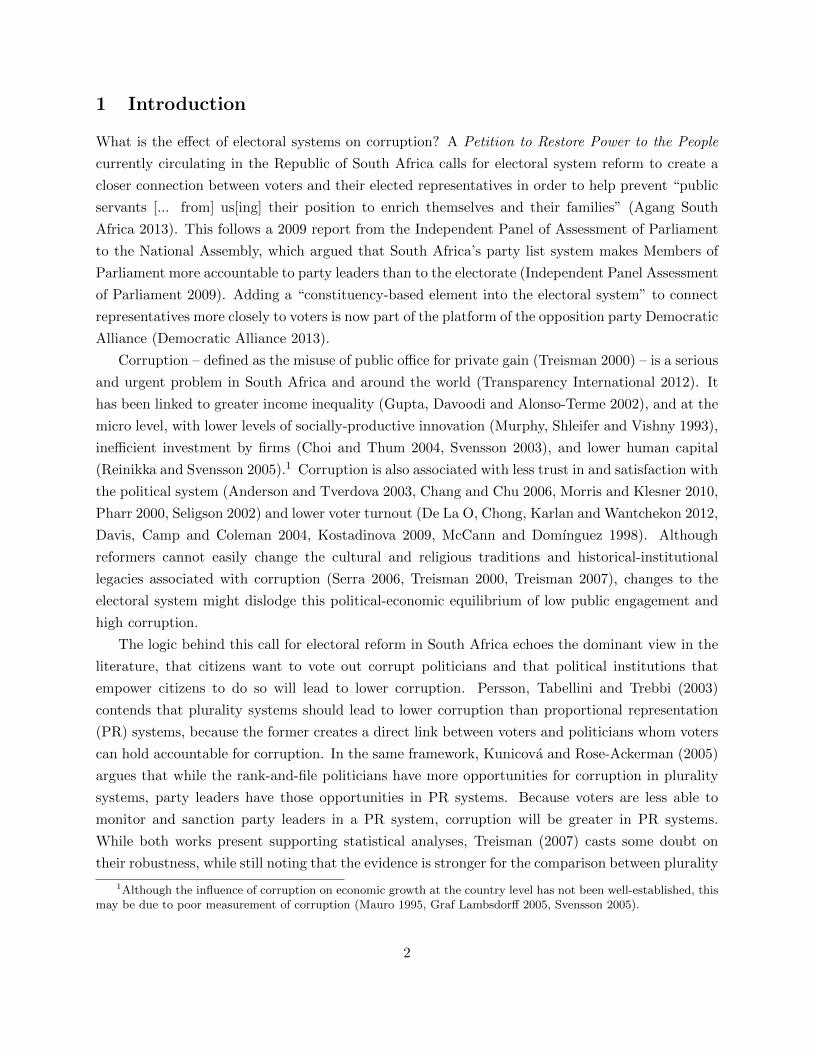
rank statistic giving us a permutation distribution of 512 statistics. Figure 4 presents the null
distribution based on the analyses in Tables 1 and 3. The p-value is then determined by calculating
the proportion of these 512 statistics that are more extreme than our observed statistic of 27. This
procedure is a nonparametric version of a paired t test and is explained in detail in Glynn and
Ichino (2013).
As noted above, the evidence is in the wrong direction for the Persson et al. (2003) hypothesis.
However, the two-sided p-value of 0.65 is too large to give any confidence that the result runs in the
opposite direction. This evidence becomes stronger when we use the difference-adjusted synthetic
controls with the estimates in Tables 2 and 4. The mean of these difference-adjusted synth estimates
is 0.07 and the median is 0.09. A nonparametric signed rank test produces a two-sided p-value of
0.20 – provisional evidence that closed list PR systems may reduce corruption.
The evidence against the Persson et al. (2003) hypothesis is strengthened further if we consider
that theory suggests larger effects for transitions from plurality to closed list PR systems than
from mixed to closed list PR systems. The outcomes from transitions from plurality systems might
therefore be weighted more heavily than the outcomes from transitions from mixed systems. If we
knew the appropriate doses (weights) to assign to these two types of transitions, then we could use
17
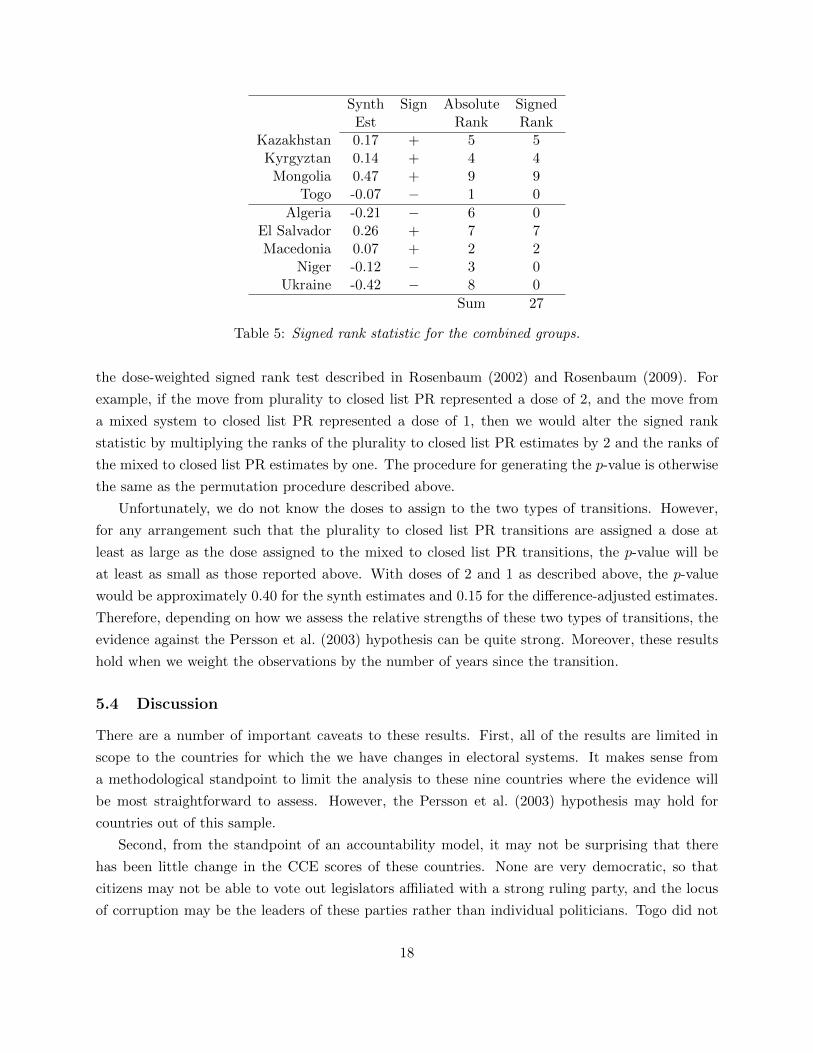
Synth Sign Absolute SignedEst Rank Rank
Kazakhstan 0.17 + 5 5Kyrgyztan 0.14 + 4 4
Mongolia 0.47 + 9 9Togo -0.07 − 1 0
Algeria -0.21 − 6 0El Salvador 0.26 + 7 7Macedonia 0.07 + 2 2
Niger -0.12 − 3 0Ukraine -0.42 − 8 0
Sum 27
Table 5: Signed rank statistic for the combined groups.
the dose-weighted signed rank test described in Rosenbaum (2002) and Rosenbaum (2009). For
example, if the move from plurality to closed list PR represented a dose of 2, and the move from
a mixed system to closed list PR represented a dose of 1, then we would alter the signed rank
statistic by multiplying the ranks of the plurality to closed list PR estimates by 2 and the ranks of
the mixed to closed list PR estimates by one. The procedure for generating the p-value is otherwise
the same as the permutation procedure described above.
Unfortunately, we do not know the doses to assign to the two types of transitions. However,
for any arrangement such that the plurality to closed list PR transitions are assigned a dose at
least as large as the dose assigned to the mixed to closed list PR transitions, the p-value will be
at least as small as those reported above. With doses of 2 and 1 as described above, the p-value
would be approximately 0.40 for the synth estimates and 0.15 for the difference-adjusted estimates.
Therefore, depending on how we assess the relative strengths of these two types of transitions, the
evidence against the Persson et al. (2003) hypothesis can be quite strong. Moreover, these results
hold when we weight the observations by the number of years since the transition.
5.4 Discussion
There are a number of important caveats to these results. First, all of the results are limited in
scope to the countries for which the we have changes in electoral systems. It makes sense from
a methodological standpoint to limit the analysis to these nine countries where the evidence will
be most straightforward to assess. However, the Persson et al. (2003) hypothesis may hold for
countries out of this sample.
Second, from the standpoint of an accountability model, it may not be surprising that there
has been little change in the CCE scores of these countries. None are very democratic, so that
citizens may not be able to vote out legislators affiliated with a strong ruling party, and the locus
of corruption may be the leaders of these parties rather than individual politicians. Togo did not
18
Signed Rank Statistic
Den
sity
0 10 20 30 40
0.00
0.01
0.02
0.03
0.04
Observed Statistic
PTT Hypothesis
Figure 4: Simulated permutation distribution for the signed rank statistic based on unweighted Synthestimates
hold an election under the new rules until 2013 because of a longstanding stalemate between the
opposition and government. The situation in Kazakhstan is somewhat better in that even though
the ruling party held all the seats in the legislature following the 2007 elections under the previous
electoral system, some opposition parties were able to win seats in the highly disputed elections
of 2012.13 Similarly, Kyrgyzstan adopted various constitutional reforms in 2007 following the
Tulip Revolution. But the ruling party won an overwhelming majority of seats in the legislature.
Therefore, it is possible that our sample is not representative of the overall distribution of effects.
Third, not enough time may have passed since the electoral system change for the effects to
accrue in these nine countries, and this may be especially true for the plurality countries for which
we only have a few post-treatment years. This analysis may be replicated once more data becomes
available on these countries.
Fourth, we have adopted a nonparametric approach in order to reduce our sensitivity to mea-
surement problems with CCE, and our results can be replicated using Transparency International’s
CPI. However, these measures rely on surveys of experts for their perceptions of corruption, and
more objective measures of corruption may reverse our findings.
Finally, synthetic control and difference-in-differences approaches may not have eliminated all
bias due to unmeasured confounding, and this is more problematic where the measurement is worse.
13However, note that the data ends in 2011.
19
It is relatively straightforward to conduct a Rosenbaum (2002) style sensitivity analysis on these
results which would raise the reported p-values. However, such a sensitivity analysis would only
weaken our confidence that PR might reduce corruption for these countries. It would not strengthen
the evidence for the Persson et al. (2003) hypothesis.
6 Conclusion
Following the pioneering work of Persson, Tabellini and Trebbi (2003), scholars have proposed
several theories linking electoral systems to levels of corruption. But how much empirical support
these arguments have found has been debated, due to the difficulty of measuring corruption, non-
random assignment of electoral systems, and the combination of different treatment effects.
This paper addressed each of these empirical challenges and found no support for the hypoth-
esis that PR systems cause corruption. Rather, within our sample, transitions to PR are weakly
associated with lower levels of corruption. First, we addressed the issue of timing by focusing on
individual country transitions from one system to another. Second, we more clearly defined the
treatment effect by comparing treated countries only to countries with the same electoral system
as the treated country had before its reform. Third, we address non-random treatment assignment
by using synthetic control and differences-in-differences approaches. Finally, we partially addressed
concerns about measurement of the outcome by using the nonparametric signed rank statistic as
described in Glynn and Ichino (2013).
The immediate implication is a call for a re-examination of the dominant view that plurality
systems cause lower levels of corruption and that PR cause higher levels, the theory implicit in
the South African petition for electoral reform. At a minimum, our analysis suggests that this is
unlikely to be the case in new democracies and poorer countries, and we find some evidence that
PR may even cause an increase in corruption. More generally, we should engage the literature on
clientelism to reconsider the conditions under which citizens hold elected leaders accountable for
corruption, as this could yield stronger theory for the effect of electoral systems on corruption.
20
References
Abadie, Alberto, Alexis Diamond and Jens Hainmueller. 2010. “Synthetic Control Methods forComparative Case Studies: Estimating the Effect of California’s Tobacco Control Program.”Journal of the American Statistical Association 105(490):493–505.
Abadie, Alberto, Alexis Diamond and Jens Hainmueller. 2011. “Synth: An R Package for SyntheticControl Methods in Comparative Case Studies.” Journal of Statistical Software 42(13):1–17.
Agang South Africa. 2013. “Agang’s Aims.”. http://www.agangsa.org.za/agangs-aims/. Ac-cessed 8 June 2013.
Anderson, Christopher J. and Yuliya V. Tverdova. 2003. “Corruption, Political Allegiances andAttitudes toward Government in Contemporary Democracies.” American Journal of PoliticalScience 47(1):91–109.
Andrews, Josephine T. and Robert W. Jackman. 2005. “Strategic fools: electoral rule choice underextreme uncertainty.” Electoral Studies 24(1):65–84.
Apaza, Carmen R. 2009. “Measuring Governance and Corruption through the Worldwide Gov-ernance Indicators: Critiques, Responses and Ongoing Scholarly Discussion.” PS: PoliticalScience & Politics 42(1):139–143.
Arndt, Christiane and Charles Oman. 2006. Uses and Abuses of Governance Indicators. OECDDevelopment Centre.
Benoit, Kenneth. 2004. “Models of electoral system change.” Electoral Studies 23(3):363–389.
Benoit, Kenneth. 2007. “Electoral Laws as Political Consequences: Explaining the Origins andChange of Electoral Institutions.” Annual Review of Political Science 10:363–390.
Benoit, Kenneth and Jacqueline Hayden. 2004. “Institutional Change and Persistence: The Evo-lution of Poland’s Electoral System, 1989–2001.” Journal of Politics 66(2):396–427.
Benoit, Kenneth and John W. Schiemann. 2001. “Institutional Choice in New Democracies.”Journal of Theoretical Politics 13(2):153–182.
Blais, Andre and Louis Massicotte. 1997. “Electoral formulas: A macroscopic perspective.” Euro-pean Journal of Political Research 32(1):107–129.
Boix, Carles. 1999. “Setting the Rules of the Game: The Choice of Electoral Systems in AdvancedDemocracies.” American Political Science Review 93(3):609–24.
Brady, David and Jongryn Mo. 1992. “Electoral Systems and Institutional Choice: A Case Studyof the 1988 Korean Elections.” Comparative Political Studies 24(4):405–429.
Carey, John M. and Matthew Soberg Shugart. 1995. “Incentives to Culivate a Person Vote: a RankOrdering of Electoral Formulas.” Electoral Studies 14(4):417–439.
Chang, Eric C.C. 2005. “Electoral Incentives for Political Corruption under Open-List ProportionalRepresentation.” Journal of Politics 67(3):716–30.
21
Chang, Eric C.C. and Yun-han Chu. 2006. “Corruption and Trust: Exceptionalism in AsianDemocracies.” Journal of Politics 68(2):259–71.
Choi, Jay Pil and Marcel Thum. 2004. “The Economics of Repeated Extortion.” The RANDJournal of Economics 35(2):203–223.
Colomer, Josep M. 2005. “It’s Parties That Choose Electoral Systems (or, Duverger’s Laws UpsideDown).” Political Studies 53(1):1–21.
Davis, Charles L., Roderic Ai Camp and Kenneth M. Coleman. 2004. “The Influence of PartySystems on Citizens’ Perceptions of Corruption and Electoral Response in Latin America.”Comparative Political Studies 37(6):677–703.
De La O, Ana L., Alberto Chong, Dean S. Karlan and Leonard Wantchekon. 2012. “LookingBeyond the Incumbent: the Effects of Exposing Corruption on Electoral Outcomes.” YaleUniversity, Centre for Economic Policy Research Discussion Paper Series No. 8790.
Della Porta, Donatella and Alberto Vannucci. 2012. The Hidden Order of Corruption: An Institu-tional Approach. Burlington, VT: Ashgate.
Democratic Alliance. 2013. “Governance Policy.”. http://www.da.org.za/our_policies.htm?
action=view-policy&policy=608. Accessed 8 June 2013.
Gagliarducci, Stefano, Tommaso Nannicini and Paolo Natichhioni. 2011. “Electoral Rules andPoliticians’ Behavior: A Micro Test.” American Economic Journal: Economic Policy 3(3):144–74.
Gerring, John and Strom C. Thacker. 2004. “Political Institutions and Corruption: The Role ofUnitarism and Parliamentarism.” British Journal of Political Science 34(2):295–330.
Gingerich, Daniel W. 2009. “Ballot Structure, Political Corruption and the Performance of Pro-portional Representation.” Journal of Theoretical Politics 21(4):509–541.
Glynn, Adam N. and Nahomi Ichino. 2013. “Using Qualitative Information to Improve CausalInference.” Working Paper, Harvard University.
Golden, Miriam A. and Eric C.C. Chang. 2001. “Competitive Corruption: Factional Conflict andPolitical Malfeasance in Postwar Italian Christian Democracy.” World Politics 53(4):588–622.
Golden, Miriam A. and Lucio Picci. 2005. “Proposal for a New Measure of Corruption, Illustratedwith Italian Data.” Economics & Politics 17(1):37–75.
Golder, Matt and Leonard Wantchekon. 2004. Africa: Dictatorial and Democratic Electoral Sys-tems since 1946. In Handbook of Electoral System Choice, ed. Josep M. Colomer. PalgraveMacmillan.
Graf Lambsdorff, Johann. 2005. “Consequences and causes of corruption: What do we know froma cross-section of countries?” University of Passau Discussion Paper V-34-05.
Gupta, Sanjeev, Hamid Davoodi and Rosa Alonso-Terme. 2002. “Does corruption affect incomeinequality and poverty?” Economics of Governance 3(1):23–45.
22
Imai, Kosuke and In Song Kim. 2013. “On the Use of Linear Fixed Effects Regression Models forCausal Inference.” Working Paper, Princeton University.
Independent Panel Assessment of Parliament. 2009. “Report of the Independent Panel As-sessment of Parliament.”. http://www.parliament.gov.za/content/The%20Panel%20for%
20Assessment%20of%20Parliament%20Report_Final4_mail~2.pdf. Accessed 8 June 2013.
Kaufman, Daniel, Aart Kraay and Massimo Mastruzzi. 2010. “The Worldwide Governance Indica-tors: Methodology and Analytical Issues.” The World Bank Policy Research Working Paper5430.
Kaufman, Daniel, Aart Kraay and Massimo Mastruzzi. 2013. “The Worldwide Governance Indica-tors, 2012 Update.” The World Bank http://info.worldbank.org/governance/wgi/.
Kinsey, Barbara Sgouraki and Olga Shvetsova. 2008. “Applying the Methodology of MechanismDesign to the Choice of Electoral Systems.” Journal of Theoretical Politics 20(3):303–327.
Kostadinova, Tatiana. 2009. “Abstain or Rebel: Corruption Perceptions and Voting in East Euro-pean Elections.” Politics & Policy 37(4):691–714.
Kraay, Aart. 2013. “Worldwide Governance Indicators: Data Revisions to Rule of Law and Controlof Corruption for 2011.” The World Bank http://info.worldbank.org/governance/wgi/
pdf/WGIRevisionExplanationFeb2013.pdf.
Kunicova, Jana and Susan Rose-Ackerman. 2005. “Electoral Rules and Constitutional Structuresas Constraints on Corruption.” British Journal of Political Science 35(4):573–606.
Langbein, Laura and Stephen Knack. 2008. “The Worldwide Governance Indicators and Tautology:Causally Related Separable Concepts, Indicators of a Common Cause, or Both.” The WorldBank: Policy Research Working Paper 4669.
Lijphart, Arend E. 1969. “Consociational Democracy.” World Politics 21(2):207–225.
Luong, Pauline Jones. 2000. “After the Break-up : Institutional Design in Transitional States.”Comparative Political Studies 33(5):563–592.
Mainwaring, Scott. 1991. “Politicians, Parties and Electoral Systems: Brazil in Comparative Per-spective.” Comparative Politics 24(1):21–43.
Massicotte, L. and A. Blais. 1999. “Mixed electoral systems: a conceptual and empirical survey.”Electoral Studies 18(3):341–66.
Mauro, Paolo. 1995. “Corruption and Growth.” Quarterly Journal of Economics 110(3):681–712.
McCann, James A. and Jorge I. Domınguez. 1998. “Mexicans React to Electoral Fraud and Po-litical Corruption: an Assessment of Public Opinion and Voting Behavior.” Electoral Studies17(4):483–503.
Morris, Stephen D. and Joseph L. Klesner. 2010. “Corruption and Trust: Theoretical Considera-tions and Evidence from Mexico.” Comparative Political Studies 43(10):1258–1285.
23
Moser, Robert G. and Ethan Scheiner. 2012. Electoral Systems and Political Context: How theEffects of Rules Vary Across New and Established Democracies. New York: Cambridge Uni-versity Press.
Mozaffar, Shaheen. 1998. Electoral Systems and Conflict Management in Africa: A Twenty-EightState Comparison. In Elections and Conflict Management in Africa, ed. Timothy D. Sisk andAndrew Reynolds. U.S. Institute of Peace Press.
Murphy, Kevin M., Andrei Shleifer and Robert W. Vishny. 1993. “Why Is Rent-Seeking So Costlyto Growth?” American Economic Review 83(2):409–14.
Myerson, Roger B. 1993. “Effectiveness of Electoral Systems for Reducing Government Corruption:A Game-Theoretic Analysis.” Games and Economic Behavior 5:118–132.
Nishikawa, Misa and Erik S. Herron. 2004. “Mixed electoral rules’ impact on party systems.”Electoral Studies 23(4):753–68.
Persson, Torsten, Guido Tabellini and Francesco Trebbi. 2003. “Electoral Rules and Corruption.”Journal of the European Economic Association 1(4):958–989.
Pharr, Susan J. 2000. Officials’ Misconduct and Public Distrust: Japan and the Trilateral Democ-racies. In Disaffected Democracies: What’s Troubling the Trilateral Countries, ed. Susan J.Pharr and Robert D. Putnam. 3rd ed. Transaction Publishers pp. 835–62.
Philp, Mark. 1997. “Defining Political Corruption.” Political Studies 45(3):436–462.
R Core Team. 2013. R: A Language and Environment for Statistical Computing. Vienna, Austria:R Foundation for Statistical Computing.URL: http://www.R-project.org
Reed, Steven R. 1994. “Democracy and the Personal Vote: A Cautionary Tale from Japan.”Electoral Studies 13(1):17–28.
Reinikka, Ritva and Jakob Svensson. 2005. “Fighting Corruption to Improve Schooling: Evidencefrom a Newspaper Campaign in Uganda.” Journal of the European Economic Association3(2/3):259–267.
Remington, Thomas F. and Steven S. Smith. 1996. “Political Goals, Institutional Context and theChoice of an Electoral System: The Russian Parliamentary Election Law.” American Journalof Political Science 40(4):1253–1279.
Remmer, Karen L. 2008. “The Politics of Institutional Change: Electoral Reform in Latin America,1978-2002.” Party Politics 14(1):5–30.
Rosenbaum, Paul R. 2002. “Covariance Adjustment in Randomized Experiments and ObservationalStudies.” Statistical Science 17:286–304.
Rosenbaum, Paul R. 2009. Design of Observational Studies. New York: Springer.
Schafferer, Christian. 2005. “The Great State Hural election in Mongolia, June 2004.” ElectoralStudies 24(4):741–84.
24
Seligson, Mitchell A. 2002. “The Impact of Corruption on Regime Legitimacy: A ComparativeStudy of Four Laitn American Countries.” Journal of Politics 64(2):408–33.
Serra, Danila. 2006. “Empirical determinants of corruption: A sensitivity analysis.” Public Choice126(1/2):225–256.
Shvetsova, Olga. 2003. “Endogenous Selection of Institutions and Their Exogenous Effects.” Con-stitutional Political Economy 14(3):191–212.
Svensson, Jakob. 2003. “Who Must Pay Bribes and How Much? Evidence from a Cross Section ofFirms.” Quarterly Journal of Economics 118(1):207–30.
Svensson, Jakob. 2005. “Eight Questions about Corruption.” Journal of Economic Perspectives19(3):19–42.
Tavits, Margit. 2007. “Clarity of Responsibility and Corruption.” American Journal of PoliticalScience 51(1):218–229.
Teorell, Jan and Axel Hadenius. 2005. “Determinants of Democratization: Taking Stock of theLarge-N Evidence.” Mimeo: Department of Government, Uppsala University.
Teorell, Jan, Marcus Samanni, Soren Holmberg and Bo Rothstein. 2011. “The QoG StandardDataset version 6Apr11.” University of Gothenburg: The Quality of Government Institute,http://www.qog.pol.gu.se.
Thomas, M.A. 2010. “What Do the Worldwide Governance Indicators Measure?” European Journalof Development Research 22(1):31–54.
Transparency International. 2010. “Corruption Perceptions Index 2010: Long MethodologicalBrief.” Available online http://files.transparency.org/content/download/412/1696/
CPI2010_long_methodology_En.pdf.
Transparency International. 2012. “Corruption Perceptions Index 2012.” Available online http:
//cpi.transparency.org/cpi2012/results/.
Treisman, Daniel. 2000. “The causes of corruption: a cross-national study.” Journal of PublicEconomics 76(3):399–457.
Treisman, Daniel. 2007. “What Have We Learned About the Causes of Corruption from Ten Yearsof Cross-National Empirical Research?” Annual Review of Political Science 10:211–244.
VanderWeele, Tyler and Stijn Vansteelandt. 2009. “Conceptual issues concerning mediation, inter-ventions and composition.” Statistics and its Interface 2:457–468.
25
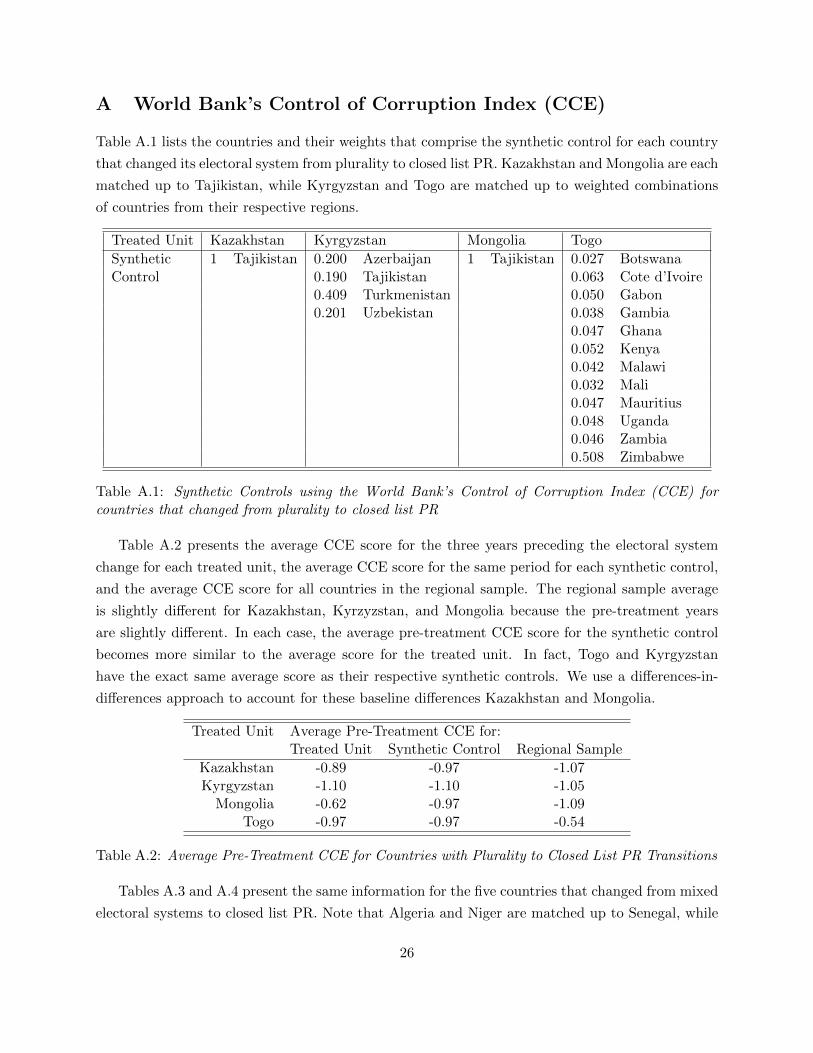
A World Bank’s Control of Corruption Index (CCE)
Table A.1 lists the countries and their weights that comprise the synthetic control for each country
that changed its electoral system from plurality to closed list PR. Kazakhstan and Mongolia are each
matched up to Tajikistan, while Kyrgyzstan and Togo are matched up to weighted combinations
of countries from their respective regions.
Treated Unit Kazakhstan Kyrgyzstan Mongolia Togo
Synthetic 1 Tajikistan 0.200 Azerbaijan 1 Tajikistan 0.027 BotswanaControl 0.190 Tajikistan 0.063 Cote d’Ivoire
0.409 Turkmenistan 0.050 Gabon0.201 Uzbekistan 0.038 Gambia
0.047 Ghana0.052 Kenya0.042 Malawi0.032 Mali0.047 Mauritius0.048 Uganda0.046 Zambia0.508 Zimbabwe
Table A.1: Synthetic Controls using the World Bank’s Control of Corruption Index (CCE) forcountries that changed from plurality to closed list PR
Table A.2 presents the average CCE score for the three years preceding the electoral system
change for each treated unit, the average CCE score for the same period for each synthetic control,
and the average CCE score for all countries in the regional sample. The regional sample average
is slightly different for Kazakhstan, Kyrzyzstan, and Mongolia because the pre-treatment years
are slightly different. In each case, the average pre-treatment CCE score for the synthetic control
becomes more similar to the average score for the treated unit. In fact, Togo and Kyrgyzstan
have the exact same average score as their respective synthetic controls. We use a differences-in-
differences approach to account for these baseline differences Kazakhstan and Mongolia.
Treated Unit Average Pre-Treatment CCE for:Treated Unit Synthetic Control Regional Sample
Kazakhstan -0.89 -0.97 -1.07Kyrgyzstan -1.10 -1.10 -1.05
Mongolia -0.62 -0.97 -1.09Togo -0.97 -0.97 -0.54
Table A.2: Average Pre-Treatment CCE for Countries with Plurality to Closed List PR Transitions
Tables A.3 and A.4 present the same information for the five countries that changed from mixed
electoral systems to closed list PR. Note that Algeria and Niger are matched up to Senegal, while
26
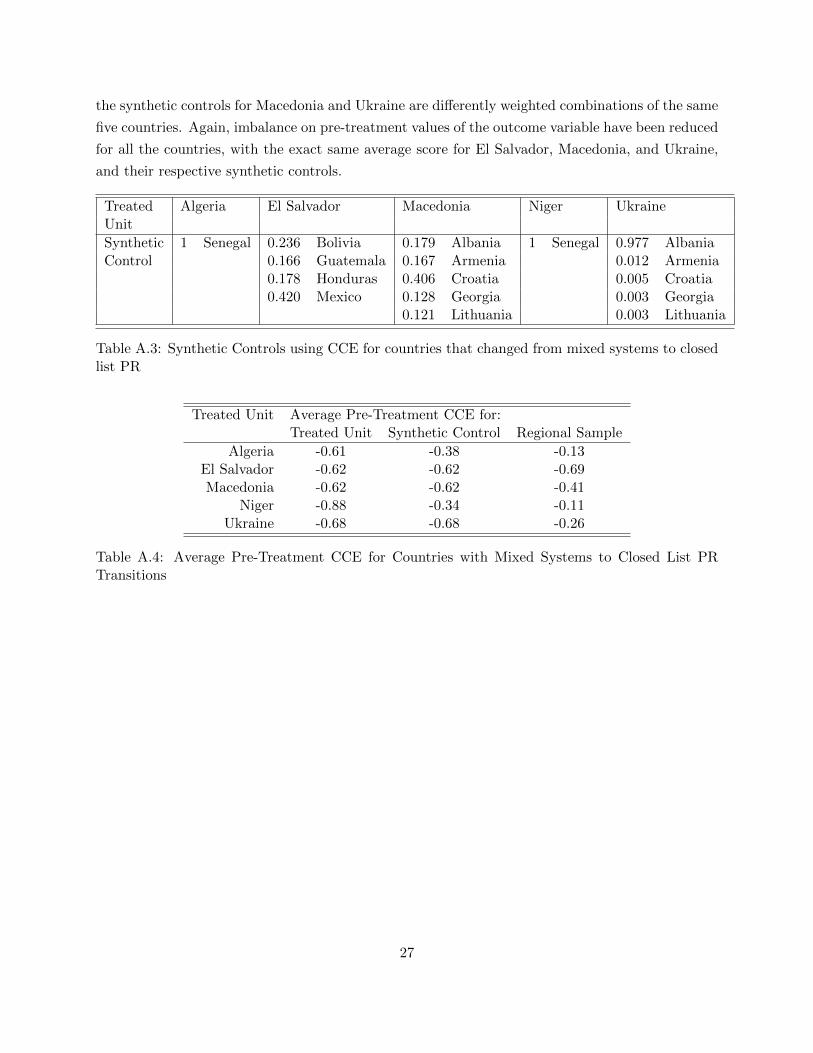
the synthetic controls for Macedonia and Ukraine are differently weighted combinations of the same
five countries. Again, imbalance on pre-treatment values of the outcome variable have been reduced
for all the countries, with the exact same average score for El Salvador, Macedonia, and Ukraine,
and their respective synthetic controls.
Treated Algeria El Salvador Macedonia Niger UkraineUnit
Synthetic 1 Senegal 0.236 Bolivia 0.179 Albania 1 Senegal 0.977 AlbaniaControl 0.166 Guatemala 0.167 Armenia 0.012 Armenia
0.178 Honduras 0.406 Croatia 0.005 Croatia0.420 Mexico 0.128 Georgia 0.003 Georgia
0.121 Lithuania 0.003 Lithuania
Table A.3: Synthetic Controls using CCE for countries that changed from mixed systems to closedlist PR
Treated Unit Average Pre-Treatment CCE for:Treated Unit Synthetic Control Regional Sample
Algeria -0.61 -0.38 -0.13El Salvador -0.62 -0.62 -0.69Macedonia -0.62 -0.62 -0.41
Niger -0.88 -0.34 -0.11Ukraine -0.68 -0.68 -0.26
Table A.4: Average Pre-Treatment CCE for Countries with Mixed Systems to Closed List PRTransitions
27