Embed Size (px)
Citation preview

HOW TO USE SPSS TO ANSWER BASIC
QUANTITATIVE RESEARCH QUESTIONS
SUMMER INSTITUTE, 2017
Steven A. Hecht1

Please sign in and print your name and email address so that I can email you these
notes! 2

TODAY WE WILL: • Discuss how to get SPSS – rent it!
• Go over some popular analyses based on following examples of research questions:
1. Was there significant improvement in reading scores between pretest and posttest?
2. Were there significant differences between groups in reading scores?
3. Were there significant differences between groups in Posttest reading scores while controlling for initial Pretested ability?
4. Did group, pretested ability, and estimate IQ all uniquely predict Posttest reading scores?
• Discuss YOUR OWN research questions.3

GET IBM SPSS
• You can rent SPSS.
• Different options depending on the
analysis you want to do and how long
you plan to use IBM SPSS
• http://www.onthehub.com/spss/
4

RESEARCH QUESTION #1: Were there significant differences between two independent groups in math scores?
5
Groups (IV)
(Control vs.
Treatment)
DVReading scores
• So, were the average reading scores different between Control Group and Treatment Group?
• You could use a t-test or Analysis of Variance. Lets use ANOVA

ANALYSIS OF VARIANCE
6
• Analyze -> general linear model -> univariate

ANALYSIS OF VARIANCE
7
• Analyze -> general linear model -> univariate
Here is your predictor
If this value is .05 or less then effect is statistically significant
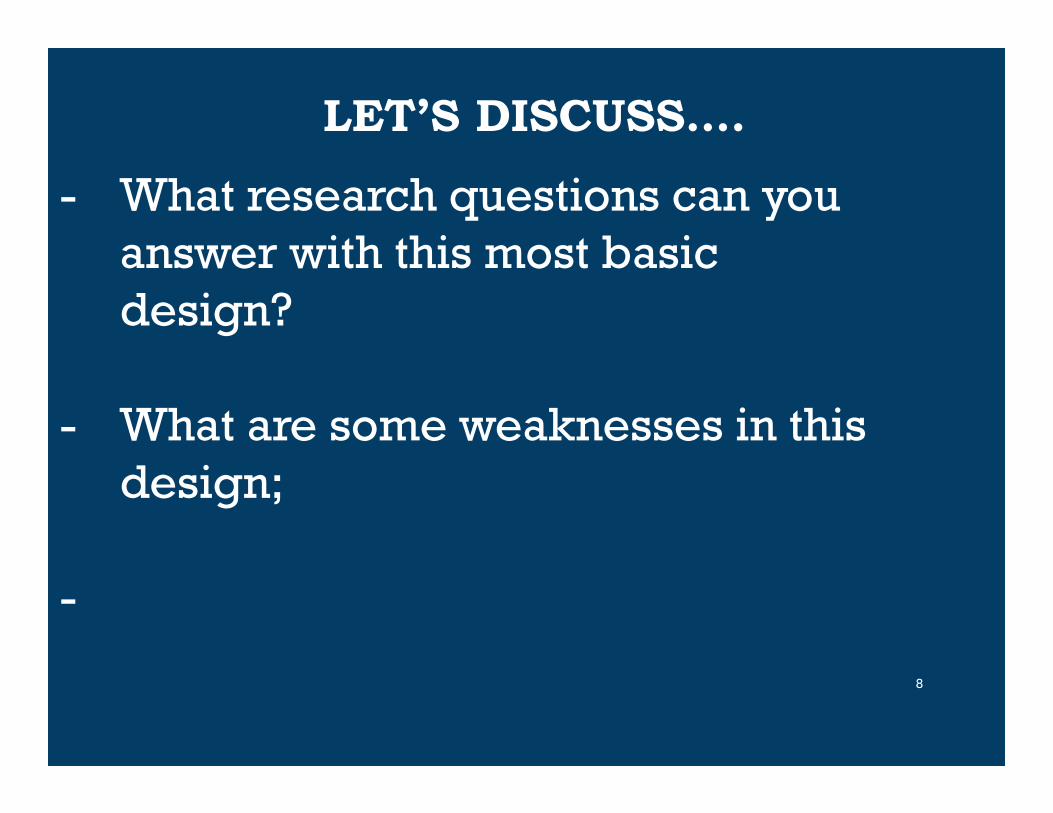
LET’S DISCUSS….
8
- What research questions can you answer with this most basic design?
- What are some weaknesses in this design;
-

RESEARCH QUESTION #2:
Was there significant improvement in reading scores for the same students between pretest and posttest?
9
PretestReading Scores
Posttest Reading Scores
• So, were the average reading scores different between
pretest and posttest?
• Use the paired sample t-test
Intervention or Treatment

PAIRED SAMPLE T-TEST
10
• Analyze -> compare means -> paired sample t-test

PAIRED SAMPLE T-TEST
11
• Analyze -> compare means -> paired sample t-test
SPSS Output file (.spv)

PAIRED SAMPLE T-TEST
12
• Analyze -> compare means -> paired sample t-test
SPSS Output
If the value is .05 or smaller, then the
difference is statistically significant!

LET’S DISCUSS….
13
- What research questions can you answer with this most basic design?
- What are some weaknesses in this design;
- how can we improve the design?- Ok, let’s use an improved
design!

RESEARCH QUESTION #3:
Were there significant differences between groups in posttest reading scores while controlling for initial pretested ability?
14
IVGroups (control versus
treatment)
DVPosttest Reading
• You could use Analysis of Variance with a covariate
CovariatePretest
Reading

ANALYSIS OF VARIANCE WITH A COVARIATE
15
• Analyze -> general linear model -> univariate

ANALYSIS OF VARIANCE WITH A COVARIATE
16
• Analyze -> general linear model -> univariate
Here is group
predictor
If this value is .05 or less then effect is statistically significant
covariate used to look at
change in reading

LET’S DISCUSS….
17
- What research questions can you answer with this most basic design?
- What are some weaknesses in this design;
- how can we improve the design even more!- Ok, let’s use an improved design!

RESEARCH QUESTION #4:
Did group uniquely predict posttest reading scores, after controlling for , pretested ability, and estimated IQ?
18
IVGroups
DVPosttest Reading
• You could use Analysis of Variance or REGRESSION
CovariatePretest
Reading
CovariateIQ

ANALYSIS OF COVARIANCE
19
Look, Group is no longer significant!!
Why did this happen? What can we do with
this result?

ANOTHER WAY TO ANALYZE THE DATA: REGRESSION
20
• Analyze -> Regression-> Linear

REGRESSION
21
• Analyze -> regression-> linear
Here is Group
predictor
Look! Group is no longer significant!
covariate used to look at
change in reading
covariate used to
control for IQ

REGRESSION IS USEFUL!!
• Especially useful when we wish to focus on several continuous predictors of an outcome
• So emphasis is no longer on comparing groups
22

WE COULD ANALYZE THIS!
23
Letter Knowledge Posttest
Reading
Pretest Reading
IQ
Motivation Vocabulary

LET’S DISCUSS….
24
- What research questions do you have?
- What kind of statistical analysis would be appropriate?

Please sign in and print your name and email address so that I can email you these
notes! 25

26