Embed Size (px)
Citation preview
June 21, 2011
Elecon Engineering Company Ltd.
…a step ahead in technology
SKP Securities Ltd www.skpmoneywise.com Page 1 of 12
Outlook & Recommendation Elecon is expected to be the major beneficiary of the incremental focus of GOI on infrastructural sectors. At the current market price of ` 67, the stock is trading at a P/E of 6x and 4.8x of FY12 and FY13 earnings of ` 11.2 and ` 13.9. We recommend BUY rating on the stock with a target price of ` 111/- (66% upside) in 15 months at the P/E of 8x on FY13 earnings.
CMP Rs. 67 Target Rs. 111 Initiating Coverage- Buy Key Share DataFace Value (`) 2.0Equity Capital (` mn) 185.7M.Cap (` mn) 6221.752-wk High/Low (`) 103.7/59.3Avg. Daily Vol 123030BSE Code 505700NSE Code ELECONReuters Code ELCN.BOBloomberg Code ELCN IN Shareholding Pattern (as on March 31, 2011)
FIIs4%
Promoters45%
Corporates8%
Instititions12%
Public & Others
31%
Particulars FY10 FY11 FY12E FY13ENet Sales 10463.7 11845.4 14309.2 17214.0Sales Gr. 9.6% 13.2% 20.8% 20.3%EBIDTA 1495.5 1838.4 2220.8 2670.6PAT 661.8 879.2 1038.3 1291.3PAT Gr. 15.2% 32.9% 18.1% 24.4%EPS (`) 7.1 9.5 11.2 13.9CEPS (`) 10.7 13.6 15.5 19.1
Financials (` mn)
FY10 FY11 FY12E FY13EInt Cover (x) 2.3 3.2 2.8 3.0P/E (x) 9.4 7.1 6.0 4.8P/BV (x) 1.9 1.6 1.3 1.0P/Cash EPS (x) 6.3 4.9 4.3 3.5M.Cap/Sales (x) 0.6 0.5 0.4 0.4EV/EBIDTA (x) 7.4 6.2 5.5 4.8ROCE (%) 13.7% 15.7% 16.5% 17.5%ROE (%) 20.3% 22.3% 21.5% 21.7%EBIDTM (%) 14.3% 15.5% 15.5% 15.5%NPM (%) 6.3% 7.4% 7.3% 7.5%Debt-Equity (x) 1.6 1.3 1.3 1.1
Key Ratios
Price Performance Elecon vs BSE Small Cap
-30%
-20%
-10%
0%
10%
20%
30%
40%
May-10
Jun-10
Jul-10
Aug-10
Sep-10
Oct-10
Nov-10
Dec-10
Jan-11
Feb-11
Mar-11
Apr-11
May-11
EleconBSESMALLCAP
Company Profile Elecon Engineering Company Ltd (Elecon) manufactures industrial gears with a market share of 26%, operates across multiple core industries. It is among the largest players in material handling equipments (MHE) in India. Majority of its MHE revenues are derived from buoyant power sector. Elecon is also present in wind turbine segment. Its state of the art facilities are located at Vallabh Vidyanagar, Gujarat. Investment Rationale Topline to grow with a CAGR of 21%…
Elecon’s topline grew by 12.4% to ` 11,845.4 mn during FY11 vis-à-vis ` 10,543.1 mn last year. MHE and transmission equipment division contributed ` 6,745.8 mn and ` 5,246.4 mn respectively.
We expect the revenue to grow by CAGR of 21% during the next two financial years led by huge opportunities in the user sector.
EBIDTA Margins are expected to remain stable…
EBIDTA of the company has increased by 16.7% during the year from ` 1,575 mn to ` 1,838.4 mn. EBIDTA margins also improved by 120 bps to 15.5% during the year. Raw Material to sales improved by 250 bps to 66.6%.We expect the EBIDTA margins to remain stable at the same levels for FY12 and FY13.
PAT increased by 32.9% from ` 661.8 mn to ` 879.2 mn during the year. PAT margin improved by 110 bps to 7.4% from 6.3% last year. We further expect it to grow with the CAGR of 21% during next two years.
Brownfield capex of ` 1.3 bn…
Elecon has planned a capex of ` 1.3 bn during FY12 at its existing facilities at Vallabh Vidyanagar.
Around 60% of the total capex will be spent upon increasing capacity for MHE division and the rest for gears.
We expect the expansion to be completed within FY12. The Company incurred capex of ` 540 mn during FY11 of which ` 240
mn were spent towards MHE division. Healthy order book of ` 13.8 bn …
Elecon has the healthy order book position of ` 13.8 bn as on 31st March 2011 vis -a -vis ` 9.2 bn last year. This order book excludes the orders from Brahamani Industries Ltd worth ` 3.2 bn.
MHE contributes orders worth ` 10.6 bn and rest is from transmission equipment division.
The Company booked orders worth ` 1.5 bn during Q4FY11 of which MHE comprises ` 2.9 bn and rest is from transmission equipment division.
Analyst: Vineet P. Agrawal Tel No.: +91 22 2281 9012; Mobile: 9819510575 Email: [email protected]
Elecon Engineering Company Ltd.
SKP Securities Ltd. www.skpmoneywise.com Page 2 of 12
The Company: A snap shot
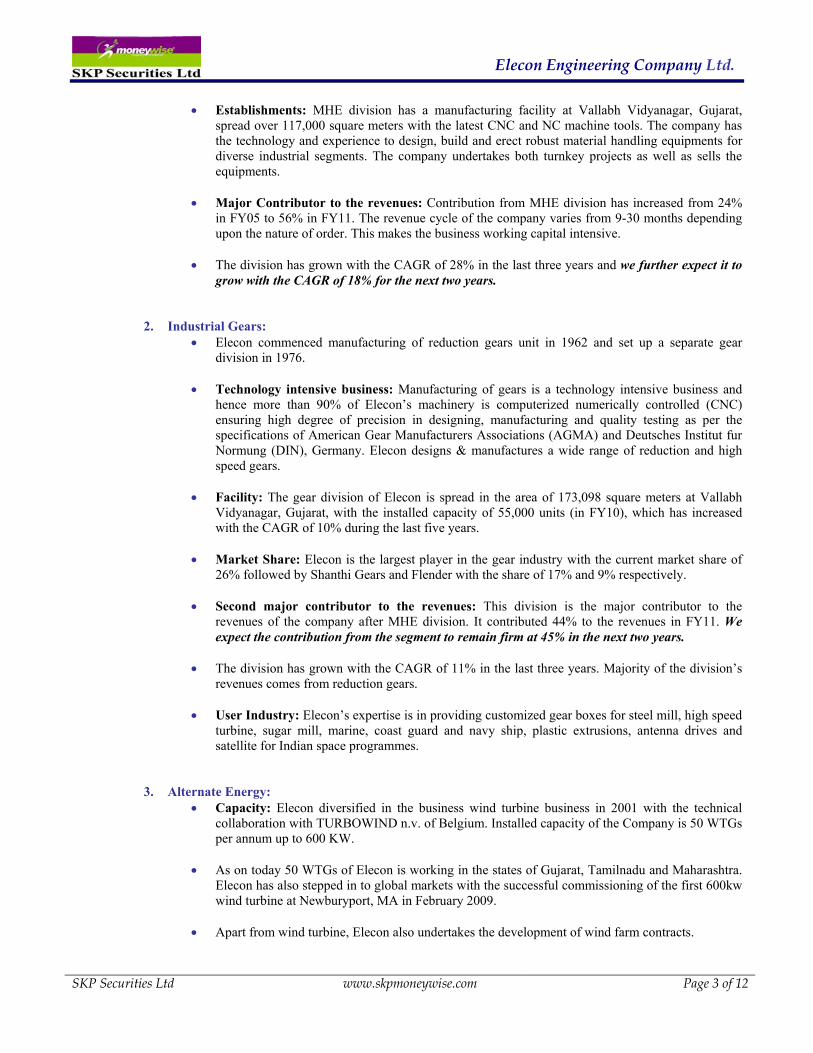
• Elecon Engineering Company Ltd (Elecon) was established in 1951 as a relatively small set up in Mumbai with mainly two products namely elevators and conveyors, which was shifted to Vallabh Vidyanagar, Gujarat in 1962. Today, it is India’s one of the leading MHE and power transmission solutions business companies with manufacturing bases at Vallabh Vidyanagar.
• It has a wide customer base across the country whose requirements are taken care by 90 dealers
and 181 resident engineers. Business mix of the company can be broadly classified as follows:
Source: Company and SKP Research
1. Material Handling Equipments (MHE): • One of the prominent MHE manufacturers: Elecon is the one of the prominent manufacturers
of material handling equipments in India. MHE products of Elecon at a glance:
Products User Industry ApplicationConveying Equipments Power, Cement, Steel, Port, Mining etc Moves heavy and bulky materials from one place to other.
Wagon Tippler Power, Cement, Steel, Port, Mining etc Unloading of broad-guage open rail wagons
Tripper Open Cast Mines --
Cable Reeling Drum MHE Used on the mobile equipment for power supply
Crushers Power, Cement, Steel, Port For crushing of coal, coke, cinter, moderately hard rock, ore, chalk, etc.
It’s a machine which performs a conveying operation over a short distance and through which the rate of flow of material in a processing plant can be controlled.
Apron Feeder Power, Cement, Steel, Port, Mining etc
Impactors For crushing hard and medium hard rocks such as limestone, basalt, blast furnace slag etc.
Power, Cement, Steel, Port
For loading bulk solid materials like iron ore, coal, fertilizers, grains into marine vessels for transportation by sea.
For handling iron ore, coal, limestone for loading to railway wagons.Wagon Loader Power, Cement, Steel, Port
Power, Cement, Steel, Port, Mining etcShip Loaders
For charging and spotting of wagon on tippler table by beetle chargerWagon Marshelling Equipments Power, Cement, Steel, Port, Mining etc
A stacker's function is to pile bulk material such as limestone, ores and cereals onto a stockpile whereas A reclaimer can be used to recover the material.
Power, Cement, Steel, PortStacker Reclaimer
ELECON
Material Handling
Reduction Gears
High Speed Gears
Industrial Gear Boxes
Wind Turbines
Wind Farms
Alternate Energy
Source: Company & SKP Research
Elecon Engineering Company Ltd.
SKP Securities Ltd www.skpmoneywise.com Page 3 of 12
• Establishments: MHE division has a manufacturing facility at Vallabh Vidyanagar, Gujarat, spread over 117,000 square meters with the latest CNC and NC machine tools. The company has the technology and experience to design, build and erect robust material handling equipments for diverse industrial segments. The company undertakes both turnkey projects as well as sells the equipments.
• Major Contributor to the revenues: Contribution from MHE division has increased from 24%
in FY05 to 56% in FY11. The revenue cycle of the company varies from 9-30 months depending upon the nature of order. This makes the business working capital intensive.
• The division has grown with the CAGR of 28% in the last three years and we further expect it to
grow with the CAGR of 18% for the next two years.
2. Industrial Gears: • Elecon commenced manufacturing of reduction gears unit in 1962 and set up a separate gear
division in 1976. • Technology intensive business: Manufacturing of gears is a technology intensive business and
hence more than 90% of Elecon’s machinery is computerized numerically controlled (CNC) ensuring high degree of precision in designing, manufacturing and quality testing as per the specifications of American Gear Manufacturers Associations (AGMA) and Deutsches Institut fur Normung (DIN), Germany. Elecon designs & manufactures a wide range of reduction and high speed gears.
• Facility: The gear division of Elecon is spread in the area of 173,098 square meters at Vallabh
Vidyanagar, Gujarat, with the installed capacity of 55,000 units (in FY10), which has increased with the CAGR of 10% during the last five years.
• Market Share: Elecon is the largest player in the gear industry with the current market share of
26% followed by Shanthi Gears and Flender with the share of 17% and 9% respectively. • Second major contributor to the revenues: This division is the major contributor to the
revenues of the company after MHE division. It contributed 44% to the revenues in FY11. We expect the contribution from the segment to remain firm at 45% in the next two years.
• The division has grown with the CAGR of 11% in the last three years. Majority of the division’s
revenues comes from reduction gears.
• User Industry: Elecon’s expertise is in providing customized gear boxes for steel mill, high speed turbine, sugar mill, marine, coast guard and navy ship, plastic extrusions, antenna drives and satellite for Indian space programmes.
3. Alternate Energy: • Capacity: Elecon diversified in the business wind turbine business in 2001 with the technical
collaboration with TURBOWIND n.v. of Belgium. Installed capacity of the Company is 50 WTGs per annum up to 600 KW.
• As on today 50 WTGs of Elecon is working in the states of Gujarat, Tamilnadu and Maharashtra.
Elecon has also stepped in to global markets with the successful commissioning of the first 600kw wind turbine at Newburyport, MA in February 2009.
• Apart from wind turbine, Elecon also undertakes the development of wind farm contracts.
Elecon Engineering Company Ltd.
SKP Securities Ltd www.skpmoneywise.com Page 4 of 12
Acquisition of Benzler – Radicon Group of Business
• Elecon has recently acquired the Benzler – Radicon (BR) Group of businesses from David Brown Gear Systems Group for 18.4 mn pounds (approximately ` 1.3 bn).
• The acquisition includes 100% share holding of David Brown Systems Sweden AB (the Benzlers
business), The Applied products division i.e. RADICON, of David Brown Gear Systems, UK and Certain assets of the gear motor business of Cone Drive Inc USA.
• In addition to this, Power Build Transmission International Ltd., Mauritius, a 100% SPV of Power
Build Ltd., a group company of Elecon, has also executed Sale and Purchase agreement (SPA) with David Brown Systems (Holding) S.a.r.l, to acquire 100% stake of David Brown Systems (Thailand) Ltd for around GBP 3 mn (around ` 210.3 mn).
• The company had been looking to acquire engineering firms in Western Europe and USA since
2009. The acquisition plans were delayed due to the slowdown.
• This strategic acquisition of BR Group gives Elecon → a great platform to announce it’s presence on the world stage as BR has
internationally recognised brands with an established footprint in the Western Hemisphere.
→ a chance to venture in the new business segments globally, → developing engineering excellence through knowledge sharing, having significant
site ownership and intellectual property rights apart from having other commercial advantages.
→ a bigger market with developed channels to push it’s own products.
• This acquisition will also strengthen Elecon's product development and engineering capabilities and widen its customer base in European, North American & Scandinavian countries.
• Elecon is now expected to bring the advantages of economies of scale in the manufacturing
processes and reduce costs across the supply chain by combining engineering excellence with BR group.
User Segment Overview Elecon’s core user segments are power, coal ports, steel cement etc, a brief of which is given below:
Power: • India is the second largest growing economy of the world growing consistently by 8%
GDP growth rate for last 3-4 years. Government of India (GOI) has made plans to invest in infrastructure including power to sustain this kind of growth in the future.
• GOI has developed a national electricity policy, which aims at accelerating the
development of the power sector through the generation of additional power. The policy is being promoted by Ministry of Power (MoP) as ‘Mission 2012: Power for All’.
• According to CEA, India’s power generation systems had an installed capacity of around 174,361 MW as on April 30, 2011. GOI has planned to add 41,900 MW (revised estimate by CEA) by 2012.
Elecon Engineering Company Ltd.
SKP Securities Ltd www.skpmoneywise.com Page 5 of 12
456505
575617
424464
531
532519
561
93%
92% 91%92%
98%
0
100
200
300
400
500
600
700
2005-06 2006-07 2007-08 2008-09 2009-10
Cap
acity
& U
tilis
atio
n (M
TPA
)
86%
88%
90%
92%
94%
96%
98%
100%
Util
isat
ion
(%)
• It is estimated that energy requirement to grow by 2.3 times and annual peak load by 2.5x by 2017. Thus, GOI has planned to increase the power generation capacity by further 100,000 MW during 12th Five Year Plan.
• In order to maintain a sustained growth of 8%-9% p.a. through next 25 years and meet
the energy needs of all citizens, India would need to increase its primary energy supply by three to four times.
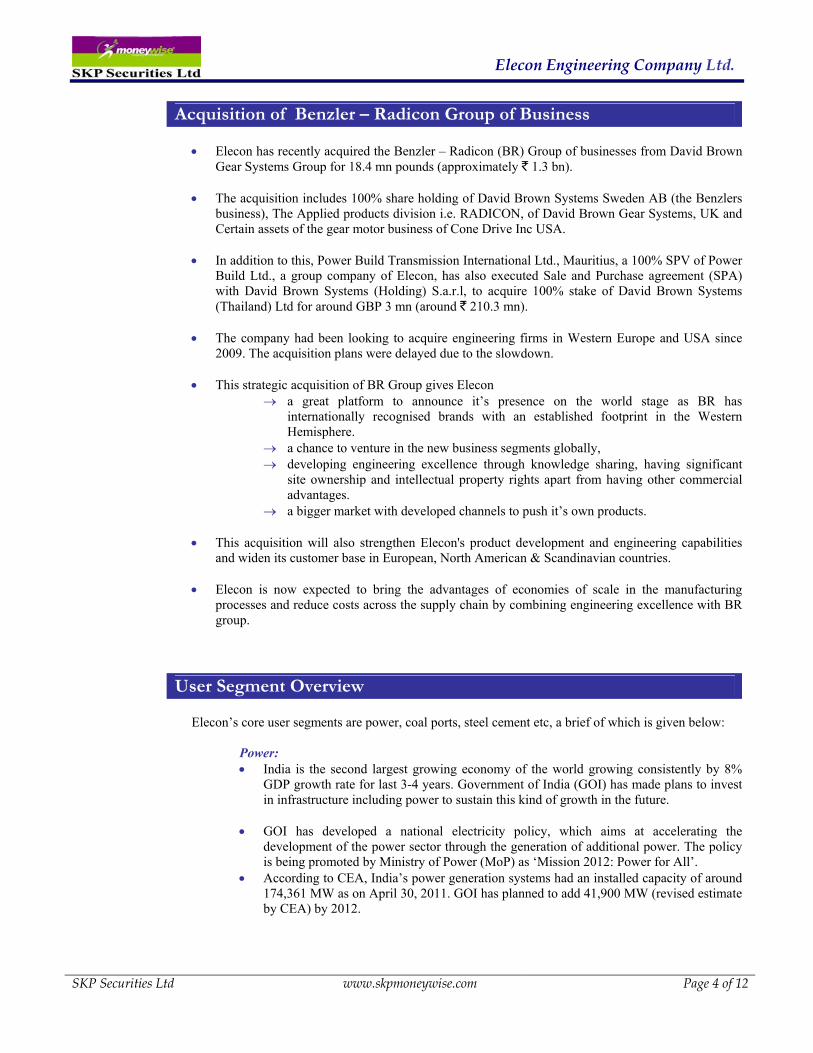
Ports: • The country's 12 biggest government-controlled ports handled 561 MT of cargo in the
year ended March, 2010, compared with the 531 MT of freight moved through them in March 2009. Of these, Paradeep port posted highest growth by 22.8% followed by Mormugao 17.2%, Cochin 14.5%, Kandla 10.1%, Tuticorin 8.1%, Chennai 6.2%, JNPT 6.1%, Mumbai 5.1%, Kolkata Dock System 5% and Vishakhapatnam 2.5%.
• Indian ports are
working at optimum capacity for the last five years as indicated in the chart below. This gives rise to the demand of capacity additions of these ports. GOI has projected the traffic at major ports to rise to 708 MT by March 2012 from the current 561 MT in March 2010.
• Inadequacies of ports and other infrastructure hinder growth in the economy. Thus,
Government plans to increase the capacity of government controlled ports to handle up to 1,017 MTPA of cargo by March 2012 with the estimated cost of ` 355 bn.
• We expect that the government-controlled ports will have a capacity to handle 743 MT of cargo by March 31, 2012, compared with the above target as the economy grew less than anticipated and global trade slumped amid a recession, bringing down the investment to ` 220 bn.
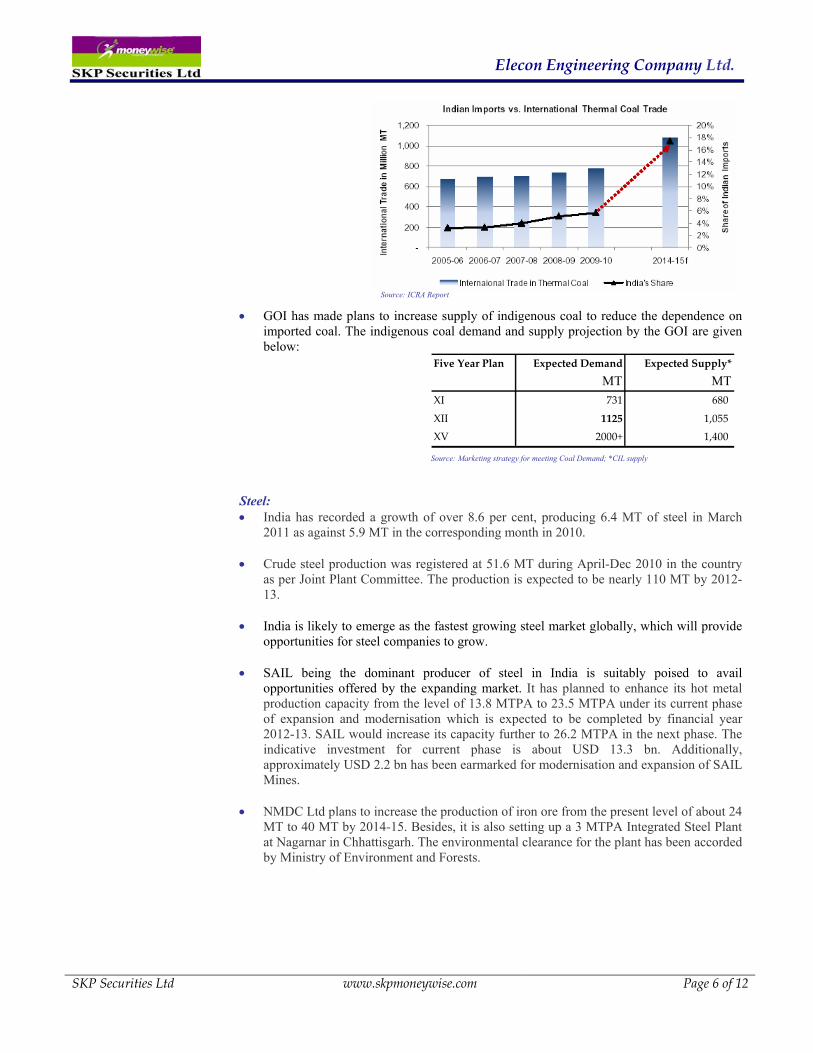
Coal: • The demand for coal in India has been increasing at a rapid pace, driven largely by the
thermal power sector that accounts for 72% of the total domestic coal consumption in 2009-10. Off take of coal by power sector was 299 MT out of total off take of 416 MT in FY10.
• The spurt in demand (CAGR 8% - FY06-10) has led to significant rise in import levels
amid the failure of the domestic coal production to keep pace with the increasing demand (CAGR 7% - FY06-10) due to structural bottlenecks which prevent quick commissioning of mining projects. This has given rise to imports as depicted by the graph below:
Source: Maritime Agenda 2010-2020
Elecon Engineering Company Ltd.
SKP Securities Ltd www.skpmoneywise.com Page 6 of 12
• GOI has made plans to increase supply of indigenous coal to reduce the dependence on
imported coal. The indigenous coal demand and supply projection by the GOI are given below:
Five Year Plan Expected Demand Expected Supply*
MT MTXI 731 680
XII 1125 1,055
XV 2000+ 1,400 Source: Marketing strategy for meeting Coal Demand; *CIL supply
Steel: • India has recorded a growth of over 8.6 per cent, producing 6.4 MT of steel in March
2011 as against 5.9 MT in the corresponding month in 2010. • Crude steel production was registered at 51.6 MT during April-Dec 2010 in the country
as per Joint Plant Committee. The production is expected to be nearly 110 MT by 2012-13.
• India is likely to emerge as the fastest growing steel market globally, which will provide
opportunities for steel companies to grow.
• SAIL being the dominant producer of steel in India is suitably poised to avail opportunities offered by the expanding market. It has planned to enhance its hot metal production capacity from the level of 13.8 MTPA to 23.5 MTPA under its current phase of expansion and modernisation which is expected to be completed by financial year 2012-13. SAIL would increase its capacity further to 26.2 MTPA in the next phase. The indicative investment for current phase is about USD 13.3 bn. Additionally, approximately USD 2.2 bn has been earmarked for modernisation and expansion of SAIL Mines.
• NMDC Ltd plans to increase the production of iron ore from the present level of about 24
MT to 40 MT by 2014-15. Besides, it is also setting up a 3 MTPA Integrated Steel Plant at Nagarnar in Chhattisgarh. The environmental clearance for the plant has been accorded by Ministry of Environment and Forests.
Source: ICRA Report
Elecon Engineering Company Ltd.
SKP Securities Ltd www.skpmoneywise.com Page 7 of 12
0%
5%
10%
15%
20%
25%
30%
FY08 FY09 FY10 FY11 FY12E FY13E
EBIDTA Margin (%) PAT Margin (%) ROE ROCE
Investment Arguments
1. Revenues to grow with the CAGR of 21%: • Elecon’s topline has seen handsome CAGR growth of 13% for the past three years.
Revenues posted by the company for FY11 was ` 11.9 bn, which we expect to touch ` 17.2 bn by the end of FY13 with the CAGR growth rate of 21% due to strong economical and industrial growth.
• As mentioned earlier, growth drivers for MHE division for Elecon are directly related to
growth in core sectors such as power, mining, steel. Cement, port etc. • Huge investment in core sectors will increase demand for material handling
equipments across the industries. Elecon, being one of the largest and pre-qualified players in MHE segment, is well positioned to take advantage of the emerging opportunities from the above core sectors.
2. Margins Expected to remain stable:
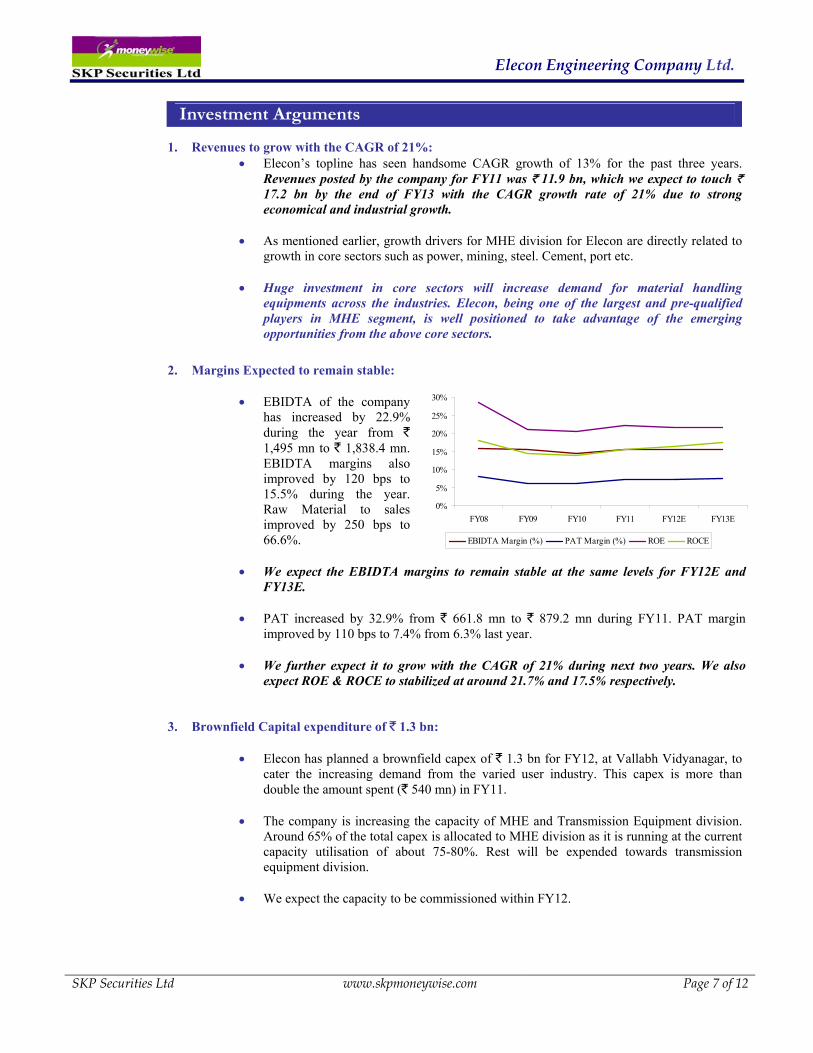
• EBIDTA of the company has increased by 22.9% during the year from ` 1,495 mn to ` 1,838.4 mn. EBIDTA margins also improved by 120 bps to 15.5% during the year. Raw Material to sales improved by 250 bps to 66.6%.
• We expect the EBIDTA margins to remain stable at the same levels for FY12E and
FY13E. • PAT increased by 32.9% from ` 661.8 mn to ` 879.2 mn during FY11. PAT margin
improved by 110 bps to 7.4% from 6.3% last year.
• We further expect it to grow with the CAGR of 21% during next two years. We also expect ROE & ROCE to stabilized at around 21.7% and 17.5% respectively.
3. Brownfield Capital expenditure of ` 1.3 bn:
• Elecon has planned a brownfield capex of ` 1.3 bn for FY12, at Vallabh Vidyanagar, to cater the increasing demand from the varied user industry. This capex is more than double the amount spent (` 540 mn) in FY11.
• The company is increasing the capacity of MHE and Transmission Equipment division.
Around 65% of the total capex is allocated to MHE division as it is running at the current capacity utilisation of about 75-80%. Rest will be expended towards transmission equipment division.
• We expect the capacity to be commissioned within FY12.
Elecon Engineering Company Ltd.
SKP Securities Ltd www.skpmoneywise.com Page 8 of 12
Quarterly Order Inflow
0
500
1000
1500
2000
Mar-08
Jun-08
Sep-08
Dec-08
Mar-09
Jun-09
Sep-09
Dec-09
Mar-10
Jun-10
Sep-10
Dec-10
Mar-11
Rs
mn
1415
8
1455
8
1502
2
1556
0
1618
5400464
538
625
72414
158
12000
13000
14000
15000
16000
17000
18000
FY11 FY12E FY13E FY14E FY15E FY16E
Estimated Capacity Last Year (MW) New Capacity (MW)
4. Maintaining healthy Order Book – current order book of Rs 13.6 bn:
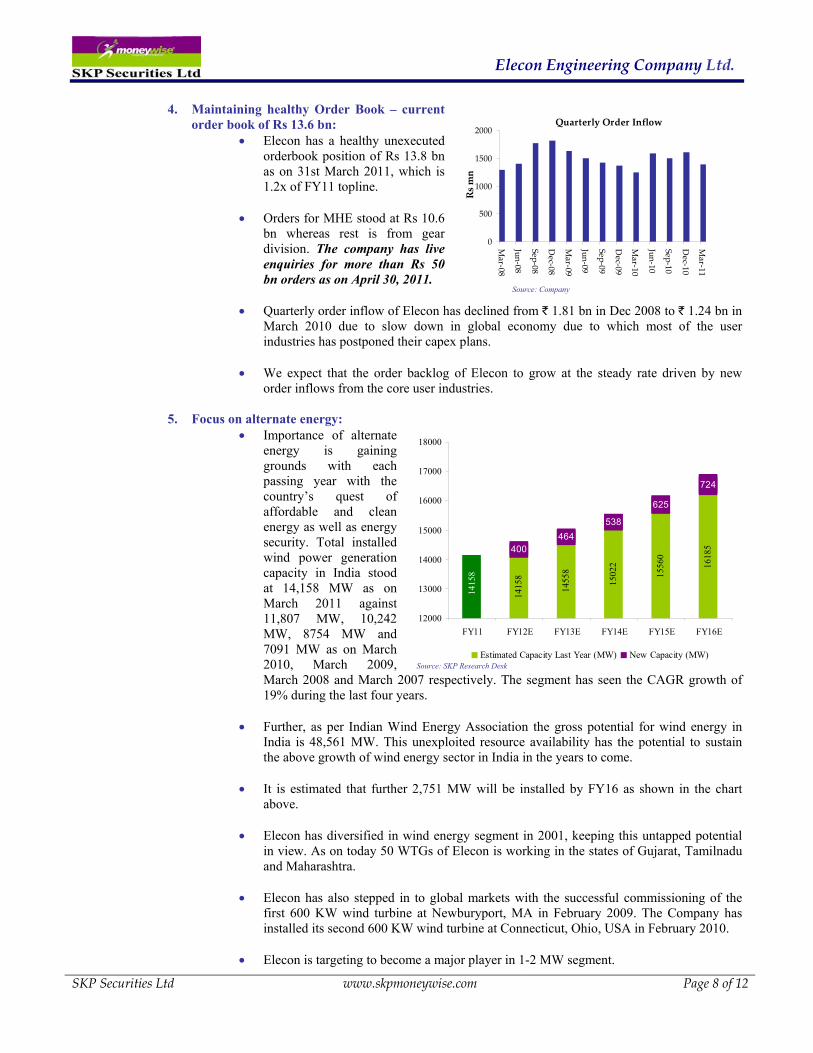
• Elecon has a healthy unexecuted orderbook position of Rs 13.8 bn as on 31st March 2011, which is 1.2x of FY11 topline.
• Orders for MHE stood at Rs 10.6
bn whereas rest is from gear division. The company has live enquiries for more than Rs 50 bn orders as on April 30, 2011.
• Quarterly order inflow of Elecon has declined from ` 1.81 bn in Dec 2008 to ` 1.24 bn in
March 2010 due to slow down in global economy due to which most of the user industries has postponed their capex plans.
• We expect that the order backlog of Elecon to grow at the steady rate driven by new
order inflows from the core user industries.
5. Focus on alternate energy: • Importance of alternate
energy is gaining grounds with each passing year with the country’s quest of affordable and clean energy as well as energy security. Total installed wind power generation capacity in India stood at 14,158 MW as on March 2011 against 11,807 MW, 10,242 MW, 8754 MW and 7091 MW as on March 2010, March 2009, March 2008 and March 2007 respectively. The segment has seen the CAGR growth of 19% during the last four years.
• Further, as per Indian Wind Energy Association the gross potential for wind energy in
India is 48,561 MW. This unexploited resource availability has the potential to sustain the above growth of wind energy sector in India in the years to come.
• It is estimated that further 2,751 MW will be installed by FY16 as shown in the chart above.
• Elecon has diversified in wind energy segment in 2001, keeping this untapped potential
in view. As on today 50 WTGs of Elecon is working in the states of Gujarat, Tamilnadu and Maharashtra.
• Elecon has also stepped in to global markets with the successful commissioning of the
first 600 KW wind turbine at Newburyport, MA in February 2009. The Company has installed its second 600 KW wind turbine at Connecticut, Ohio, USA in February 2010.
• Elecon is targeting to become a major player in 1-2 MW segment.
Source: Company
Source: SKP Research Desk
Elecon Engineering Company Ltd.
SKP Securities Ltd www.skpmoneywise.com Page 9 of 12
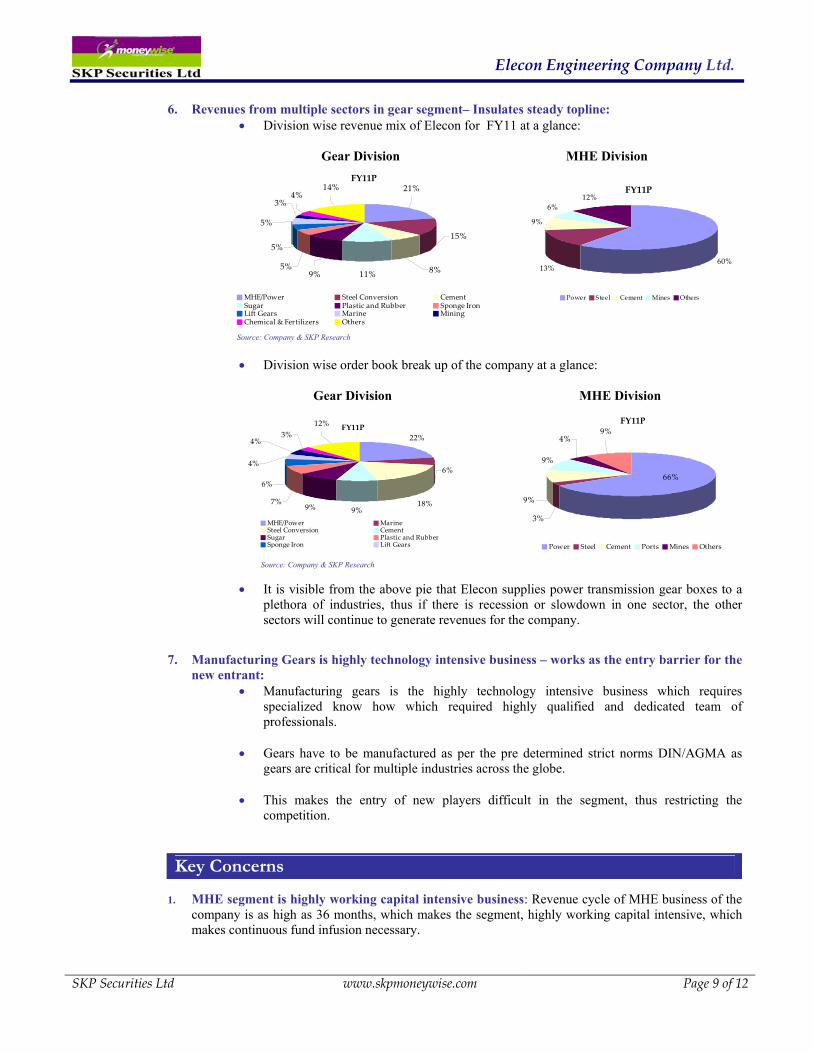
6. Revenues from multiple sectors in gear segment– Insulates steady topline: • Division wise revenue mix of Elecon for FY11 at a glance:
Gear Division MHE Division
• Division wise order book break up of the company at a glance:
Gear Division MHE Division
• It is visible from the above pie that Elecon supplies power transmission gear boxes to a plethora of industries, thus if there is recession or slowdown in one sector, the other sectors will continue to generate revenues for the company.
7. Manufacturing Gears is highly technology intensive business – works as the entry barrier for the new entrant:
• Manufacturing gears is the highly technology intensive business which requires specialized know how which required highly qualified and dedicated team of professionals.
• Gears have to be manufactured as per the pre determined strict norms DIN/AGMA as
gears are critical for multiple industries across the globe.
• This makes the entry of new players difficult in the segment, thus restricting the competition.
Key Concerns
1. MHE segment is highly working capital intensive business: Revenue cycle of MHE business of the
company is as high as 36 months, which makes the segment, highly working capital intensive, which makes continuous fund infusion necessary.
Source: Company & SKP Research
Source: Company & SKP Research
FY11P
5%
5%
5%
4%3%
14%
9% 11% 8%
15%
21%
MHE/Power Steel Conversion CementSugar Plastic and Rubber Sponge IronLift Gears Marine MiningChemical & Fertilizers Others
FY11P
3%
9%
9%
66%
9%4%
Power Steel Cement Ports Mines Others
FY11P22%
18%9%9%
7%
6%
6%
12%3%
4%
4%
MHE/Power MarineSteel Conversion CementSugar Plastic and RubberSponge Iron Lift Gears
FY11P
60%13%
9%
6%12%
Power Steel Cement Mines Others
Elecon Engineering Company Ltd.
SKP Securities Ltd www.skpmoneywise.com Page 10 of 12
2. Price volatility of Iron & Steel: Iron & Steel is the major raw material for the company, which is highly price volatile. Any adverse movement in the prices of iron and steel may put negative impact on the margins of the company.
Financial Outlook
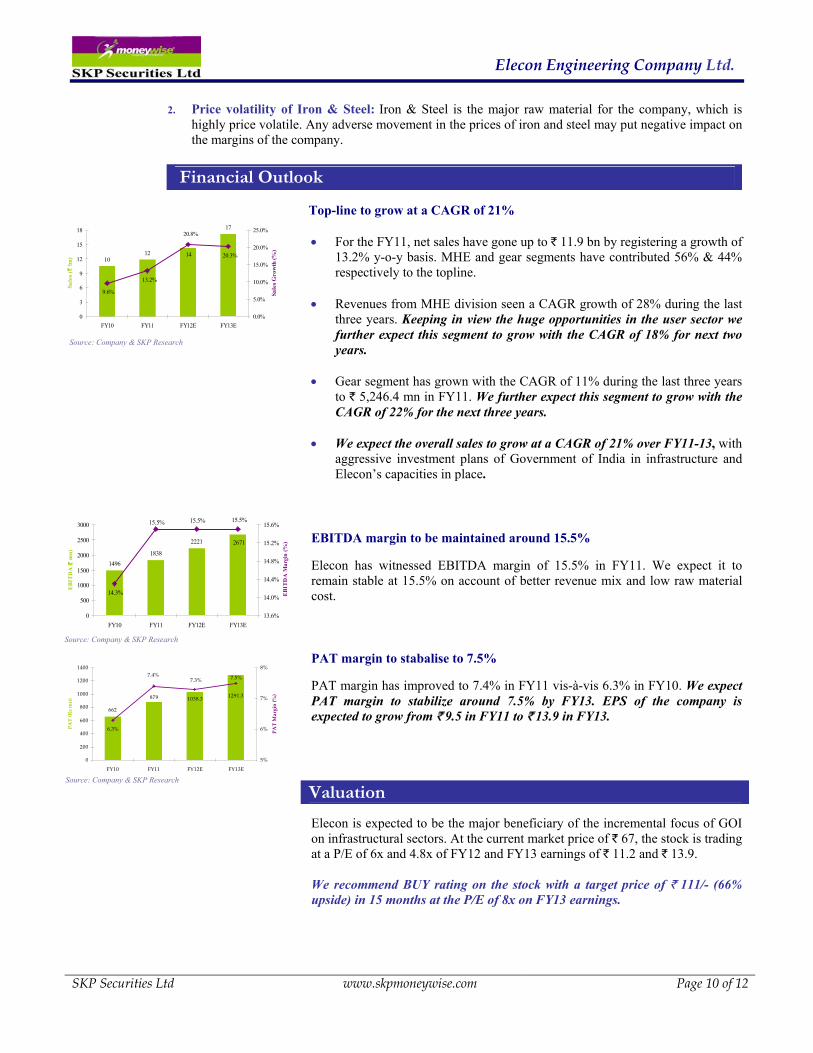
Top-line to grow at a CAGR of 21%
• For the FY11, net sales have gone up to ` 11.9 bn by registering a growth of 13.2% y-o-y basis. MHE and gear segments have contributed 56% & 44% respectively to the topline.
• Revenues from MHE division seen a CAGR growth of 28% during the last
three years. Keeping in view the huge opportunities in the user sector we further expect this segment to grow with the CAGR of 18% for next two years.
• Gear segment has grown with the CAGR of 11% during the last three years to ` 5,246.4 mn in FY11. We further expect this segment to grow with the CAGR of 22% for the next three years.
• We expect the overall sales to grow at a CAGR of 21% over FY11-13, with
aggressive investment plans of Government of India in infrastructure and Elecon’s capacities in place.
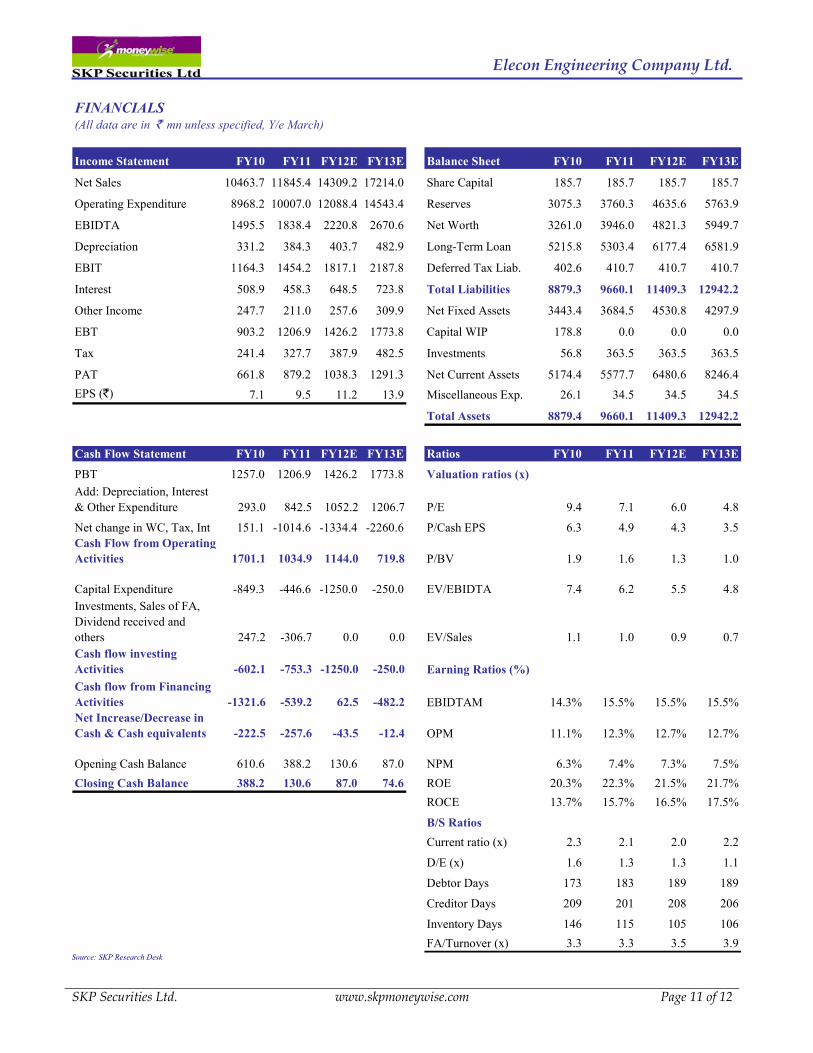
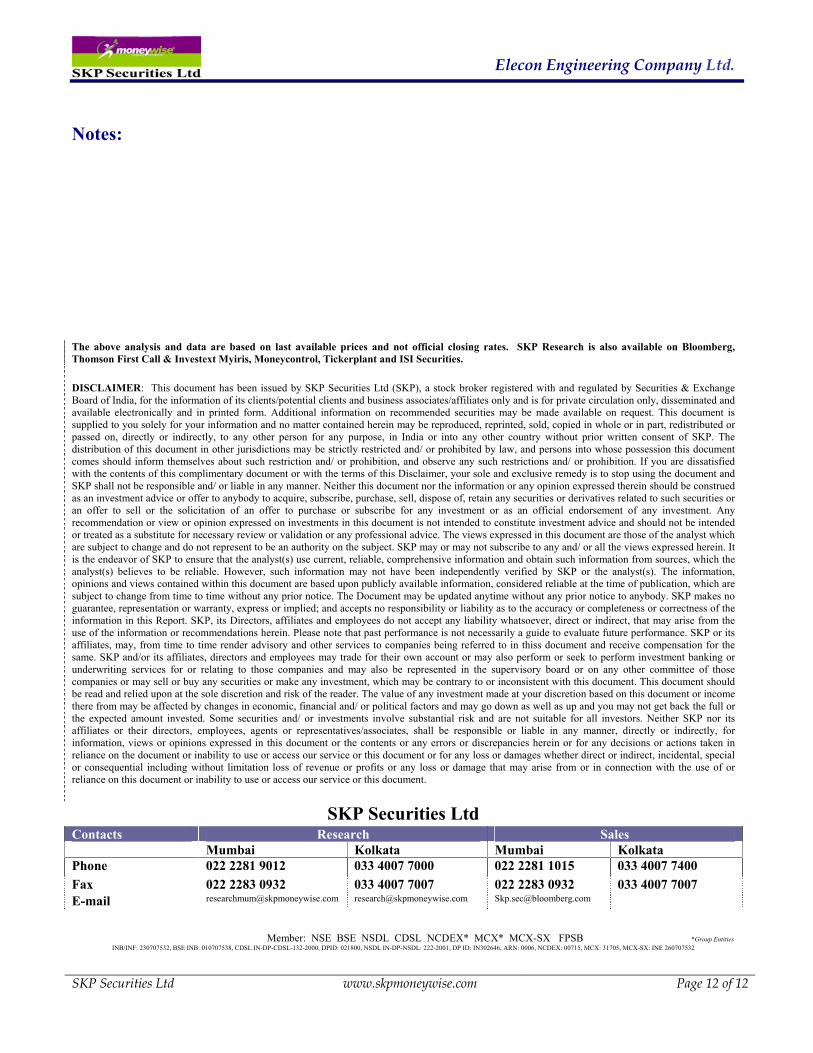
EBITDA margin to be maintained around 15.5%
Elecon has witnessed EBITDA margin of 15.5% in FY11. We expect it to remain stable at 15.5% on account of better revenue mix and low raw material cost. PAT margin to stabalise to 7.5% PAT margin has improved to 7.4% in FY11 vis-à-vis 6.3% in FY10. We expect PAT margin to stabilize around 7.5% by FY13. EPS of the company is expected to grow from ` 9.5 in FY11 to ` 13.9 in FY13. Elecon is expected to be the major beneficiary of the incremental focus of GOI on infrastructural sectors. At the current market price of ` 67, the stock is trading at a P/E of 6x and 4.8x of FY12 and FY13 earnings of ` 11.2 and ` 13.9. We recommend BUY rating on the stock with a target price of ` 111/- (66% upside) in 15 months at the P/E of 8x on FY13 earnings.
Valuation
Source: Company & SKP Research
Source: Company & SKP Research
1012
17
14
20.8%
20.3%
9.6%
13.2%
0
3
6
9
12
15
18
FY10 FY11 FY12E FY13E
Sale
s (`
bn)
0.0%
5.0%
10.0%
15.0%
20.0%
25.0%
Sale
s Gro
wth
(%)
14961838
2221 2671
15.5%15.5%15.5%
14.3%
0
500
1000
1500
2000
2500
3000
FY10 FY11 FY12E FY13E
EB
ITD
A (̀
mn)
13.6%
14.0%
14.4%
14.8%
15.2%
15.6%
EB
ITD
A M
argi
n (%
)
Source: Company & SKP Research
1291.31038.3
662
879
7.5%7.3%7.4%
6.3%
0
200
400
600
800
1000
1200
1400
FY10 FY11 FY12E FY13E
PAT
(Rs
mn)
5%
6%
7%
8%
PAT
Mar
gin
(%)
Elecon Engineering Company Ltd.
SKP Securities Ltd. www.skpmoneywise.com Page 11 of 12
FINANCIALS(All data are in ` mn unless specified, Y/e March)
Income Statement FY10 FY11 FY12E FY13E Balance Sheet FY10 FY11 FY12E FY13E
Net Sales 10463.7 11845.4 14309.2 17214.0 Share Capital 185.7 185.7 185.7 185.7
Operating Expenditure 8968.2 10007.0 12088.4 14543.4 Reserves 3075.3 3760.3 4635.6 5763.9
EBIDTA 1495.5 1838.4 2220.8 2670.6 Net Worth 3261.0 3946.0 4821.3 5949.7
Depreciation 331.2 384.3 403.7 482.9 Long-Term Loan 5215.8 5303.4 6177.4 6581.9
EBIT 1164.3 1454.2 1817.1 2187.8 Deferred Tax Liab. 402.6 410.7 410.7 410.7
Interest 508.9 458.3 648.5 723.8 Total Liabilities 8879.3 9660.1 11409.3 12942.2
Other Income 247.7 211.0 257.6 309.9 Net Fixed Assets 3443.4 3684.5 4530.8 4297.9
EBT 903.2 1206.9 1426.2 1773.8 Capital WIP 178.8 0.0 0.0 0.0
Tax 241.4 327.7 387.9 482.5 Investments 56.8 363.5 363.5 363.5
PAT 661.8 879.2 1038.3 1291.3 Net Current Assets 5174.4 5577.7 6480.6 8246.4EPS (`) 7.1 9.5 11.2 13.9 Miscellaneous Exp. 26.1 34.5 34.5 34.5
Total Assets 8879.4 9660.1 11409.3 12942.2
Cash Flow Statement FY10 FY11 FY12E FY13E Ratios FY10 FY11 FY12E FY13E
PBT 1257.0 1206.9 1426.2 1773.8 Valuation ratios (x)Add: Depreciation, Interest & Other Expenditure 293.0 842.5 1052.2 1206.7 P/E 9.4 7.1 6.0 4.8
Net change in WC, Tax, Int 151.1 -1014.6 -1334.4 -2260.6 P/Cash EPS 6.3 4.9 4.3 3.5Cash Flow from Operating Activities 1701.1 1034.9 1144.0 719.8 P/BV 1.9 1.6 1.3 1.0
Capital Expenditure -849.3 -446.6 -1250.0 -250.0 EV/EBIDTA 7.4 6.2 5.5 4.8Investments, Sales of FA, Dividend received and others 247.2 -306.7 0.0 0.0 EV/Sales 1.1 1.0 0.9 0.7Cash flow investing Activities -602.1 -753.3 -1250.0 -250.0 Earning Ratios (%)Cash flow from Financing Activities -1321.6 -539.2 62.5 -482.2 EBIDTAM 14.3% 15.5% 15.5% 15.5%Net Increase/Decrease in Cash & Cash equivalents -222.5 -257.6 -43.5 -12.4 OPM 11.1% 12.3% 12.7% 12.7%
Opening Cash Balance 610.6 388.2 130.6 87.0 NPM 6.3% 7.4% 7.3% 7.5%Closing Cash Balance 388.2 130.6 87.0 74.6 ROE 20.3% 22.3% 21.5% 21.7%
ROCE 13.7% 15.7% 16.5% 17.5%
B/S RatiosCurrent ratio (x) 2.3 2.1 2.0 2.2
D/E (x) 1.6 1.3 1.3 1.1
Debtor Days 173 183 189 189
Creditor Days 209 201 208 206
Inventory Days 146 115 105 106FA/Turnover (x) 3.3 3.3 3.5 3.9
Source: SKP Research Desk
Elecon Engineering Company Ltd.
SKP Securities Ltd www.skpmoneywise.com Page 12 of 12
Notes:
The above analysis and data are based on last available prices and not official closing rates. SKP Research is also available on Bloomberg, Thomson First Call & Investext Myiris, Moneycontrol, Tickerplant and ISI Securities. DISCLAIMER: This document has been issued by SKP Securities Ltd (SKP), a stock broker registered with and regulated by Securities & Exchange Board of India, for the information of its clients/potential clients and business associates/affiliates only and is for private circulation only, disseminated and available electronically and in printed form. Additional information on recommended securities may be made available on request. This document is supplied to you solely for your information and no matter contained herein may be reproduced, reprinted, sold, copied in whole or in part, redistributed or passed on, directly or indirectly, to any other person for any purpose, in India or into any other country without prior written consent of SKP. The distribution of this document in other jurisdictions may be strictly restricted and/ or prohibited by law, and persons into whose possession this document comes should inform themselves about such restriction and/ or prohibition, and observe any such restrictions and/ or prohibition. If you are dissatisfied with the contents of this complimentary document or with the terms of this Disclaimer, your sole and exclusive remedy is to stop using the document and SKP shall not be responsible and/ or liable in any manner. Neither this document nor the information or any opinion expressed therein should be construed as an investment advice or offer to anybody to acquire, subscribe, purchase, sell, dispose of, retain any securities or derivatives related to such securities or an offer to sell or the solicitation of an offer to purchase or subscribe for any investment or as an official endorsement of any investment. Any recommendation or view or opinion expressed on investments in this document is not intended to constitute investment advice and should not be intended or treated as a substitute for necessary review or validation or any professional advice. The views expressed in this document are those of the analyst which are subject to change and do not represent to be an authority on the subject. SKP may or may not subscribe to any and/ or all the views expressed herein. It is the endeavor of SKP to ensure that the analyst(s) use current, reliable, comprehensive information and obtain such information from sources, which the analyst(s) believes to be reliable. However, such information may not have been independently verified by SKP or the analyst(s). The information, opinions and views contained within this document are based upon publicly available information, considered reliable at the time of publication, which are subject to change from time to time without any prior notice. The Document may be updated anytime without any prior notice to anybody. SKP makes no guarantee, representation or warranty, express or implied; and accepts no responsibility or liability as to the accuracy or completeness or correctness of the information in this Report. SKP, its Directors, affiliates and employees do not accept any liability whatsoever, direct or indirect, that may arise from the use of the information or recommendations herein. Please note that past performance is not necessarily a guide to evaluate future performance. SKP or its affiliates, may, from time to time render advisory and other services to companies being referred to in thiss document and receive compensation for the same. SKP and/or its affiliates, directors and employees may trade for their own account or may also perform or seek to perform investment banking or underwriting services for or relating to those companies and may also be represented in the supervisory board or on any other committee of those companies or may sell or buy any securities or make any investment, which may be contrary to or inconsistent with this document. This document should be read and relied upon at the sole discretion and risk of the reader. The value of any investment made at your discretion based on this document or income there from may be affected by changes in economic, financial and/ or political factors and may go down as well as up and you may not get back the full or the expected amount invested. Some securities and/ or investments involve substantial risk and are not suitable for all investors. Neither SKP nor its affiliates or their directors, employees, agents or representatives/associates, shall be responsible or liable in any manner, directly or indirectly, for information, views or opinions expressed in this document or the contents or any errors or discrepancies herein or for any decisions or actions taken in reliance on the document or inability to use or access our service or this document or for any loss or damages whether direct or indirect, incidental, special or consequential including without limitation loss of revenue or profits or any loss or damage that may arise from or in connection with the use of or reliance on this document or inability to use or access our service or this document.
SKP Securities Ltd Contacts Research Sales Mumbai Kolkata Mumbai Kolkata Phone 022 2281 9012 033 4007 7000 022 2281 1015 033 4007 7400 Fax 022 2283 0932 033 4007 7007 022 2283 0932 033 4007 7007 E-mail [email protected] [email protected] [email protected]
Member: NSE BSE NSDL CDSL NCDEX* MCX* MCX-SX FPSB *Group Entities INB/INF: 230707532, BSE INB: 010707538, CDSL IN-DP-CDSL-132-2000, DPID: 021800, NSDL IN-DP-NSDL: 222-2001, DP ID: IN302646, ARN: 0006, NCDEX: 00715, MCX: 31705, MCX-SX: INE 260707532