Embed Size (px)
Citation preview
1 Elbit Systems Excellence Nessuah Securities Equity Research
Gil Dattner Analyst 972-3-753 2038 [email protected]
Gilad Alper Analyst 972-3-753 2035 [email protected]
Elbit Systems (ESLT:TASE)
Sector: Defense Neutral
Initiation Target price: - 30 NOVEMBER 2008
Stock Data
TASE ELST
Bloomberg ELST.IT
Reuters ELST.TA
Price (NIS) 141.20
Shares O/S (m) 42,102
Market Cap (NIS,m) 6,117
Free Float (%) 54.4%
12 Mo. Range (NIS) 141.2 237.1
12 Mo. Average Volume (NIS m) 34.8
Elbit is Israel’s largest publically listed domestic defense
company, and is a component of the main TA-25 index. The
company is a vertically integrated, high-quality vendor of defense
electronics. However, based on valuation, we initiate with a
Neutral recommendation.
Elbit’s businesses are in areas of the industry that are fast
growing (increasing efficiency and the safety of military
personnel), or which should fare well even in an environment of
reduced defense spending (systems upgrades).
The company operates in four main areas: C4ISR, airborne
systems, land systems and electro optics. The company is a
world leader in the field of advanced communications, electro-
optics, and unmanned air vehicles.
The company's strategy is to be a multi-domestic player, with
sales and production facilities in its main markets, and to grow
through acquisitions and R&D-driven organic growth. Elbit’s main
customers include the US military, European armies and the
Israeli military (together accounting for 80% of sales).
While possessing a strong backlog and demonstrating improved
operating profitability, the company remains slightly less
profitable than the sector's average and trades at 10x 2009E
earnings, a premium to the sector's average. Therefore, we
initiate the company with a Neutral and await a stock
pullback before we become more positive.
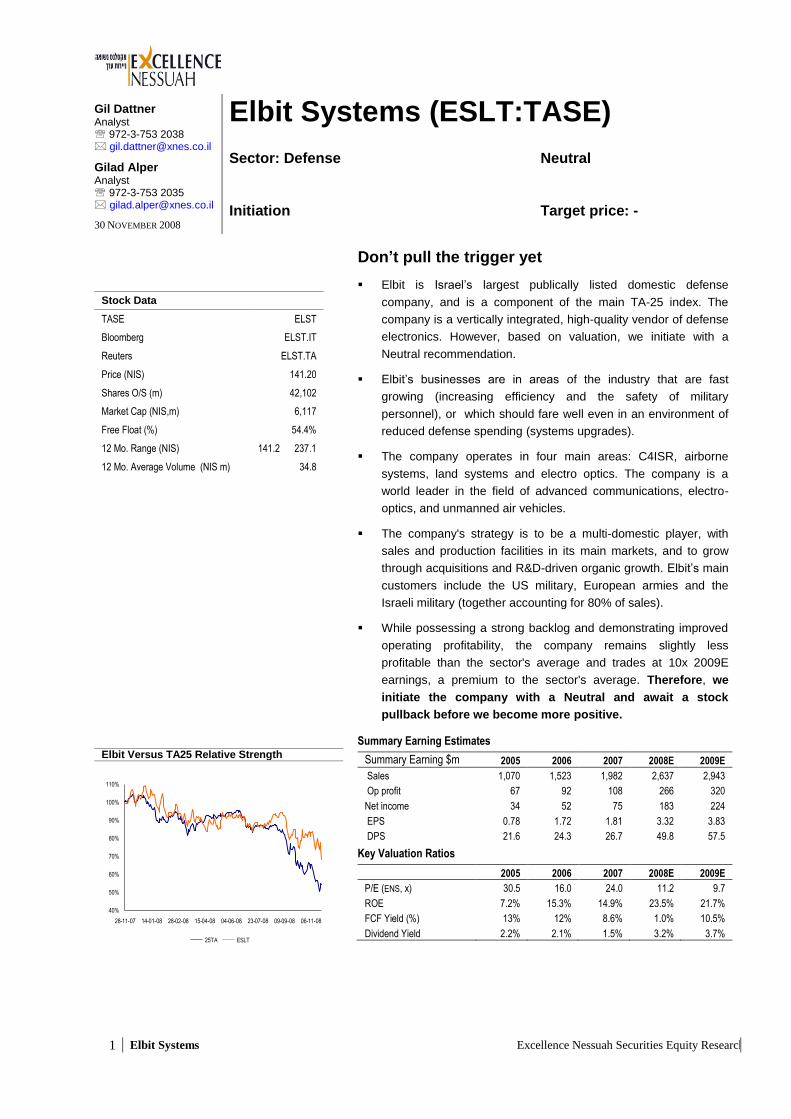
Elbit Versus TA25 Relative Strength
Summary Earning Estimates
Summary Earning $m
$MESTIMATES ($ m)
2005 2006 2007 2008E 2009E
Sales 1,070 1,523 1,982 2,637 2,943
Op profit 67 92 108 266 320
Net income 34 52 75 183 224
EPS 0.78 1.72 1.81 3.32 3.83
DPS 21.6 24.3 26.7 49.8 57.5
Key Valuation Ratios
2005 2006 2007 2008E 2009E
P/E (ENS, x) 30.5 16.0 24.0 11.2 9.7
ROE 7.2% 15.3% 14.9% 23.5% 21.7%
FCF Yield (%) 13% 12% 8.6% 1.0% 10.5%
Dividend Yield 2.2% 2.1% 1.5% 3.2% 3.7%
- - - - - - - - - - - - - - - -
TA ESLT
Don’t pull the trigger yet
2 Elbit Systems Excellence Nessuah Securities Equity Research
Investment Thesis
Elbit is Israel’s largest publically-traded defense company and is a component of the main
TA-25 index. The company is known for innovative products and is a pioneer in high-
growth sectors such as electro optics and unmanned aerial vehicles (UAV). In recent
years the company has grown rapidly through a strategy of acquisitions, and has
successfully developed its international business (today only 20% of revenues come from
the domestic market) employing a multi-domestic business model suited to the industry.
From an investor point of view we see the following pros and cons to owning Elbit shares:
Pros:
The defense sector is relatively defensive in that it is based on government spending
rather than private consumption. With unemployment on the rise and private
consumption on the decline, governments will be less likely to cut spending in ways
that could hurt the local industry and further exacerbate unemployment levels.
While the new administration in the US may hope to rein in defense spending, history
teaches us that in times of extreme economical hardships, hostilities are more likely
to erupt. Despite attention being focused on the current economic turmoil, the global
geopolitical picture has been characterised by increasing tensions in recent years. A
quality defence company could be a good hedge.
Even if global defense spending slows, Elbit’s businesses are countercyclical, or
exist in areas that should continued to benefit from strong growth. The company
offers improved efficiency technology, products that reduce the risk to military
personnel (not a luxury in the era of post-heroic warfare), and system upgrades,
which should perform well when Governments decide to reduce spending by
prolonging the life of existing equipment.
Elbit is a multi-domestic company with subsidiaries and production facilities in its
main markets. In an industry where, for national security reasons, imports are
minimal, a local presence is a key success factor.
The increasing success of Elbit’s solutions has placed the company on a positive
trajectory. Its backlog (despite a small and possibly temporary 3Q08 setback) is
increasing and accounts for 75% of 2009E revenues, providing impressive visibility in
the current macroeconomic environment. In addition, Elbit exhibited a strong
operating margin improvement, form ~7% in 2007 (net of x-items), to ~10% in 2008E.
The company is predominantly held by a relatively loyal domestic shareholder base.
It is not widely held by foreign investors, allowing for some upside in terms of
ownership expansion.
Cons:
The new Democratic US administration could usher in a period of significantly
reduced defense budgets among Western governments. With the US and Europe
jointly accounting for 60% of Elbit's revenues, it is hard to see the company entirely
escaping the brunt of such an eventuality.
Elbit is amongst the most expensive companies in its peer group when compared by
earnings multiples, and even when measured on a PEG basis the company is
relatively expensive. Also it is not the most profitable company in the group due to its
prolific product offering and the resulting absence of significant economies of scale.

3 Elbit Systems Excellence Nessuah Securities Equity Research
Introduction
Elbit Systems is Israel’s leading non-governmental defense company, specialising in
defense electronics. It is a vertically integrated company with an emphasis on R&D.
Lagging 12 month revenue based on 3Q08 results was $2.5bn, with a current backlog of
$4.9bn. The company has 11,000 employees and significant operations in ten countries
around the world.
Elbit’s major business activities are defense and commercial airborne systems and
simulators, unmanned vehicles, homeland security, data link and radio communication,
digital army programmes, electronic warfare and countermeasures, combat vehicle
systems, intelligence surveillance and electro-optic systems, and naval systems. The
major segments within the company are C4ISR systems (Command, Control,
Communications, Computers, Intelligence, Surveillance and Reconnaissance), land
systems, airborne systems, and electro-optic systems.
What connects between these different activities is they contain products and solutions
based on defense electronics. This is a newer and faster growing segment of the defense
industry which is aimed at increasing the efficiency and safety of military personnel. The
company produces stand alone products such as unmanned vehicles, and components
for existing and new defense platforms, such as the Lockheed Martin F35. As such, the
company’s sales derive both from new products, and from the upgrading and
refurbishment of existing platforms.
Many of Elbit’s products are the fruits of the company’s close working relationship with the
Israel Defense Forces. This relationship provides Elbit with a means of studying the
needs of its customers, and learning from its experiences. Having said that, Israel today
represents only 20% of Elbit’s revenue base. The company actively targets the major
markets of the United States and Europe.
2007 revenues by region
Source: Company data
US, 35%
Europe, 24%
Israel, 21%
Other, 19%
4 Elbit Systems Excellence Nessuah Securities Equity Research
Background
The Elbit group was formed in 1966. In 1996 Elbit Systems was spun off from its parent
company and listed on the Tel Aviv Stock Exchange and the NASDAQ exchange. It is the
only privately owned company among Israel’s four large defense companies. Israel has a
relatively large and developed defense industry, a legacy of continuous regional conflict
and the weapons embargo that was imposed by France in 1967.
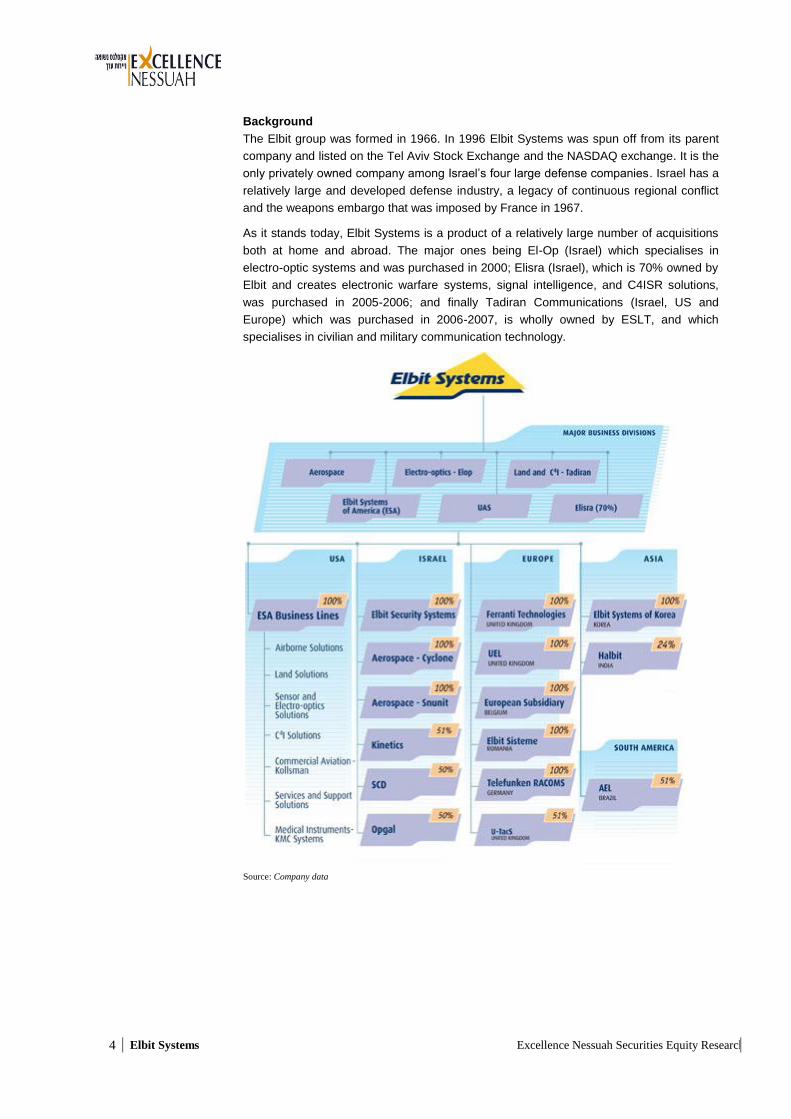
As it stands today, Elbit Systems is a product of a relatively large number of acquisitions
both at home and abroad. The major ones being El-Op (Israel) which specialises in
electro-optic systems and was purchased in 2000; Elisra (Israel), which is 70% owned by
Elbit and creates electronic warfare systems, signal intelligence, and C4ISR solutions,
was purchased in 2005-2006; and finally Tadiran Communications (Israel, US and
Europe) which was purchased in 2006-2007, is wholly owned by ESLT, and which
specialises in civilian and military communication technology.
Source: Company data
5 Elbit Systems Excellence Nessuah Securities Equity Research
Strategy
There are two main facets to Elbit Systems’ strategy. The first is to be a multi-domestic
player. Defense is one industry where, for obvious reasons, customers (usually being
Governments) prefer to work almost exclusively with companies based in the same
countries. Only 4% of the global defense budget is accounted for by imports. As such,
Elbit Systems has established subsidiaries in all of its major markets. In the US for
example, Elbit has operations in nine states, with Elbit Fort Worth (Texas) being the
company’s main US subsidiary. ESLT has 1,800 employees in the US alone with $700m
in revenues. Local presence also opens up opportunities for participation in joint projects
with other local players. We think that Elbit System’s multi-domestic strategy has been,
and will continue to be, a key factor in its ability to grow international revenue and
continue diversifying its revenue base.
Complementary to the company’s aim of being a multi-domestic player is ESLT’s
acquisition strategy. Since 1996 the company has executed 12 acquisitions. These
acquisitions have served several functions; to grow revenues, acquire knowledge and
products, and to penetrate new markets. While the potential for new acquisitions in the
short-term appears limited, the company will continue to place acquisitions at the centre
of its strategy. The current environment of falling asset prices and restricted access to
credit may yet present new opportunities, and ESLT’s very low debt levels puts it in a
good position to take advantage of opportunities.
Industry
Most of Elbit’s revenues are derived from Government contracts. Global defense
spending fell following the collapse of communism, and stagnated for most of the 1990s.
This, like many other things, was changed by the events of 9/11. Global defense
expenditure began to pick up in 2001, increasing from $903bn in 2000 to $1,327bn in
2008E (in 2006 dollar terms). About a third of this budget goes towards the purchase of
equipment, while two thirds goes to payroll, and the maintenance of both troops and
existing equipment. The budget for electronic defense is growing at twice the rate of the
overall defense spending. Elbit calculates that the total US budget for defense electronics
relevant to its business will, over the next ten years, total $770bn.
In terms of geographical split, the global defense industry is very much a concentrated
market, with the United States accounting for just under 50% of the global defense
budget. The US is followed (at a significant distance) by China, Russia, the UK and
France (according to data from the International Institute for Strategic Studies). In terms
of regions, Europe accounts for approximately one quarter of global defense spending.
Elbit’s marketing strategy closely mirrors this breakdown, with the US and Europe being
the key markets. Israel of course remains a key strategic market, while focus is also put
on certain emerging markets with faster growth rates in military spending. However, as
part of its strategy, Elbit does not market its products in certain countries, where to do so
would create a conflict of interest with its existing customers.
The industry at the moment is being driven by the global war on terror (GWOT), by the
wars in Afghanistan and Iraq that were born of this new conflict, and by initiatives of
homeland security both in the US and other countries. Given Barak Obama’s victory in
the US Presidential elections, the current economic environment and the vast sums of
money that Governments around the world are having to commit towards stabilising their
economy, we have our doubts as to whether the recent growth in defense spending will
continue. Having said that, there are good reasons to argue that Elbit will continue to see
healthy growth in demand for its product in the coming years.
6 Elbit Systems Excellence Nessuah Securities Equity Research
1. The consumption of electronic systems in defense budgets has in recent years
increased at twice the rate of overall defense expenditure. This has happened as
Governments of developed countries seek to operate more efficient and effective
armed forces, that place a higher premium on the protection of individual lives, and
which seek to apply technology in order to gain strategic and tactical advantages
over adversaries.
2. As the front-line has vanished from the face of much of modern warfare, the need for
technology to assist modern armies in conflicts has also increased dramatically.
3. The wars in Iraq and Afghanistan will continue to drive demand, both for the duration
of the conflict, and following it, as the US replaces and upgrades its equipment stock.
4. We do not, at the moment, foresee any significant lessening of geopolitical tensions.
Certainly do we see any near-term resolution to the conflict in the Middle East.
Business Units
C4ISR
Command, control, communications, computers, intelligence, surveillance and
reconnaissance systems. This segment accounted for 35% of revenue in the first nine
months of the year, making it the largest contributor to the company’s revenue base. The
products in this segment address challenges faced today not only by national defense
forces, but by many corporations and organisations: whereas once the problem was a
lack of information, today the problem is often an overload of information without the
necessary resources or abilities to interpret the data in a meaningful way so as to
facilitate better decision making. In combat situations for example, the ability to rapidly
transfer information from the field to command centres and back, in order to allow for
decision making in a way that’s quick and effective, is crucial. Such technology is also
marketed for peacekeeping efforts and for Governments to use for internal security
needs.
The products in this segment include: tactical communications, artillery C4 systems, battle
management systems, digital imagery systems, border security systems, digital army and
HQ C4I systems, Government IT systems and rugged tactical terminals.
Airborne systems
These accounted for 24% of revenues in Q1-Q3 of this year. Within this segment the
company offers aircraft and helicopter system upgrades, providing modern systems and
equipment as a solution to replacing ageing aircrafts. As such, this segment is expected
to perform well during times when Governments cut back expenditure.
Airborne systems also includes helmet mounted systems, and unmade air vehicles
(UAVs). The company offers a selection of UAVs, from the smaller variety that are carried
by soldiers and used for localised intelligence gathering in the field, to the larger and more
sophisticated UAVs that can fly missions over long ranges for long stretches of time.
UAVs, and other unmanned vehicles on land and sea, are likely to continue growing in
use and importance as they reduce risks to human, and offer effective and cost-efficient
methods of intelligence gathering.
Land systems
In the land systems segment, which accounted for 22% of revenues in Q1-Q3, Elbit offers
upgrades for land-based vehicles. The upgrades includes all functions of armoured
fighting vehicles, and specifically: fire control, turret and gun control, battle management,
life support and laser warning systems. This is another segment which should perform
reasonably well during times of reduced defense sending.
7 Elbit Systems Excellence Nessuah Securities Equity Research
Electro-Optics
Products in this segment, which accounted for 12% of revenues in the first nine months of
the year, are manufactured by El-Op, Elbit’s subsidiary in Israel purchased in 2000. El-Op
produces a full range of electro-optical sensors and systems used in space, air, land and
sea deployment. These include space cameras, specialised sensors, and reconnaissance
systems. El-OP also makes electro optic countermeasure systems, which comprise of
detection of threats and countermeasures to deal with such threats.
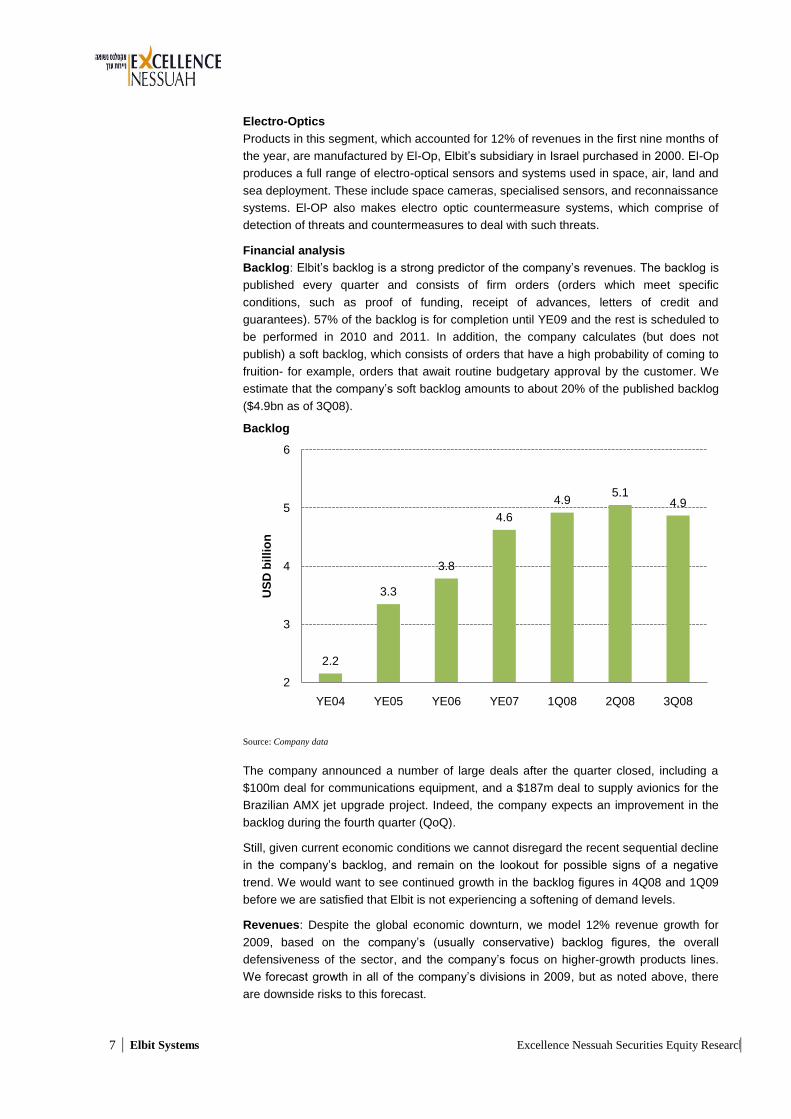
Financial analysis
Backlog: Elbit’s backlog is a strong predictor of the company’s revenues. The backlog is
published every quarter and consists of firm orders (orders which meet specific
conditions, such as proof of funding, receipt of advances, letters of credit and
guarantees). 57% of the backlog is for completion until YE09 and the rest is scheduled to
be performed in 2010 and 2011. In addition, the company calculates (but does not
publish) a soft backlog, which consists of orders that have a high probability of coming to
fruition- for example, orders that await routine budgetary approval by the customer. We
estimate that the company’s soft backlog amounts to about 20% of the published backlog
($4.9bn as of 3Q08).
Backlog
Source: Company data
The company announced a number of large deals after the quarter closed, including a
$100m deal for communications equipment, and a $187m deal to supply avionics for the
Brazilian AMX jet upgrade project. Indeed, the company expects an improvement in the
backlog during the fourth quarter (QoQ).
Still, given current economic conditions we cannot disregard the recent sequential decline
in the company’s backlog, and remain on the lookout for possible signs of a negative
trend. We would want to see continued growth in the backlog figures in 4Q08 and 1Q09
before we are satisfied that Elbit is not experiencing a softening of demand levels.
Revenues: Despite the global economic downturn, we model 12% revenue growth for
2009, based on the company’s (usually conservative) backlog figures, the overall
defensiveness of the sector, and the company’s focus on higher-growth products lines.
We forecast growth in all of the company’s divisions in 2009, but as noted above, there
are downside risks to this forecast.
2.2
3.3
3.8
4.6
4.95.1
4.9
2
3
4
5
6
YE04 YE05 YE06 YE07 1Q08 2Q08 3Q08
US
D b
illi
on
8 Elbit Systems Excellence Nessuah Securities Equity Research
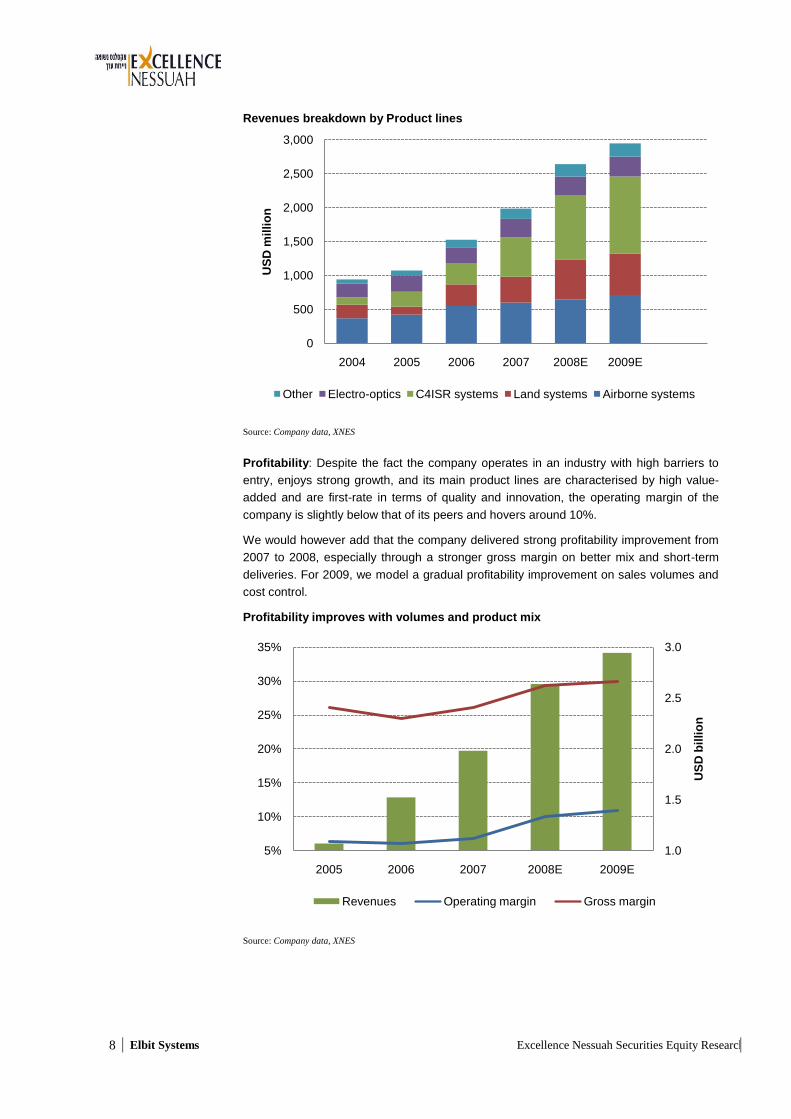
Revenues breakdown by Product lines
Source: Company data, XNES
Profitability: Despite the fact the company operates in an industry with high barriers to
entry, enjoys strong growth, and its main product lines are characterised by high value-
added and are first-rate in terms of quality and innovation, the operating margin of the
company is slightly below that of its peers and hovers around 10%.
We would however add that the company delivered strong profitability improvement from
2007 to 2008, especially through a stronger gross margin on better mix and short-term
deliveries. For 2009, we model a gradual profitability improvement on sales volumes and
cost control.
Profitability improves with volumes and product mix
Source: Company data, XNES
0
500
1,000
1,500
2,000
2,500
3,000
2004 2005 2006 2007 2008E 2009E
US
D m
illi
on
Other Electro-optics C4ISR systems Land systems Airborne systems
1.0
1.5
2.0
2.5
3.0
5%
10%
15%
20%
25%
30%
35%
2005 2006 2007 2008E 2009E
US
D b
illi
on
Revenues Operating margin Gross margin
9 Elbit Systems Excellence Nessuah Securities Equity Research
The chief reason behind Elbit's seemingly disappointing profitability is the variety of its
product mix. The company boasts a rich product offering with high vertical integration,
making Elbit much more self-sufficient than its peers. To put it differently, Elbit offers a
product range of a company twice its size. This characteristic is a legacy and function of
being an Israeli defense company. While it offers certain advantages, economies of scale
and higher profitability are not one of them.
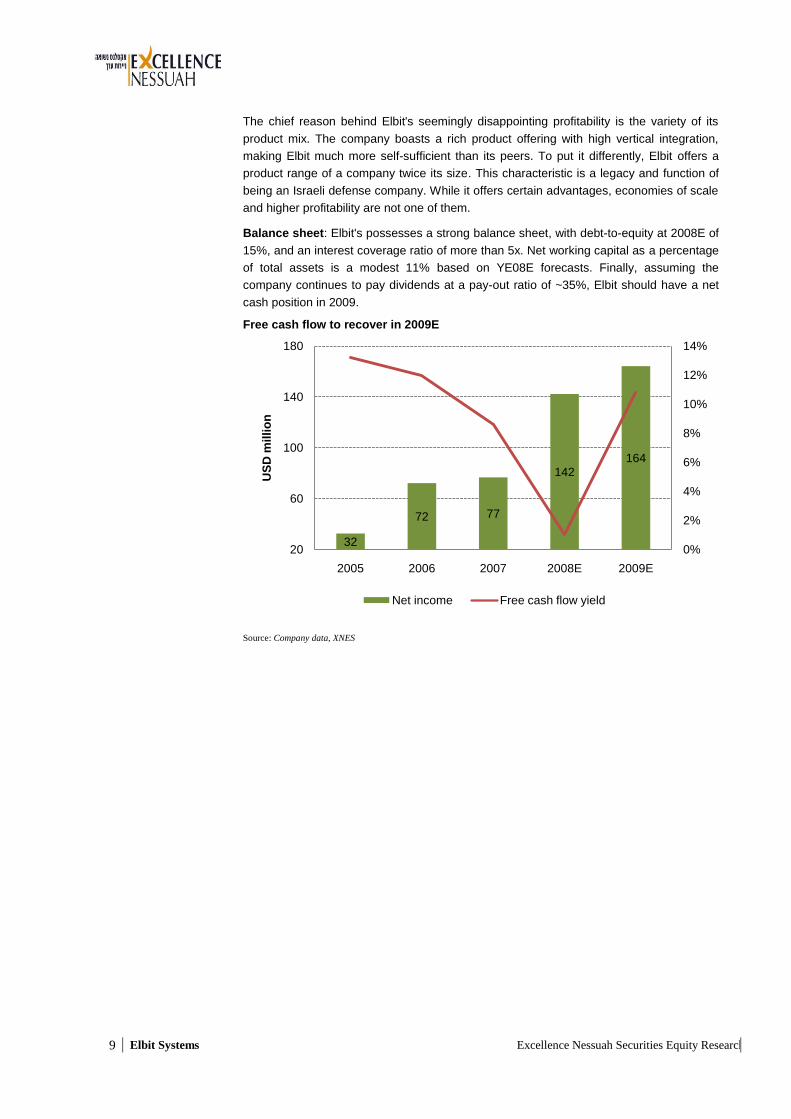
Balance sheet: Elbit's possesses a strong balance sheet, with debt-to-equity at 2008E of
15%, and an interest coverage ratio of more than 5x. Net working capital as a percentage
of total assets is a modest 11% based on YE08E forecasts. Finally, assuming the
company continues to pay dividends at a pay-out ratio of ~35%, Elbit should have a net
cash position in 2009.
Free cash flow to recover in 2009E
Source: Company data, XNES
32
72 77
142164
0%
2%
4%
6%
8%
10%
12%
14%
20
60
100
140
180
2005 2006 2007 2008E 2009E
US
D m
illi
on
Net income Free cash flow yield

10 Elbit Systems Excellence Nessuah Securities Equity Research
Valuation
Operating
margin 2007
P/E
Company Ticker Market cap, $ 2008E 2009E
Rockwell Collins COL 5,246 20% 5.0 4.8
Finmeccanica FNC 9,326 8% 6.7 6.5
Thales HO 9,793 6% 9.9 8.5
Honeywell HON 19,661 11% 7.2 7.6
Lockheed Martin LMT 29,457 10% 9.5 9.2
Harris HRS 4,630 13% 8.4 7.6
Goodrich GR 3,998 14% 6.5 6.3
Alliant Techsys ATK 2,619 10% 10.6 9.4
Orbital Sciences ORB 984 8% 17.0 19.0
Esterline Tech ESL 1,039 9% 9.7 8.9
Average
11% 9.1 8.8
Elbit Systems ESLT 1,543 7% -10% 11.6 10.1
Like most peer groups, this one is not perfect. We built a mix of large-cap defense
companies and smaller one that are more similar to Elbit's size. The businesses mix of
these companies, however, does not match Elbit’s. They are, however, all part of the
defense industry, and are sufficiently close in nature to provide a reasonable valuation
yardstick.
As the peer group table shows, Elbit is not among the cheapest of the group. Nor is it the
most profitable. Admittedly, the 2007 profitability figure is misleading as the company
exhibited an impressive margin expansion in 2008 (on volumes and mix). However, even
with the 2008E 10% operating margin plugged in, and growth levels accounted for, we
find it hard to justify Elbit's relatively rich earnings multiples.
Our DCF, based on a 9% WACC and 2% perpetual growth rate, yields a 15% upside to
the current share price. Read in conjunction with the peer model, the DCF price does not
offer sufficient upside to merit a buy recommendation. Based on this and the uninspiring
peer group valuation, we initiate the company with a Neutral recommendation.
11 Elbit Systems Excellence Nessuah Securities Equity Research
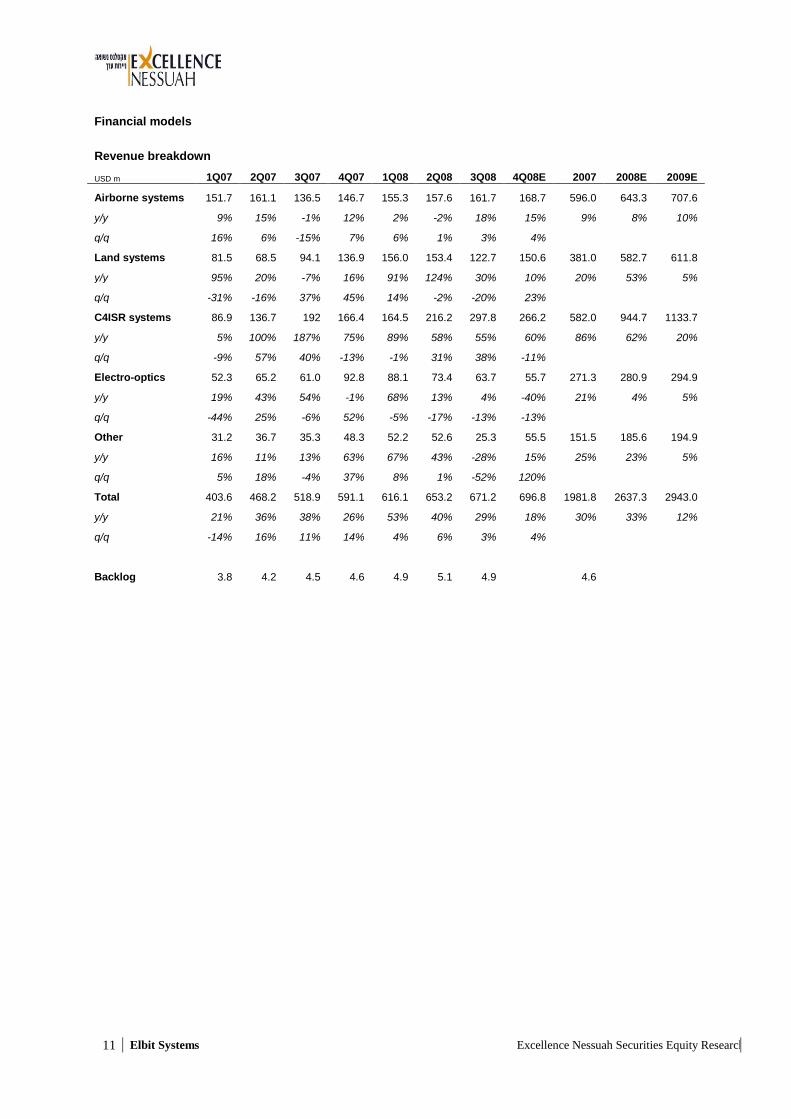
Financial models
Revenue breakdown
USD m 1Q07 2Q07 3Q07 4Q07 1Q08 2Q08 3Q08 4Q08E 2007 2008E 2009E
Airborne systems 151.7 161.1 136.5 146.7 155.3 157.6 161.7 168.7 596.0 643.3 707.6
y/y 9% 15% -1% 12% 2% -2% 18% 15% 9% 8% 10%
q/q 16% 6% -15% 7% 6% 1% 3% 4%
Land systems 81.5 68.5 94.1 136.9 156.0 153.4 122.7 150.6 381.0 582.7 611.8
y/y 95% 20% -7% 16% 91% 124% 30% 10% 20% 53% 5%
q/q -31% -16% 37% 45% 14% -2% -20% 23%
C4ISR systems 86.9 136.7 192 166.4 164.5 216.2 297.8 266.2 582.0 944.7 1133.7
y/y 5% 100% 187% 75% 89% 58% 55% 60% 86% 62% 20%
q/q -9% 57% 40% -13% -1% 31% 38% -11%
Electro-optics 52.3 65.2 61.0 92.8 88.1 73.4 63.7 55.7 271.3 280.9 294.9
y/y 19% 43% 54% -1% 68% 13% 4% -40% 21% 4% 5%
q/q -44% 25% -6% 52% -5% -17% -13% -13%
Other 31.2 36.7 35.3 48.3 52.2 52.6 25.3 55.5 151.5 185.6 194.9
y/y 16% 11% 13% 63% 67% 43% -28% 15% 25% 23% 5%
q/q 5% 18% -4% 37% 8% 1% -52% 120%
Total 403.6 468.2 518.9 591.1 616.1 653.2 671.2 696.8 1981.8 2637.3 2943.0
y/y 21% 36% 38% 26% 53% 40% 29% 18% 30% 33% 12%
q/q -14% 16% 11% 14% 4% 6% 3% 4%
Backlog 3.8 4.2 4.5 4.6 4.9 5.1 4.9
4.6
12 Elbit Systems Excellence Nessuah Securities Equity Research
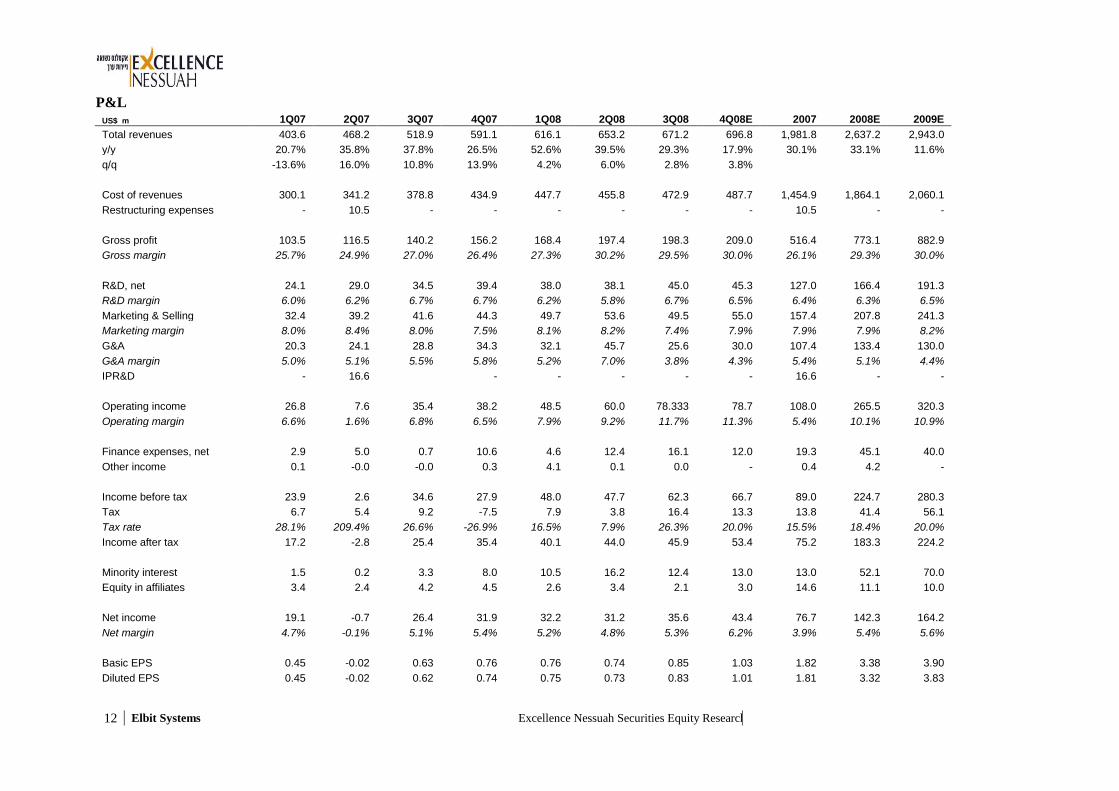
P&L US$ m 1Q07 2Q07 3Q07 4Q07 1Q08 2Q08 3Q08 4Q08E 2007 2008E 2009E
Total revenues 403.6 468.2 518.9 591.1 616.1 653.2 671.2 696.8 1,981.8 2,637.2 2,943.0
y/y 20.7% 35.8% 37.8% 26.5% 52.6% 39.5% 29.3% 17.9% 30.1% 33.1% 11.6%
q/q -13.6% 16.0% 10.8% 13.9% 4.2% 6.0% 2.8% 3.8%
Cost of revenues 300.1 341.2 378.8 434.9 447.7 455.8 472.9 487.7 1,454.9 1,864.1 2,060.1
Restructuring expenses - 10.5 - - - - - - 10.5 - -
Gross profit 103.5 116.5 140.2 156.2 168.4 197.4 198.3 209.0 516.4 773.1 882.9
Gross margin 25.7% 24.9% 27.0% 26.4% 27.3% 30.2% 29.5% 30.0% 26.1% 29.3% 30.0%
R&D, net 24.1 29.0 34.5 39.4 38.0 38.1 45.0 45.3 127.0 166.4 191.3
R&D margin 6.0% 6.2% 6.7% 6.7% 6.2% 5.8% 6.7% 6.5% 6.4% 6.3% 6.5%
Marketing & Selling 32.4 39.2 41.6 44.3 49.7 53.6 49.5 55.0 157.4 207.8 241.3
Marketing margin 8.0% 8.4% 8.0% 7.5% 8.1% 8.2% 7.4% 7.9% 7.9% 7.9% 8.2%
G&A 20.3 24.1 28.8 34.3 32.1 45.7 25.6 30.0 107.4 133.4 130.0
G&A margin 5.0% 5.1% 5.5% 5.8% 5.2% 7.0% 3.8% 4.3% 5.4% 5.1% 4.4%
IPR&D - 16.6
- - - - - 16.6 - -
Operating income 26.8 7.6 35.4 38.2 48.5 60.0 78.333 78.7 108.0 265.5 320.3
Operating margin 6.6% 1.6% 6.8% 6.5% 7.9% 9.2% 11.7% 11.3% 5.4% 10.1% 10.9%
Finance expenses, net 2.9 5.0 0.7 10.6 4.6 12.4 16.1 12.0 19.3 45.1 40.0
Other income 0.1 -0.0 -0.0 0.3 4.1 0.1 0.0 - 0.4 4.2 -
Income before tax 23.9 2.6 34.6 27.9 48.0 47.7 62.3 66.7 89.0 224.7 280.3
Tax 6.7 5.4 9.2 -7.5 7.9 3.8 16.4 13.3 13.8 41.4 56.1
Tax rate 28.1% 209.4% 26.6% -26.9% 16.5% 7.9% 26.3% 20.0% 15.5% 18.4% 20.0%
Income after tax 17.2 -2.8 25.4 35.4 40.1 44.0 45.9 53.4 75.2 183.3 224.2
Minority interest 1.5 0.2 3.3 8.0 10.5 16.2 12.4 13.0 13.0 52.1 70.0
Equity in affiliates 3.4 2.4 4.2 4.5 2.6 3.4 2.1 3.0 14.6 11.1 10.0
Net income 19.1 -0.7 26.4 31.9 32.2 31.2 35.6 43.4 76.7 142.3 164.2
Net margin 4.7% -0.1% 5.1% 5.4% 5.2% 4.8% 5.3% 6.2% 3.9% 5.4% 5.6%
Basic EPS 0.45 -0.02 0.63 0.76 0.76 0.74 0.85 1.03 1.82 3.38 3.90
Diluted EPS 0.45 -0.02 0.62 0.74 0.75 0.73 0.83 1.01 1.81 3.32 3.83
13 Elbit Systems Excellence Nessuah Securities Equity Research
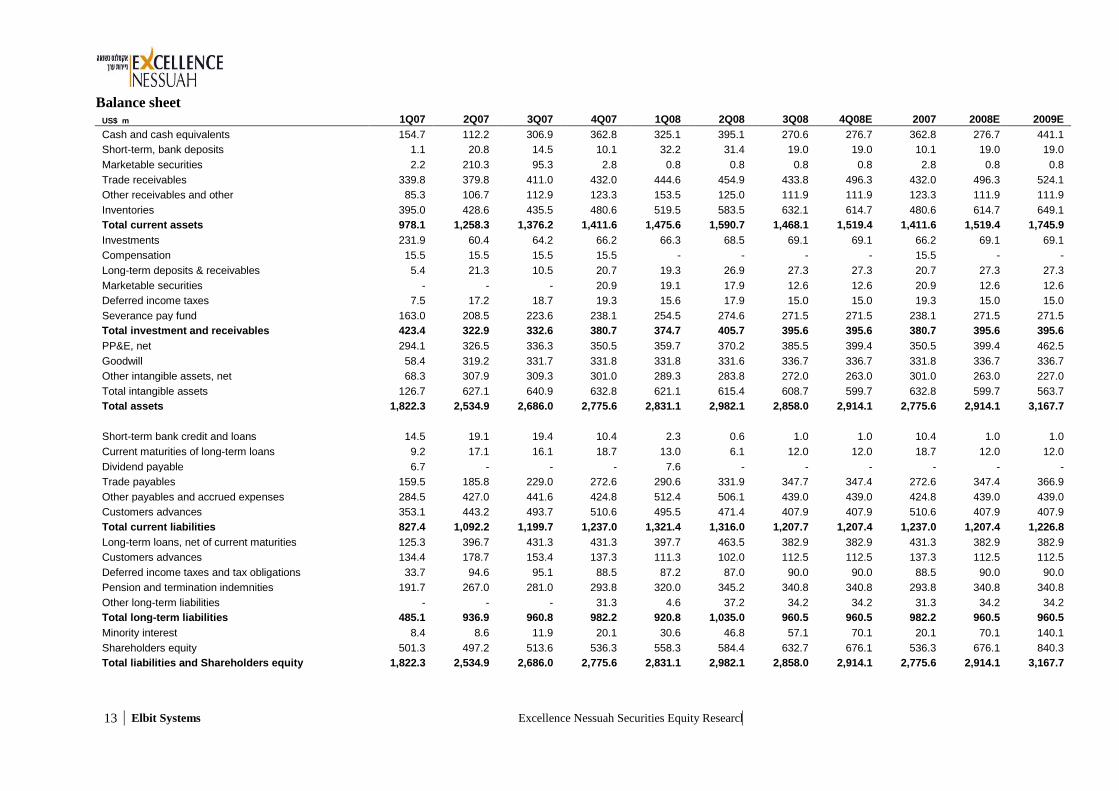
Balance sheet US$ m 1Q07 2Q07 3Q07 4Q07 1Q08 2Q08 3Q08 4Q08E 2007 2008E 2009E
Cash and cash equivalents 154.7 112.2 306.9 362.8 325.1 395.1 270.6 276.7 362.8 276.7 441.1
Short-term, bank deposits 1.1 20.8 14.5 10.1 32.2 31.4 19.0 19.0 10.1 19.0 19.0
Marketable securities 2.2 210.3 95.3 2.8 0.8 0.8 0.8 0.8 2.8 0.8 0.8
Trade receivables 339.8 379.8 411.0 432.0 444.6 454.9 433.8 496.3 432.0 496.3 524.1
Other receivables and other 85.3 106.7 112.9 123.3 153.5 125.0 111.9 111.9 123.3 111.9 111.9
Inventories 395.0 428.6 435.5 480.6 519.5 583.5 632.1 614.7 480.6 614.7 649.1
Total current assets 978.1 1,258.3 1,376.2 1,411.6 1,475.6 1,590.7 1,468.1 1,519.4 1,411.6 1,519.4 1,745.9
Investments 231.9 60.4 64.2 66.2 66.3 68.5 69.1 69.1 66.2 69.1 69.1
Compensation 15.5 15.5 15.5 15.5 - - - - 15.5 - -
Long-term deposits & receivables 5.4 21.3 10.5 20.7 19.3 26.9 27.3 27.3 20.7 27.3 27.3
Marketable securities - - - 20.9 19.1 17.9 12.6 12.6 20.9 12.6 12.6
Deferred income taxes 7.5 17.2 18.7 19.3 15.6 17.9 15.0 15.0 19.3 15.0 15.0
Severance pay fund 163.0 208.5 223.6 238.1 254.5 274.6 271.5 271.5 238.1 271.5 271.5
Total investment and receivables 423.4 322.9 332.6 380.7 374.7 405.7 395.6 395.6 380.7 395.6 395.6
PP&E, net 294.1 326.5 336.3 350.5 359.7 370.2 385.5 399.4 350.5 399.4 462.5
Goodwill 58.4 319.2 331.7 331.8 331.8 331.6 336.7 336.7 331.8 336.7 336.7
Other intangible assets, net 68.3 307.9 309.3 301.0 289.3 283.8 272.0 263.0 301.0 263.0 227.0
Total intangible assets 126.7 627.1 640.9 632.8 621.1 615.4 608.7 599.7 632.8 599.7 563.7
Total assets 1,822.3 2,534.9 2,686.0 2,775.6 2,831.1 2,982.1 2,858.0 2,914.1 2,775.6 2,914.1 3,167.7
Short-term bank credit and loans 14.5 19.1 19.4 10.4 2.3 0.6 1.0 1.0 10.4 1.0 1.0
Current maturities of long-term loans 9.2 17.1 16.1 18.7 13.0 6.1 12.0 12.0 18.7 12.0 12.0
Dividend payable 6.7 - - - 7.6 - - - - - -
Trade payables 159.5 185.8 229.0 272.6 290.6 331.9 347.7 347.4 272.6 347.4 366.9
Other payables and accrued expenses 284.5 427.0 441.6 424.8 512.4 506.1 439.0 439.0 424.8 439.0 439.0
Customers advances 353.1 443.2 493.7 510.6 495.5 471.4 407.9 407.9 510.6 407.9 407.9
Total current liabilities 827.4 1,092.2 1,199.7 1,237.0 1,321.4 1,316.0 1,207.7 1,207.4 1,237.0 1,207.4 1,226.8
Long-term loans, net of current maturities 125.3 396.7 431.3 431.3 397.7 463.5 382.9 382.9 431.3 382.9 382.9
Customers advances 134.4 178.7 153.4 137.3 111.3 102.0 112.5 112.5 137.3 112.5 112.5
Deferred income taxes and tax obligations 33.7 94.6 95.1 88.5 87.2 87.0 90.0 90.0 88.5 90.0 90.0
Pension and termination indemnities 191.7 267.0 281.0 293.8 320.0 345.2 340.8 340.8 293.8 340.8 340.8
Other long-term liabilities - - - 31.3 4.6 37.2 34.2 34.2 31.3 34.2 34.2
Total long-term liabilities 485.1 936.9 960.8 982.2 920.8 1,035.0 960.5 960.5 982.2 960.5 960.5
Minority interest 8.4 8.6 11.9 20.1 30.6 46.8 57.1 70.1 20.1 70.1 140.1
Shareholders equity 501.3 497.2 513.6 536.3 558.3 584.4 632.7 676.1 536.3 676.1 840.3
Total liabilities and Shareholders equity 1,822.3 2,534.9 2,686.0 2,775.6 2,831.1 2,982.1 2,858.0 2,914.1 2,775.6 2,914.1 3,167.7
14 Elbit Systems Excellence Nessuah Securities Equity Research
Ratings Key
1. Buy: Expected to outperform the relevant broader market index over the next 12-18 months. 2. Neutral: Expected to perform in-line with the relevant broader market index over the next 6-12 months. 3. Sell: Expected to underperform the relevant broader market index over the next 6-12 months.
Disclaimer and Disclosures Analysts Information
Name Gil Dattner
License type Investment advisory License number 8185
Address 7 Jabotinsky Street Ramat Gan 52520 Israel
Education
Master in International Business Administration (2006), Tel Aviv University B.A Modern History (1998), Queen Mary & Westfield College, London Experience
Gil Dattner has been working as an analyst at Excellence Nessuah Brokerage Services since 2007 Name Gilad Alper
License type Investment marketing License number 3995
Address 7 Jabotinsky Street Ramat Gan 52520 Israel
Education
B.A Economics (1995), Magna Cum Laude, Tel Aviv University Master in International Business Administration (1998), The Norwegian School for Economics and Business Administration Experience
Gilad Alper is an analyst of 10 years and served at a number of international investment banks including Commerzbank Securities (London) and Merrill Lynch (NY). Licensed broker:
Excellence Nessuah Brokerage Services Ltd. 7 Jabotinsky Street Ramat Gan 52520 Israel Conflict of interest - Analyst
At date of preparation of this report, the analysts are not aware of any conflict of interest with respect to the company that is covered in this report. Information regarding analysis
Valuation methodology
Using our earnings forecasts and historical data, we base our valuation on a DCF, a comparative model, and a sum-of-the-parts model.

15 Elbit Systems Excellence Nessuah Securities Equity Research
Risks
1. The company is vulnerable to cycles and trends in global defense budgets. 2. The company is vulnerable to unexpected political factors.
Analyst Certification
We, Gil Dattner and Gilad Alper, certify that views expressed in this report accurately reflect our personal views about the subject securities and issuer. We also certify that we have not and will not receive any compensation for providing specific recommendations or views expressed in this report.
16 Elbit Systems Excellence Nessuah Securities Equity Research
Disclosure – Excellence Nessuah Brokerage Services Ltd (the 'Company') Conflicts of interest
1. This report was published as an initiation of coverage. 2. At the time of publishing this report, or in the 30 days previous to this report, the company or companies
associated with it, held in its Nostro or managed accounts, significant holdings in the securities of the company analysed, or companies associated with it.
Disclaimer
The analysis included in this report is for informational purposes only and is offered for the knowledge of investment advisors solely as background information that may be used as one of a number of tools that are available to help such persons formulate recommendations to their clients, with whom they have signed consulting agreements, as required under the law. This report and/or the information contained herein and/or the analysis provided herein should not be considered as an offer and/or advice to purchase and/or sell and/or hold the securities and/or the financial assets described herein or any other securities and/or financial assets. This document is presented solely for the use of professional and experienced investors as defined in the First Schedule of the Israel Securities Law (1968), who make their investment decisions without relying on this document, or on any documentation related to it. Companies within the Excellence Nessuah Group, its directors, managers and workers, take no responsibility for any direct or circumstantial loss that may arise from use of this document or any documents related to it. The analysis presented herein was performed on the basis of information that was published and/or that was made available to the entire public, including information that was collected and prepared by the Company and information that originates from other sources that the Company assumes to be reliable, although no independent investigation as to the credibility of such was made by the Company. This report does not constitute a written proof and/or approval as to the credibility of such information. The information presented in this report does not claim to include all the information that an investor would require, and does not claim to constitute a complete analysis of all of the facts and details that appear in the report, and the opinions presented herein may change without prior notice. Accordingly, this report does not constitute in any way a substitute for investment advising that would take into consideration the figures and special needs of each person. Anyone who relies upon the information presented in this report does so at he's own risk and the Company, companies controlled by the Company and their shareholders, managers and employees, shall not bear any liability whatsoever for any damage and/or loss that may be caused as a result of using this report, and shall not guarantee or bear any responsibility whatsoever for the reliability of the information presented in this report. It should be noted that the Excellence Nessuah Brokerage (the Company) Services Ltd is part of the Excellence Group, which is part of the Delek Group. Excellences Group businesses include, inter alia, the management of investment portfolios, securities trade, stock market transactions, and investment banking. Furthermore, companies controlled by the Company and it's shareholders, or other related parties hold or may hold, from time to time, either directly or indirectly, securities or financial instruments that are the subject of this report, either before they are published, at the time they are published or after they are published. In addition, by virtue of the fact that the Company, companies held by the Company, the Company’s shareholders, or other related parties are entities that serve as underwriters or in the area of investment advising, portfolio management, or investment marketing, such entities may act as underwriters for the securities of the Company that is the subject of this report, and may be related to the Company by virtue of commercial ties. In addition, the Company serves as a market maker with regard to the securities of various companies, pursuant to the approval granted by the Tel Aviv Securities Exchange Ltd., and may use at any date as market maker with regard to the securities of the Company that is the subject of this report. All rights contained in this report are the property of the Company. This report is designated for the recipient
whose name appears above, and any transfer of portions of this report or publication of any kind, without the
advanced, expressed, written approval of the Company, and without including this provision in the text of the
report in a prominent place, is strictly prohibited, unless noted otherwise.
17 Elbit Systems Excellence Nessuah Securities Equity Research
Excellence Nessuah Securities Contact Page
CEO, Excellence Nessuah Securities Ron Sireni
Telephone ++ 972 3 753 2020
Email [email protected]
Research Department
Senior Analyst Terence Klingman
Telephone ++972 3 753 6940
Mobile ++972 54 900 1047
Email [email protected]
Senior Analyst Gilad Alper
Telephone ++972 3 753 2035
Mobile ++972 54 245 0342
Email [email protected]
Analyst Gil Dattner
Telephone ++ 972 3 753 2038
Mobile ++ 972 54 900 1004
Email [email protected]
Chief Macro Economist Shlomo Maoz
Telephone ++ 972 3 753 2068
Mobile ++ 972 50 727 6772
Email [email protected]
Sales & Trading Department
International Sales Dan Farhi
Telephone ++ 972 3 753 2058
Mobile ++ 972 54 521 1353
Email [email protected]
International Sales Sarah Jane Ross
Telephone ++ 972 3 753 6540
Mobile ++972 54 800 2155
Email [email protected]
Head Trader Roy Laufer
Telephone ++ 972 3 753 2047
Mobile ++ 972 54 355 051
Email [email protected]
Trader Ira Shlomowitz Telephone ++ 972 3 753 2072 Email [email protected]