Embed Size (px)
Citation preview
EITI Mozambique
Extractive Industry Transparency Initiative
Third Reconciliation Report – Year 2010
Ernst & Young, Lda. Rua Belmiro Obadias Muianga, 179 Caixa Postal 366 - Maputo Moçambique Tel: +258 (21)35 3000 Fax: +258 (21)32 1984
www.ey.com/mz
A member firm of Ernst & Young Global Limited
Dear Sir,
Following your request, and in accordance with the terms of the contract entered with you,
we hereby have the pleasure of submitting draft of the third reconciliation report of payments
made by the extractive industry.
Hoping that this report meets your expectations we are available to provide you with any
additional clarifications that you may deem necessary.
Yours sincerely
ISMAEL FAQUIR
Partner
To:
EITI – Extractive Industry Transparency Initiative
Att: Mr. Benjamim Chilenge
Avenida Amílcar Cabral, n.º 1349 R/C
MAPUTO
Maputo, 26 December 2012 2
REF N.º 3626/TAX/EY/2012
Subject: Reconciliation Report – Year 2010
1
This document was prepared on the basis of the requirements and information provided by you, with reference to your context and taking into consideration the current legal and economic environment.
Our findings were made on the basis of our methods, processes, techniques and know-how. In this context, the same together with the support means are the property of Ernst & Young. The decision to implement them or not, as well as the methods of implementation, are of your responsibility.
This opinion, its form and content, which are reserved to your exclusive use, are confidential and may only be disclosed to third parties with our agreement. However, Ernst & Young expressly authorizes that the same be communicated to persons to which the same respect, without us taking any responsibility before third parties.
This report is prepared in the terms of the agreement entered with you.
2
Table of Contents
1 Executive Summary 8
5,37% 9
Subtotal 9
574.282.678,89 9
588.970.228,79 9
14.687.549,90 9
2,49% 9
2 Introduction 11
3 Methodology 13
3.1 Objective 13
3.2 Scope 13
4 Extractive Industry in Mozambique 17
5 Companies Selected in the Extractive Sector 20
5.1 Companies in the Mining Sector 20
5.2 Companies in the Hydrocarbons Sector 21
5.3 Comparative Analysis 21
6 Taxes, Fees and Contributions 24
6.1 Taxes of the Mozambican Tax System 24
6.1.1 National Tax System 25
6.1.2 Direct Taxation of Income and Wealth: 25
6.1.3 Indirect Taxation of Expenses: 26
6.2 Municipal Tax System 27
6.2.1 Vehicles Tax 27
6.2.2 Property Transfer Tax (SISA) 28
3
6.2.3 Personal Municipal Tax 28
6.2.4 Municipal Real Estate Tax 28
6.2.5 Other Municipal Revenue 28
6.3 Taxes and Fees Specific to the Extractive Industry 29
6.3.1 Surface Tax 29
6.3.2 Mining Production Tax 30
6.3.3 Petroleum Production Tax 31
6.3.4 Service Fees 31
6.4 Other payments and contributions in the extractive sector 32
6.5 Revenue to be considered for the study 32
7 Entities responsible for the collection 34
8 Reconciliation Process 35
8.1 Companies that did not Reply to the Reporting Template 35
8.2 Amounts Declared by the Companies and by the State Institutions 37
8.2.1 Mining Sector 38
8.2.2 Hydrocarbons Sector 40
8.3 Amounts per Tax 41
8.3.1 Individual Income Tax (IRPS) ( amounts in meticais) 42
8.3.2 Corporate Income Tax (IRPC) (amounts in meticais) 45
8.3.3 Surface Tax (amounts in meticais) 52
8.3.4 Tax on Mining / Petroleum Production (amounts in meticais) 54
8.3.5 Institutional Capacity Building Fund (amount in meticais) 57
8.3.6 Contributions to the Institutional Capacity Building Fund (amounts in meticais) 59
8.3.7 Environmental License (amounts in meticais) 61
8.3.8 Non-Reconcilable Payments (amounts in meticais) 63
9 Summary of the Reconciliation 65
9.1 Overall 65
9.2 Details of the Reconciliation 66
10 Review of the Information used for the Reconciliation 69
10.1 Reporting Templates 69
4
10.2 Information Made Available by the State Institutions 69
10.3 Information Provided by the Companies 70
11 Conclusions and Recommendations 71
11.1 Conclusions 71
11.2 Recommendations 72
12 Annexure I: Terms of Reference 74
5
Annexure:
- Annexure I: Terms of Reference RFP n.º 01/MIREM/ITIE/2012/CS;
- Annexure II: Inspection Letter from the Ministry of Mineral Resources (MIREM)
6
Abbreviations
AG – Silver
AQU – Aquamarine
AU – Gold
BER – Beryl
BI – Bismuth
BME – Basic Metals
BM – Bank of Mozambique
CAS – Cassiterite
CB – Columbite
COA – Coal
COM – Coal and Related Minerals
CU – Copper
DIA - Diamond
DOT – Dolerite
DGI – General Directorate of Taxes
DNM – National Directorate of Mining
EITI – Extractive Industry Transparency Initiative
EME – Emerald
FE – Iron
GAR – Garnet
GEM – Gems
GRP – Graphite
GYP – Gypsum
GJ - Gigajoule
HSA – Heavy Sands
ILM – Ilmenite
INP – National Petroleum Institute
IRPS – Personal Income Tax
IRPC – Corporate Income Tax
IVA – Value Added Tax
LI – Lithium
LST – Limestone
MA – Manganese
MI – Related Minerals
MIREM – Ministry of Mineral Resources
7
MNP – Precious Minerals
MNS – Semi Precious Minerals
MOR – Semi Precious Minerals
MPS – Precious and Semi Precious Minerals
NB – Niobium
NI – Nickel
PB – Lead
PD – Palladium
PHO – Phosphate
PME – Precious Metals
PT – Platinum
REE – Rare Lands
RUT – Rutile
SAN – Sand
STO – Construction stone
TAM – Tantalite and Related Minerals
TAN – Tantalite
TI – Titanium
TOP – Topaz
TOU – Tourmaline
U – Uranium
V – Vanadium
ZN – Zinc
ZR – Zircon
8
1 Executive Summary
After preparing two reconciliation reports of payments made by the extractive industry, EITI-M (Extractive Industry Transparency Initiative - Mozambique) proceeds with the reconciliation process by launching the report of the payments made in year 2010.
The third reconciliation report of payments made by the extractive industry was prepared within the scope of EITI-M during the period from 30 July 2012 to 20 December 2012, by Ernst & Young Mozambique as per terms of reference RFP n.º 01/MIREM/ITIE/2012/CS.
The exercise consisted in the reconciliation of the payments made by the companies operating in the mining and oil sectors previously selected, with the revenues reported by state institutions in charge of the collection, during calendar year 2012.
This reconciliation of payments demonstrates, in our opinion, the will to implement and improve even more the procedures and control standards, which unambiguously shows the commitment of the country with regards to the transparent management of the revenue generated by the extractive industry.
The main conclusions of the reconciliation are the following:
► The number of companies that replied to the reporting templates (44) was lower than the 46 companies initially selected (the Scoping Study mentioned 47 companies but the two entities appearing under Anadarko in the data provided by the INP were aggregated as the same consist of a single company holding two concessions);
► The deadline to reply to the reporting templates (30 days), save for few exceptions, was not met by the companies. In fact, similarly to what happened in the previous reconciliation process, regular and continuous follow up was required with some companies in order to obtain the completed reporting templates.
► Despite the fact that a training workshop for clarifications on the completion of the reporting templates was conducted, at which it was even explained where to find the information on the amounts paid, we found that the companies, as well as the DGI, experienced difficulties in the completion of the reporting templates. For example, in some instances, reporting templates were completed with information on payments for the financial year to which the same referred and not the actual date of payment / disbursement.
► Save for few exceptions, the companies provided copies of the support documentation of the amounts in the reporting templates, which enabled us to validate the information provided. For the companies that did not sent us the support documentation, we requested them to provide a certification by their external auditors and, for the companies which accounts were not audited, the information was validated based on the print outs provided by DGI.
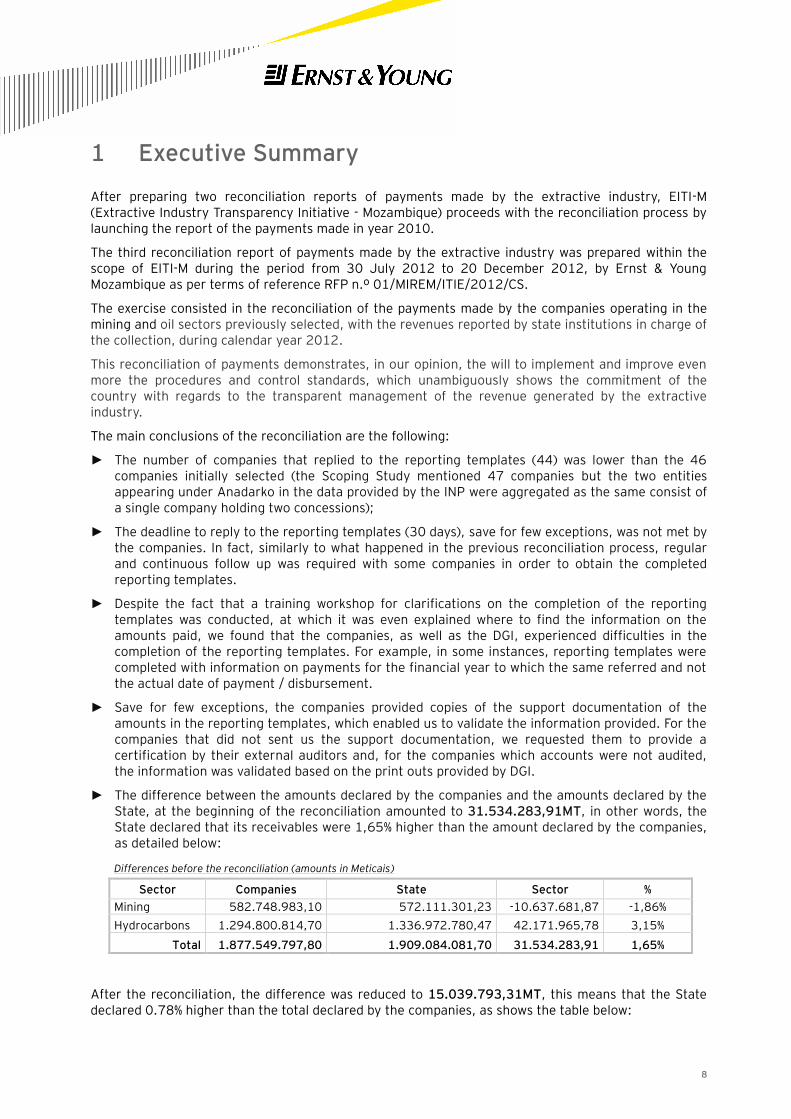
► The difference between the amounts declared by the companies and the amounts declared by the State, at the beginning of the reconciliation amounted to 31.534.283,91MT, in other words, the State declared that its receivables were 1,65% higher than the amount declared by the companies, as detailed below:
Differences before the reconciliation (amounts in Meticais)
Sector Companies State Sector %
Mining 582.748.983,10 572.111.301,23 -10.637.681,87 -1,86%
Hydrocarbons 1.294.800.814,70 1.336.972.780,47 42.171.965,78 3,15%
Total 1.877.549.797,80 1.909.084.081,70 31.534.283,91 1,65%
After the reconciliation, the difference was reduced to 15.039.793,31MT, this means that the State declared 0.78% higher than the total declared by the companies, as shows the table below:
9
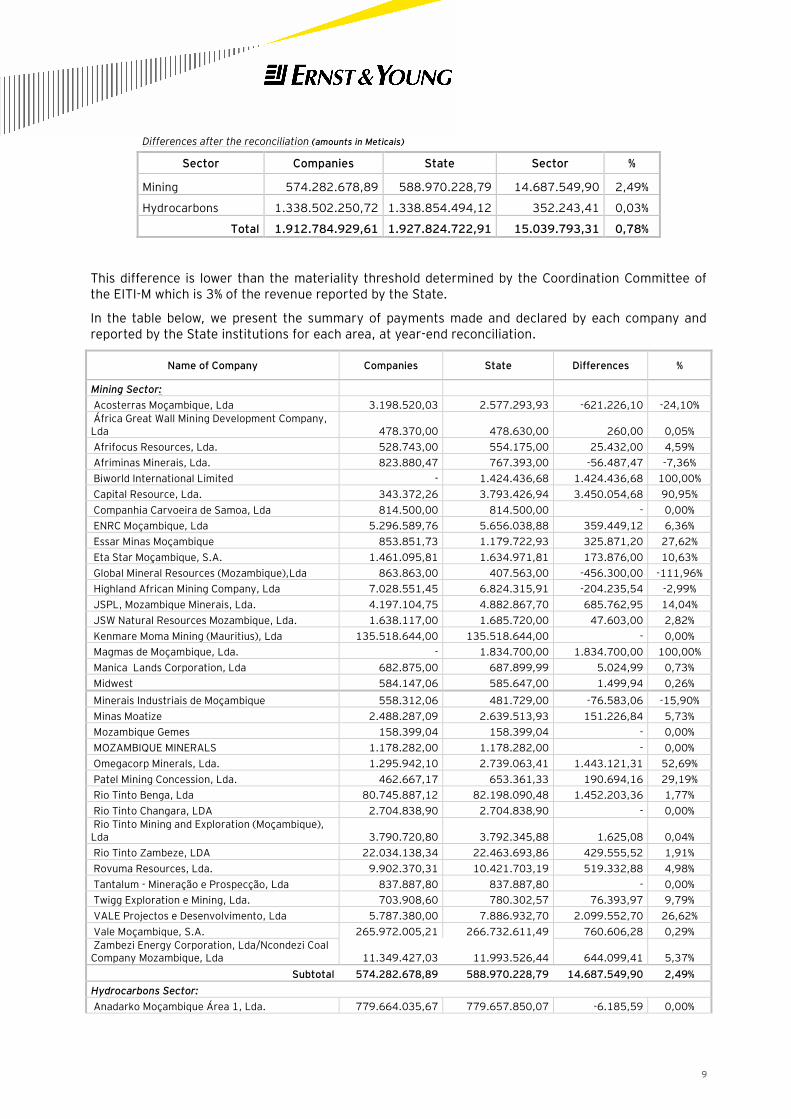
Differences after the reconciliation (amounts in Meticais)
Sector Companies State Sector %
Mining 574.282.678,89 588.970.228,79 14.687.549,90 2,49%
Hydrocarbons 1.338.502.250,72 1.338.854.494,12 352.243,41 0,03%
Total 1.912.784.929,61 1.927.824.722,91 15.039.793,31 0,78%
This difference is lower than the materiality threshold determined by the Coordination Committee of the EITI-M which is 3% of the revenue reported by the State.
In the table below, we present the summary of payments made and declared by each company and reported by the State institutions for each area, at year-end reconciliation.
Name of Company Companies State Differences %
Mining Sector:
Acosterras Moçambique, Lda 3.198.520,03 2.577.293,93 -621.226,10 -24,10%
África Great Wall Mining Development Company, Lda 478.370,00 478.630,00 260,00 0,05%
Afrifocus Resources, Lda. 528.743,00 554.175,00 25.432,00 4,59%
Afriminas Minerais, Lda. 823.880,47 767.393,00 -56.487,47 -7,36%
Biworld International Limited - 1.424.436,68 1.424.436,68 100,00%
Capital Resource, Lda. 343.372,26 3.793.426,94 3.450.054,68 90,95%
Companhia Carvoeira de Samoa, Lda 814.500,00 814.500,00 - 0,00%
ENRC Moçambique, Lda 5.296.589,76 5.656.038,88 359.449,12 6,36%
Essar Minas Moçambique 853.851,73 1.179.722,93 325.871,20 27,62%
Eta Star Moçambique, S.A. 1.461.095,81 1.634.971,81 173.876,00 10,63%
Global Mineral Resources (Mozambique),Lda 863.863,00 407.563,00 -456.300,00 -111,96%
Highland African Mining Company, Lda 7.028.551,45 6.824.315,91 -204.235,54 -2,99%
JSPL, Mozambique Minerais, Lda. 4.197.104,75 4.882.867,70 685.762,95 14,04%
JSW Natural Resources Mozambique, Lda. 1.638.117,00 1.685.720,00 47.603,00 2,82%
Kenmare Moma Mining (Mauritius), Lda 135.518.644,00 135.518.644,00 - 0,00%
Magmas de Moçambique, Lda. - 1.834.700,00 1.834.700,00 100,00%
Manica Lands Corporation, Lda 682.875,00 687.899,99 5.024,99 0,73%
Midwest 584.147,06 585.647,00 1.499,94 0,26%
Minerais Industriais de Moçambique 558.312,06 481.729,00 -76.583,06 -15,90%
Minas Moatize 2.488.287,09 2.639.513,93 151.226,84 5,73%
Mozambique Gemes 158.399,04 158.399,04 - 0,00%
MOZAMBIQUE MINERALS 1.178.282,00 1.178.282,00 - 0,00%
Omegacorp Minerals, Lda. 1.295.942,10 2.739.063,41 1.443.121,31 52,69%
Patel Mining Concession, Lda. 462.667,17 653.361,33 190.694,16 29,19%
Rio Tinto Benga, Lda 80.745.887,12 82.198.090,48 1.452.203,36 1,77%
Rio Tinto Changara, LDA 2.704.838,90 2.704.838,90 - 0,00%
Rio Tinto Mining and Exploration (Moçambique), Lda 3.790.720,80 3.792.345,88 1.625,08 0,04%
Rio Tinto Zambeze, LDA 22.034.138,34 22.463.693,86 429.555,52 1,91%
Rovuma Resources, Lda. 9.902.370,31 10.421.703,19 519.332,88 4,98%
Tantalum - Mineração e Prospecção, Lda 837.887,80 837.887,80 - 0,00%
Twigg Exploration e Mining, Lda. 703.908,60 780.302,57 76.393,97 9,79%
VALE Projectos e Desenvolvimento, Lda 5.787.380,00 7.886.932,70 2.099.552,70 26,62%
Vale Moçambique, S.A. 265.972.005,21 266.732.611,49 760.606,28 0,29%
Zambezi Energy Corporation, Lda/Ncondezi Coal Company Mozambique, Lda 11.349.427,03 11.993.526,44 644.099,41 5,37%
Subtotal 574.282.678,89 588.970.228,79 14.687.549,90 2,49%
Hydrocarbons Sector:
Anadarko Moçambique Área 1, Lda. 779.664.035,67 779.657.850,07 -6.185,59 0,00%
10
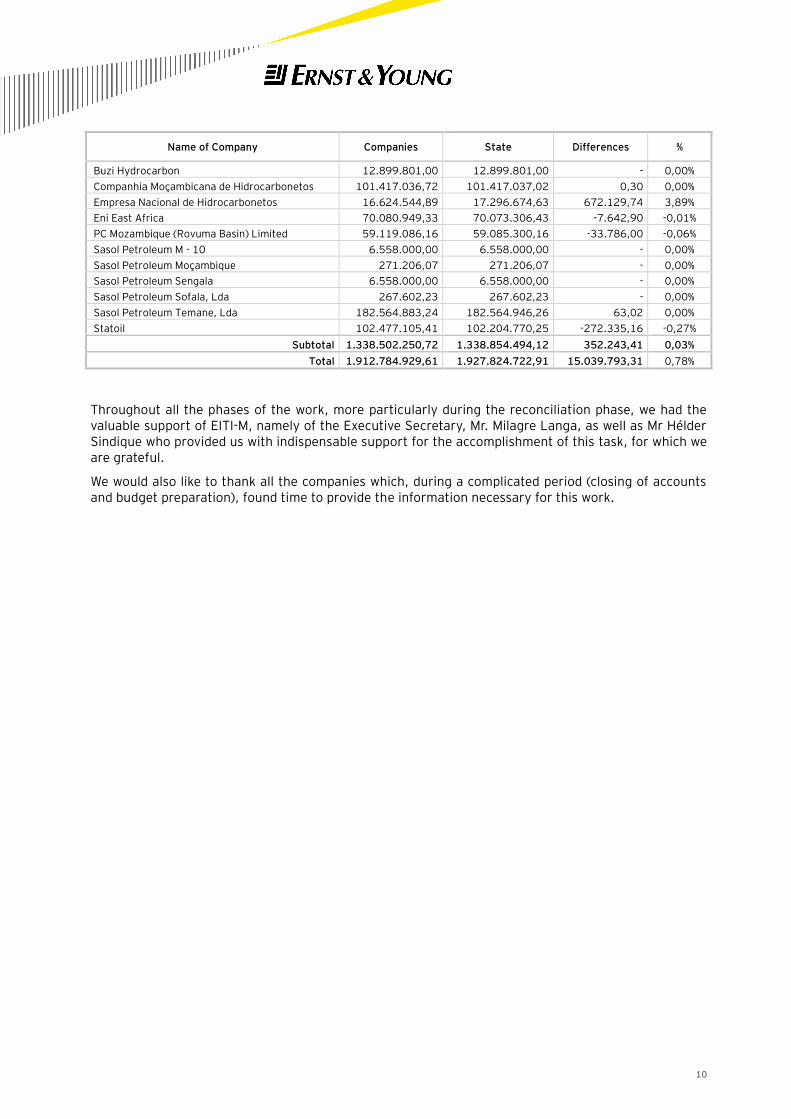
Name of Company Companies State Differences %
Buzi Hydrocarbon 12.899.801,00 12.899.801,00 - 0,00%
Companhia Moçambicana de Hidrocarbonetos 101.417.036,72 101.417.037,02 0,30 0,00%
Empresa Nacional de Hidrocarbonetos 16.624.544,89 17.296.674,63 672.129,74 3,89%
Eni East Africa 70.080.949,33 70.073.306,43 -7.642,90 -0,01%
PC Mozambique (Rovuma Basin) Limited 59.119.086,16 59.085.300,16 -33.786,00 -0,06%
Sasol Petroleum M - 10 6.558.000,00 6.558.000,00 - 0,00%
Sasol Petroleum Moçambique 271.206,07 271.206,07 - 0,00%
Sasol Petroleum Sengala 6.558.000,00 6.558.000,00 - 0,00%
Sasol Petroleum Sofala, Lda 267.602,23 267.602,23 - 0,00%
Sasol Petroleum Temane, Lda 182.564.883,24 182.564.946,26 63,02 0,00%
Statoil 102.477.105,41 102.204.770,25 -272.335,16 -0,27%
Subtotal 1.338.502.250,72 1.338.854.494,12 352.243,41 0,03%
Total 1.912.784.929,61 1.927.824.722,91 15.039.793,31 0,78%
Throughout all the phases of the work, more particularly during the reconciliation phase, we had the valuable support of EITI-M, namely of the Executive Secretary, Mr. Milagre Langa, as well as Mr Hélder Sindique who provided us with indispensable support for the accomplishment of this task, for which we are grateful.
We would also like to thank all the companies which, during a complicated period (closing of accounts and budget preparation), found time to provide the information necessary for this work.
11
2 Introduction
The exploration, research and production of mineral resources have seen a remarkable and incomparable development during the last decade. After a period of low activity, Mozambique has been asserting itself ever more in the world market as a preferred destination for multinationals of the natural resources sector as a result of the recent research showing that the country has significant hydrocarbons reserves.
If the future is bright with regards to hydrocarbons production, in the mining sector there are no doubts: the exportation of coal in large scale is a reality that will immediately boost the current development status of the country.
The multiplying effect of these projects in the economic and social structure may overcome the fiscal revenue resulting from the extractive activity, as long as they are well implemented.
In view of this fact, the sustainable production of these resources, as well as the control of the revenue generated by the extractive industry constitutes a concern and priority for the government and the civil society as all stakeholders have assumed that the production of these resources will generate wealth and development in the country.
A clear management of the generated revenue is the starting point to achieve this goal and it is within this scope that the Government of Mozambique requested the adhesion to the Extractive Industry Transparency Initiative (EITI).
EITI is a colligation comprising of Governments, companies, civil society ad investors engaged in the implementation of internationally recognized standards for the transparent management of the revenue generated by the extractive industry.
Within EITI´s scope, in January 2011 the first reconciliation report of the payments made in year 2008 was prepared, which covered 6 companies of the extractive industry. This report was disclosed at a workshop in Nampula on the 18th of February 2011.
The validation and evaluation made by the EITI international secretariat on the 18th August 2011, was that the country had shown significant progress towards its adherence as a member of the EITI. However, it stressed the need to improve certain indexes contained in the matrix for the adherence to the initiative.
Following this communication EITI-M, with the support of the international cooperation partners, namely the World Bank, immediately launched a tender for the selection of an independent company for the preparation of the second reconciliation report.
This report was disclosed during a workshop in Quelimane, on the 30th of March 2012 and, afterwards it has been widespread in the country by EITI-M. Following EITI procedures (2011 edition), Mozambique requested a review (designated “Secretariat Review”), by the International Council of the EITI.
The EITI “Secretariat Review” had as main objective the evaluation of the level of implementation of the recommendations from the previous validation.
On the 26th of October, the International Council of the EITI declared Mozambique to be a compliant country, becoming part of a limited range of countries that has an effective reconciliation process and annual disclosure of the revenue generated by the extractive industry.
While this process was underway, EITI-M launched a tender for the third reconciliation report, with regards to calendar year 2010, demonstrating a commitment by the Mozambican Government in maintaining the status of a compliant country.
After the preparation of the report on the scoping study and the training and dissemination workshops, Ernst & Young hereby presents the reconciliation of the data referent to the payments made and collected by the various entities, namely, companies operating in the extractive industry and State
12
institutions responsible for the collection of the revenue, namely, the General Directorate of Taxes and the National Petroleum Institute.
13
3 Methodology
3.1 Objective
The main objective of the work is the preparation of the second reconciliation report of the payments made to the State by the companies in the mining and oil sectors in calendar year 2010.
Behind this is the will to promote transparency in the management of the revenue generated by the companies of the extractive industry in order to reduce the risk of undue appropriation and mainly corruption. As a compliant country, Mozambique commits itself to proceed with regular disclosure of the reconciliation of the revenue generated by the extractive industry.
For this purpose and based on the information sent by the selected companies and the Government entities responsible for the collection of the revenue, we undertook the reconciliation of the data presented which comprised, in the first phase, the individual analysis of each of the reporting templates, as well as the supporting documents requested during the work in order to determine probable differences and, in the second phase, crosschecking the information with the objective of assessing the reasons for the differences found.
3.2 Scope
The terms of reference define the scope of the work as well as the aspects that should be included in the report and are attached to this report as Annexure I.
The reconciliation started effectively in the first week of the month of October 2012 with the remittance of the reporting templates to each of the companies selected, as well as to the State institutions responsible for the collection of the tax revenue and other payments made by the companies namely DGI and INP.
Prior to the remittance of the reporting templates, a detailed work was performed in order to obtain the updated address and contacts of the selected companies, given that the database available was outdated or incorrect. This resulted in delays in the receipt of the reporting templates by some of the companies.
Together with the request to fill in the reporting templates, a letter signed by the President of the Coordination Committee was attached which gave a brief Framework of the initiative of the Government within the EITI and requested the companies to complete the templates as soon as possible.
With respect to the reporting templates it is important to refer that the same were sent to the recipients according to the type of activity developed (mining and hydrocarbons). Companies and State institutions reported different in templates.
The four-week deadline established for the submission of the completed reporting templates was not met by the majority of the companies and the State institutions. In fact, this was the reason for the adjustment of the initial working schedule as the information available would not allow us to prepare an effective reconciliation report.
As we were receiving information from the companies and the State institutions we were performing the following tasks:
► Preparation of an Excel database with the available information. Given that the majority of the companies and the DGI provided the information in hard copy we had to validate the information entered in the database to avoid typing errors that would influence the review.
14
► Preliminary review of the reporting templates to determine if the same contained inconsistency and /or missing information in order to request additional clarifications or documents;
- In some instances, the information provided by the companies, as well as DGI shown inconsistencies given
that the information reported did not correspond to the payments effectively made during the calendar
year but to the payments made during financial year 2010.
► Comparison between the reporting templates relating them, line by line, to the payments declared by the companies and those reported by the State institutions;
- In relation to the information made available by DGI we compared the information in the reporting
templates with the information in the “print outs” of DGI´s database.
► Identification of the differences between the information provided by the companies and the ones reported by the State institutions and reconciliation of the same based on the existing data and on the data that was subsequently requested. In this exercise we requested supporting documents for the differences.
► Remittance to EITI-M of the list of companies and State institutions that had not replied properly to the reporting templates.
► Similarly, we continuously followed up the process, namely, through the update of the list and contact of the companies in relation to which discrepancies/inconsistencies were found.
► Preparation of tables and graphics for comparison purposes to be included in the report as well as obtaining clarifications from the companies and State institutions.
Based on the information gathered and produced on the basis of the data supplied we prepared the reconciliation report with the following parameters:
Year of reporting
The report reconciles the payments and revenue referent to the calendar year 2010. Only payments effectively made during the year were considered.
Extractive industry sectors involved
Companies from the mining and hydrocarbon (oil & gas) sectors. This reconciliation report was limited to the companies of the extractive industry.
Taxes and fees included
In the present reconciliation report we took into consideration the taxes and fees selected in the definition of the scoping study, namely, Corporate Income Tax, Individual Income Tax, Surface Tax, Tax on Mining Production, Tax on Petroleum Production; fund for institutional capacity building; fund for social projects; signature bonus and other contributions/payments the companies choose to declare.
Although the report included social contributions in kind made by the companies, the amounts declared will not be taken into consideration in the reconciliation as it is not possible to validate the same.
Important to note that these amounts represent costs incurred by the companies with donations/social responsibility and that, in accordance with the legislation in force, in order to be accepted for tax purposes. certain formalities have to be followed.
Companies included
15
In the first phase, at the time of the preparation of the scoping study, with the assistance of the EITI and the Department of Mines, a list of 127 companies holding mining rights was obtained.
From the analytical work performed by the team with DGI, the Department of Mines and EITI-M, we found that not all of the selected companies of the mining sector paid taxes/fees to the State during that year. This results from the fact that such companies were not registered at that time or the same did not have any activity then or did not have physical presence in the country.
On the other side, and as referred in the Scoping Study, there are companies which are not part of the extractive industry as based in their main object, they utilize the extracted products as raw material, such is the case of Cimentos de Moçambique, SARL.
From the 127 companies that were pre-selected in the mining sector, 30 have been excluded. From the remaining, the companies selected were those that presented contributions equal or higher than 500.000,00 MT (materiality level defined by the Coordination Committee).
For the reconciliation report, this selection excluded further 63 companies, reducing the list of selected companies in the mining sector to 34 companies, as we will show in the following sections.
While for the companies in the mining sector the above mentioned criteria was adopted, with regards to the hydrocarbons sector, all 11 companies holding licenses were included, which references were collected from the INP. Two more companies that operate in this sector as State shareholders, namely, CMH and ENH were also included.
Related to the 13 companies that hold licenses, we found that they were in fact 12 companies as Anadarko Moçambique Área 1, Lda holds two areas in Rovuma Block (one offshore and other onshore).
Therefore, after the conclusion of the selection process that has been properly detailed in the Scoping Study report, 46 companies were maintained, out of which 34 are in the mining sector and 12 in the hydrocarbons sector.
From the 46 companies selected, the report contains the reconciliation for 44 companies given that the remaining 2 did not reply to the reporting template. With respect to the latter, we included the amount of their contributions in order to show their weight in the total contributions.
State institutions enquired
General Directorate of Taxes and National Petroleum Institute.
Type of report
Report on reconciliation and audit as, although the objective of the work was not to validate the correctness of the information supplied but to undertake a comparison and try and find the reasons for any differences assessed, in many instances we had to compare the information contained in the reporting templates with the supporting documents.
Form of presentation of the data
The data presented in the report is desegregated. In other words, the reconciliation exercise was made by company and by type of taxes/fees/ contributions.
Currency of the report
All monetary references in the report will be in meticais. In the situations were payment was made in a different currency, namely, USD, we used the selling exchange rate, published in the exchange bulletin n.º 253/2010, of the Bank of Mozambique from the 31st December.
16
Payments in kind
Certain companies, namely Sasol Petroleum Temane, Limitada, pay the Petroleum Production Tax in kind. In the report, this information was reviewed on the basis of the data made available by DGI/INP as well as the company itself.
Materiality
For purposes of this report, the Coordination Committee of EITI-M determined that the difference assessed between the payments declared by the companies and the collections by the State institutions that are equal or lower than 3% of the revenue reported by the State would not be subject to additional reconciliation. In numerical terms this represents 57.834.741,69MT.
17
4 Extractive Industry in Mozambique
Mozambique is a country with a wide potential for natural resources. The geological data available, as well as the seismic research undertaken and underway are promising and indicate that these resources (mineral and hydrocarbons) exist in commercial quantities.
Mozambique is a country which economy is based on agriculture, which is the sector with the higher contribution to the GDP. According to data of the National Institute of Statistics (INE), in 2010 the contribution of agriculture for the GDP was 19,4% against the 1,1% of the extractive industry.
One of the reasons behind this situation lies in the fact that mining exploration was, in large scale, until recently practically inexistent. Some mining projects of small and medium size, namely, gold, tantalite, semiprecious stones, marble, coal, among others, were the visible face of the Mozambican extractive industry.
The work of exploration and prospecting of resources started a new dynamics in the last decade. We understand that the international demand for mineral resources, as well as the political and economic stability that the country is experiencing, has contributed significantly for this.
In fact, it is not news that in the last years Mozambique has been a privileged destination for foreign investors, particularly large multinationals involved in projects of great impact in the national economic context.
As a consequence of this rush, the investments in the mining and hydrocarbons sector have increased exponentially, indicating that in the next few years they will easily reach and even exceed the number of twenty billions Americans dollars.
Besides the large discovery of natural gas recently found in the Rovuma Basin where the American and Italian multinationals, Anadarko and ENI, respectively, hold petroleum rights, there is the occurrence of minerals all over the country.
Indeed, exploration and prospecting are underway undertaken by several companies, in various areas, namely, Moatize, Changara, Mutarara, Marávia and Zumbo in the Province of Tete, and Lago in the Province of Niassa, identified big potential of coal.
Meanwhile, work for recognition and research carried out in certain areas in the Provinces of Nampula, Tete, and Cabo Delgado indicates the existence of basic metals (nickel, cooper and zinc). Similarly, mineralization of iron, vanadium and titanium were identified in the Province of Tete.
There is exploration work underway in the Provinces of Gaza and Inhambane.
Apart from this, exploration and research of minerals continues all over the country, namely for limestone.
With regards to the promising signs mentioned, there are investments in the phase of large scale production, namely, the coal produced by Vale Moçambique, SA (the first exportation occurred in September 2011) and the heavy mineral sands being produced by Kenmare Moma Mining (Mauritius), Limited for some time now, just to mention a few.
If this is the situation in the mining sector, in the hydrocarbon sector the production of gas by Sasol Petroleum Temane, Limitada have been a fact for some years.
Currently, the activities of geologic research and oil exploration proceed at an accelerated pace in the Rovuma Basin and in Mozambique Basin, and Contracts for the Exploration and Production of hydrocarbons have been signed with several operators.
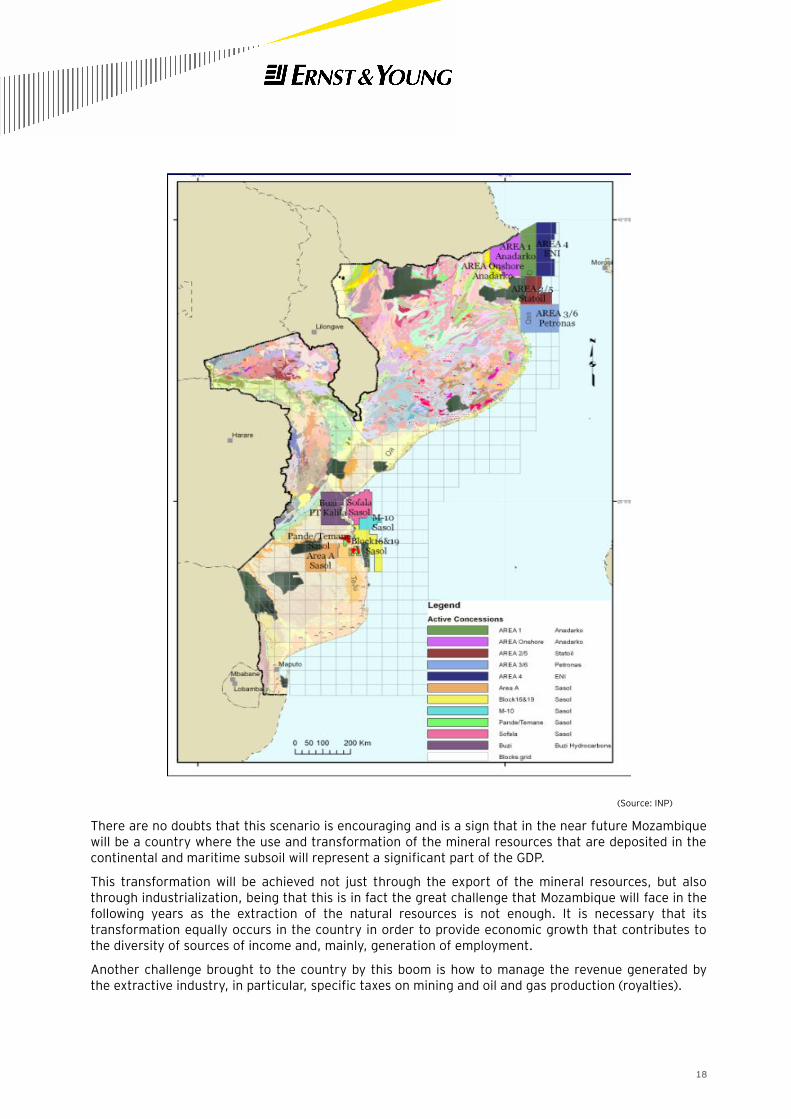
The areas and blocks conceded are in their majority offshore, which surely, justifies a significant proportion of the investment that is projected to be undertaken in the country in the next few years.
In the map below and for illustrative purposes, details of the licences are presented, as well the concessionaires of the contracted areas and blocks.
18
(Source: INP)
There are no doubts that this scenario is encouraging and is a sign that in the near future Mozambique will be a country where the use and transformation of the mineral resources that are deposited in the continental and maritime subsoil will represent a significant part of the GDP.
This transformation will be achieved not just through the export of the mineral resources, but also through industrialization, being that this is in fact the great challenge that Mozambique will face in the following years as the extraction of the natural resources is not enough. It is necessary that its transformation equally occurs in the country in order to provide economic growth that contributes to the diversity of sources of income and, mainly, generation of employment.
Another challenge brought to the country by this boom is how to manage the revenue generated by the extractive industry, in particular, specific taxes on mining and oil and gas production (royalties).
19
It is therefore here that the role of the civil society, amongst all the stakeholders, shall focus in order that the use and exploration of the natural wealth, which is exhaustible, generates wealth and wellbeing for the population.
It is the understanding of the civil society at a large and the Government in particular, that the implementation of the EITI is an important tool to ensure that the resulting benefits of the exploration and use of the natural wealth are utilized for the development of the country.
20
5 Companies Selected in the Extractive Sector
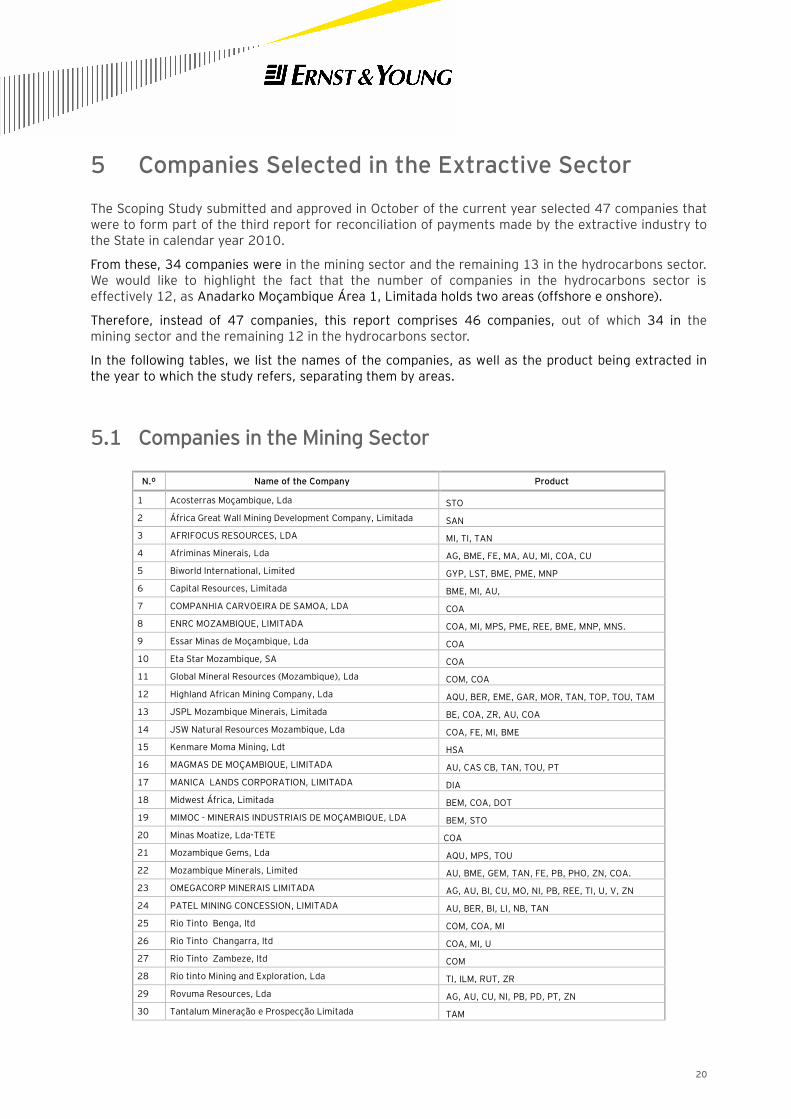
The Scoping Study submitted and approved in October of the current year selected 47 companies that were to form part of the third report for reconciliation of payments made by the extractive industry to the State in calendar year 2010.
From these, 34 companies were in the mining sector and the remaining 13 in the hydrocarbons sector. We would like to highlight the fact that the number of companies in the hydrocarbons sector is effectively 12, as Anadarko Moçambique Área 1, Limitada holds two areas (offshore e onshore).
Therefore, instead of 47 companies, this report comprises 46 companies, out of which 34 in the mining sector and the remaining 12 in the hydrocarbons sector.
In the following tables, we list the names of the companies, as well as the product being extracted in the year to which the study refers, separating them by areas.
5.1 Companies in the Mining Sector
N.º Name of the Company Product
1 Acosterras Moçambique, Lda STO
2 África Great Wall Mining Development Company, Limitada SAN
3 AFRIFOCUS RESOURCES, LDA MI, TI, TAN
4 Afriminas Minerais, Lda AG, BME, FE, MA, AU, MI, COA, CU
5 Biworld International, Limited GYP, LST, BME, PME, MNP
6 Capital Resources, Limitada BME, MI, AU,
7 COMPANHIA CARVOEIRA DE SAMOA, LDA COA
8 ENRC MOZAMBIQUE, LIMITADA COA, MI, MPS, PME, REE, BME, MNP, MNS.
9 Essar Minas de Moçambique, Lda COA
10 Eta Star Mozambique, SA COA
11 Global Mineral Resources (Mozambique), Lda COM, COA
12 Highland African Mining Company, Lda AQU, BER, EME, GAR, MOR, TAN, TOP, TOU, TAM
13 JSPL Mozambique Minerais, Limitada BE, COA, ZR, AU, COA
14 JSW Natural Resources Mozambique, Lda COA, FE, MI, BME
15 Kenmare Moma Mining, Ldt HSA
16 MAGMAS DE MOÇAMBIQUE, LIMITADA AU, CAS CB, TAN, TOU, PT
17 MANICA LANDS CORPORATION, LIMITADA DIA
18 Midwest África, Limitada BEM, COA, DOT
19 MIMOC - MINERAIS INDUSTRIAIS DE MOÇAMBIQUE, LDA BEM, STO
20 Minas Moatize, Lda-TETE COA
21 Mozambique Gems, Lda AQU, MPS, TOU
22 Mozambique Minerals, Limited AU, BME, GEM, TAN, FE, PB, PHO, ZN, COA.
23 OMEGACORP MINERAIS LIMITADA AG, AU, BI, CU, MO, NI, PB, REE, TI, U, V, ZN
24 PATEL MINING CONCESSION, LIMITADA AU, BER, BI, LI, NB, TAN
25 Rio Tinto Benga, ltd COM, COA, MI
26 Rio Tinto Changarra, ltd COA, MI, U
27 Rio Tinto Zambeze, ltd COM
28 Rio tinto Mining and Exploration, Lda TI, ILM, RUT, ZR
29 Rovuma Resources, Lda AG, AU, CU, NI, PB, PD, PT, ZN
30 Tantalum Mineração e Prospecção Limitada TAM
21
N.º Name of the Company Product
31 Twigg Exploration e Mining Lda AG, AU, BME, CU, GRP, NI, PB, PME, PT, U, ZN
32 Vale Moçambique APA, COA
33 Vale Projectos e Desenvolvimento Moçambique, Lda AU, BME, COA, MI, MIND, PME
34 Zambezi Energy Corporation, Lda / Ncondezi Coal Company Mozambique, Lda COA
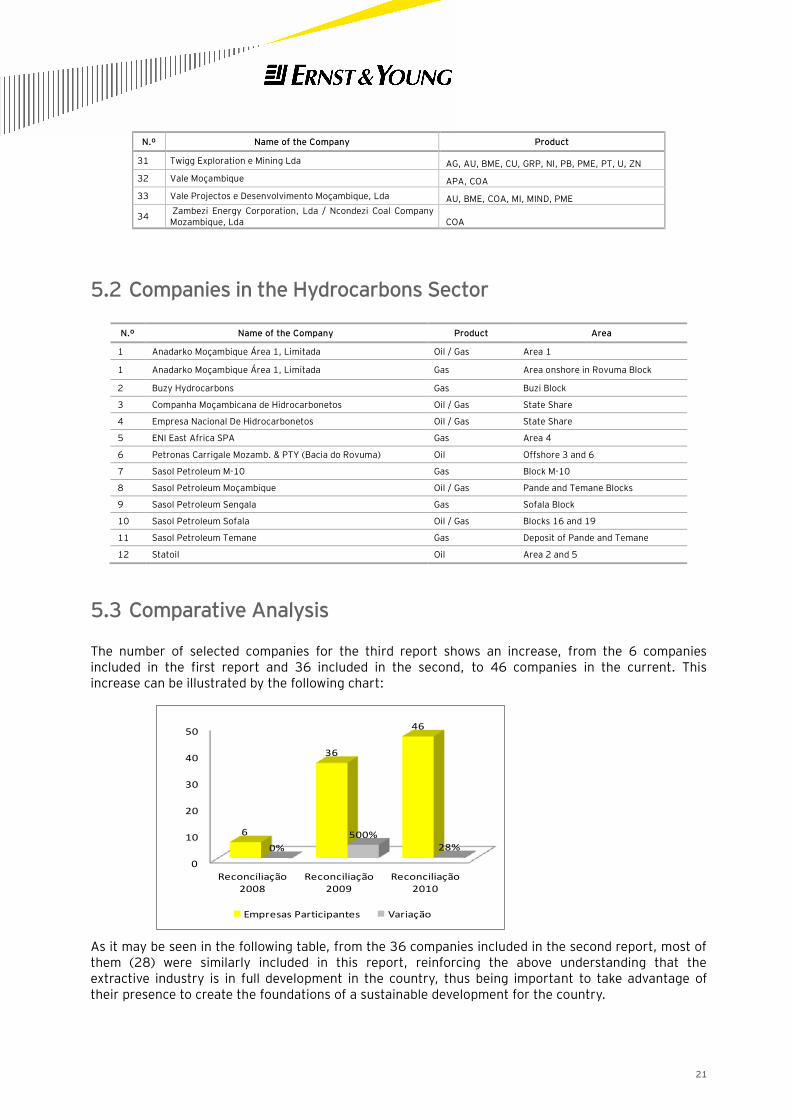
5.2 Companies in the Hydrocarbons Sector
N.º Name of the Company Product Area
1 Anadarko Moçambique Área 1, Limitada Oil / Gas Area 1
1 Anadarko Moçambique Área 1, Limitada Gas Area onshore in Rovuma Block
2 Buzy Hydrocarbons Gas Buzi Block
3 Companha Moçambicana de Hidrocarbonetos Oil / Gas State Share
4 Empresa Nacional De Hidrocarbonetos Oil / Gas State Share
5 ENI East Africa SPA Gas Area 4
6 Petronas Carrigale Mozamb. & PTY (Bacia do Rovuma) Oil Offshore 3 and 6
7 Sasol Petroleum M-10 Gas Block M-10
8 Sasol Petroleum Moçambique Oil / Gas Pande and Temane Blocks
9 Sasol Petroleum Sengala Gas Sofala Block
10 Sasol Petroleum Sofala Oil / Gas Blocks 16 and 19
11 Sasol Petroleum Temane Gas Deposit of Pande and Temane
12 Statoil Oil Area 2 and 5
5.3 Comparative Analysis
The number of selected companies for the third report shows an increase, from the 6 companies included in the first report and 36 included in the second, to 46 companies in the current. This increase can be illustrated by the following chart:
As it may be seen in the following table, from the 36 companies included in the second report, most of them (28) were similarly included in this report, reinforcing the above understanding that the extractive industry is in full development in the country, thus being important to take advantage of their presence to create the foundations of a sustainable development for the country.
0
10
20
30
40
50
Reconciliação 2008
Reconciliação 2009
Reconciliação 2010
6
36
46
0%
500%
28%
Empresas Participantes Variação
22
N.º Name of the Company
1 Afriminas Minerais, Lda
2 Essar Minas de Moçambique, Lda
3 Highland African Mining Company, Lda
4 Kenmare Moma Mining (Mauritius), Ldt
5 Manica Lands Corporation, Limitada
6 Minas Moatize, Lda-TETE
7 Mozambique Minerals, Limited
8 Rio Tinto Benga, Lda.
9 Rio tinto Mining and Exploration, Lda
10 Rovuma Resources, Lda
11 Vale Moçambique, SA
12 Acosterras Moçambique, Lda
13 Capital Resources, Limitada
14 Omegacorp Minerais, Limitada
15 Eta Star Mozambique, SA
16 Tantalum Mineração e Prospecção Limitada
17 Twigg Exploration e Mining Lda
18 JSPL Mozambique Minerais, Limitada
19 Anadarko Moçambique Área 1, Limitada
20 Companhia Moçambicana de Hidrocarbonetos, SARL
21 Petronas Carigali Mozambique E & P, Ltd.
22 Sasol Petroleum Sofala, Lda.
23 Sasol Petroleum Temane, Lda.
24 Sasol Petroleum Moçambique, Lda.
25 Empresa Nacional de Hidrocarbonetos, EP
26 ENI East Africa SPA
27 Buzi Hydrocarbons
28 Statoil Ltd.
The companies that were not included in this report are, namely: Cimentos de Moçambique, SARL; Manica Minerals (Moz), Lda.; Opti Metal Trading Moçambique, Limitada; Grinaker Moçambique Lda.; Africa Drilling Company-Afrodroll; AP Capital; DNO ASA e Wentworth Moçambique Petróleos, Lda.
The reason why the above were excluded is for instance, the fact that the activity undertaken by Cimentos de Moçambique, SARL cannot be considered as part of the extractive sector. On the other hand, some companies do not meet the materiality threshold. Others were excluded as they are no longer operating in the country.
With regards to the companies selected for this reconciliation, we found that there was not significant development in terms of production/activity as during 2010 a significant part of the companies was still in the exploration and prospecting phase.
Despite that, the revenue declared by the State in year 2010 had a relative increase. This increase may be associated to the increase of the number of companies, as well as it may imply that the companies in the extractive industry have the potential to contribute for the generation of national wealth in a short period of time.
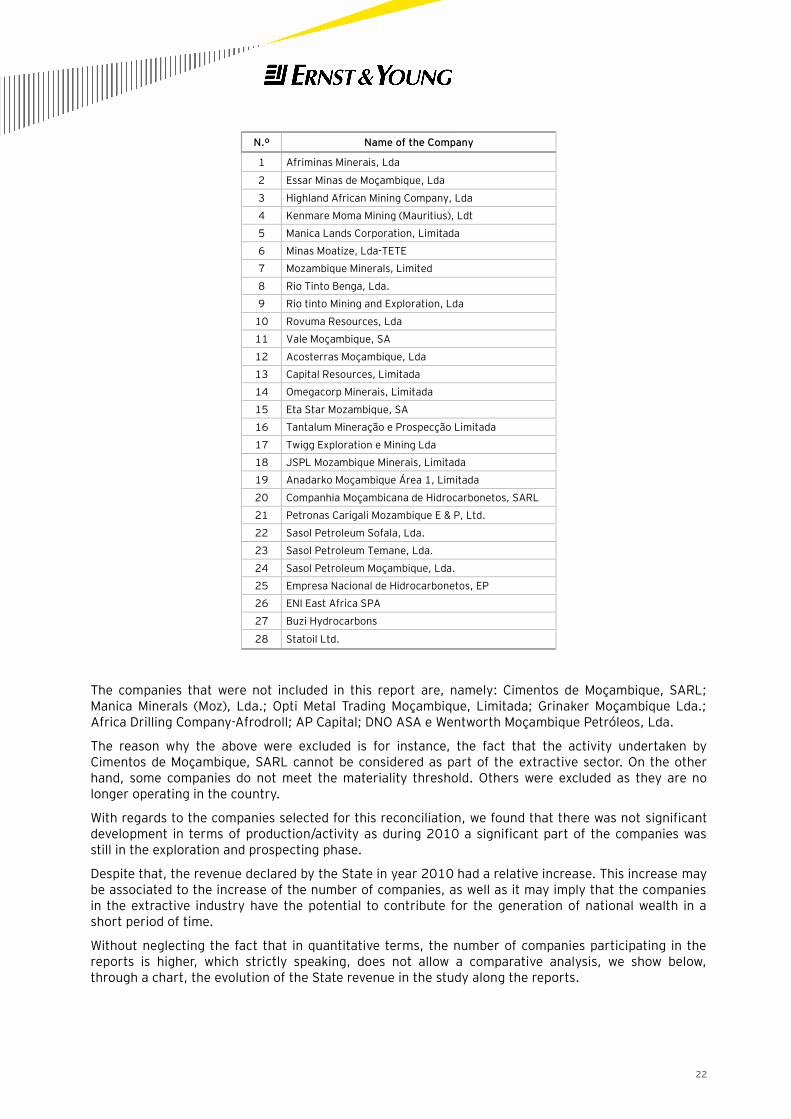
Without neglecting the fact that in quantitative terms, the number of companies participating in the reports is higher, which strictly speaking, does not allow a comparative analysis, we show below, through a chart, the evolution of the State revenue in the study along the reports.
23
-
200.000,00
400.000,00
600.000,00
800.000,00
1.000.000,00
1.200.000,00
1.400.000,00
1.600.000,00
1.800.000,00
2.000.000,00
Revenue 2008 Revenue 2009 Revenue 2010
203.975,22
1.070.147,03
1.930.087,73
Tho
usa
nd
s o
f M
eti
cais
24
6 Taxes, Fees and Contributions
For a better understanding of the present report, we present a brief explanation about the object, tax rates and contributions of the Mozambican Tax System, since that we believe is critical for understanding the process of selection those tax and fees that will be part of the present exercise of reconciliation and are part on point 6.5.
6.1 Taxes of the Mozambican Tax System
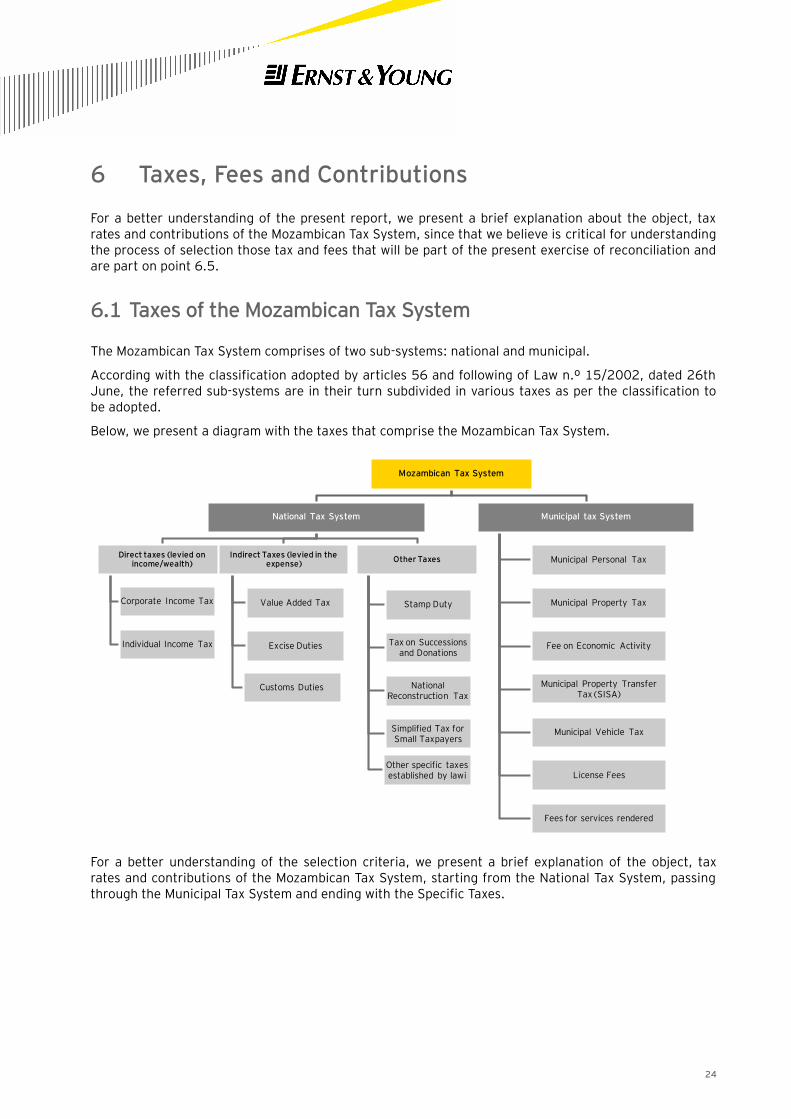
The Mozambican Tax System comprises of two sub-systems: national and municipal.
According with the classification adopted by articles 56 and following of Law n.º 15/2002, dated 26th June, the referred sub-systems are in their turn subdivided in various taxes as per the classification to be adopted.
Below, we present a diagram with the taxes that comprise the Mozambican Tax System.
For a better understanding of the selection criteria, we present a brief explanation of the object, tax rates and contributions of the Mozambican Tax System, starting from the National Tax System, passing through the Municipal Tax System and ending with the Specific Taxes.
-
200.000.000,00
400.000.000,00
600.000.000,00
800.000.000,00
1.000.000.000,00
1.200.000.000,00
1.400.000.000,00
1.600.000.000,00
1.800.000.000,00
2.000.000.000,00
Receitas 2008 Receitas 2009 Receitas 2010
-
200.000.000,00
400.000.000,00
600.000.000,00
800.000.000,00
1.000.000.000,00
1.200.000.000,00
1.400.000.000,00
1.600.000.000,00
1.800.000.000,00
2.000.000.000,00
Receitas 2008 Receitas 2009 Receitas 2010
Mozambican Tax System
National Tax System
Direct taxes (levied on income/wealth)
Corporate Income Tax
Individual Income Tax
Indirect Taxes (levied in the expense)
Value Added Tax
Excise Duties
Customs Duties
Other Taxes
Stamp Duty
Tax on Successions and Donations
National Reconstruction Tax
Simplified Tax for Small Taxpayers
Other specific taxes established by lawi
Municipal tax System
Municipal Personal Tax
Municipal Property Tax
Fee on Economic Activity
Municipal Property Transfer Tax (SISA)
Municipal Vehicle Tax
License Fees
Fees for services rendered
25
6.1.1 National Tax System The National Tax System includes two fractions, namely, direct and indirect taxes. Residually, there is another fraction of other taxes in which mining and oil & gas activity specific taxes are included.
6.1.2 Direct Taxation of Income and Wealth:
6.1.2.1 Corporate Income Tax
Corporate Income Tax (IRPC) is applicable on income obtained, including from illegal acts, by taxpayers.
The following are considered to be IRPC taxpayers:
► Commercial companies or civil companies adopting the commercial form, co-operatives, public companies and all public and private law corporate entities with head offices or effective management in the Mozambican territory.
► Entities without own legal personality with head offices or effective management in the Mozambican territory.
► Entities with or without legal personality without head offices or effective management in Mozambique.
► While resident taxpayers or permanent establishment of foreign companies in Mozambique are
taxed at the general rate of 32%1, non-resident entities without permanent establishment are taxed
by means of withholding tax rate of 20%2 as final tax.
6.1.2.2 Individual Income Tax
Individual Income Tax (IRPS) is applicable to the annual worldwide income, even from illegal acts, as per the following categories:
► 1st Category – employment income;
► 2nd
Category – entrepreneurial and professional income;
► 3rd
Category – capital and capital gains income;
► 4th Category – property income;
► 5th Category – other income.
IRPS is due by resident individuals and by non-resident individuals who earn income in Mozambique.
The general annual tax rates for tax residents vary from 10% to 32%, as per the amount of taxable income, while non-residents are taxed by means of a 20% withholding tax as final tax.
1 Agriculture and cattle-breeding activities benefit until December 2015 from a reduced tax rate of 10%. 2 Certain services, namely, telecommunications and international transport, are taxed at a rate of 10%.
26
6.1.3 Indirect Taxation of Expenses:
6.1.3.1 Value Added Tax
The VAT rate is 17%.
Value Added Tax (“VAT”) is applicable on the transfer of goods and services for a consideration, occurred within the Mozambican territory, by a taxpayer acting as such, as well as on the importation of goods.
The following are considered to be VAT taxpayers:
► Individuals and corporate entities undertaking importation of goods;
► Individuals and corporate entities who in an invoice or equivalent document unduly mention the value added tax;
► Individuals and corporate entities who perform any taxable operation provided the same meets IRPS or IRPC application requirements;
► Resident Individuals and corporate entities or foreign entities with permanent establishment or representation in the Mozambican territory, which independently and regularly perform, for or not for profit, production, commercial or services activities.
► Non resident Individuals and corporate entities without permanent establishment or representation in Mozambique which, still independently, perform any taxable operation provided it is related to their commercial activity.
6.1.3.2 Special Consumption Tax
Special Consumption Tax (ICE) is applicable to certain goods, namely, tobacco, alcohol, locally manufactured or imported vehicles. This is a once-off tax applicable on the producer or importer.
ICE tax rate are ”ad valorem” or specific or even a combination of the two, taking into consideration the nature of the goods to be taxed, as well as the social, economic or general or specific prevention objectives to follow in each case.
6.1.3.3 Import Duties
Import duties are applicable to imported goods in the customs territory as per the customs manual. The rates vary from 2.5% to 20%.
Products imported from SADC countries benefit for a couple of years now from a gradual reduction of customs duties.
6.1.3.4 Other Taxes
The Mozambican Tax System comprises also other taxes, namely:
6.1.3.4.1 Stamp Duty
Stamp duty is applicable on all documents, contracts, books, papers and acts as per table attached to the Stamp Duty Act. Stamp Duty taxpayers are the entities with economic interest supported by
27
documents. In case of common interest from different entities the tax burden is shared proportionally by all of the entities.
The tax rates are foreseen in a table as per the type of document or act.
6.1.3.4.2 Successions and Donations Tax
Successions and Donations is applicable to the transfer of ownership rights over movable or immovable property, whatever is the denomination or form of the title.
The tax is assessed as per the rates in force at the moment of the transfer, varying from 2% and 10%.
6.1.3.4.3 National Reconstruction Tax
National Reconstruction Tax (IRN) represents a minimum contribution by each citizen for public spending and is applicable, as per specific rates, to all individuals resident in the national territory, even if foreigners, provided the requirements are met, namely, age, occupation, ability to work and other foreseen in the respective Code.
The tax rate is established annually by the Ministry of Finance based on a proposal from the Local (Provincial) Government in accordance with the level of development and social-economic conditions in each district or region.
6.1.3.4.4 Small Taxpayers Simplified Tax
Small Taxpayers Simplified Tax (ISPC) is due by individual or corporate entities who undertake agricultural, industrial or commercial activities, such as agriculture trading, itinerant commerce, gross and retail commerce, as well as transformation industry and rendering of services. One of the conditions to register under this regime is that annual turnover does not exceed 2,500,000.00 MT.
ISPC taxpayers pay the tax on a quarterly basis and the same corresponds to 3% of turnover or an annual amount of 75,000.00MT divided in quarterly instalments.
6.2 Municipal Tax System
The Municipal Tax System comprises taxes and service fees. Some of the taxes used to be part of the National Tax System and were recently transferred to the Municipalities’ jurisdiction.
6.2.1 Vehicles Tax Vehicles Tax (ISV) is applicable to the use and fruition of the vehicles indicated below, registered at the competent services in the Republic of Mozambique, or, irrespective of registration, remain in use or circulation within the Mozambican territory for more than 180 days:
► Light passenger vehicles, light multi purpose vehicles with weight up to 2,500kg, heavy trucks and passenger motorcycles with or without a car;
► Private use aircrafts;
► Private recreational boats.
28
The applicable tax rates are included in a table in accordance with the following criteria: fuel used, number of cylinders, horse power, voltage, age and maximum weight authorized.
6.2.2 Property Transfer Tax (SISA) SISA is applicable to the onerous transfer of ownership rights or part of such rights over immovable property and it is due by individuals or corporate entities acquiring ownership.
SISA rate is 2% of the value of the immovable property being transferred.
6.2.3 Personal Municipal Tax Personal Municipal Tax is applicable to all individuals, national or foreign, resident in the respective Municipality at ages between 18 and 60 years.
Personal Municipal Tax rates in force in each year and in each Municipality are established as per the classification of the Municipality and the national minimum salary:
► 4% for level A Municipalities;
► 3% for level B Municipalities;
► 2% for level C Municipalities;
► 1% for level D settlements and villages.
6.2.4 Municipal Real Estate Tax Municipal Real Estate Tax is applicable to the value of the urban immovable properties located in the respective Municipality territory. This tax is due by the property right holders on 31 December of the previous year to which the same refers, assuming that such individuals or corporate entities are the ones registered in the real estate matrix or the ones in possession by any title at the referred date.
The Municipal Real Estate Tax rates are the following:
► 0,4%, for housing buildings;
► 0,7%, for buildings destined to commercial or industrial activity or for the development of independent professional activities, as well as for other purposes.
6.2.5 Other Municipal Revenue Municipalities may charge fees by each economic activity, including tourism activities, in which situation the Municipal Assembly, through the President of the Municipality or Settlement proposal, is competent to determine the fee amounts.
Municipalities may apply tariffs or fees for services in the cases where they have certain public services under their direct management, namely, in the following cases:
► Water and power supply; garbage collection and deposit, sewage maintenance and treatment; people and goods urban transportation; use of slaughterhouses, maintenance of gardens and streets.
29
The Municipal Assembly is the entity entitled to establish the fees and contributions referred above and, whenever possible, on the basis of cost recovery.
6.3 Taxes and Fees Specific to the Extractive Industry
In the classification presented above it appears that the legislator, taking into account the principle of tax legality, foresaw the possibility of the Mozambican Tax System to be complemented by specific taxes and fees. Such is the case, for example, of the Extractive Industry.
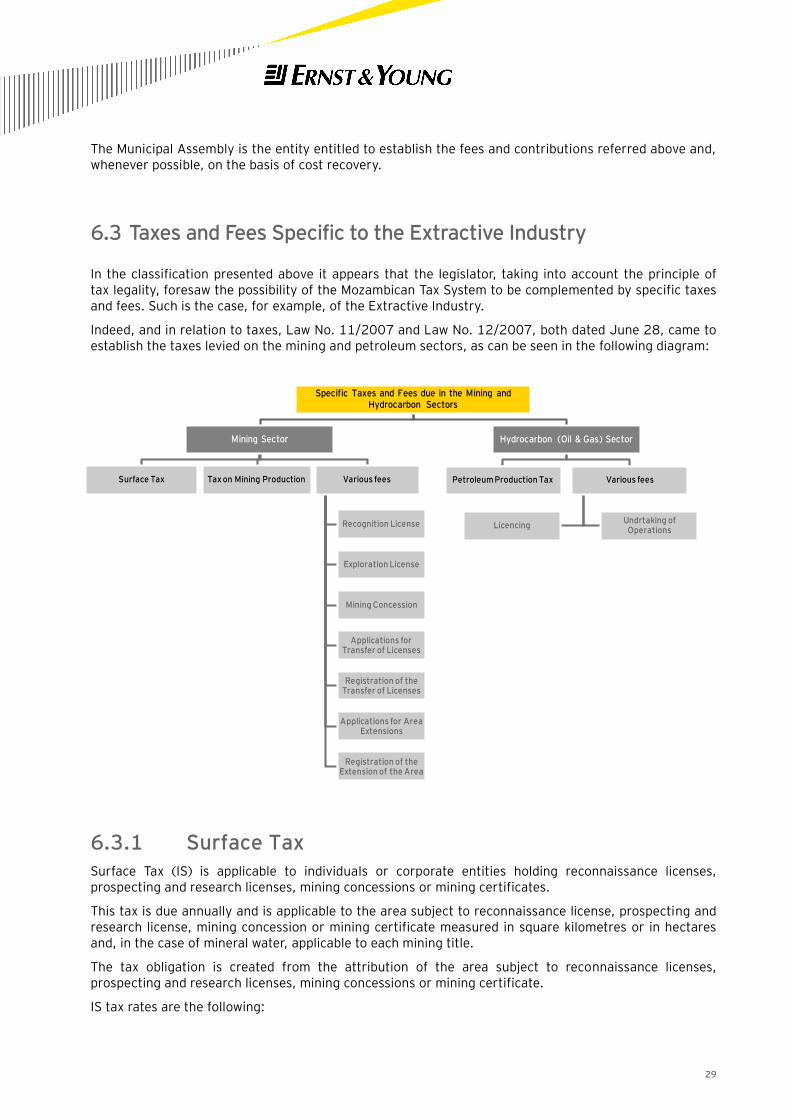
Indeed, and in relation to taxes, Law No. 11/2007 and Law No. 12/2007, both dated June 28, came to establish the taxes levied on the mining and petroleum sectors, as can be seen in the following diagram:
6.3.1 Surface Tax Surface Tax (IS) is applicable to individuals or corporate entities holding reconnaissance licenses, prospecting and research licenses, mining concessions or mining certificates.
This tax is due annually and is applicable to the area subject to reconnaissance license, prospecting and research license, mining concession or mining certificate measured in square kilometres or in hectares and, in the case of mineral water, applicable to each mining title.
The tax obligation is created from the attribution of the area subject to reconnaissance licenses, prospecting and research licenses, mining concessions or mining certificate.
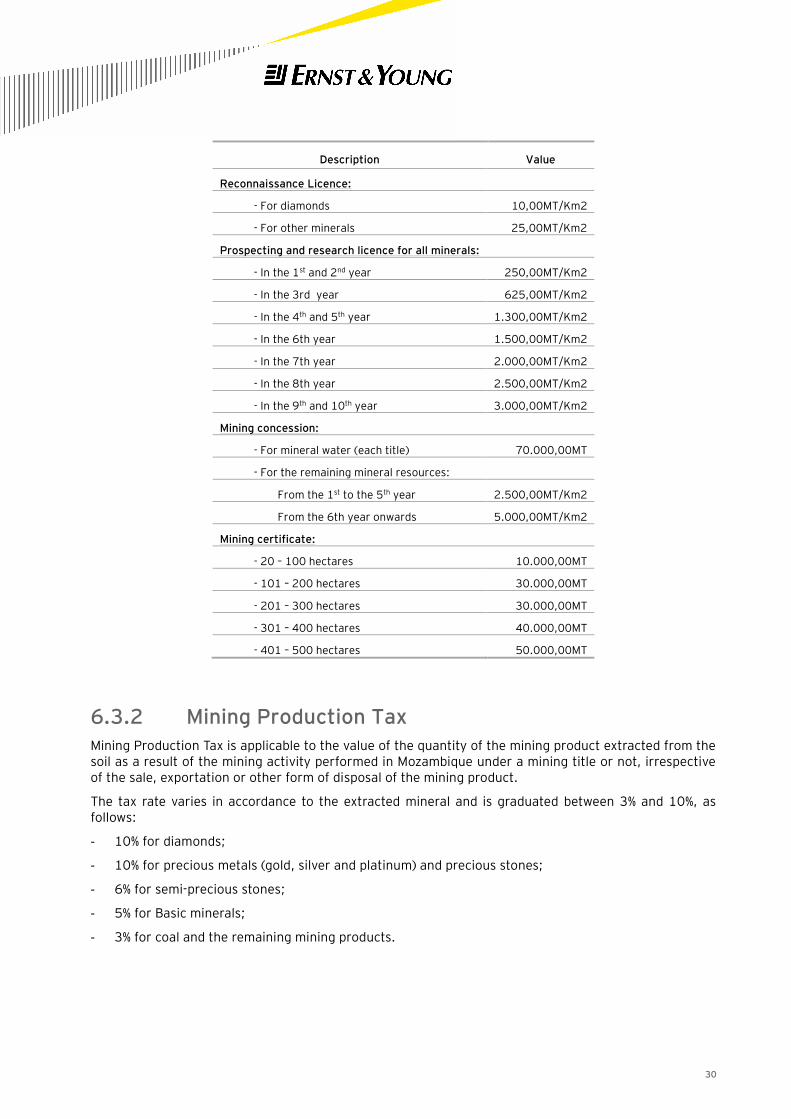
IS tax rates are the following:
Specific Taxes and Fees due in the Mining andHydrocarbon Sectors
Mining Sector
Surface Tax Tax on Mining Production Various fees
Recognition License
Exploration License
Mining Concession
Applications for Transfer of Licenses
Registration of theTransfer of Licenses
Applications for AreaExtensions
Registration of theExtension of the Area
Hydrocarbon (Oil & Gas) Sector
Petroleum Production Tax Various fees
Undrtaking ofOperations
Licencing
30
Description Value
Reconnaissance Licence:
- For diamonds 10,00MT/Km2
- For other minerals 25,00MT/Km2
Prospecting and research licence for all minerals:
- In the 1st and 2nd year 250,00MT/Km2
- In the 3rd year 625,00MT/Km2
- In the 4th and 5th year 1.300,00MT/Km2
- In the 6th year 1.500,00MT/Km2
- In the 7th year 2.000,00MT/Km2
- In the 8th year 2.500,00MT/Km2
- In the 9th and 10th year 3.000,00MT/Km2
Mining concession:
- For mineral water (each title) 70.000,00MT
- For the remaining mineral resources:
From the 1st to the 5th year 2.500,00MT/Km2
From the 6th year onwards 5.000,00MT/Km2
Mining certificate:
- 20 – 100 hectares 10.000,00MT
- 101 – 200 hectares 30.000,00MT
- 201 – 300 hectares 30.000,00MT
- 301 – 400 hectares 40.000,00MT
- 401 – 500 hectares 50.000,00MT
6.3.2 Mining Production Tax Mining Production Tax is applicable to the value of the quantity of the mining product extracted from the soil as a result of the mining activity performed in Mozambique under a mining title or not, irrespective of the sale, exportation or other form of disposal of the mining product.
The tax rate varies in accordance to the extracted mineral and is graduated between 3% and 10%, as follows:
- 10% for diamonds;
- 10% for precious metals (gold, silver and platinum) and precious stones;
- 6% for semi-precious stones;
- 5% for Basic minerals;
- 3% for coal and the remaining mining products.
31
6.3.3 Petroleum Production Tax Petroleum Production Tax taxpayers are individuals or corporate entities holding right to undertake oil operations and oil production.
Petroleum Production Tax is applicable to oil produced in the Mozambican territory, from the area of development and production. As a general rule it is paid in cash, but the State may choose to receive it partially or in full in kind. The tax rate is graduated between 6% and 10%, as per the type of hydrocarbon. Natural gas is subject to 6% and crude oil to 10%.
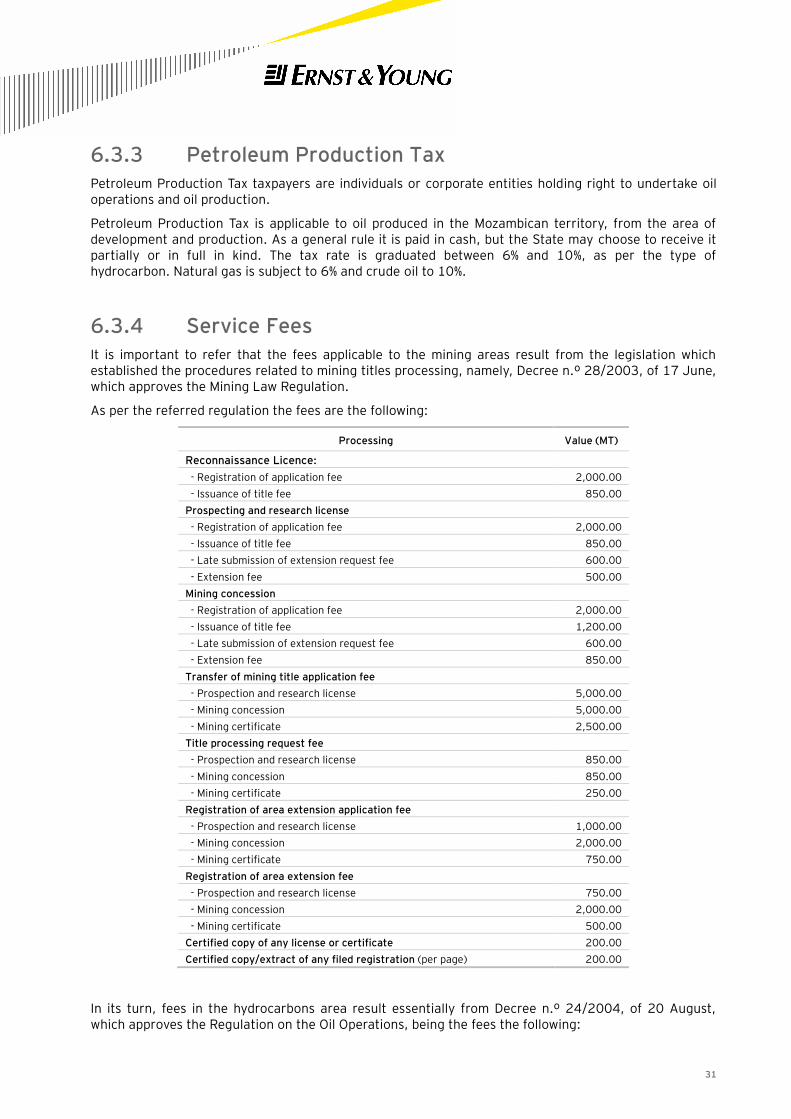
6.3.4 Service Fees It is important to refer that the fees applicable to the mining areas result from the legislation which established the procedures related to mining titles processing, namely, Decree n.º 28/2003, of 17 June, which approves the Mining Law Regulation.
As per the referred regulation the fees are the following:
Processing Value (MT)
Reconnaissance Licence:
- Registration of application fee 2,000.00
- Issuance of title fee 850.00
Prospecting and research license
- Registration of application fee 2,000.00
- Issuance of title fee 850.00
- Late submission of extension request fee 600.00
- Extension fee 500.00
Mining concession
- Registration of application fee 2,000.00
- Issuance of title fee 1,200.00
- Late submission of extension request fee 600.00
- Extension fee 850.00
Transfer of mining title application fee
- Prospection and research license 5,000.00
- Mining concession 5,000.00
- Mining certificate 2,500.00
Title processing request fee
- Prospection and research license 850.00
- Mining concession 850.00
- Mining certificate 250.00
Registration of area extension application fee
- Prospection and research license 1,000.00
- Mining concession 2,000.00
- Mining certificate 750.00
Registration of area extension fee
- Prospection and research license 750.00
- Mining concession 2,000.00
- Mining certificate 500.00
Certified copy of any license or certificate 200.00
Certified copy/extract of any filed registration (per page) 200.00
In its turn, fees in the hydrocarbons area result essentially from Decree n.º 24/2004, of 20 August, which approves the Regulation on the Oil Operations, being the fees the following:
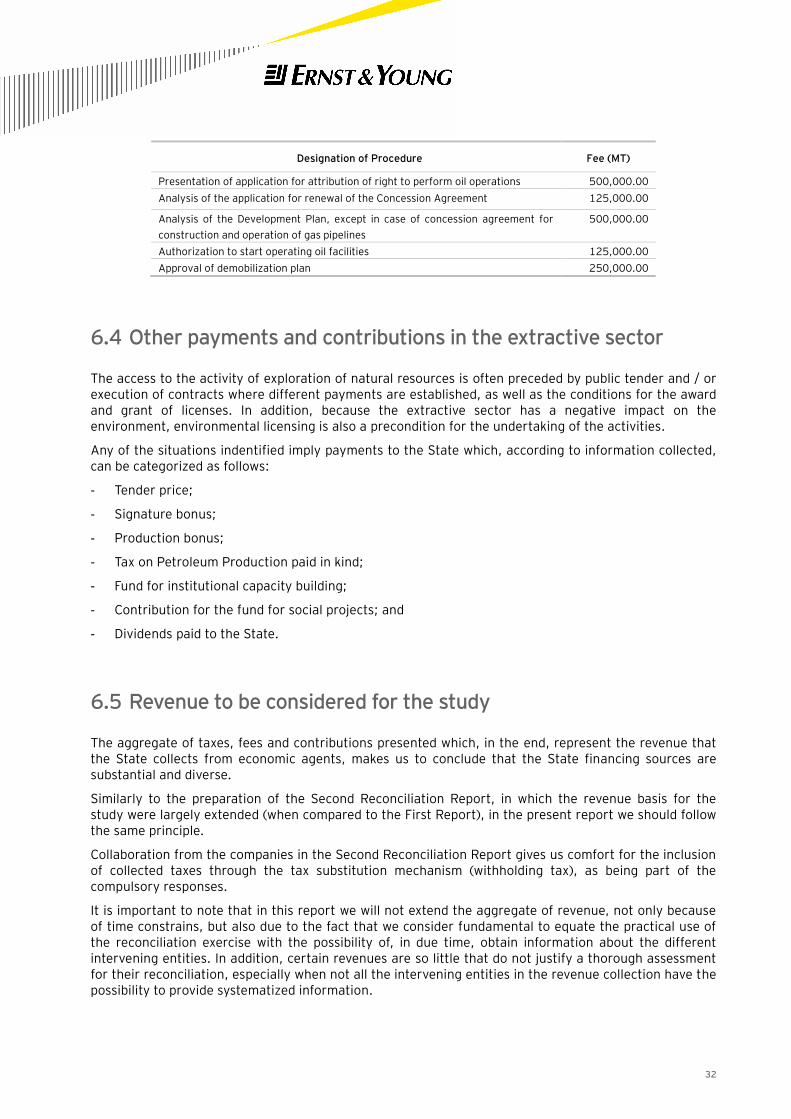
32
Designation of Procedure Fee (MT)
Presentation of application for attribution of right to perform oil operations 500,000.00
Analysis of the application for renewal of the Concession Agreement 125,000.00
Analysis of the Development Plan, except in case of concession agreement for
construction and operation of gas pipelines
500,000.00
Authorization to start operating oil facilities 125,000.00
Approval of demobilization plan 250,000.00
6.4 Other payments and contributions in the extractive sector
The access to the activity of exploration of natural resources is often preceded by public tender and / or execution of contracts where different payments are established, as well as the conditions for the award and grant of licenses. In addition, because the extractive sector has a negative impact on the environment, environmental licensing is also a precondition for the undertaking of the activities.
Any of the situations indentified imply payments to the State which, according to information collected, can be categorized as follows:
- Tender price;
- Signature bonus;
- Production bonus;
- Tax on Petroleum Production paid in kind;
- Fund for institutional capacity building;
- Contribution for the fund for social projects; and
- Dividends paid to the State.
6.5 Revenue to be considered for the study
The aggregate of taxes, fees and contributions presented which, in the end, represent the revenue that the State collects from economic agents, makes us to conclude that the State financing sources are substantial and diverse.
Similarly to the preparation of the Second Reconciliation Report, in which the revenue basis for the study were largely extended (when compared to the First Report), in the present report we should follow the same principle.
Collaboration from the companies in the Second Reconciliation Report gives us comfort for the inclusion of collected taxes through the tax substitution mechanism (withholding tax), as being part of the compulsory responses.
It is important to note that in this report we will not extend the aggregate of revenue, not only because of time constrains, but also due to the fact that we consider fundamental to equate the practical use of the reconciliation exercise with the possibility of, in due time, obtain information about the different intervening entities. In addition, certain revenues are so little that do not justify a thorough assessment for their reconciliation, especially when not all the intervening entities in the revenue collection have the possibility to provide systematized information.
33
After summarizing all taxes and fees that companies operating in the extractive industry are subject to as per the general legislation, it is relevant to propose the ones that due to their materiality justify, in our opinion, the reconciliation exercise.
Following the above, we excluded the taxes and fees from the Municipal Tax System not only because we consider those as less relevant from a financial perspective taking in consideration what is intended to reconcile, but also because we seriously doubt that there is a possibility to obtain information from the different Municipalities existent in the country in useful time.
For purposes of the present study and because we understand that the objective is to reconcile the tax and tax related revenue that are directly levied on the income of the companies, the following taxes, fees and contributions will be considered in the present study:
- Existing taxes and fees that are specific to the sector, excluding administrative fees charged in the licensing process;
- Payments and contributions in the extractive industry;
- IRPC, excluding the payments made by the companies as tax substitutes 3;
- IRPS;
- Other existing payments and contributions in the extractive industry and that are referred in 4.5. above.
Notwithstanding having excludes some taxes and fees from the scope of the work, in the reporting templates we left a field for the inclusion of other payments made by companies, especially, the various administrative fees applicable to this sector.
The municipal taxes and fees were not even considered as these represent local government revenues (municipalities). These are public legal persons that are distinct from the State, have the authority to collect revenue in the areas under their jurisdiction and what is known is that they are in the phase of organising their system of revenue collection.
We have also not considered taxes on spending because in this industry where active transactions represent exports, these taxes are collected by the General Directorate of Customs at the time of import of goods.
Given that Law No. 13/2007 of 28 June, as well as the agreements previously concluded between the companies and the State provide for the exemption from customs duties and VAT for most goods used in the activities, this revenue may not be significant.
In addition, it may not be objectively feasible to reconcile the customs revenue because the collection stations are spread across the country and are not always linked to a centralized computer network.
34
7 Entities responsible for the collection
The Financial Management System of the State approved by Law n.º 9 / 2002 of 12 February and the legislation subsequently produced, came to introduce changes to the rules of payment of taxes due the State.
In this sense, and with few exceptions, the payment of taxes and fees with relevance to this study always occurs at the DGI which collects it through Large Taxpayers Unit and Tax Areas.
As a general rule, payments are made at the Tax Area where the company has its registered office. However, and since this is not required by law, there are instances where payment of certain taxes, namely those levied on the income of employees are done at the place where the branch/operations of the company is located.
Certain payments are made directly to INP at the time of signature of the contracts. While others result from dividends related to participations held by the State through IGEPE or directly by the Ministry of Finance.
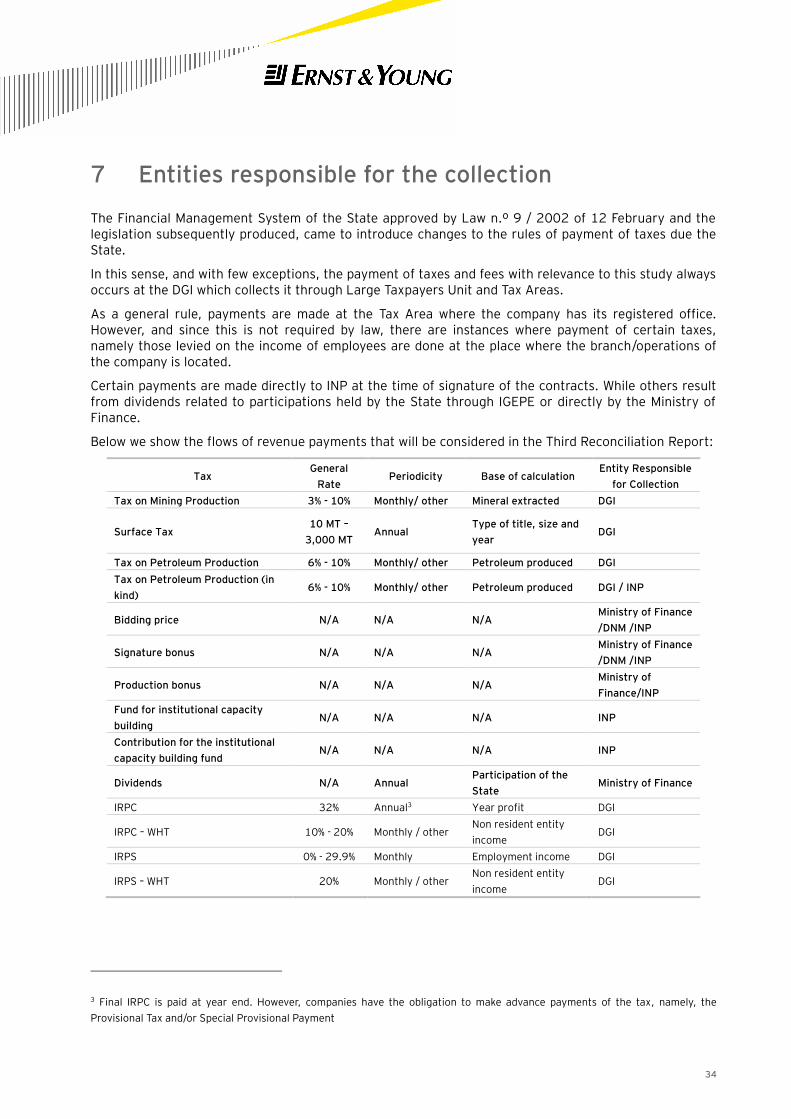
Below we show the flows of revenue payments that will be considered in the Third Reconciliation Report:
Tax General
Rate Periodicity Base of calculation
Entity Responsible
for Collection
Tax on Mining Production 3% - 10% Monthly/ other Mineral extracted DGI
Surface Tax 10 MT –
3,000 MT Annual
Type of title, size and
year DGI
Tax on Petroleum Production 6% - 10% Monthly/ other Petroleum produced DGI
Tax on Petroleum Production (in
kind) 6% - 10% Monthly/ other Petroleum produced DGI / INP
Bidding price N/A N/A N/A Ministry of Finance
/DNM /INP
Signature bonus N/A N/A N/A Ministry of Finance
/DNM /INP
Production bonus N/A N/A N/A Ministry of
Finance/INP
Fund for institutional capacity
building N/A N/A N/A INP
Contribution for the institutional
capacity building fund N/A N/A N/A INP
Dividends N/A Annual Participation of the
State Ministry of Finance
IRPC 32% Annual3 Year profit DGI
IRPC – WHT 10% - 20% Monthly / other Non resident entity
income DGI
IRPS 0% - 29.9% Monthly Employment income DGI
IRPS – WHT 20% Monthly / other Non resident entity
income DGI
3 Final IRPC is paid at year end. However, companies have the obligation to make advance payments of the tax, namely, the
Provisional Tax and/or Special Provisional Payment
35
8 Reconciliation Process
8.1 Companies that did not Reply to the Reporting Template
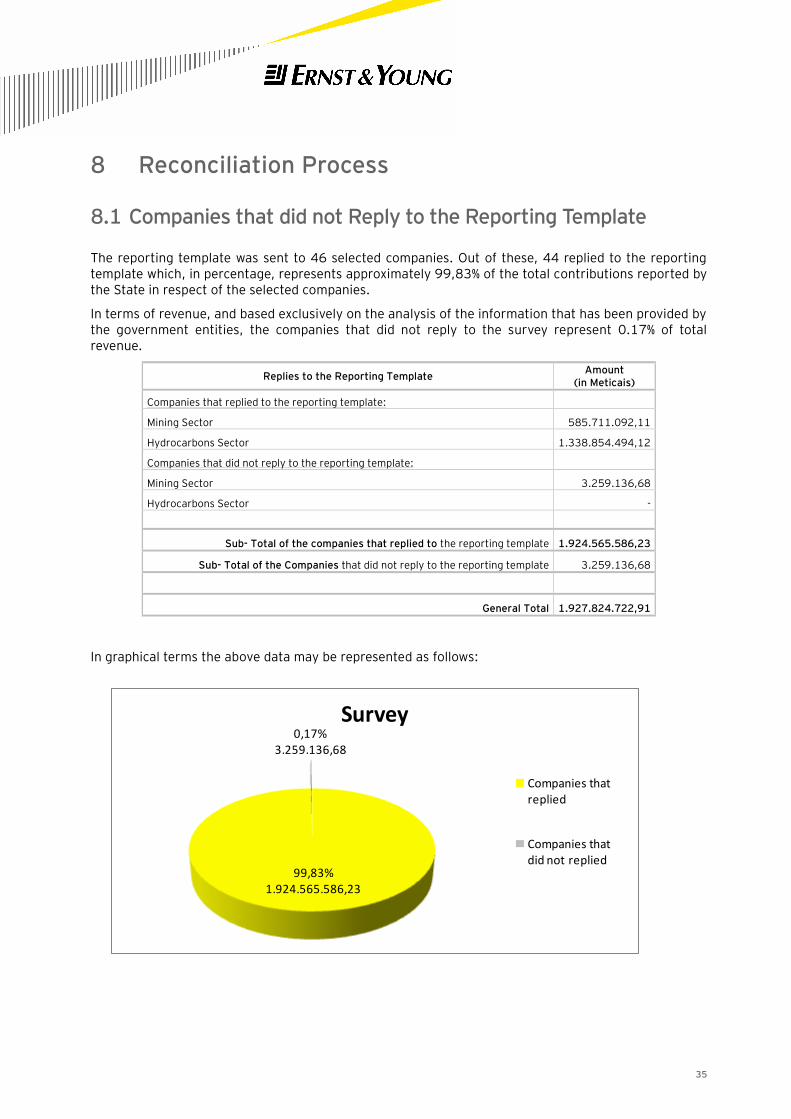
The reporting template was sent to 46 selected companies. Out of these, 44 replied to the reporting template which, in percentage, represents approximately 99,83% of the total contributions reported by the State in respect of the selected companies.
In terms of revenue, and based exclusively on the analysis of the information that has been provided by the government entities, the companies that did not reply to the survey represent 0.17% of total revenue.
Replies to the Reporting Template Amount
(in Meticais)
Companies that replied to the reporting template:
Mining Sector 585.711.092,11
Hydrocarbons Sector 1.338.854.494,12
Companies that did not reply to the reporting template:
Mining Sector 3.259.136,68
Hydrocarbons Sector -
Sub- Total of the companies that replied to the reporting template 1.924.565.586,23
Sub- Total of the Companies that did not reply to the reporting template 3.259.136,68
General Total 1.927.824.722,91
In graphical terms the above data may be represented as follows:
99,83% 1.924.565.586,23
0,17%3.259.136,68
Survey
Companies that replied
Companies that did not replied
36
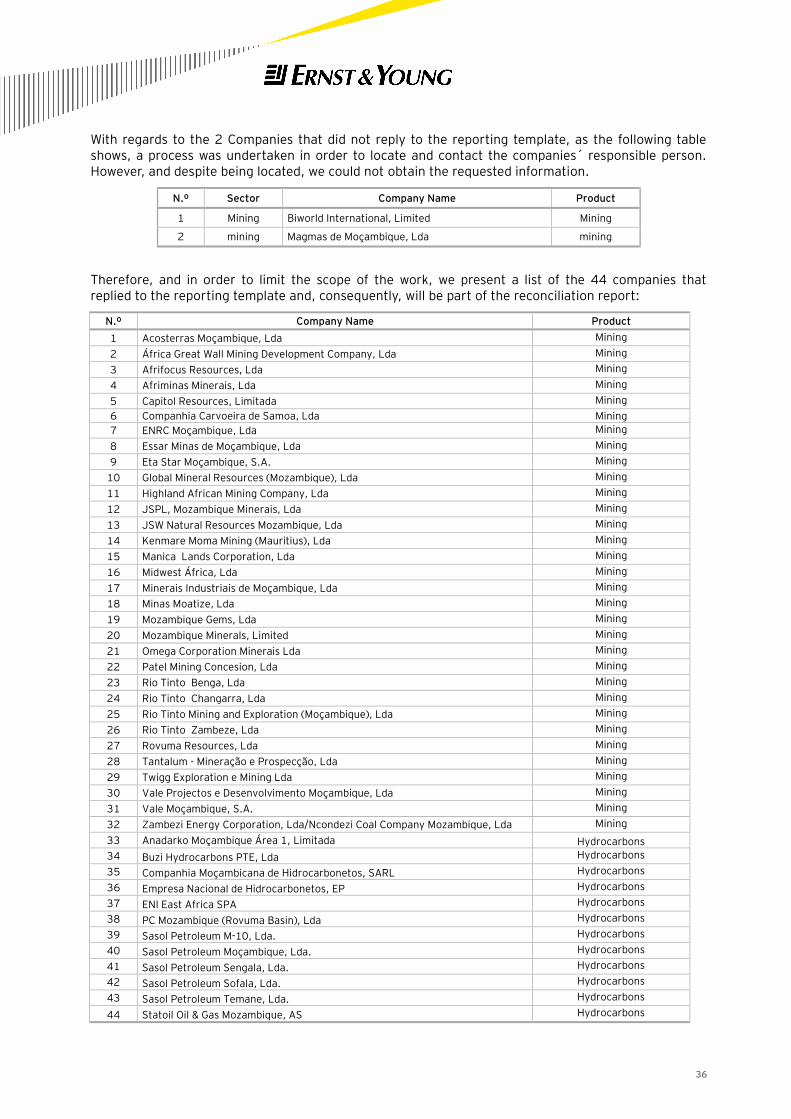
With regards to the 2 Companies that did not reply to the reporting template, as the following table shows, a process was undertaken in order to locate and contact the companies´ responsible person. However, and despite being located, we could not obtain the requested information.
N.º Sector Company Name Product
1 Mining Biworld International, Limited Mining
2 mining Magmas de Moçambique, Lda mining
Therefore, and in order to limit the scope of the work, we present a list of the 44 companies that replied to the reporting template and, consequently, will be part of the reconciliation report:
N.º Company Name Product
1 Acosterras Moçambique, Lda Mining
2 África Great Wall Mining Development Company, Lda Mining
3 Afrifocus Resources, Lda Mining
4 Afriminas Minerais, Lda Mining
5 Capitol Resources, Limitada Mining
6 Companhia Carvoeira de Samoa, Lda Mining
7 ENRC Moçambique, Lda Mining
8 Essar Minas de Moçambique, Lda Mining
9 Eta Star Moçambique, S.A. Mining
10 Global Mineral Resources (Mozambique), Lda Mining
11 Highland African Mining Company, Lda Mining
12 JSPL, Mozambique Minerais, Lda Mining
13 JSW Natural Resources Mozambique, Lda Mining
14 Kenmare Moma Mining (Mauritius), Lda Mining
15 Manica Lands Corporation, Lda Mining
16 Midwest África, Lda Mining
17 Minerais Industriais de Moçambique, Lda Mining
18 Minas Moatize, Lda Mining
19 Mozambique Gems, Lda Mining
20 Mozambique Minerals, Limited Mining
21 Omega Corporation Minerais Lda Mining
22 Patel Mining Concesion, Lda Mining
23 Rio Tinto Benga, Lda Mining
24 Rio Tinto Changarra, Lda Mining
25 Rio Tinto Mining and Exploration (Moçambique), Lda Mining
26 Rio Tinto Zambeze, Lda Mining
27 Rovuma Resources, Lda Mining
28 Tantalum - Mineração e Prospecção, Lda Mining
29 Twigg Exploration e Mining Lda Mining
30 Vale Projectos e Desenvolvimento Moçambique, Lda Mining
31 Vale Moçambique, S.A. Mining
32 Zambezi Energy Corporation, Lda/Ncondezi Coal Company Mozambique, Lda Mining
33 Anadarko Moçambique Área 1, Limitada Hydrocarbons
34 Buzi Hydrocarbons PTE, Lda Hydrocarbons
35 Companhia Moçambicana de Hidrocarbonetos, SARL Hydrocarbons
36 Empresa Nacional de Hidrocarbonetos, EP Hydrocarbons
37 ENI East Africa SPA Hydrocarbons
38 PC Mozambique (Rovuma Basin), Lda Hydrocarbons
39 Sasol Petroleum M-10, Lda. Hydrocarbons
40 Sasol Petroleum Moçambique, Lda. Hydrocarbons
41 Sasol Petroleum Sengala, Lda. Hydrocarbons
42 Sasol Petroleum Sofala, Lda. Hydrocarbons
43 Sasol Petroleum Temane, Lda. Hydrocarbons
44 Statoil Oil & Gas Mozambique, AS Hydrocarbons
37
Once determined the number of companies that will be included the study, we will now present our findings with regards to the process of reconciliation of the payments reported by companies in the extractive industry and the revenue reported by the government entities responsible for its collection.
The presentation of the findings will be made for each of the areas, in a first phase, for each of the companies with the overall amounts together, and in a second phase, the values for each of the desegregated amounts per type of tax/ contribution.
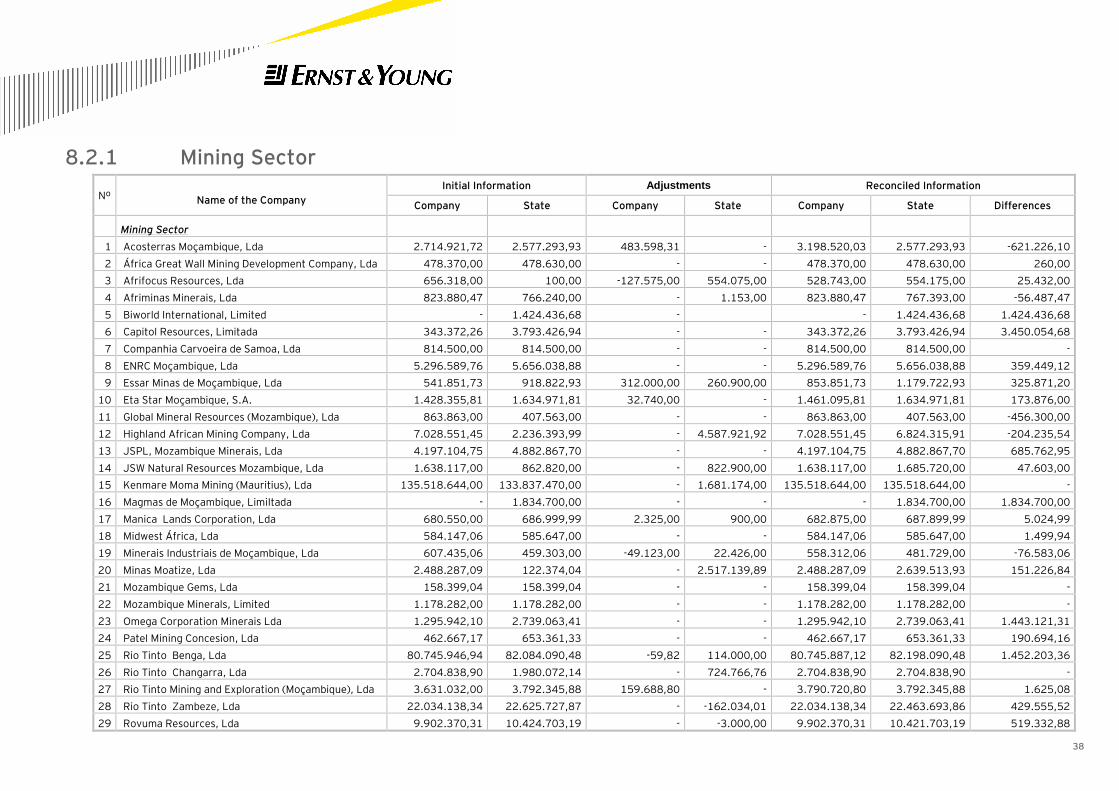
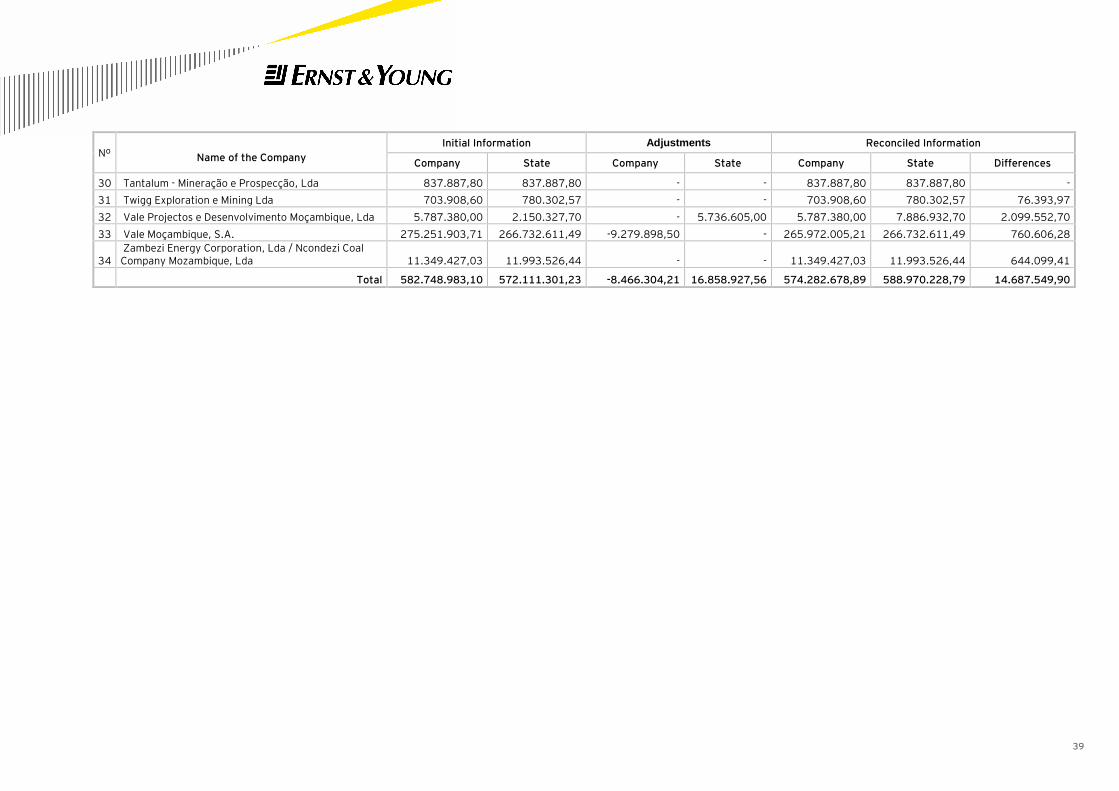
8.2 Amounts Declared by the Companies and by the State
Institutions
In the following tables we present the amounts initially declared by the companies and State institutions as well as the reconciliation of the same after review and verification of the supporting documents as well as clarifications obtained.
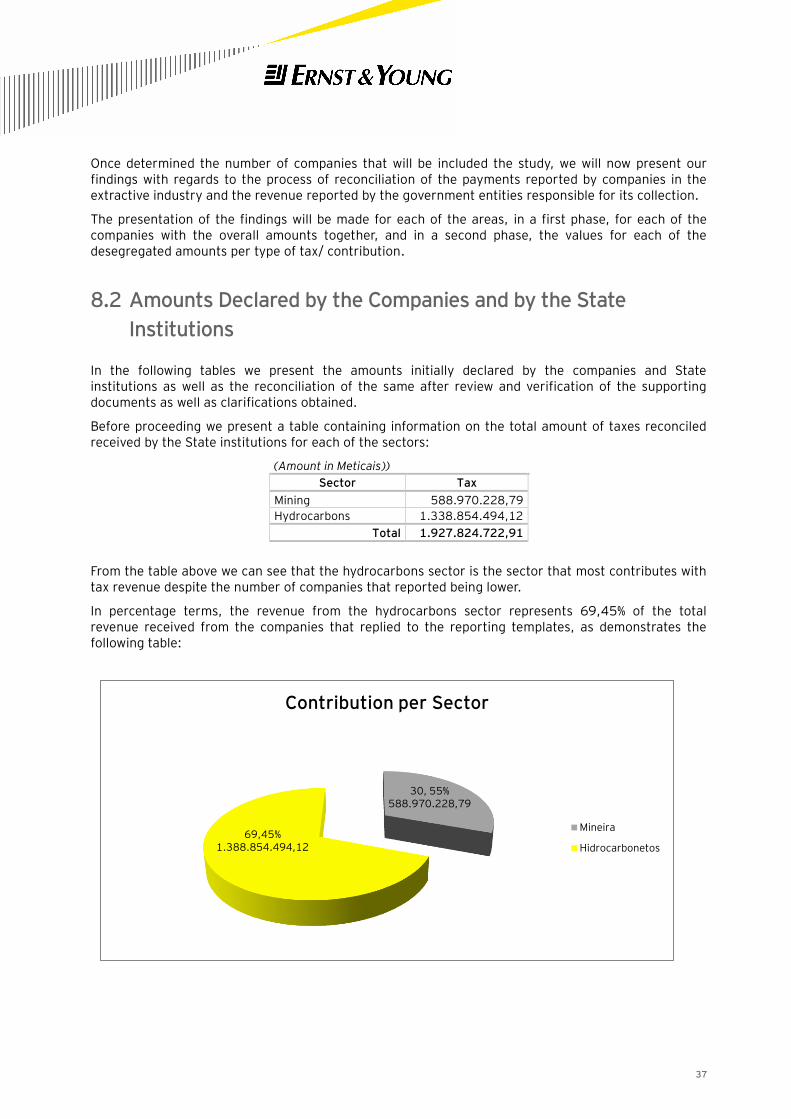
Before proceeding we present a table containing information on the total amount of taxes reconciled received by the State institutions for each of the sectors:
(Amount in Meticais))
Sector Tax
Mining 588.970.228,79
Hydrocarbons 1.338.854.494,12
Total 1.927.824.722,91
From the table above we can see that the hydrocarbons sector is the sector that most contributes with tax revenue despite the number of companies that reported being lower.
In percentage terms, the revenue from the hydrocarbons sector represents 69,45% of the total revenue received from the companies that replied to the reporting templates, as demonstrates the following table:
30, 55% 588.970.228,79
69,45% 1.388.854.494,12
Contribution per Sector
Mineira
Hidrocarbonetos
38
8.2.1 Mining Sector
Nº Name of the Company
Initial Information Adjustments Reconciled Information
Company State Company State Company State Differences
Mining Sector
1 Acosterras Moçambique, Lda 2.714.921,72 2.577.293,93 483.598,31 - 3.198.520,03 2.577.293,93 -621.226,10
2 África Great Wall Mining Development Company, Lda 478.370,00 478.630,00 - - 478.370,00 478.630,00 260,00
3 Afrifocus Resources, Lda 656.318,00 100,00 -127.575,00 554.075,00 528.743,00 554.175,00 25.432,00
4 Afriminas Minerais, Lda 823.880,47 766.240,00 - 1.153,00 823.880,47 767.393,00 -56.487,47
5 Biworld International, Limited - 1.424.436,68 - - 1.424.436,68 1.424.436,68
6 Capitol Resources, Limitada 343.372,26 3.793.426,94 - - 343.372,26 3.793.426,94 3.450.054,68
7 Companhia Carvoeira de Samoa, Lda 814.500,00 814.500,00 - - 814.500,00 814.500,00 -
8 ENRC Moçambique, Lda 5.296.589,76 5.656.038,88 - - 5.296.589,76 5.656.038,88 359.449,12
9 Essar Minas de Moçambique, Lda 541.851,73 918.822,93 312.000,00 260.900,00 853.851,73 1.179.722,93 325.871,20
10 Eta Star Moçambique, S.A. 1.428.355,81 1.634.971,81 32.740,00 - 1.461.095,81 1.634.971,81 173.876,00
11 Global Mineral Resources (Mozambique), Lda 863.863,00 407.563,00 - - 863.863,00 407.563,00 -456.300,00
12 Highland African Mining Company, Lda 7.028.551,45 2.236.393,99 - 4.587.921,92 7.028.551,45 6.824.315,91 -204.235,54
13 JSPL, Mozambique Minerais, Lda 4.197.104,75 4.882.867,70 - - 4.197.104,75 4.882.867,70 685.762,95
14 JSW Natural Resources Mozambique, Lda 1.638.117,00 862.820,00 - 822.900,00 1.638.117,00 1.685.720,00 47.603,00
15 Kenmare Moma Mining (Mauritius), Lda 135.518.644,00 133.837.470,00 - 1.681.174,00 135.518.644,00 135.518.644,00 -
16 Magmas de Moçambique, LimiItada - 1.834.700,00 - - - 1.834.700,00 1.834.700,00
17 Manica Lands Corporation, Lda 680.550,00 686.999,99 2.325,00 900,00 682.875,00 687.899,99 5.024,99
18 Midwest África, Lda 584.147,06 585.647,00 - - 584.147,06 585.647,00 1.499,94
19 Minerais Industriais de Moçambique, Lda 607.435,06 459.303,00 -49.123,00 22.426,00 558.312,06 481.729,00 -76.583,06
20 Minas Moatize, Lda 2.488.287,09 122.374,04 - 2.517.139,89 2.488.287,09 2.639.513,93 151.226,84
21 Mozambique Gems, Lda 158.399,04 158.399,04 - - 158.399,04 158.399,04 -
22 Mozambique Minerals, Limited 1.178.282,00 1.178.282,00 - - 1.178.282,00 1.178.282,00 -
23 Omega Corporation Minerais Lda 1.295.942,10 2.739.063,41 - - 1.295.942,10 2.739.063,41 1.443.121,31
24 Patel Mining Concesion, Lda 462.667,17 653.361,33 - - 462.667,17 653.361,33 190.694,16
25 Rio Tinto Benga, Lda 80.745.946,94 82.084.090,48 -59,82 114.000,00 80.745.887,12 82.198.090,48 1.452.203,36
26 Rio Tinto Changarra, Lda 2.704.838,90 1.980.072,14 - 724.766,76 2.704.838,90 2.704.838,90 -
27 Rio Tinto Mining and Exploration (Moçambique), Lda 3.631.032,00 3.792.345,88 159.688,80 - 3.790.720,80 3.792.345,88 1.625,08
28 Rio Tinto Zambeze, Lda 22.034.138,34 22.625.727,87 - -162.034,01 22.034.138,34 22.463.693,86 429.555,52
29 Rovuma Resources, Lda 9.902.370,31 10.424.703,19 - -3.000,00 9.902.370,31 10.421.703,19 519.332,88
39
Nº Name of the Company
Initial Information Adjustments Reconciled Information
Company State Company State Company State Differences
30 Tantalum - Mineração e Prospecção, Lda 837.887,80 837.887,80 - - 837.887,80 837.887,80 -
31 Twigg Exploration e Mining Lda 703.908,60 780.302,57 - - 703.908,60 780.302,57 76.393,97
32 Vale Projectos e Desenvolvimento Moçambique, Lda 5.787.380,00 2.150.327,70 - 5.736.605,00 5.787.380,00 7.886.932,70 2.099.552,70
33 Vale Moçambique, S.A. 275.251.903,71 266.732.611,49 -9.279.898,50 - 265.972.005,21 266.732.611,49 760.606,28
34 Zambezi Energy Corporation, Lda / Ncondezi Coal Company Mozambique, Lda 11.349.427,03 11.993.526,44 - - 11.349.427,03 11.993.526,44 644.099,41
Total 582.748.983,10 572.111.301,23 -8.466.304,21 16.858.927,56 574.282.678,89 588.970.228,79 14.687.549,90
40
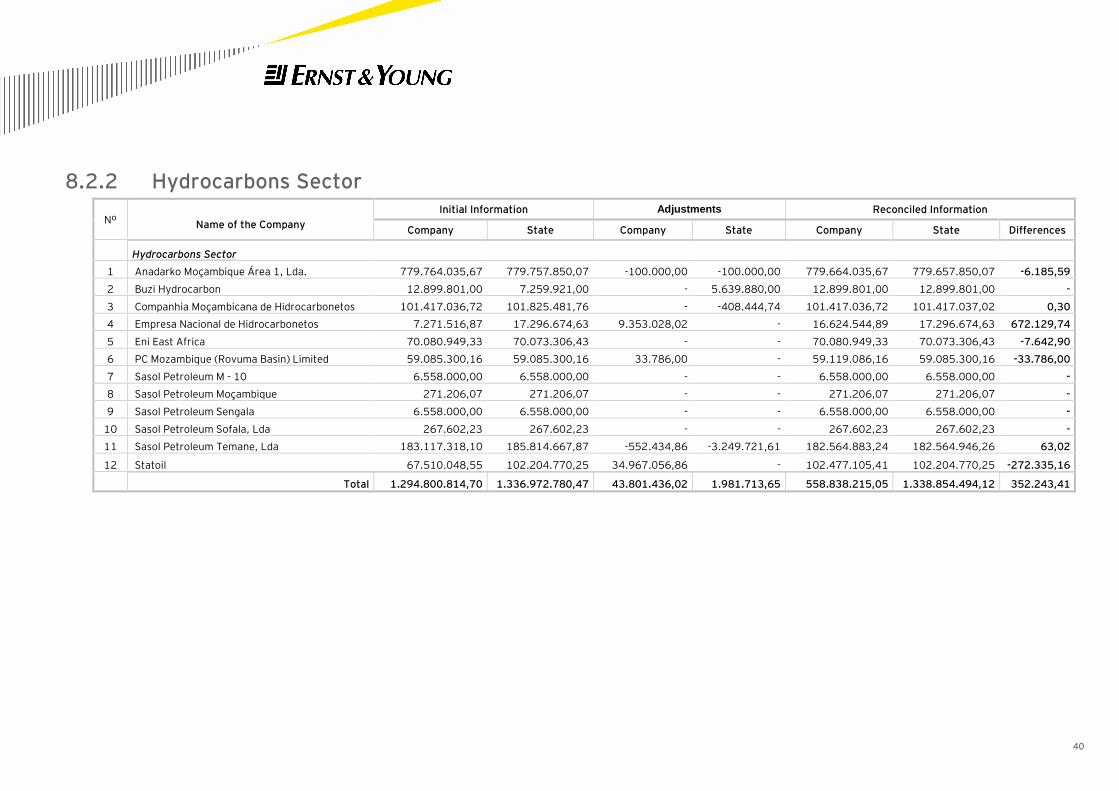
8.2.2 Hydrocarbons Sector
Nº Name of the Company
Initial Information Adjustments Reconciled Information
Company State Company State Company State Differences
Hydrocarbons Sector
1 Anadarko Moçambique Área 1, Lda. 779.764.035,67 779.757.850,07 -100.000,00 -100.000,00 779.664.035,67 779.657.850,07 -6.185,59
2 Buzi Hydrocarbon 12.899.801,00 7.259.921,00 - 5.639.880,00 12.899.801,00 12.899.801,00 -
3 Companhia Moçambicana de Hidrocarbonetos 101.417.036,72 101.825.481,76 - -408.444,74 101.417.036,72 101.417.037,02 0,30
4 Empresa Nacional de Hidrocarbonetos 7.271.516,87 17.296.674,63 9.353.028,02 - 16.624.544,89 17.296.674,63 672.129,74
5 Eni East Africa 70.080.949,33 70.073.306,43 - - 70.080.949,33 70.073.306,43 -7.642,90
6 PC Mozambique (Rovuma Basin) Limited 59.085.300,16 59.085.300,16 33.786,00 - 59.119.086,16 59.085.300,16 -33.786,00
7 Sasol Petroleum M - 10 6.558.000,00 6.558.000,00 - - 6.558.000,00 6.558.000,00 -
8 Sasol Petroleum Moçambique 271.206,07 271.206,07 - - 271.206,07 271.206,07 -
9 Sasol Petroleum Sengala 6.558.000,00 6.558.000,00 - - 6.558.000,00 6.558.000,00 -
10 Sasol Petroleum Sofala, Lda 267.602,23 267.602,23 - - 267.602,23 267.602,23 -
11 Sasol Petroleum Temane, Lda 183.117.318,10 185.814.667,87 -552.434,86 -3.249.721,61 182.564.883,24 182.564.946,26 63,02
12 Statoil 67.510.048,55 102.204.770,25 34.967.056,86 - 102.477.105,41 102.204.770,25 -272.335,16
Total 1.294.800.814,70 1.336.972.780,47 43.801.436,02 1.981.713,65 558.838.215,05 1.338.854.494,12 352.243,41
41
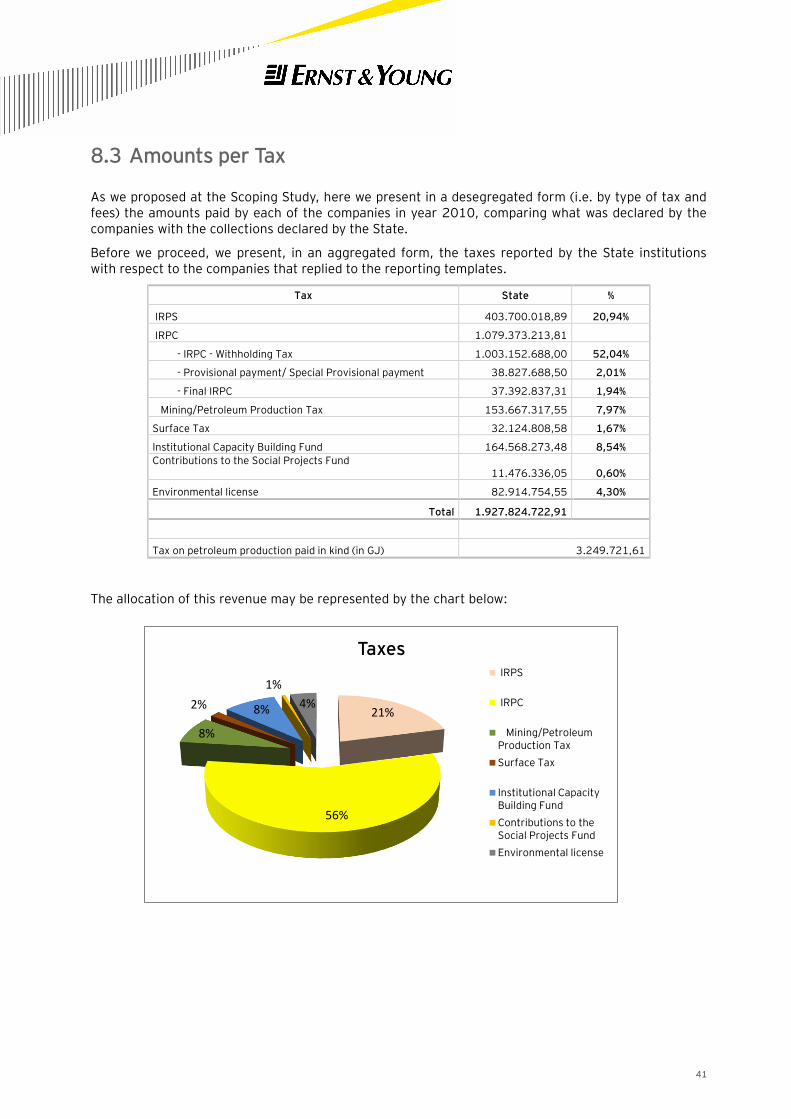
8.3 Amounts per Tax
As we proposed at the Scoping Study, here we present in a desegregated form (i.e. by type of tax and fees) the amounts paid by each of the companies in year 2010, comparing what was declared by the companies with the collections declared by the State.
Before we proceed, we present, in an aggregated form, the taxes reported by the State institutions with respect to the companies that replied to the reporting templates.
Tax State %
IRPS 403.700.018,89 20,94%
IRPC 1.079.373.213,81
- IRPC - Withholding Tax 1.003.152.688,00 52,04%
- Provisional payment/ Special Provisional payment 38.827.688,50 2,01%
- Final IRPC 37.392.837,31 1,94%
Mining/Petroleum Production Tax 153.667.317,55 7,97%
Surface Tax 32.124.808,58 1,67%
Institutional Capacity Building Fund 164.568.273,48 8,54%
Contributions to the Social Projects Fund 11.476.336,05 0,60%
Environmental license 82.914.754,55 4,30%
Total 1.927.824.722,91
Tax on petroleum production paid in kind (in GJ) 3.249.721,61
The allocation of this revenue may be represented by the chart below:
21%
56%
8%
2% 8%
1%
4%
Taxes IRPS
IRPC
Mining/Petroleum Production Tax
Surface Tax
Institutional Capacity Building Fund
Contributions to the Social Projects Fund
Environmental license
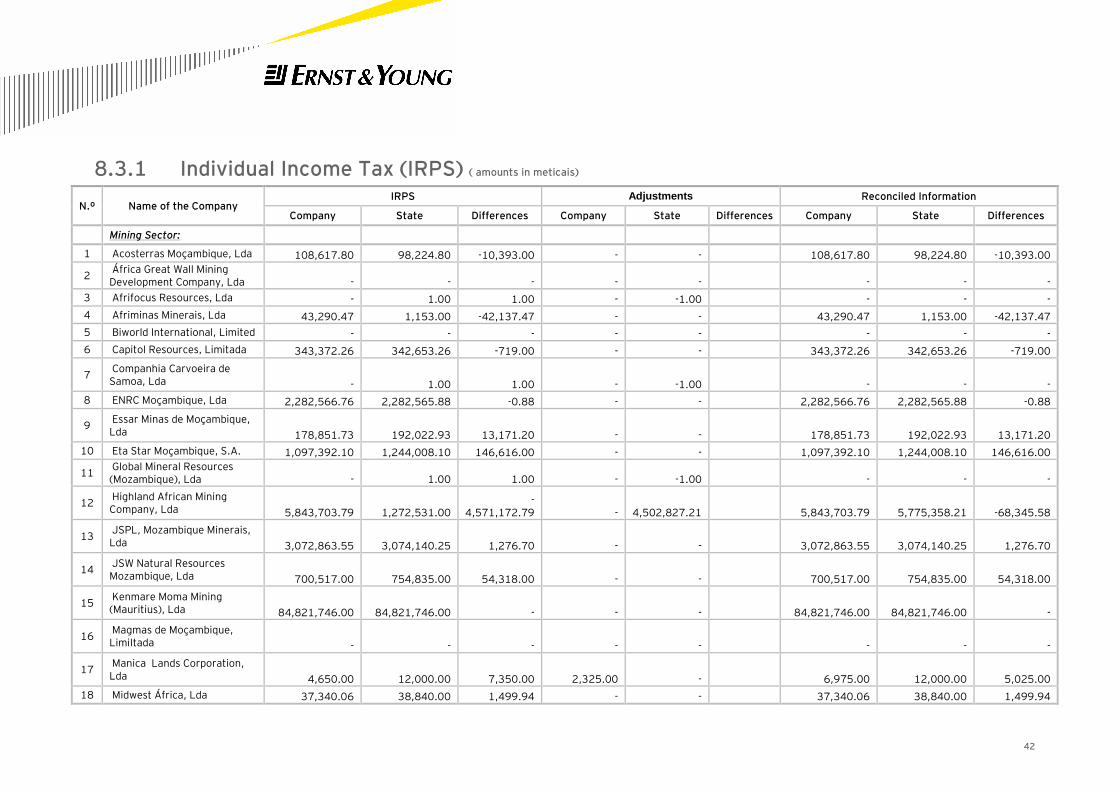
42
8.3.1 Individual Income Tax (IRPS) ( amounts in meticais)
N.º Name of the Company IRPS Adjustments Reconciled Information
Company State Differences Company State Differences Company State Differences
Mining Sector:
1 Acosterras Moçambique, Lda 108,617.80 98,224.80 -10,393.00 - - 108,617.80 98,224.80 -10,393.00
2 África Great Wall Mining Development Company, Lda - - - - - - - -
3 Afrifocus Resources, Lda - 1.00 1.00 - -1.00 - - -
4 Afriminas Minerais, Lda 43,290.47 1,153.00 -42,137.47 - - 43,290.47 1,153.00 -42,137.47
5 Biworld International, Limited - - - - - - - -
6 Capitol Resources, Limitada 343,372.26 342,653.26 -719.00 - - 343,372.26 342,653.26 -719.00
7 Companhia Carvoeira de Samoa, Lda - 1.00 1.00 - -1.00 - - -
8 ENRC Moçambique, Lda 2,282,566.76 2,282,565.88 -0.88 - - 2,282,566.76 2,282,565.88 -0.88
9 Essar Minas de Moçambique, Lda 178,851.73 192,022.93 13,171.20 - - 178,851.73 192,022.93 13,171.20
10 Eta Star Moçambique, S.A. 1,097,392.10 1,244,008.10 146,616.00 - - 1,097,392.10 1,244,008.10 146,616.00
11 Global Mineral Resources (Mozambique), Lda - 1.00 1.00 - -1.00 - - -
12 Highland African Mining Company, Lda 5,843,703.79 1,272,531.00
-4,571,172.79 - 4,502,827.21 5,843,703.79 5,775,358.21 -68,345.58
13 JSPL, Mozambique Minerais, Lda 3,072,863.55 3,074,140.25 1,276.70 - - 3,072,863.55 3,074,140.25 1,276.70
14 JSW Natural Resources Mozambique, Lda 700,517.00 754,835.00 54,318.00 - - 700,517.00 754,835.00 54,318.00
15 Kenmare Moma Mining (Mauritius), Lda 84,821,746.00 84,821,746.00 - - - 84,821,746.00 84,821,746.00 -
16 Magmas de Moçambique, LimiItada - - - - - - - -
17 Manica Lands Corporation, Lda 4,650.00 12,000.00 7,350.00 2,325.00 - 6,975.00 12,000.00 5,025.00
18 Midwest África, Lda 37,340.06 38,840.00 1,499.94 - - 37,340.06 38,840.00 1,499.94
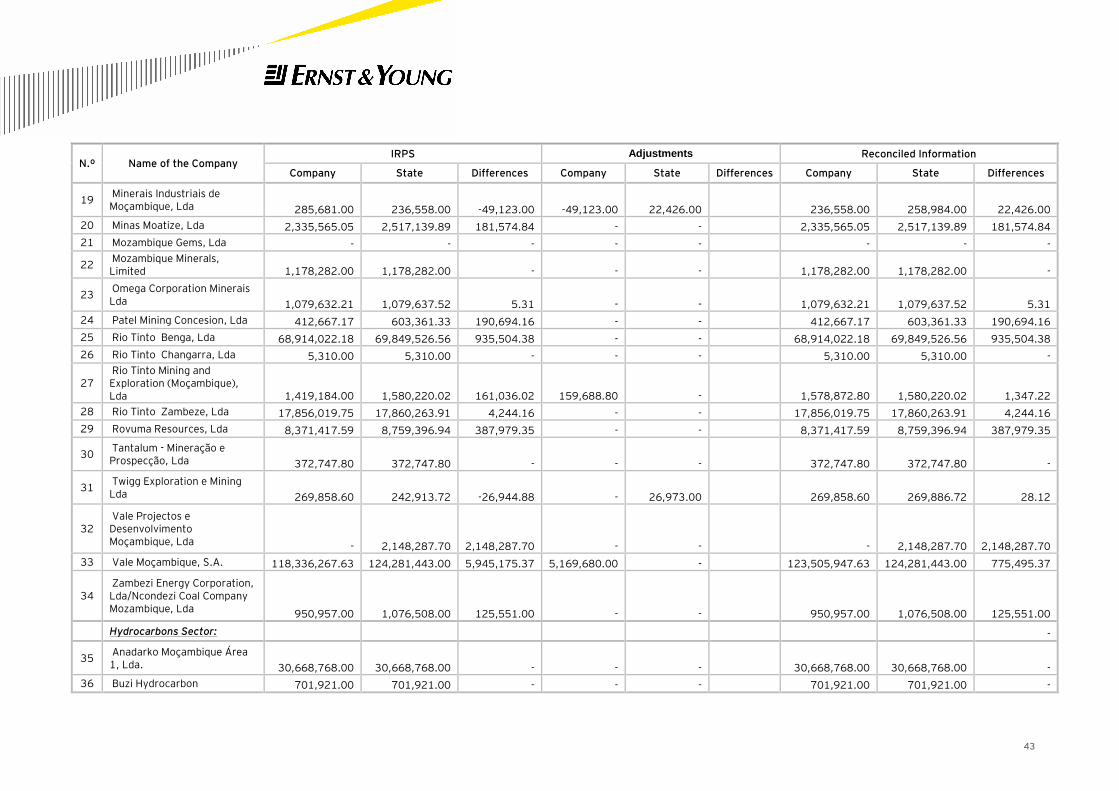
43
N.º Name of the Company IRPS Adjustments Reconciled Information
Company State Differences Company State Differences Company State Differences
19 Minerais Industriais de Moçambique, Lda 285,681.00 236,558.00 -49,123.00 -49,123.00 22,426.00 236,558.00 258,984.00 22,426.00
20 Minas Moatize, Lda 2,335,565.05 2,517,139.89 181,574.84 - - 2,335,565.05 2,517,139.89 181,574.84
21 Mozambique Gems, Lda - - - - - - - -
22 Mozambique Minerals, Limited 1,178,282.00 1,178,282.00 - - - 1,178,282.00 1,178,282.00 -
23 Omega Corporation Minerais Lda 1,079,632.21 1,079,637.52 5.31 - - 1,079,632.21 1,079,637.52 5.31
24 Patel Mining Concesion, Lda 412,667.17 603,361.33 190,694.16 - - 412,667.17 603,361.33 190,694.16
25 Rio Tinto Benga, Lda 68,914,022.18 69,849,526.56 935,504.38 - - 68,914,022.18 69,849,526.56 935,504.38
26 Rio Tinto Changarra, Lda 5,310.00 5,310.00 - - - 5,310.00 5,310.00 -
27 Rio Tinto Mining and Exploration (Moçambique), Lda 1,419,184.00 1,580,220.02 161,036.02 159,688.80 - 1,578,872.80 1,580,220.02 1,347.22
28 Rio Tinto Zambeze, Lda 17,856,019.75 17,860,263.91 4,244.16 - - 17,856,019.75 17,860,263.91 4,244.16
29 Rovuma Resources, Lda 8,371,417.59 8,759,396.94 387,979.35 - - 8,371,417.59 8,759,396.94 387,979.35
30 Tantalum - Mineração e Prospecção, Lda 372,747.80 372,747.80 - - - 372,747.80 372,747.80 -
31 Twigg Exploration e Mining Lda 269,858.60 242,913.72 -26,944.88 - 26,973.00 269,858.60 269,886.72 28.12
32 Vale Projectos e Desenvolvimento Moçambique, Lda - 2,148,287.70 2,148,287.70 - - - 2,148,287.70 2,148,287.70
33 Vale Moçambique, S.A. 118,336,267.63 124,281,443.00 5,945,175.37 5,169,680.00 - 123,505,947.63 124,281,443.00 775,495.37
34 Zambezi Energy Corporation, Lda/Ncondezi Coal Company Mozambique, Lda 950,957.00 1,076,508.00 125,551.00 - - 950,957.00 1,076,508.00 125,551.00
Hydrocarbons Sector: -
35 Anadarko Moçambique Área 1, Lda. 30,668,768.00 30,668,768.00 - - - 30,668,768.00 30,668,768.00 -
36 Buzi Hydrocarbon 701,921.00 701,921.00 - - - 701,921.00 701,921.00 -
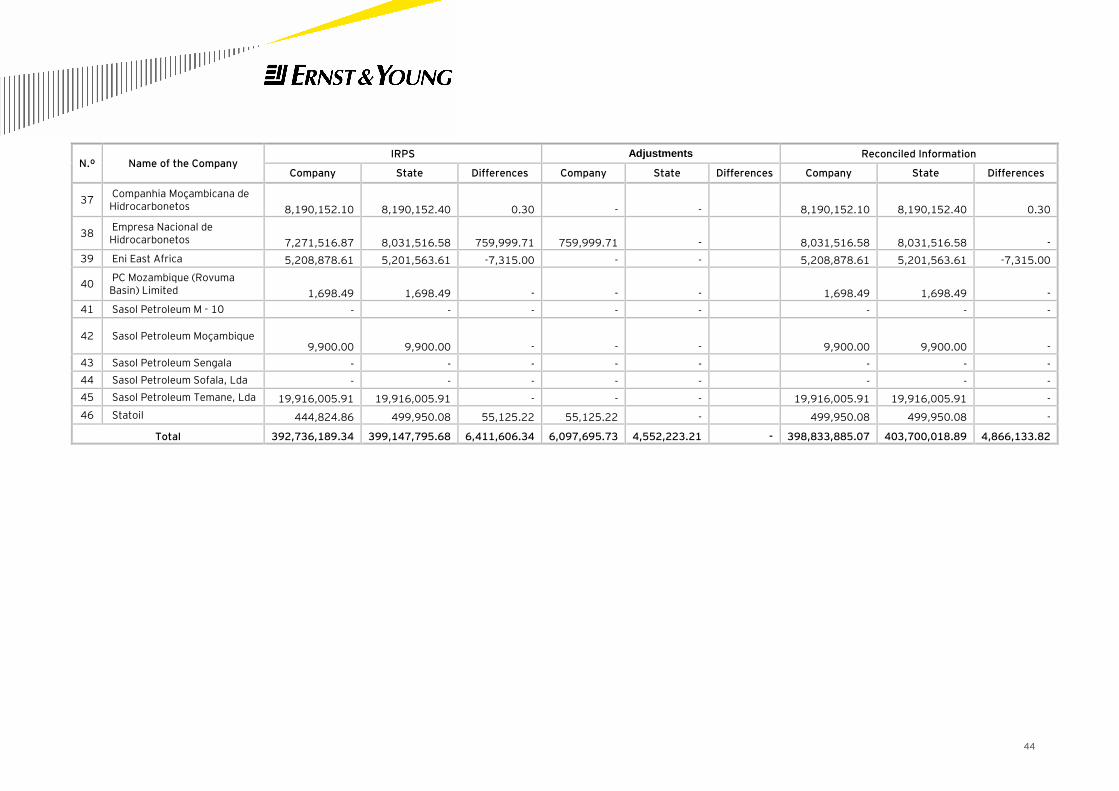
44
N.º Name of the Company IRPS Adjustments Reconciled Information
Company State Differences Company State Differences Company State Differences
37 Companhia Moçambicana de Hidrocarbonetos 8,190,152.10 8,190,152.40 0.30 - - 8,190,152.10 8,190,152.40 0.30
38 Empresa Nacional de Hidrocarbonetos 7,271,516.87 8,031,516.58 759,999.71 759,999.71 - 8,031,516.58 8,031,516.58 -
39 Eni East Africa 5,208,878.61 5,201,563.61 -7,315.00 - - 5,208,878.61 5,201,563.61 -7,315.00
40 PC Mozambique (Rovuma Basin) Limited 1,698.49 1,698.49 - - - 1,698.49 1,698.49 -
41 Sasol Petroleum M - 10 - - - - - - - -
42 Sasol Petroleum Moçambique 9,900.00 9,900.00 - - - 9,900.00 9,900.00 -
43 Sasol Petroleum Sengala - - - - - - - -
44 Sasol Petroleum Sofala, Lda - - - - - - - -
45 Sasol Petroleum Temane, Lda 19,916,005.91 19,916,005.91 - - - 19,916,005.91 19,916,005.91 -
46 Statoil 444,824.86 499,950.08 55,125.22 55,125.22 - 499,950.08 499,950.08 -
Total 392,736,189.34 399,147,795.68 6,411,606.34 6,097,695.73 4,552,223.21 - 398,833,885.07 403,700,018.89 4,866,133.82
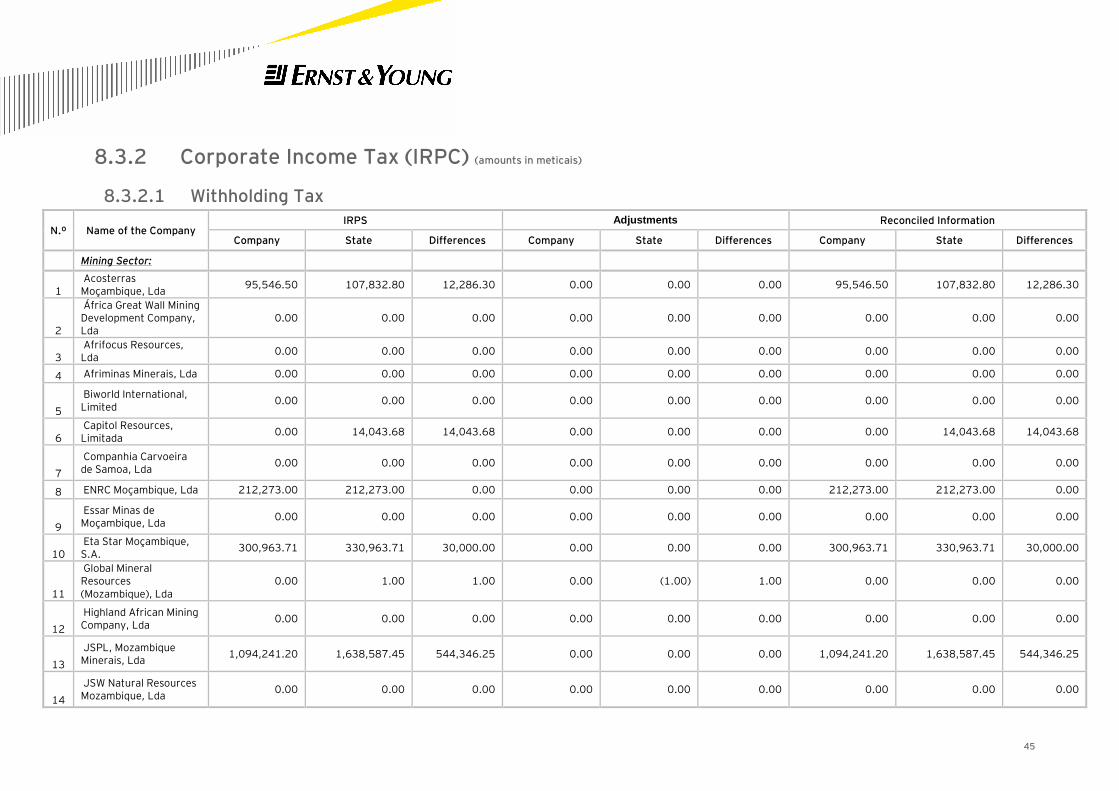
45
8.3.2 Corporate Income Tax (IRPC) (amounts in meticais)
8.3.2.1 Withholding Tax
N.º Name of the Company IRPS Adjustments Reconciled Information
Company State Differences Company State Differences Company State Differences
Mining Sector:
1 Acosterras Moçambique, Lda
95,546.50 107,832.80 12,286.30 0.00 0.00 0.00 95,546.50 107,832.80 12,286.30
2
África Great Wall Mining Development Company, Lda
0.00 0.00 0.00 0.00 0.00 0.00 0.00 0.00 0.00
3 Afrifocus Resources, Lda
0.00 0.00 0.00 0.00 0.00 0.00 0.00 0.00 0.00
4 Afriminas Minerais, Lda 0.00 0.00 0.00 0.00 0.00 0.00 0.00 0.00 0.00
5
Biworld International, Limited
0.00 0.00 0.00 0.00 0.00 0.00 0.00 0.00 0.00
6 Capitol Resources, Limitada
0.00 14,043.68 14,043.68 0.00 0.00 0.00 0.00 14,043.68 14,043.68
7
Companhia Carvoeira de Samoa, Lda
0.00 0.00 0.00 0.00 0.00 0.00 0.00 0.00 0.00
8 ENRC Moçambique, Lda 212,273.00 212,273.00 0.00 0.00 0.00 0.00 212,273.00 212,273.00 0.00
9
Essar Minas de Moçambique, Lda
0.00 0.00 0.00 0.00 0.00 0.00 0.00 0.00 0.00
10 Eta Star Moçambique, S.A.
300,963.71 330,963.71 30,000.00 0.00 0.00 0.00 300,963.71 330,963.71 30,000.00
11
Global Mineral Resources (Mozambique), Lda
0.00 1.00 1.00 0.00 (1.00) 1.00 0.00 0.00 0.00
12
Highland African Mining Company, Lda
0.00 0.00 0.00 0.00 0.00 0.00 0.00 0.00 0.00
13
JSPL, Mozambique Minerais, Lda
1,094,241.20 1,638,587.45 544,346.25 0.00 0.00 0.00 1,094,241.20 1,638,587.45 544,346.25
14
JSW Natural Resources Mozambique, Lda
0.00 0.00 0.00 0.00 0.00 0.00 0.00 0.00 0.00
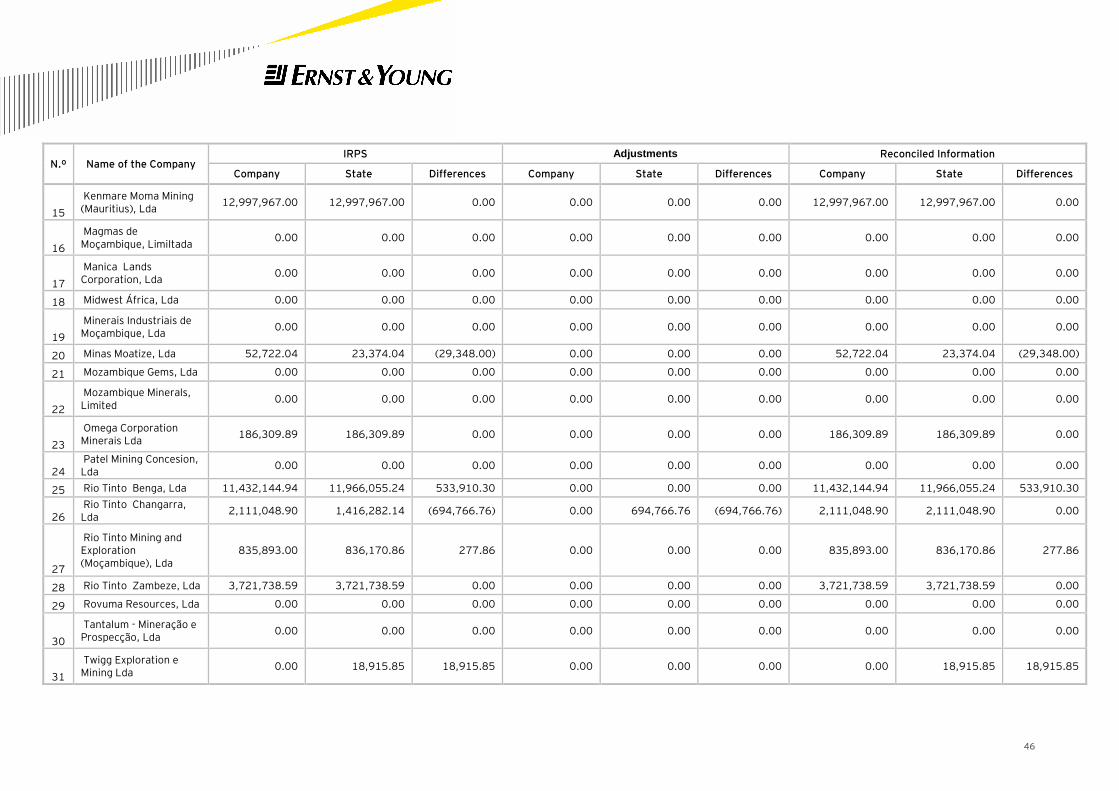
46
N.º Name of the Company IRPS Adjustments Reconciled Information
Company State Differences Company State Differences Company State Differences
15
Kenmare Moma Mining (Mauritius), Lda
12,997,967.00 12,997,967.00 0.00 0.00 0.00 0.00 12,997,967.00 12,997,967.00 0.00
16
Magmas de Moçambique, LimiItada
0.00 0.00 0.00 0.00 0.00 0.00 0.00 0.00 0.00
17
Manica Lands Corporation, Lda
0.00 0.00 0.00 0.00 0.00 0.00 0.00 0.00 0.00
18 Midwest África, Lda 0.00 0.00 0.00 0.00 0.00 0.00 0.00 0.00 0.00
19
Minerais Industriais de Moçambique, Lda
0.00 0.00 0.00 0.00 0.00 0.00 0.00 0.00 0.00
20 Minas Moatize, Lda 52,722.04 23,374.04 (29,348.00) 0.00 0.00 0.00 52,722.04 23,374.04 (29,348.00)
21 Mozambique Gems, Lda 0.00 0.00 0.00 0.00 0.00 0.00 0.00 0.00 0.00
22
Mozambique Minerals, Limited
0.00 0.00 0.00 0.00 0.00 0.00 0.00 0.00 0.00
23
Omega Corporation Minerais Lda
186,309.89 186,309.89 0.00 0.00 0.00 0.00 186,309.89 186,309.89 0.00
24 Patel Mining Concesion, Lda
0.00 0.00 0.00 0.00 0.00 0.00 0.00 0.00 0.00
25 Rio Tinto Benga, Lda 11,432,144.94 11,966,055.24 533,910.30 0.00 0.00 0.00 11,432,144.94 11,966,055.24 533,910.30
26 Rio Tinto Changarra, Lda
2,111,048.90 1,416,282.14 (694,766.76) 0.00 694,766.76 (694,766.76) 2,111,048.90 2,111,048.90 0.00
27
Rio Tinto Mining and Exploration (Moçambique), Lda
835,893.00 836,170.86 277.86 0.00 0.00 0.00 835,893.00 836,170.86 277.86
28 Rio Tinto Zambeze, Lda 3,721,738.59 3,721,738.59 0.00 0.00 0.00 0.00 3,721,738.59 3,721,738.59 0.00
29 Rovuma Resources, Lda 0.00 0.00 0.00 0.00 0.00 0.00 0.00 0.00 0.00
30
Tantalum - Mineração e Prospecção, Lda
0.00 0.00 0.00 0.00 0.00 0.00 0.00 0.00 0.00
31
Twigg Exploration e Mining Lda
0.00 18,915.85 18,915.85 0.00 0.00 0.00 0.00 18,915.85 18,915.85
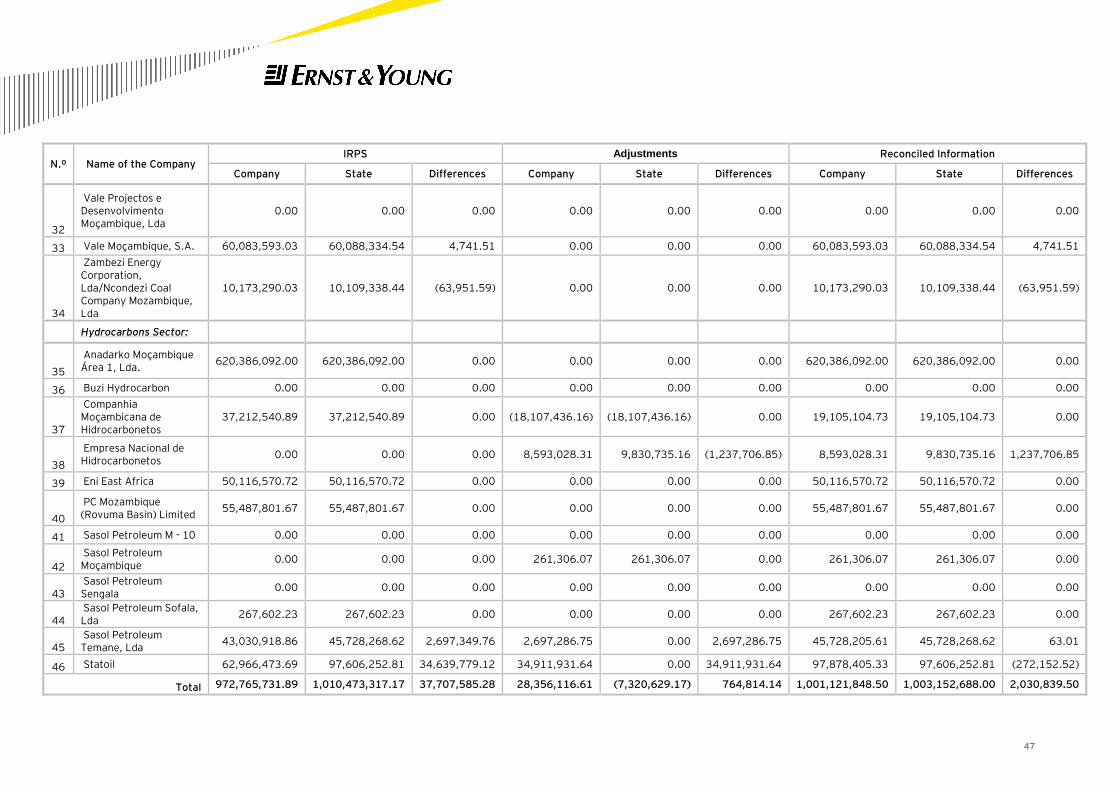
47
N.º Name of the Company IRPS Adjustments Reconciled Information
Company State Differences Company State Differences Company State Differences
32
Vale Projectos e Desenvolvimento Moçambique, Lda
0.00 0.00 0.00 0.00 0.00 0.00 0.00 0.00 0.00
33 Vale Moçambique, S.A. 60,083,593.03 60,088,334.54 4,741.51 0.00 0.00 0.00 60,083,593.03 60,088,334.54 4,741.51
34
Zambezi Energy Corporation, Lda/Ncondezi Coal Company Mozambique, Lda
10,173,290.03 10,109,338.44 (63,951.59) 0.00 0.00 0.00 10,173,290.03 10,109,338.44 (63,951.59)
Hydrocarbons Sector:
35
Anadarko Moçambique Área 1, Lda.
620,386,092.00 620,386,092.00 0.00 0.00 0.00 0.00 620,386,092.00 620,386,092.00 0.00
36 Buzi Hydrocarbon 0.00 0.00 0.00 0.00 0.00 0.00 0.00 0.00 0.00
37
Companhia Moçambicana de Hidrocarbonetos
37,212,540.89 37,212,540.89 0.00 (18,107,436.16) (18,107,436.16) 0.00 19,105,104.73 19,105,104.73 0.00
38
Empresa Nacional de Hidrocarbonetos
0.00 0.00 0.00 8,593,028.31 9,830,735.16 (1,237,706.85) 8,593,028.31 9,830,735.16 1,237,706.85
39 Eni East Africa 50,116,570.72 50,116,570.72 0.00 0.00 0.00 0.00 50,116,570.72 50,116,570.72 0.00
40
PC Mozambique (Rovuma Basin) Limited
55,487,801.67 55,487,801.67 0.00 0.00 0.00 0.00 55,487,801.67 55,487,801.67 0.00
41 Sasol Petroleum M - 10 0.00 0.00 0.00 0.00 0.00 0.00 0.00 0.00 0.00
42
Sasol Petroleum Moçambique
0.00 0.00 0.00 261,306.07 261,306.07 0.00 261,306.07 261,306.07 0.00
43 Sasol Petroleum Sengala
0.00 0.00 0.00 0.00 0.00 0.00 0.00 0.00 0.00
44 Sasol Petroleum Sofala, Lda
267,602.23 267,602.23 0.00 0.00 0.00 0.00 267,602.23 267,602.23 0.00
45 Sasol Petroleum Temane, Lda
43,030,918.86 45,728,268.62 2,697,349.76 2,697,286.75 0.00 2,697,286.75 45,728,205.61 45,728,268.62 63.01
46 Statoil 62,966,473.69 97,606,252.81 34,639,779.12 34,911,931.64 0.00 34,911,931.64 97,878,405.33 97,606,252.81 (272,152.52)
Total 972,765,731.89 1,010,473,317.17 37,707,585.28 28,356,116.61 (7,320,629.17) 764,814.14 1,001,121,848.50 1,003,152,688.00 2,030,839.50
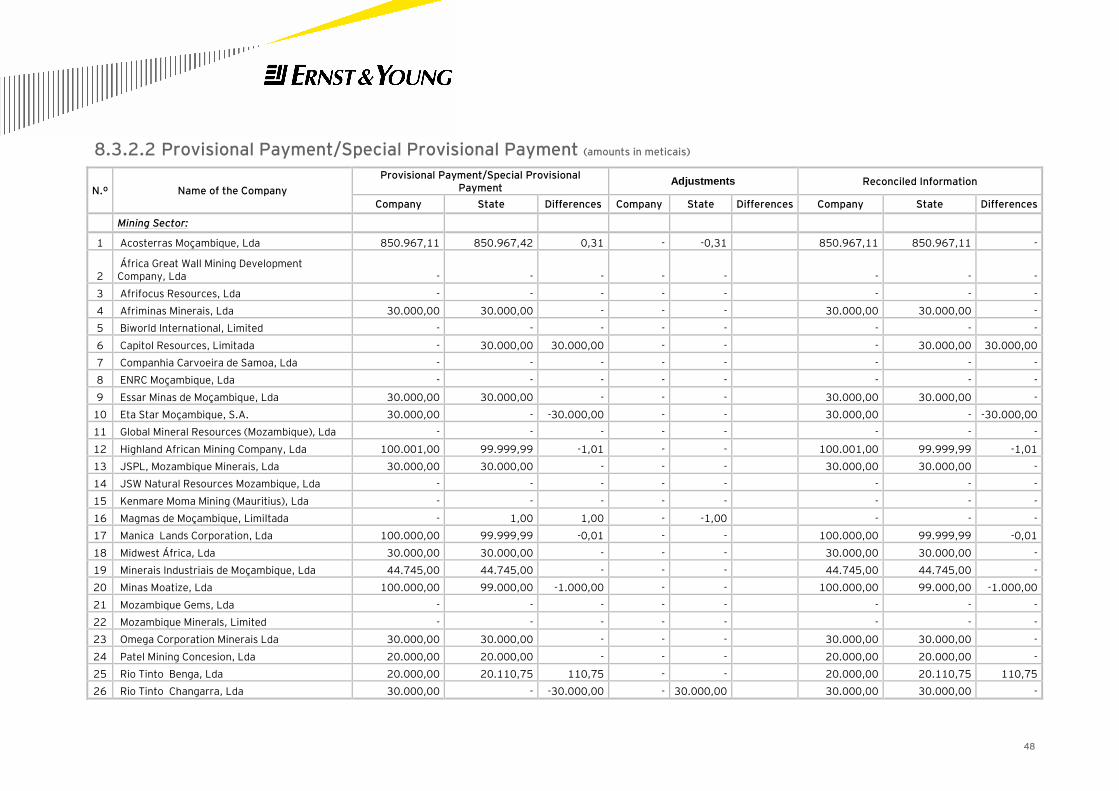
48
8.3.2.2 Provisional Payment/Special Provisional Payment (amounts in meticais)
N.º Name of the Company
Provisional Payment/Special Provisional Payment
Adjustments Reconciled Information
Company State Differences Company State Differences Company State Differences
Mining Sector:
1 Acosterras Moçambique, Lda 850.967,11 850.967,42 0,31 - -0,31 850.967,11 850.967,11 -
2 África Great Wall Mining Development Company, Lda - - - - - - - -
3 Afrifocus Resources, Lda - - - - - - - -
4 Afriminas Minerais, Lda 30.000,00 30.000,00 - - - 30.000,00 30.000,00 -
5 Biworld International, Limited - - - - - - - -
6 Capitol Resources, Limitada - 30.000,00 30.000,00 - - - 30.000,00 30.000,00
7 Companhia Carvoeira de Samoa, Lda - - - - - - - -
8 ENRC Moçambique, Lda - - - - - - - -
9 Essar Minas de Moçambique, Lda 30.000,00 30.000,00 - - - 30.000,00 30.000,00 -
10 Eta Star Moçambique, S.A. 30.000,00 - -30.000,00 - - 30.000,00 - -30.000,00
11 Global Mineral Resources (Mozambique), Lda - - - - - - - -
12 Highland African Mining Company, Lda 100.001,00 99.999,99 -1,01 - - 100.001,00 99.999,99 -1,01
13 JSPL, Mozambique Minerais, Lda 30.000,00 30.000,00 - - - 30.000,00 30.000,00 -
14 JSW Natural Resources Mozambique, Lda - - - - - - - -
15 Kenmare Moma Mining (Mauritius), Lda - - - - - - - -
16 Magmas de Moçambique, LimiItada - 1,00 1,00 - -1,00 - - -
17 Manica Lands Corporation, Lda 100.000,00 99.999,99 -0,01 - - 100.000,00 99.999,99 -0,01
18 Midwest África, Lda 30.000,00 30.000,00 - - - 30.000,00 30.000,00 -
19 Minerais Industriais de Moçambique, Lda 44.745,00 44.745,00 - - - 44.745,00 44.745,00 -
20 Minas Moatize, Lda 100.000,00 99.000,00 -1.000,00 - - 100.000,00 99.000,00 -1.000,00
21 Mozambique Gems, Lda - - - - - - - -
22 Mozambique Minerals, Limited - - - - - - - -
23 Omega Corporation Minerais Lda 30.000,00 30.000,00 - - - 30.000,00 30.000,00 -
24 Patel Mining Concesion, Lda 20.000,00 20.000,00 - - - 20.000,00 20.000,00 -
25 Rio Tinto Benga, Lda 20.000,00 20.110,75 110,75 - - 20.000,00 20.110,75 110,75
26 Rio Tinto Changarra, Lda 30.000,00 - -30.000,00 - 30.000,00 30.000,00 30.000,00 -
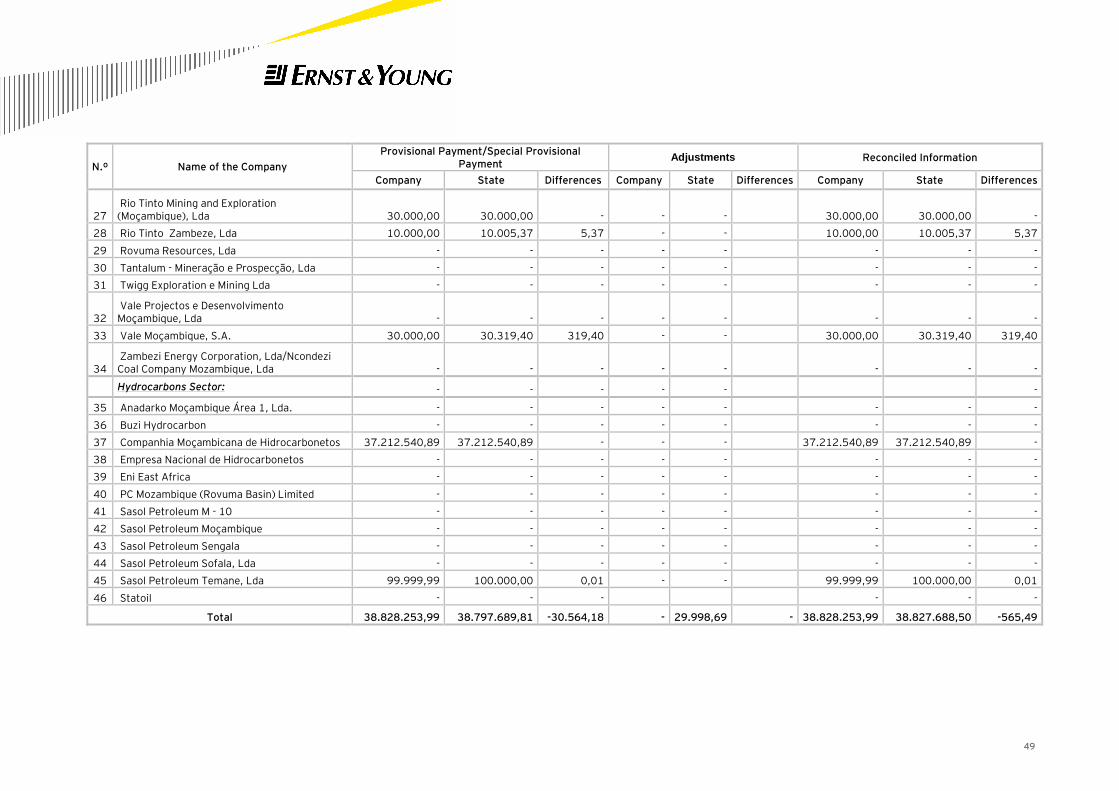
49
N.º Name of the Company
Provisional Payment/Special Provisional Payment
Adjustments Reconciled Information
Company State Differences Company State Differences Company State Differences
27 Rio Tinto Mining and Exploration (Moçambique), Lda 30.000,00 30.000,00 - - - 30.000,00 30.000,00 -
28 Rio Tinto Zambeze, Lda 10.000,00 10.005,37 5,37 - - 10.000,00 10.005,37 5,37
29 Rovuma Resources, Lda - - - - - - - -
30 Tantalum - Mineração e Prospecção, Lda - - - - - - - -
31 Twigg Exploration e Mining Lda - - - - - - - -
32 Vale Projectos e Desenvolvimento Moçambique, Lda - - - - - - - -
33 Vale Moçambique, S.A. 30.000,00 30.319,40 319,40 - - 30.000,00 30.319,40 319,40
34 Zambezi Energy Corporation, Lda/Ncondezi Coal Company Mozambique, Lda - - - - - - - -
Hydrocarbons Sector: - - - - - -
35 Anadarko Moçambique Área 1, Lda. - - - - - - - -
36 Buzi Hydrocarbon - - - - - - - -
37 Companhia Moçambicana de Hidrocarbonetos 37.212.540,89 37.212.540,89 - - - 37.212.540,89 37.212.540,89 -
38 Empresa Nacional de Hidrocarbonetos - - - - - - - -
39 Eni East Africa - - - - - - - -
40 PC Mozambique (Rovuma Basin) Limited - - - - - - - -
41 Sasol Petroleum M - 10 - - - - - - - -
42 Sasol Petroleum Moçambique - - - - - - - -
43 Sasol Petroleum Sengala - - - - - - - -
44 Sasol Petroleum Sofala, Lda - - - - - - - -
45 Sasol Petroleum Temane, Lda 99.999,99 100.000,00 0,01 - - 99.999,99 100.000,00 0,01
46 Statoil - - - - - -
Total 38.828.253,99 38.797.689,81 -30.564,18 - 29.998,69 - 38.828.253,99 38.827.688,50 -565,49
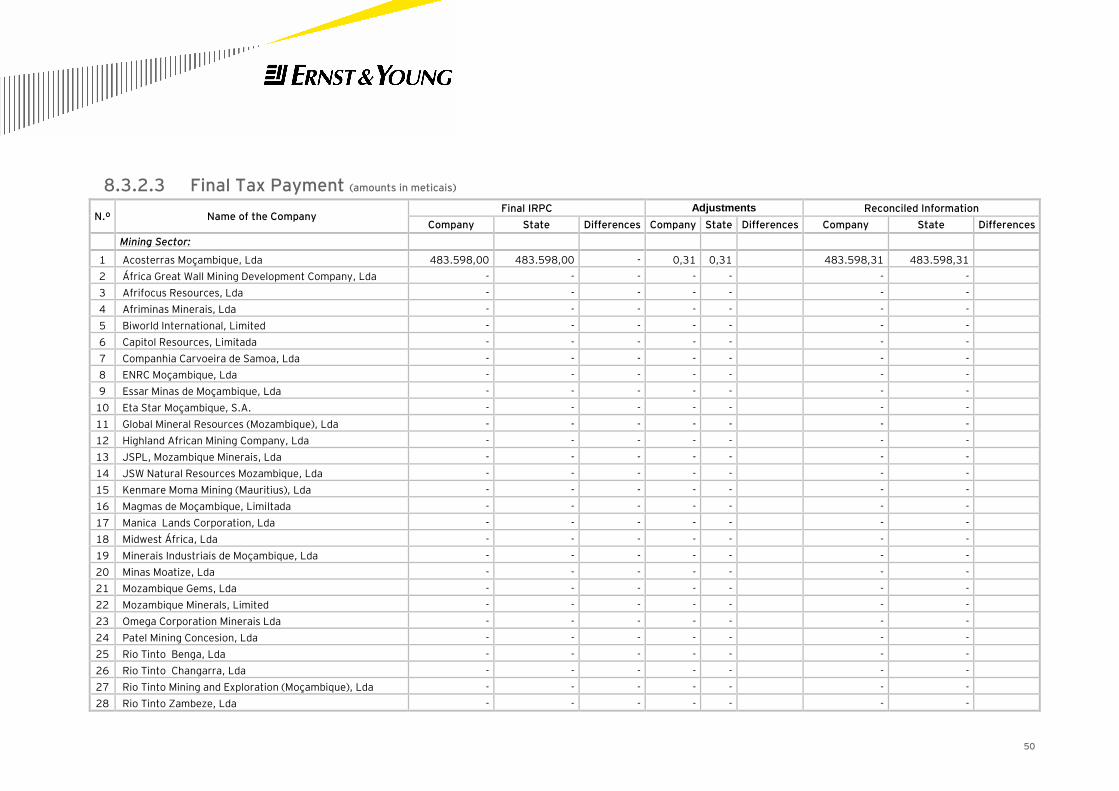
50
8.3.2.3 Final Tax Payment (amounts in meticais)
N.º Name of the Company Final IRPC Adjustments Reconciled Information
Company State Differences Company State Differences Company State Differences
Mining Sector:
1 Acosterras Moçambique, Lda 483.598,00 483.598,00 - 0,31 0,31 483.598,31 483.598,31
2 África Great Wall Mining Development Company, Lda - - - - - - -
3 Afrifocus Resources, Lda - - - - - - -
4 Afriminas Minerais, Lda - - - - - - -
5 Biworld International, Limited - - - - - - -
6 Capitol Resources, Limitada - - - - - - -
7 Companhia Carvoeira de Samoa, Lda - - - - - - -
8 ENRC Moçambique, Lda - - - - - - -
9 Essar Minas de Moçambique, Lda - - - - - - -
10 Eta Star Moçambique, S.A. - - - - - - -
11 Global Mineral Resources (Mozambique), Lda - - - - - - -
12 Highland African Mining Company, Lda - - - - - - -
13 JSPL, Mozambique Minerais, Lda - - - - - - -
14 JSW Natural Resources Mozambique, Lda - - - - - - -
15 Kenmare Moma Mining (Mauritius), Lda - - - - - - -
16 Magmas de Moçambique, LimiItada - - - - - - -
17 Manica Lands Corporation, Lda - - - - - - -
18 Midwest África, Lda - - - - - - -
19 Minerais Industriais de Moçambique, Lda - - - - - - -
20 Minas Moatize, Lda - - - - - - -
21 Mozambique Gems, Lda - - - - - - -
22 Mozambique Minerals, Limited - - - - - - -
23 Omega Corporation Minerais Lda - - - - - - -
24 Patel Mining Concesion, Lda - - - - - - -
25 Rio Tinto Benga, Lda - - - - - - -
26 Rio Tinto Changarra, Lda - - - - - - -
27 Rio Tinto Mining and Exploration (Moçambique), Lda - - - - - - -
28 Rio Tinto Zambeze, Lda - - - - - - -
Empresa Estado Diferença Empresa Estado Diferença Empresa Estado
Área Mineira
1 Acosterras Moçambique, Lda - - - - - - -
2
África Great Wall Mining Development
Company, Lda - - - - - - -
3 Afrifocus Resources, Lda - - - - - - -
4 Afriminas Minerais, Lda - - - - - - -
5 Biworld International, Limited - - - - - - -
6 Capitol Resources, Limitada - - - - - - -
7 Companhia Carvoeira de Samoa, Lda 811.800,00 811.800,00 - - - 811.800,00 811.800,00
8 ENRC Moçambique, Lda - - - - - - -
9 Essar Minas de Moçambique, Lda 312.000,00 312.000,00 - - - 312.000,00 312.000,00
10 Eta Star Moçambique, S.A. - - - - - - -
11 Global Mineral Resources (Mozambique), Lda - - - - - - -
12 Highland African Mining Company, Lda 684.146,66 - 684.146,66 - - 541.290,85 684.146,66 541.290,85
13 JSPL, Mozambique Minerais, Lda - - - - - - -
14 JSW Natural Resources Mozambique, Lda - - - - - - -
15 Kenmare Moma Mining (Mauritius), Lda 34.489.358,00 32.808.184,00 1.681.174,00 - - 1.681.174,00 34.489.358,00 34.489.358,00
16 Magmas de Moçambique, LimiItada - - - - - - -
17 Manica Lands Corporation, Lda 513.400,00 - 513.400,00 - - 513.400,00 513.400,00 513.400,00
18 Midwest África, Lda - - - - - - -
19 Minerais Industriais de Moçambique, Lda 99.009,06 - 99.009,06 - - - 99.009,06 -
20 Minas Moatize, Lda - - - - - - -
21 Mozambique Gems, Lda 158.399,04 158.399,04 - - - 158.399,04 158.399,04
22 Mozambique Minerals, Limited - - - - - - -
23 Omega Corporation Minerais Lda - - - - - - -
N.º NOME DA EMPRESAImposto sobre a Produção Ajustamentos Informação reconciliada
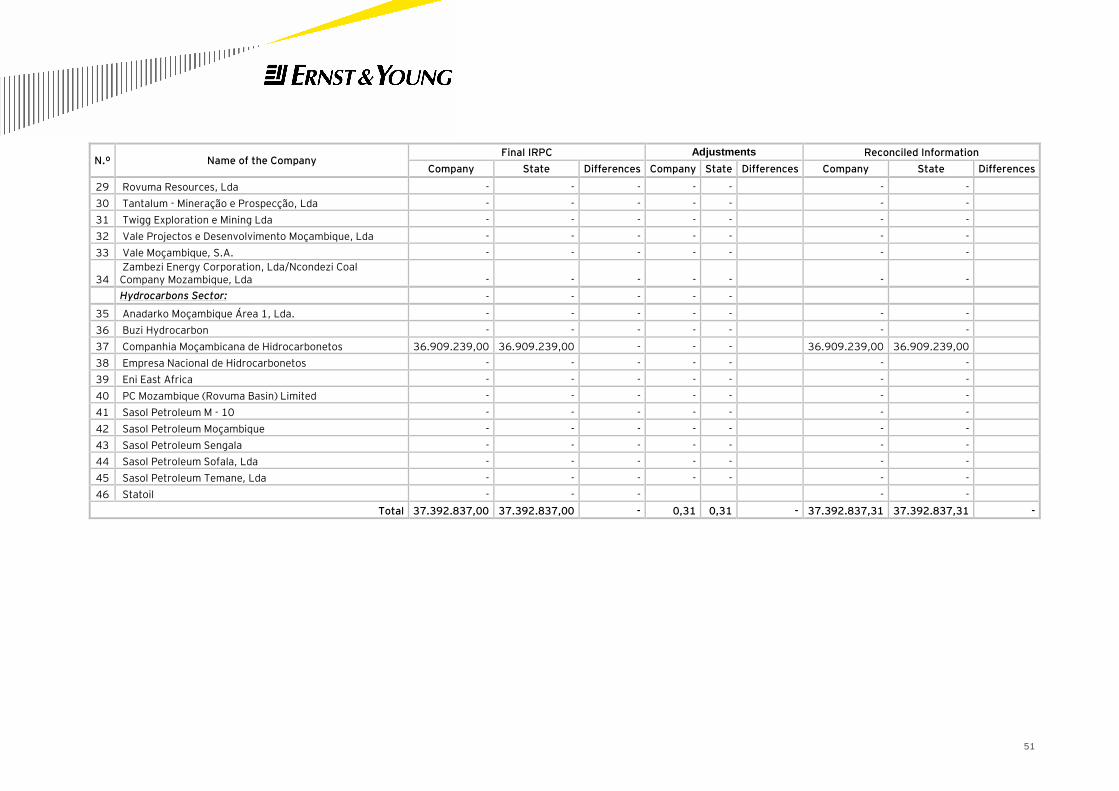
51
N.º Name of the Company Final IRPC Adjustments Reconciled Information
Company State Differences Company State Differences Company State Differences
29 Rovuma Resources, Lda - - - - - - -
30 Tantalum - Mineração e Prospecção, Lda - - - - - - -
31 Twigg Exploration e Mining Lda - - - - - - -
32 Vale Projectos e Desenvolvimento Moçambique, Lda - - - - - - -
33 Vale Moçambique, S.A. - - - - - - -
34 Zambezi Energy Corporation, Lda/Ncondezi Coal Company Mozambique, Lda - - - - - - -
Hydrocarbons Sector: - - - - -
35 Anadarko Moçambique Área 1, Lda. - - - - - - -
36 Buzi Hydrocarbon - - - - - - -
37 Companhia Moçambicana de Hidrocarbonetos 36.909.239,00 36.909.239,00 - - - 36.909.239,00 36.909.239,00
38 Empresa Nacional de Hidrocarbonetos - - - - - - -
39 Eni East Africa - - - - - - -
40 PC Mozambique (Rovuma Basin) Limited - - - - - - -
41 Sasol Petroleum M - 10 - - - - - - -
42 Sasol Petroleum Moçambique - - - - - - -
43 Sasol Petroleum Sengala - - - - - - -
44 Sasol Petroleum Sofala, Lda - - - - - - -
45 Sasol Petroleum Temane, Lda - - - - - - -
46 Statoil - - - - -
Total 37.392.837,00 37.392.837,00 - 0,31 0,31 - 37.392.837,31 37.392.837,31 -
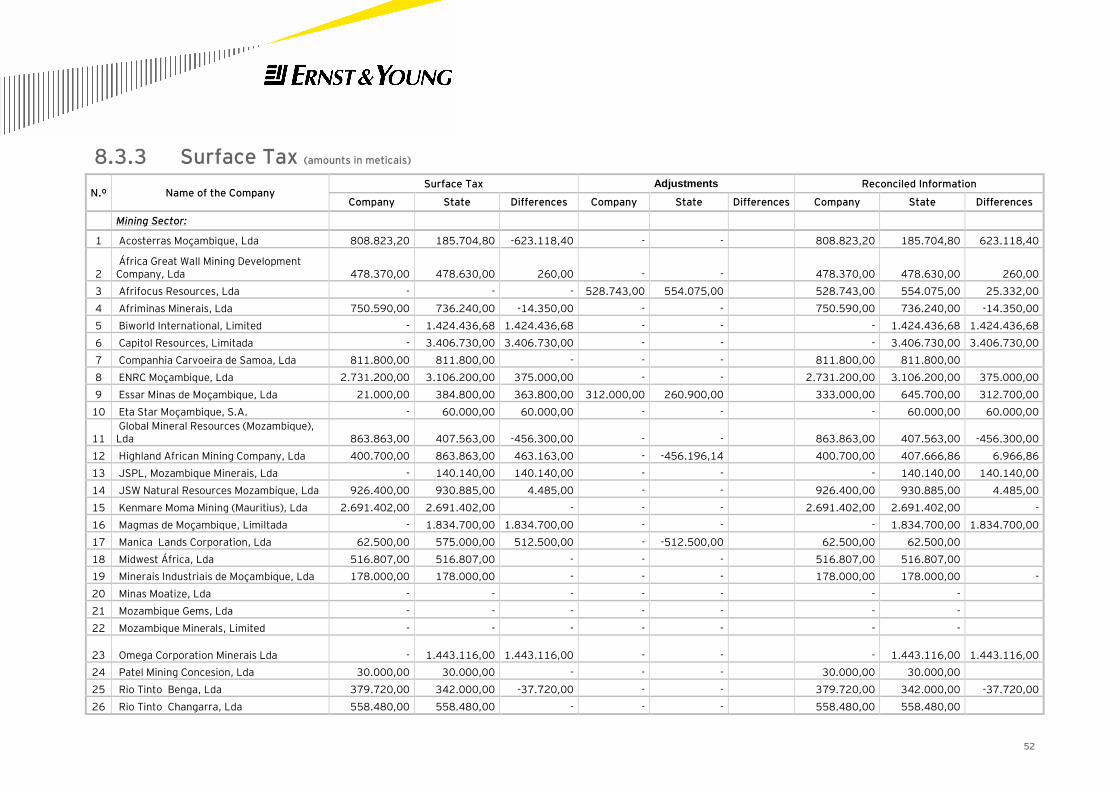
52
8.3.3 Surface Tax (amounts in meticais)
N.º Name of the Company Surface Tax Adjustments Reconciled Information
Company State Differences Company State Differences Company State Differences
Mining Sector:
1 Acosterras Moçambique, Lda 808.823,20 185.704,80 -623.118,40 - - 808.823,20 185.704,80 623.118,40
2 África Great Wall Mining Development Company, Lda 478.370,00 478.630,00 260,00 - - 478.370,00 478.630,00 260,00
3 Afrifocus Resources, Lda - - - 528.743,00 554.075,00 528.743,00 554.075,00 25.332,00
4 Afriminas Minerais, Lda 750.590,00 736.240,00 -14.350,00 - - 750.590,00 736.240,00 -14.350,00
5 Biworld International, Limited - 1.424.436,68 1.424.436,68 - - - 1.424.436,68 1.424.436,68
6 Capitol Resources, Limitada - 3.406.730,00 3.406.730,00 - - - 3.406.730,00 3.406.730,00
7 Companhia Carvoeira de Samoa, Lda 811.800,00 811.800,00 - - - 811.800,00 811.800,00
8 ENRC Moçambique, Lda 2.731.200,00 3.106.200,00 375.000,00 - - 2.731.200,00 3.106.200,00 375.000,00
9 Essar Minas de Moçambique, Lda 21.000,00 384.800,00 363.800,00 312.000,00 260.900,00 333.000,00 645.700,00 312.700,00
10 Eta Star Moçambique, S.A. - 60.000,00 60.000,00 - - - 60.000,00 60.000,00
11 Global Mineral Resources (Mozambique), Lda 863.863,00 407.563,00 -456.300,00 - - 863.863,00 407.563,00 -456.300,00
12 Highland African Mining Company, Lda 400.700,00 863.863,00 463.163,00 - -456.196,14 400.700,00 407.666,86 6.966,86
13 JSPL, Mozambique Minerais, Lda - 140.140,00 140.140,00 - - - 140.140,00 140.140,00
14 JSW Natural Resources Mozambique, Lda 926.400,00 930.885,00 4.485,00 - - 926.400,00 930.885,00 4.485,00
15 Kenmare Moma Mining (Mauritius), Lda 2.691.402,00 2.691.402,00 - - - 2.691.402,00 2.691.402,00 -
16 Magmas de Moçambique, LimiItada - 1.834.700,00 1.834.700,00 - - - 1.834.700,00 1.834.700,00
17 Manica Lands Corporation, Lda 62.500,00 575.000,00 512.500,00 - -512.500,00 62.500,00 62.500,00
18 Midwest África, Lda 516.807,00 516.807,00 - - - 516.807,00 516.807,00
19 Minerais Industriais de Moçambique, Lda 178.000,00 178.000,00 - - - 178.000,00 178.000,00 -
20 Minas Moatize, Lda - - - - - - -
21 Mozambique Gems, Lda - - - - - - -
22 Mozambique Minerals, Limited - - - - - - -
23 Omega Corporation Minerais Lda - 1.443.116,00 1.443.116,00 - - - 1.443.116,00
1.443.116,00
24 Patel Mining Concesion, Lda 30.000,00 30.000,00 - - - 30.000,00 30.000,00
25 Rio Tinto Benga, Lda 379.720,00 342.000,00 -37.720,00 - - 379.720,00 342.000,00 -37.720,00
26 Rio Tinto Changarra, Lda 558.480,00 558.480,00 - - - 558.480,00 558.480,00
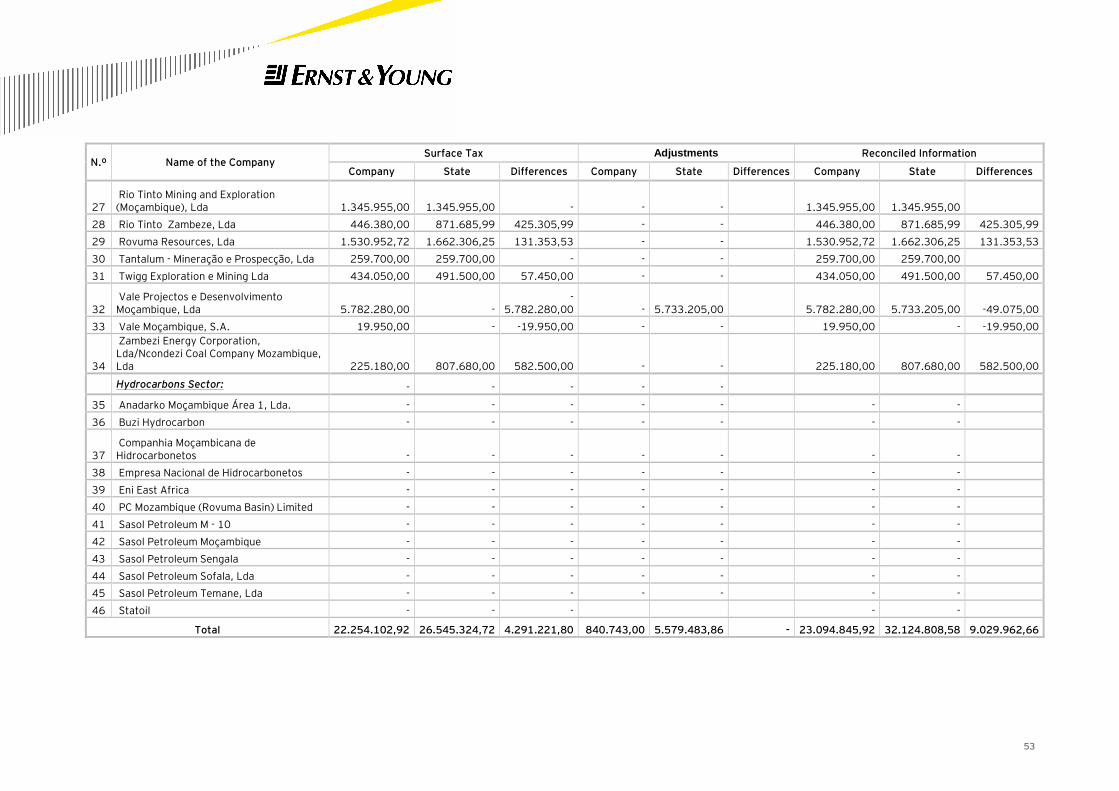
53
N.º Name of the Company Surface Tax Adjustments Reconciled Information
Company State Differences Company State Differences Company State Differences
27 Rio Tinto Mining and Exploration (Moçambique), Lda 1.345.955,00 1.345.955,00 - - - 1.345.955,00 1.345.955,00
28 Rio Tinto Zambeze, Lda 446.380,00 871.685,99 425.305,99 - - 446.380,00 871.685,99 425.305,99
29 Rovuma Resources, Lda 1.530.952,72 1.662.306,25 131.353,53 - - 1.530.952,72 1.662.306,25 131.353,53
30 Tantalum - Mineração e Prospecção, Lda 259.700,00 259.700,00 - - - 259.700,00 259.700,00
31 Twigg Exploration e Mining Lda 434.050,00 491.500,00 57.450,00 - - 434.050,00 491.500,00 57.450,00
32 Vale Projectos e Desenvolvimento Moçambique, Lda 5.782.280,00 -
-5.782.280,00 - 5.733.205,00 5.782.280,00 5.733.205,00 -49.075,00
33 Vale Moçambique, S.A. 19.950,00 - -19.950,00 - - 19.950,00 - -19.950,00
34
Zambezi Energy Corporation, Lda/Ncondezi Coal Company Mozambique, Lda 225.180,00 807.680,00 582.500,00 - - 225.180,00 807.680,00 582.500,00
Hydrocarbons Sector: - - - - -
35 Anadarko Moçambique Área 1, Lda. - - - - - - -
36 Buzi Hydrocarbon - - - - - - -
37 Companhia Moçambicana de Hidrocarbonetos - - - - - - -
38 Empresa Nacional de Hidrocarbonetos - - - - - - -
39 Eni East Africa - - - - - - -
40 PC Mozambique (Rovuma Basin) Limited - - - - - - -
41 Sasol Petroleum M - 10 - - - - - - -
42 Sasol Petroleum Moçambique - - - - - - -
43 Sasol Petroleum Sengala - - - - - - -
44 Sasol Petroleum Sofala, Lda - - - - - - -
45 Sasol Petroleum Temane, Lda - - - - - - -
46 Statoil - - - - -
Total 22.254.102,92 26.545.324,72 4.291.221,80 840.743,00 5.579.483,86 - 23.094.845,92 32.124.808,58 9.029.962,66
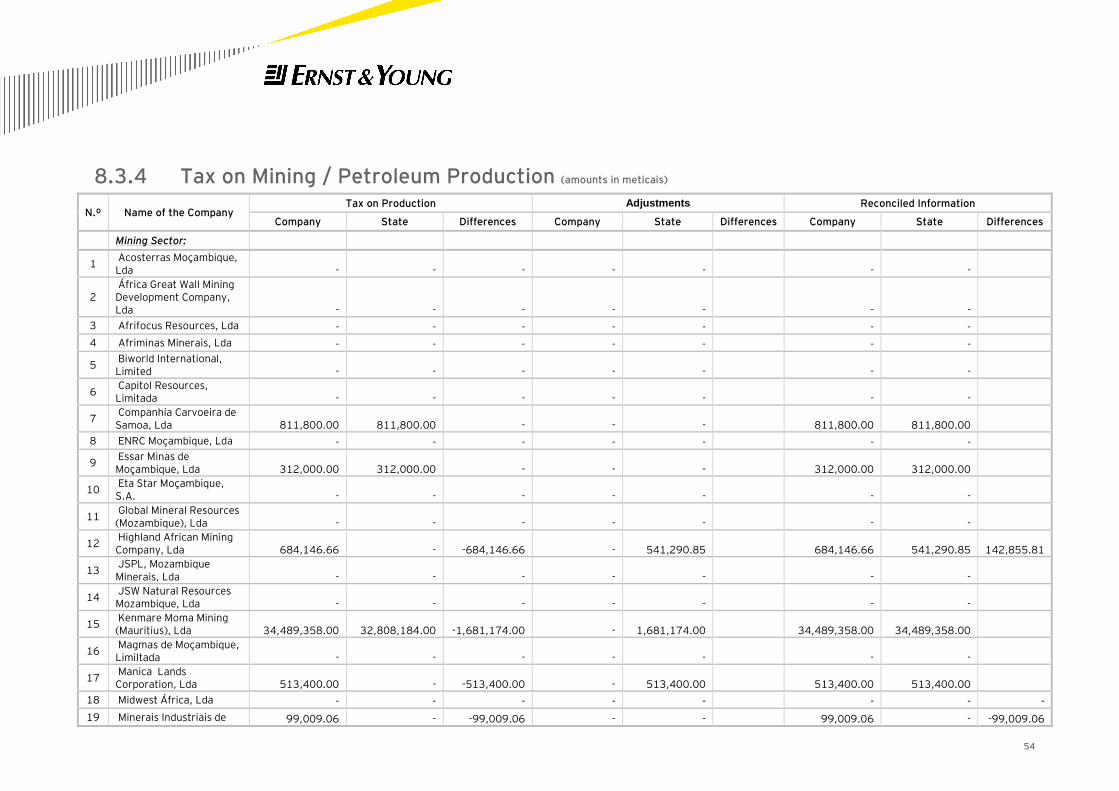
54
8.3.4 Tax on Mining / Petroleum Production (amounts in meticais)
N.º Name of the Company Tax on Production Adjustments Reconciled Information
Company State Differences Company State Differences Company State Differences
Mining Sector:
1 Acosterras Moçambique, Lda - - - - - - -
2 África Great Wall Mining Development Company, Lda - - - - - - -
3 Afrifocus Resources, Lda - - - - - - -
4 Afriminas Minerais, Lda - - - - - - -
5 Biworld International, Limited - - - - - - -
6 Capitol Resources, Limitada - - - - - - -
7 Companhia Carvoeira de Samoa, Lda 811,800.00 811,800.00 - - - 811,800.00 811,800.00
8 ENRC Moçambique, Lda - - - - - - -
9 Essar Minas de Moçambique, Lda 312,000.00 312,000.00 - - - 312,000.00 312,000.00
10 Eta Star Moçambique, S.A. - - - - - - -
11 Global Mineral Resources (Mozambique), Lda - - - - - - -
12 Highland African Mining Company, Lda 684,146.66 - -684,146.66 - 541,290.85 684,146.66 541,290.85 142,855.81
13 JSPL, Mozambique Minerais, Lda - - - - - - -
14 JSW Natural Resources Mozambique, Lda - - - - - - -
15 Kenmare Moma Mining (Mauritius), Lda 34,489,358.00 32,808,184.00 -1,681,174.00 - 1,681,174.00 34,489,358.00 34,489,358.00
16 Magmas de Moçambique, LimiItada - - - - - - -
17 Manica Lands Corporation, Lda 513,400.00 - -513,400.00 - 513,400.00 513,400.00 513,400.00
18 Midwest África, Lda - - - - - - - -
19 Minerais Industriais de 99,009.06 - -99,009.06 - - 99,009.06 - -99,009.06
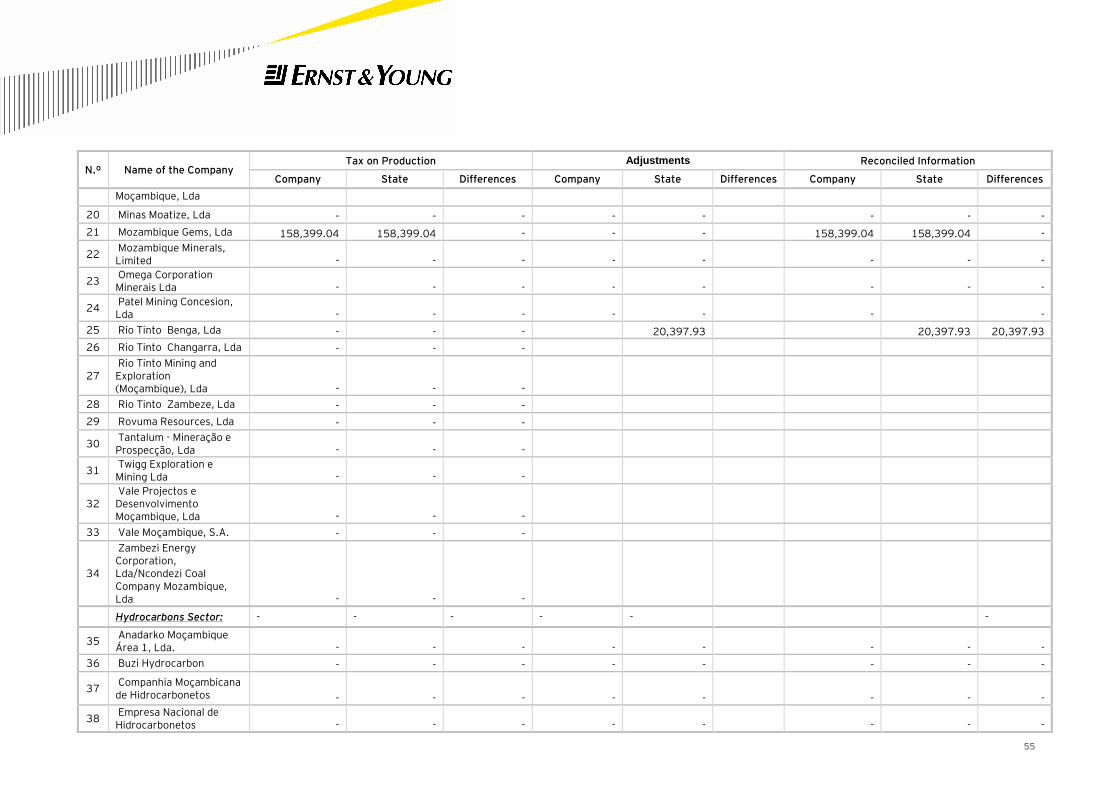
55
N.º Name of the Company Tax on Production Adjustments Reconciled Information
Company State Differences Company State Differences Company State Differences
Moçambique, Lda
20 Minas Moatize, Lda - - - - - - - -
21 Mozambique Gems, Lda 158,399.04 158,399.04 - - - 158,399.04 158,399.04 -
22 Mozambique Minerals, Limited - - - - - - - -
23 Omega Corporation Minerais Lda - - - - - - - -
24 Patel Mining Concesion, Lda - - - - - - -
25 Rio Tinto Benga, Lda - - - 20,397.93 20,397.93 20,397.93
26 Rio Tinto Changarra, Lda - - -
27 Rio Tinto Mining and Exploration (Moçambique), Lda - - -
28 Rio Tinto Zambeze, Lda - - -
29 Rovuma Resources, Lda - - -
30 Tantalum - Mineração e Prospecção, Lda - - -
31 Twigg Exploration e Mining Lda - - -
32 Vale Projectos e Desenvolvimento Moçambique, Lda - - -
33 Vale Moçambique, S.A. - - -
34
Zambezi Energy Corporation, Lda/Ncondezi Coal Company Mozambique, Lda - - -
Hydrocarbons Sector: - - - - - -
35 Anadarko Moçambique Área 1, Lda. - - - - - - - -
36 Buzi Hydrocarbon - - - - - - - -
37 Companhia Moçambicana de Hidrocarbonetos - - - - - - - -
38 Empresa Nacional de Hidrocarbonetos - - - - - - - -
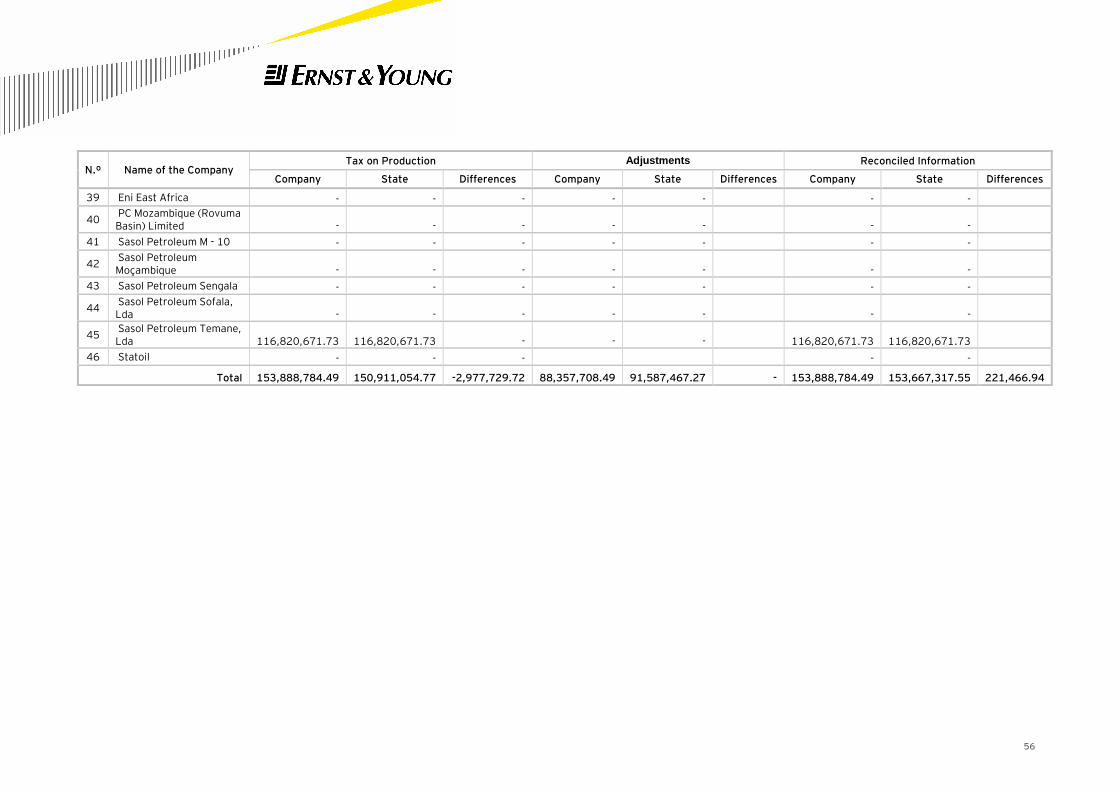
56
N.º Name of the Company Tax on Production Adjustments Reconciled Information
Company State Differences Company State Differences Company State Differences
39 Eni East Africa - - - - - - -
40 PC Mozambique (Rovuma Basin) Limited - - - - - - -
41 Sasol Petroleum M - 10 - - - - - - -
42 Sasol Petroleum Moçambique - - - - - - -
43 Sasol Petroleum Sengala - - - - - - -
44 Sasol Petroleum Sofala, Lda - - - - - - -
45 Sasol Petroleum Temane, Lda 116,820,671.73 116,820,671.73 - - - 116,820,671.73 116,820,671.73
46 Statoil - - - - -
Total 153,888,784.49 150,911,054.77 -2,977,729.72 88,357,708.49 91,587,467.27 - 153,888,784.49 153,667,317.55 221,466.94
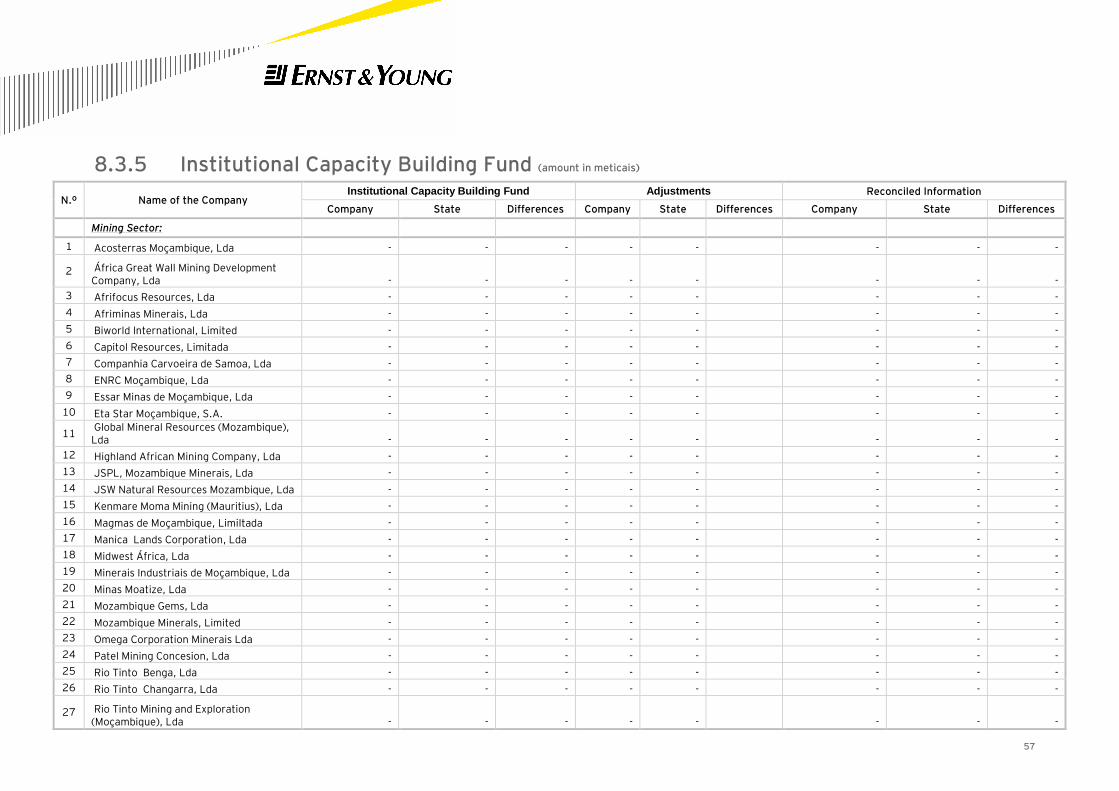
57
8.3.5 Institutional Capacity Building Fund (amount in meticais)
N.º Name of the Company Institutional Capacity Building Fund Adjustments Reconciled Information
Company State Differences Company State Differences Company State Differences
Mining Sector:
1 Acosterras Moçambique, Lda - - - - - - - -
2 África Great Wall Mining Development Company, Lda - - - - - - - -
3 Afrifocus Resources, Lda - - - - - - - -
4 Afriminas Minerais, Lda - - - - - - - -
5 Biworld International, Limited - - - - - - - -
6 Capitol Resources, Limitada - - - - - - - -
7 Companhia Carvoeira de Samoa, Lda - - - - - - - -
8 ENRC Moçambique, Lda - - - - - - - -
9 Essar Minas de Moçambique, Lda - - - - - - - -
10 Eta Star Moçambique, S.A. - - - - - - - -
11 Global Mineral Resources (Mozambique), Lda - - - - - - - -
12 Highland African Mining Company, Lda - - - - - - - -
13 JSPL, Mozambique Minerais, Lda - - - - - - - -
14 JSW Natural Resources Mozambique, Lda - - - - - - - -
15 Kenmare Moma Mining (Mauritius), Lda - - - - - - - -
16 Magmas de Moçambique, LimiItada - - - - - - - -
17 Manica Lands Corporation, Lda - - - - - - - -
18 Midwest África, Lda - - - - - - - -
19 Minerais Industriais de Moçambique, Lda - - - - - - - -
20 Minas Moatize, Lda - - - - - - - -
21 Mozambique Gems, Lda - - - - - - - -
22 Mozambique Minerals, Limited - - - - - - - -
23 Omega Corporation Minerais Lda - - - - - - - -
24 Patel Mining Concesion, Lda - - - - - - - -
25 Rio Tinto Benga, Lda - - - - - - - -
26 Rio Tinto Changarra, Lda - - - - - - - -
27 Rio Tinto Mining and Exploration (Moçambique), Lda - - - - - - - -
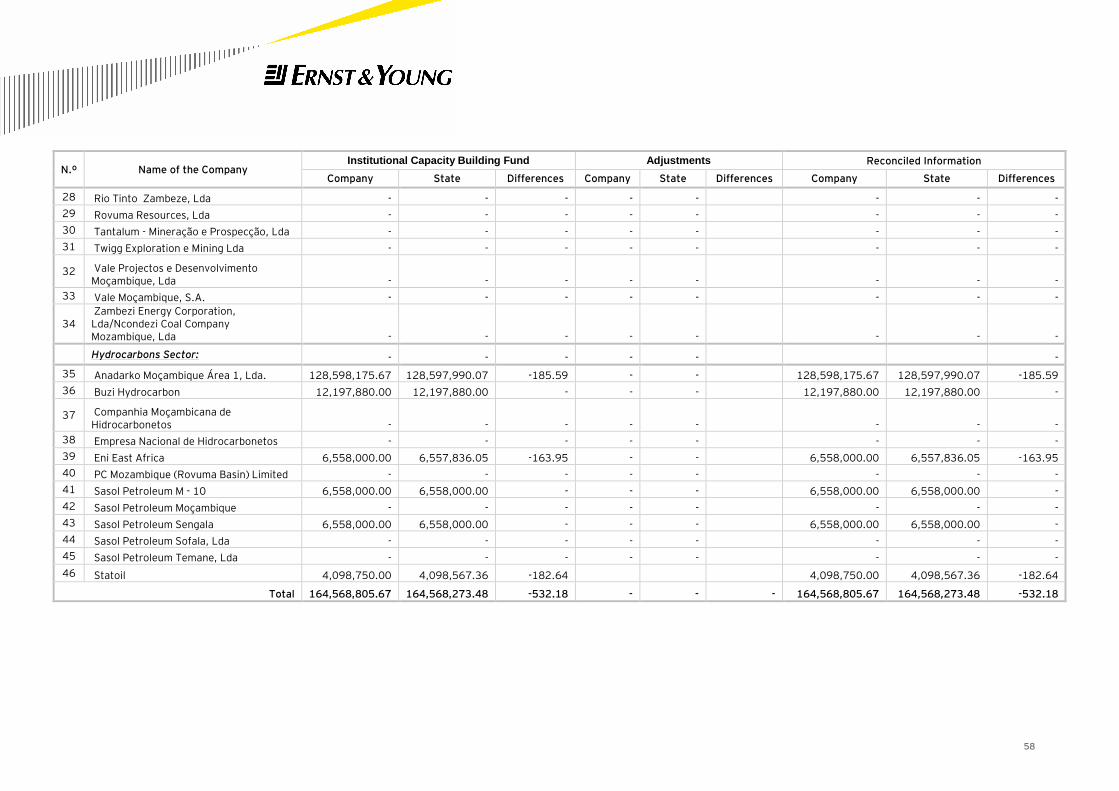
58
N.º Name of the Company Institutional Capacity Building Fund Adjustments Reconciled Information
Company State Differences Company State Differences Company State Differences
28 Rio Tinto Zambeze, Lda - - - - - - - -
29 Rovuma Resources, Lda - - - - - - - -
30 Tantalum - Mineração e Prospecção, Lda - - - - - - - -
31 Twigg Exploration e Mining Lda - - - - - - - -
32 Vale Projectos e Desenvolvimento Moçambique, Lda - - - - - - - -
33 Vale Moçambique, S.A. - - - - - - - -
34 Zambezi Energy Corporation, Lda/Ncondezi Coal Company Mozambique, Lda - - - - - - - -
Hydrocarbons Sector: - - - - - -
35 Anadarko Moçambique Área 1, Lda. 128,598,175.67 128,597,990.07 -185.59 - - 128,598,175.67 128,597,990.07 -185.59
36 Buzi Hydrocarbon 12,197,880.00 12,197,880.00 - - - 12,197,880.00 12,197,880.00 -
37 Companhia Moçambicana de Hidrocarbonetos - - - - - - - -
38 Empresa Nacional de Hidrocarbonetos - - - - - - - -
39 Eni East Africa 6,558,000.00 6,557,836.05 -163.95 - - 6,558,000.00 6,557,836.05 -163.95
40 PC Mozambique (Rovuma Basin) Limited - - - - - - - -
41 Sasol Petroleum M - 10 6,558,000.00 6,558,000.00 - - - 6,558,000.00 6,558,000.00 -
42 Sasol Petroleum Moçambique - - - - - - - -
43 Sasol Petroleum Sengala 6,558,000.00 6,558,000.00 - - - 6,558,000.00 6,558,000.00 -
44 Sasol Petroleum Sofala, Lda - - - - - - - -
45 Sasol Petroleum Temane, Lda - - - - - - - -
46 Statoil 4,098,750.00 4,098,567.36 -182.64 4,098,750.00 4,098,567.36 -182.64
Total 164,568,805.67 164,568,273.48 -532.18 - - - 164,568,805.67 164,568,273.48 -532.18
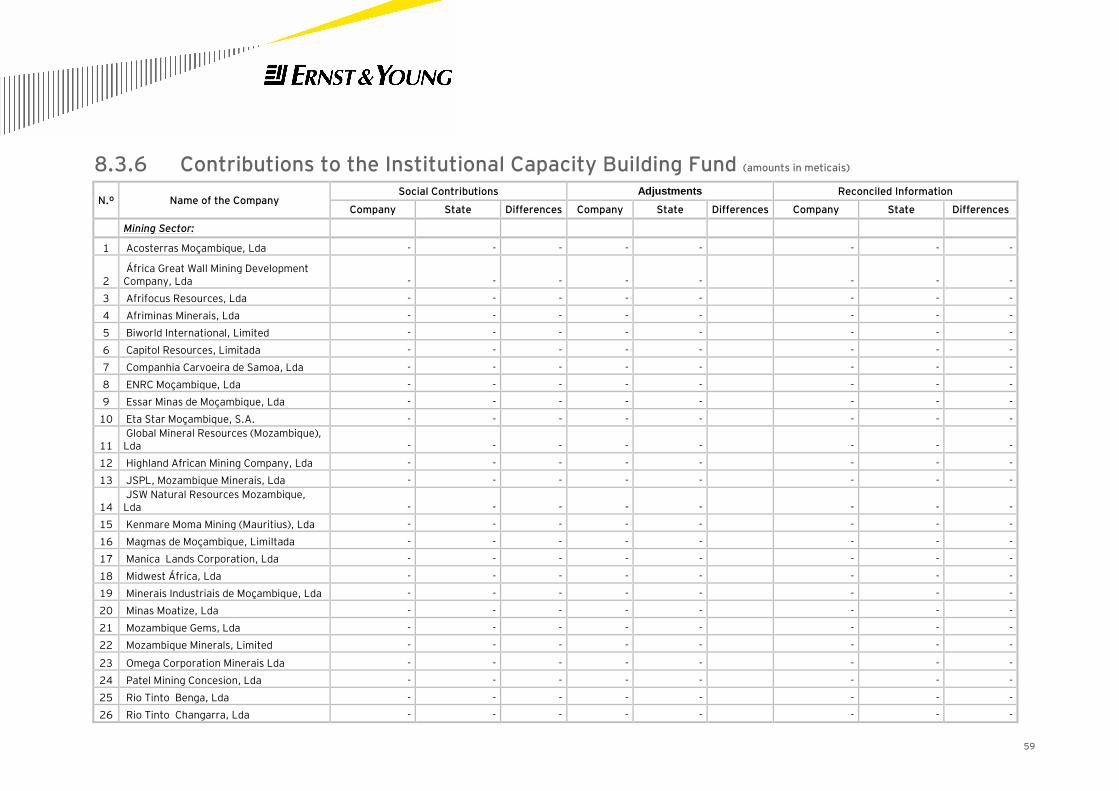
59
8.3.6 Contributions to the Institutional Capacity Building Fund (amounts in meticais)
N.º Name of the Company Social Contributions Adjustments Reconciled Information
Company State Differences Company State Differences Company State Differences
Mining Sector:
1 Acosterras Moçambique, Lda - - - - - - - -
2 África Great Wall Mining Development Company, Lda - - - - - - - -
3 Afrifocus Resources, Lda - - - - - - - -
4 Afriminas Minerais, Lda - - - - - - - -
5 Biworld International, Limited - - - - - - - -
6 Capitol Resources, Limitada - - - - - - - -
7 Companhia Carvoeira de Samoa, Lda - - - - - - - -
8 ENRC Moçambique, Lda - - - - - - - -
9 Essar Minas de Moçambique, Lda - - - - - - - -
10 Eta Star Moçambique, S.A. - - - - - - - -
11 Global Mineral Resources (Mozambique), Lda - - - - - - - -
12 Highland African Mining Company, Lda - - - - - - - -
13 JSPL, Mozambique Minerais, Lda - - - - - - - -
14 JSW Natural Resources Mozambique, Lda - - - - - - - -
15 Kenmare Moma Mining (Mauritius), Lda - - - - - - - -
16 Magmas de Moçambique, LimiItada - - - - - - - -
17 Manica Lands Corporation, Lda - - - - - - - -
18 Midwest África, Lda - - - - - - - -
19 Minerais Industriais de Moçambique, Lda - - - - - - - -
20 Minas Moatize, Lda - - - - - - - -
21 Mozambique Gems, Lda - - - - - - - -
22 Mozambique Minerals, Limited - - - - - - - -
23 Omega Corporation Minerais Lda - - - - - - - -
24 Patel Mining Concesion, Lda - - - - - - - -
25 Rio Tinto Benga, Lda - - - - - - - -
26 Rio Tinto Changarra, Lda - - - - - - - -
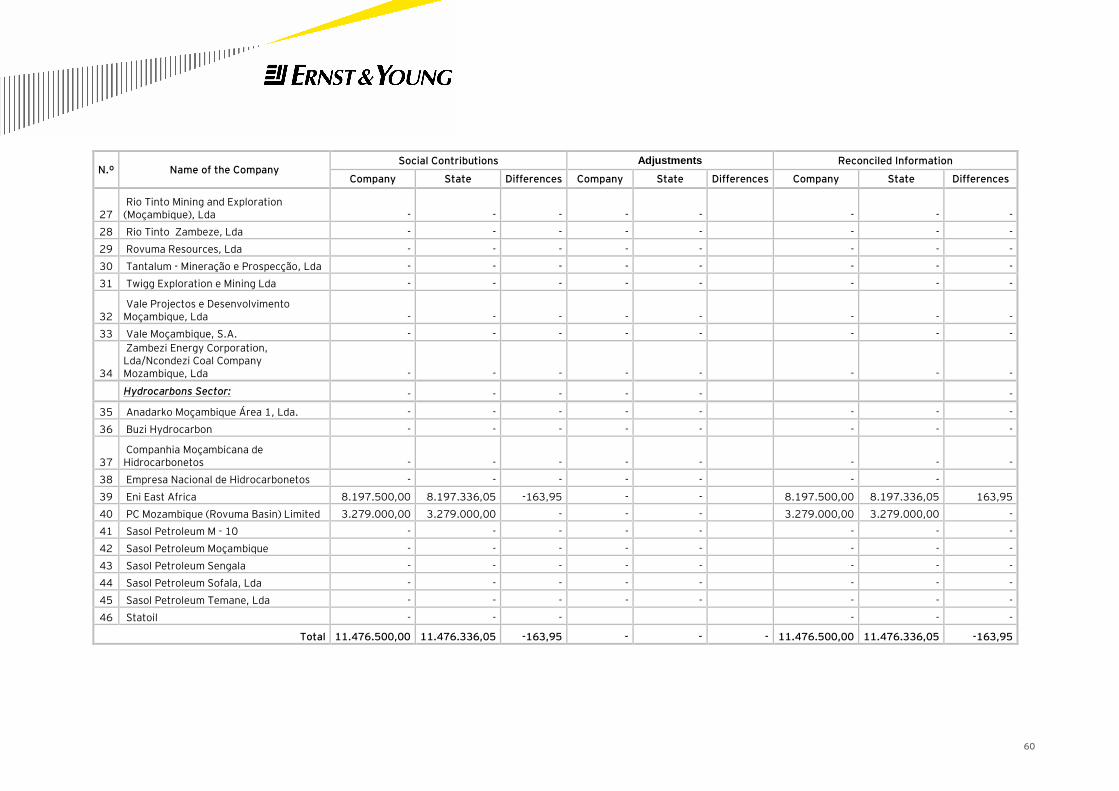
60
N.º Name of the Company Social Contributions Adjustments Reconciled Information
Company State Differences Company State Differences Company State Differences
27 Rio Tinto Mining and Exploration (Moçambique), Lda - - - - - - - -
28 Rio Tinto Zambeze, Lda - - - - - - - -
29 Rovuma Resources, Lda - - - - - - - -
30 Tantalum - Mineração e Prospecção, Lda - - - - - - - -
31 Twigg Exploration e Mining Lda - - - - - - - -
32 Vale Projectos e Desenvolvimento Moçambique, Lda - - - - - - - -
33 Vale Moçambique, S.A. - - - - - - - -
34
Zambezi Energy Corporation, Lda/Ncondezi Coal Company Mozambique, Lda - - - - - - - -
Hydrocarbons Sector: - - - - - -
35 Anadarko Moçambique Área 1, Lda. - - - - - - - -
36 Buzi Hydrocarbon - - - - - - - -
37 Companhia Moçambicana de Hidrocarbonetos - - - - - - - -
38 Empresa Nacional de Hidrocarbonetos - - - - - - -
39 Eni East Africa 8.197.500,00 8.197.336,05 -163,95 - - 8.197.500,00 8.197.336,05 163,95
40 PC Mozambique (Rovuma Basin) Limited 3.279.000,00 3.279.000,00 - - - 3.279.000,00 3.279.000,00 -
41 Sasol Petroleum M - 10 - - - - - - - -
42 Sasol Petroleum Moçambique - - - - - - - -
43 Sasol Petroleum Sengala - - - - - - - -
44 Sasol Petroleum Sofala, Lda - - - - - - - -
45 Sasol Petroleum Temane, Lda - - - - - - - -
46 Statoil - - - - - -
Total 11.476.500,00 11.476.336,05 -163,95 - - - 11.476.500,00 11.476.336,05 -163,95
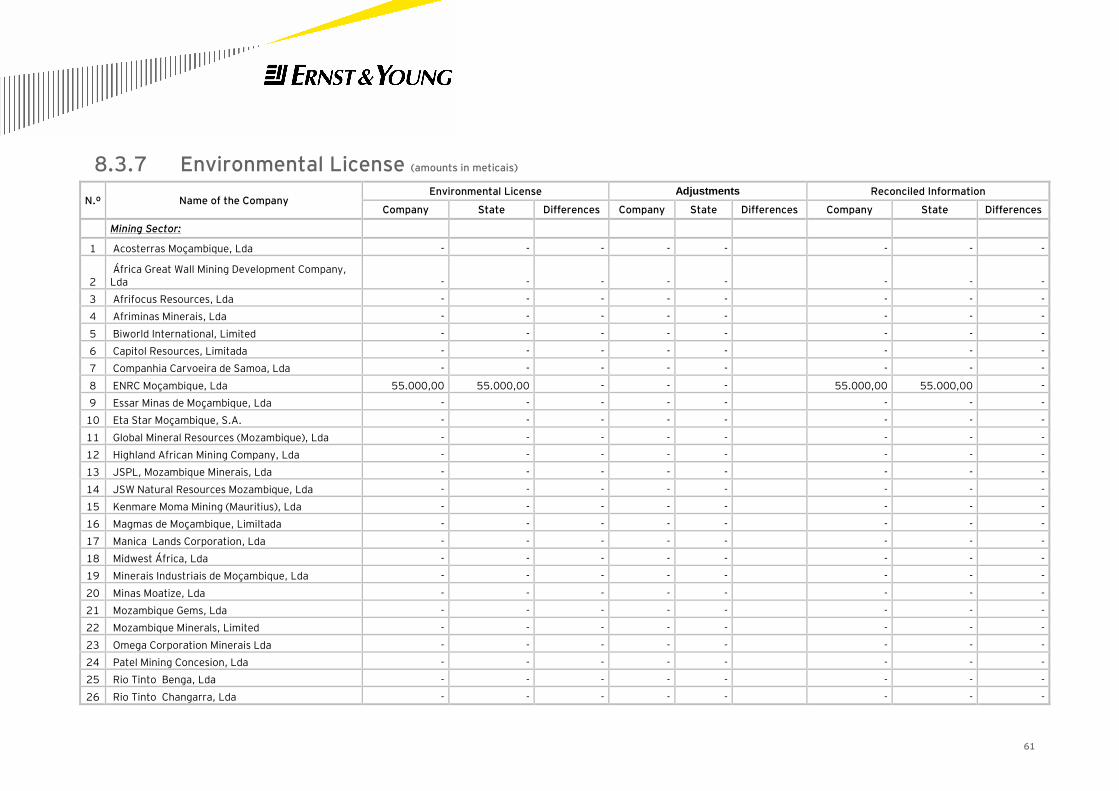
61
8.3.7 Environmental License (amounts in meticais)
N.º Name of the Company Environmental License Adjustments Reconciled Information
Company State Differences Company State Differences Company State Differences
Mining Sector:
1 Acosterras Moçambique, Lda - - - - - - - -
2 África Great Wall Mining Development Company, Lda - - - - - - - -
3 Afrifocus Resources, Lda - - - - - - - -
4 Afriminas Minerais, Lda - - - - - - - -
5 Biworld International, Limited - - - - - - - -
6 Capitol Resources, Limitada - - - - - - - -
7 Companhia Carvoeira de Samoa, Lda - - - - - - - -
8 ENRC Moçambique, Lda 55.000,00 55.000,00 - - - 55.000,00 55.000,00 -
9 Essar Minas de Moçambique, Lda - - - - - - - -
10 Eta Star Moçambique, S.A. - - - - - - - -
11 Global Mineral Resources (Mozambique), Lda - - - - - - - -
12 Highland African Mining Company, Lda - - - - - - - -
13 JSPL, Mozambique Minerais, Lda - - - - - - - -
14 JSW Natural Resources Mozambique, Lda - - - - - - - -
15 Kenmare Moma Mining (Mauritius), Lda - - - - - - - -
16 Magmas de Moçambique, LimiItada - - - - - - - -
17 Manica Lands Corporation, Lda - - - - - - - -
18 Midwest África, Lda - - - - - - - -
19 Minerais Industriais de Moçambique, Lda - - - - - - - -
20 Minas Moatize, Lda - - - - - - - -
21 Mozambique Gems, Lda - - - - - - - -
22 Mozambique Minerals, Limited - - - - - - - -
23 Omega Corporation Minerais Lda - - - - - - - -
24 Patel Mining Concesion, Lda - - - - - - - -
25 Rio Tinto Benga, Lda - - - - - - - -
26 Rio Tinto Changarra, Lda - - - - - - - -
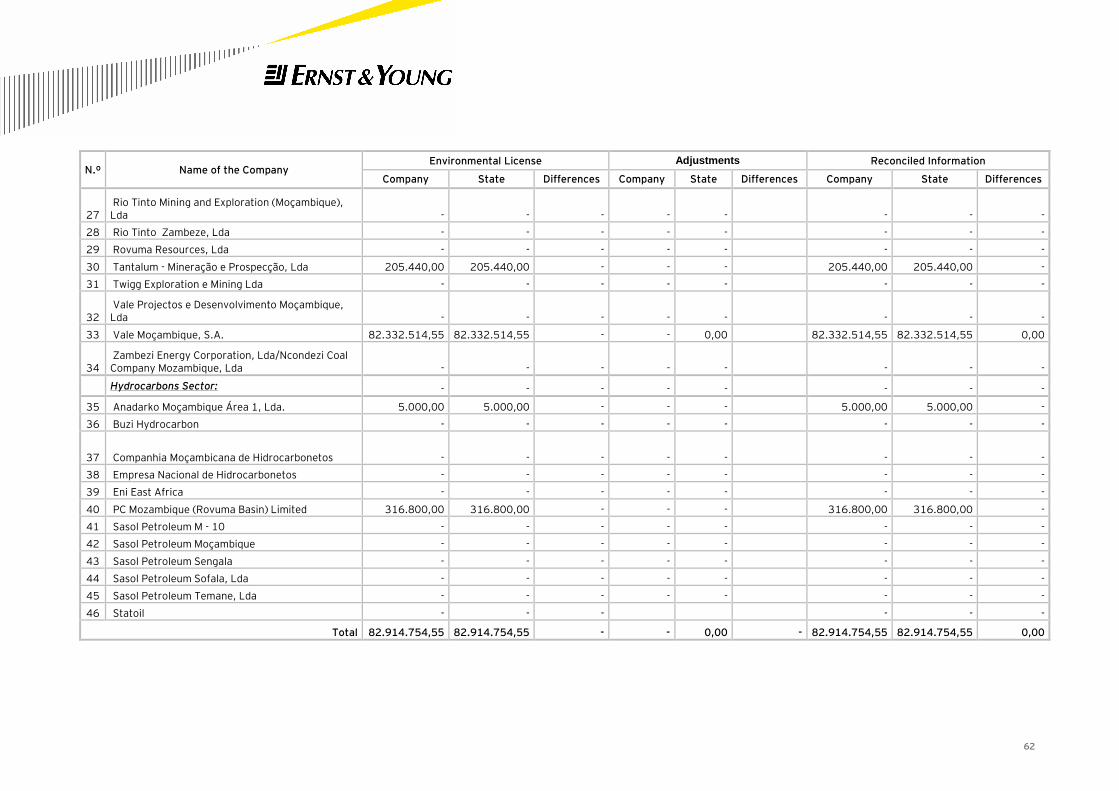
62
N.º Name of the Company Environmental License Adjustments Reconciled Information
Company State Differences Company State Differences Company State Differences
27 Rio Tinto Mining and Exploration (Moçambique), Lda - - - - - - - -
28 Rio Tinto Zambeze, Lda - - - - - - - -
29 Rovuma Resources, Lda - - - - - - - -
30 Tantalum - Mineração e Prospecção, Lda 205.440,00 205.440,00 - - - 205.440,00 205.440,00 -
31 Twigg Exploration e Mining Lda - - - - - - - -
32 Vale Projectos e Desenvolvimento Moçambique, Lda - - - - - - - -
33 Vale Moçambique, S.A. 82.332.514,55 82.332.514,55 - - 0,00 82.332.514,55 82.332.514,55 0,00
34 Zambezi Energy Corporation, Lda/Ncondezi Coal Company Mozambique, Lda - - - - - - - -
Hydrocarbons Sector: - - - - - - - -
35 Anadarko Moçambique Área 1, Lda. 5.000,00 5.000,00 - - - 5.000,00 5.000,00 -
36 Buzi Hydrocarbon - - - - - - - -
37 Companhia Moçambicana de Hidrocarbonetos - - - - - - - -
38 Empresa Nacional de Hidrocarbonetos - - - - - - - -
39 Eni East Africa - - - - - - - -
40 PC Mozambique (Rovuma Basin) Limited 316.800,00 316.800,00 - - - 316.800,00 316.800,00 -
41 Sasol Petroleum M - 10 - - - - - - - -
42 Sasol Petroleum Moçambique - - - - - - - -
43 Sasol Petroleum Sengala - - - - - - - -
44 Sasol Petroleum Sofala, Lda - - - - - - - -
45 Sasol Petroleum Temane, Lda - - - - - - - -
46 Statoil - - - - - -
Total 82.914.754,55 82.914.754,55 - - 0,00 - 82.914.754,55 82.914.754,55 0,00
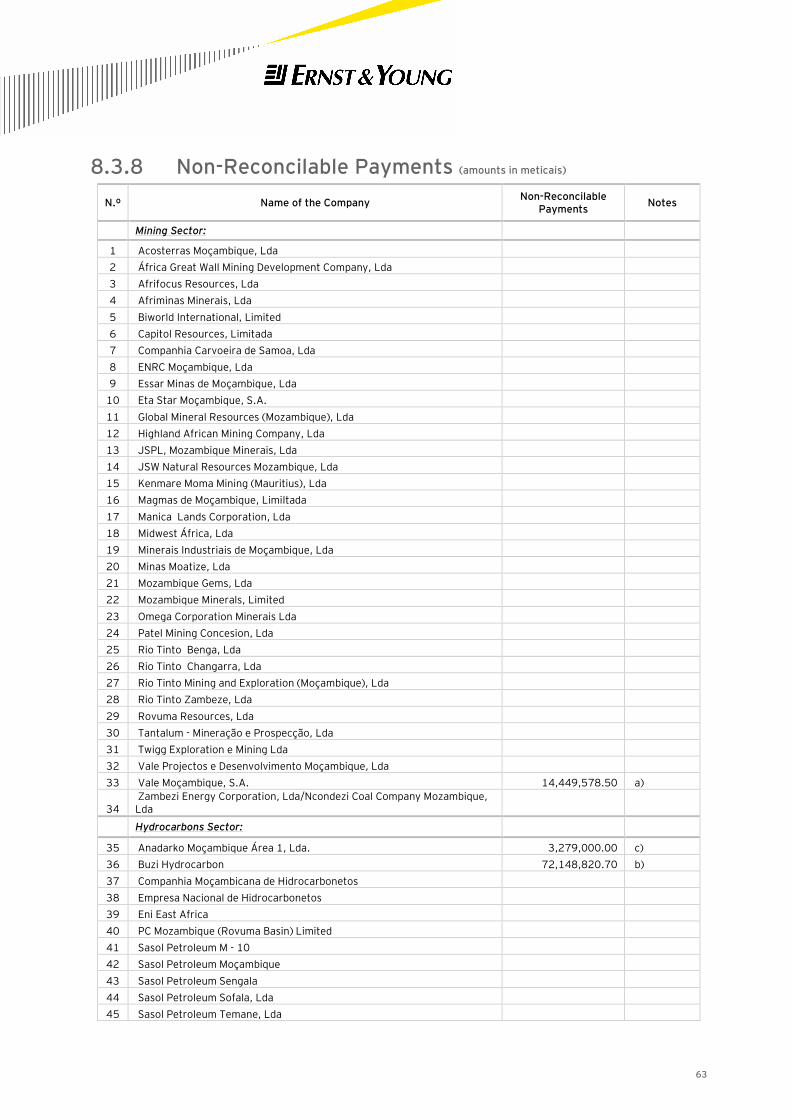
63
8.3.8 Non-Reconcilable Payments (amounts in meticais)
N.º Name of the Company Non-Reconcilable
Payments Notes
Mining Sector:
1 Acosterras Moçambique, Lda
2 África Great Wall Mining Development Company, Lda
3 Afrifocus Resources, Lda
4 Afriminas Minerais, Lda
5 Biworld International, Limited
6 Capitol Resources, Limitada
7 Companhia Carvoeira de Samoa, Lda
8 ENRC Moçambique, Lda
9 Essar Minas de Moçambique, Lda
10 Eta Star Moçambique, S.A.
11 Global Mineral Resources (Mozambique), Lda
12 Highland African Mining Company, Lda
13 JSPL, Mozambique Minerais, Lda
14 JSW Natural Resources Mozambique, Lda
15 Kenmare Moma Mining (Mauritius), Lda
16 Magmas de Moçambique, LimiItada
17 Manica Lands Corporation, Lda
18 Midwest África, Lda
19 Minerais Industriais de Moçambique, Lda
20 Minas Moatize, Lda
21 Mozambique Gems, Lda
22 Mozambique Minerals, Limited
23 Omega Corporation Minerais Lda
24 Patel Mining Concesion, Lda
25 Rio Tinto Benga, Lda
26 Rio Tinto Changarra, Lda
27 Rio Tinto Mining and Exploration (Moçambique), Lda
28 Rio Tinto Zambeze, Lda
29 Rovuma Resources, Lda
30 Tantalum - Mineração e Prospecção, Lda
31 Twigg Exploration e Mining Lda
32 Vale Projectos e Desenvolvimento Moçambique, Lda
33 Vale Moçambique, S.A. 14,449,578.50 a)
34 Zambezi Energy Corporation, Lda/Ncondezi Coal Company Mozambique, Lda
Hydrocarbons Sector:
35 Anadarko Moçambique Área 1, Lda. 3,279,000.00 c)
36 Buzi Hydrocarbon 72,148,820.70 b)
37 Companhia Moçambicana de Hidrocarbonetos
38 Empresa Nacional de Hidrocarbonetos
39 Eni East Africa
40 PC Mozambique (Rovuma Basin) Limited
41 Sasol Petroleum M - 10
42 Sasol Petroleum Moçambique
43 Sasol Petroleum Sengala
44 Sasol Petroleum Sofala, Lda
45 Sasol Petroleum Temane, Lda
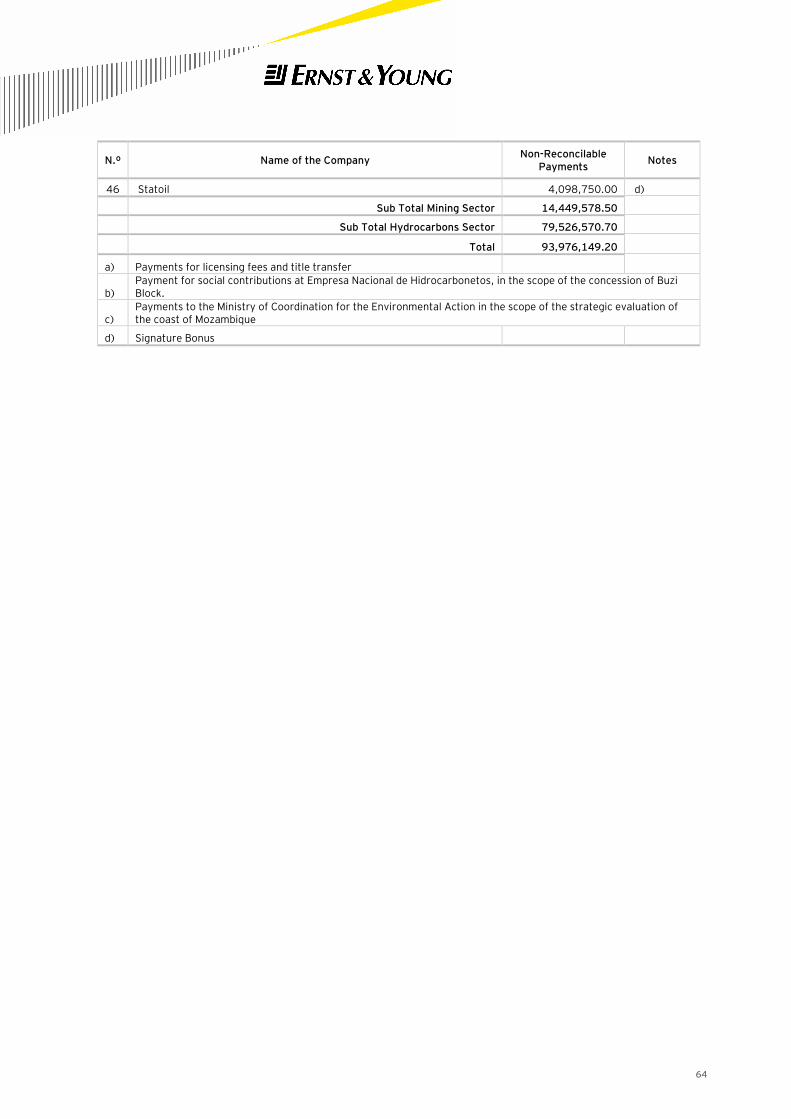
64
N.º Name of the Company Non-Reconcilable
Payments Notes
46 Statoil 4,098,750.00 d)
Sub Total Mining Sector 14,449,578.50
Sub Total Hydrocarbons Sector 79,526,570.70
Total 93,976,149.20
a) Payments for licensing fees and title transfer
b) Payment for social contributions at Empresa Nacional de Hidrocarbonetos, in the scope of the concession of Buzi Block.
c) Payments to the Ministry of Coordination for the Environmental Action in the scope of the strategic evaluation of the coast of Mozambique
d) Signature Bonus
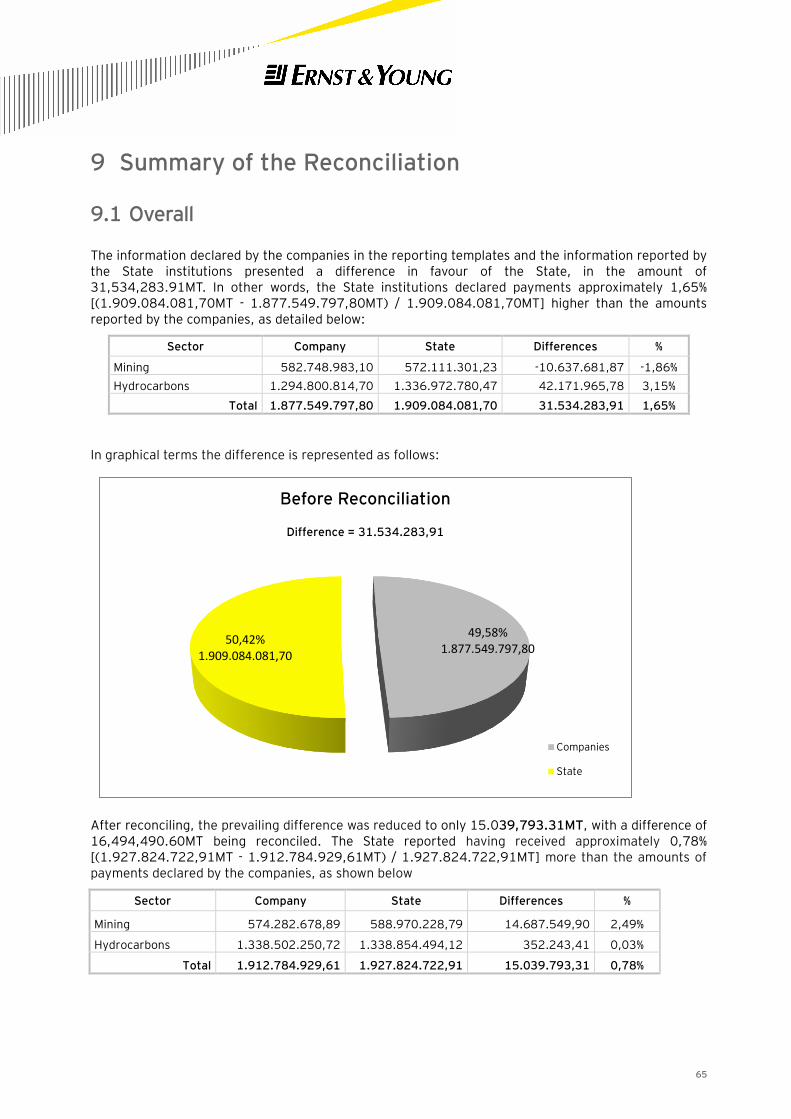
65
9 Summary of the Reconciliation
9.1 Overall
The information declared by the companies in the reporting templates and the information reported by the State institutions presented a difference in favour of the State, in the amount of 31,534,283.91MT. In other words, the State institutions declared payments approximately 1,65% [(1.909.084.081,70MT - 1.877.549.797,80MT) / 1.909.084.081,70MT] higher than the amounts reported by the companies, as detailed below:
Sector Company State Differences %
Mining 582.748.983,10 572.111.301,23 -10.637.681,87 -1,86%
Hydrocarbons 1.294.800.814,70 1.336.972.780,47 42.171.965,78 3,15%
Total 1.877.549.797,80 1.909.084.081,70 31.534.283,91 1,65%
In graphical terms the difference is represented as follows:
After reconciling, the prevailing difference was reduced to only 15.039,793.31MT, with a difference of 16,494,490.60MT being reconciled. The State reported having received approximately 0,78% [(1.927.824.722,91MT - 1.912.784.929,61MT) / 1.927.824.722,91MT] more than the amounts of payments declared by the companies, as shown below
Sector Company State Differences %
Mining 574.282.678,89 588.970.228,79 14.687.549,90 2,49%
Hydrocarbons 1.338.502.250,72 1.338.854.494,12 352.243,41 0,03%
Total 1.912.784.929,61 1.927.824.722,91 15.039.793,31 0,78%
49,58% 1.877.549.797,80
50,42% 1.909.084.081,70
Before Reconciliation
Difference = 31.534.283,91
Companies
State
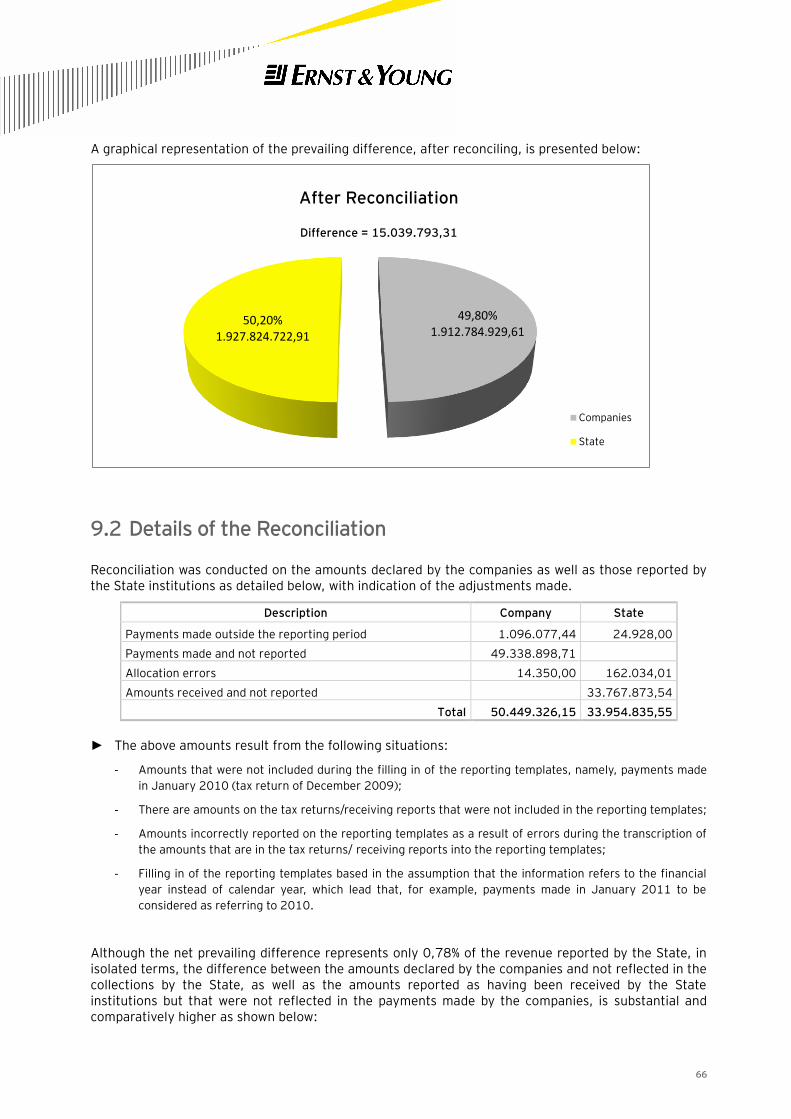
66
A graphical representation of the prevailing difference, after reconciling, is presented below:
9.2 Details of the Reconciliation
Reconciliation was conducted on the amounts declared by the companies as well as those reported by the State institutions as detailed below, with indication of the adjustments made.
Description Company State
Payments made outside the reporting period 1.096.077,44 24.928,00
Payments made and not reported 49.338.898,71
Allocation errors 14.350,00 162.034,01
Amounts received and not reported 33.767.873,54
Total 50.449.326,15 33.954.835,55
► The above amounts result from the following situations:
- Amounts that were not included during the filling in of the reporting templates, namely, payments made
in January 2010 (tax return of December 2009);
- There are amounts on the tax returns/receiving reports that were not included in the reporting templates;
- Amounts incorrectly reported on the reporting templates as a result of errors during the transcription of
the amounts that are in the tax returns/ receiving reports into the reporting templates;
- Filling in of the reporting templates based in the assumption that the information refers to the financial
year instead of calendar year, which lead that, for example, payments made in January 2011 to be
considered as referring to 2010.
Although the net prevailing difference represents only 0,78% of the revenue reported by the State, in isolated terms, the difference between the amounts declared by the companies and not reflected in the collections by the State, as well as the amounts reported as having been received by the State institutions but that were not reflected in the payments made by the companies, is substantial and comparatively higher as shown below:
49,80% 1.912.784.929,61
50,20% 1.927.824.722,91
After Reconciliation
Difference = 15.039.793,31
Companies
State
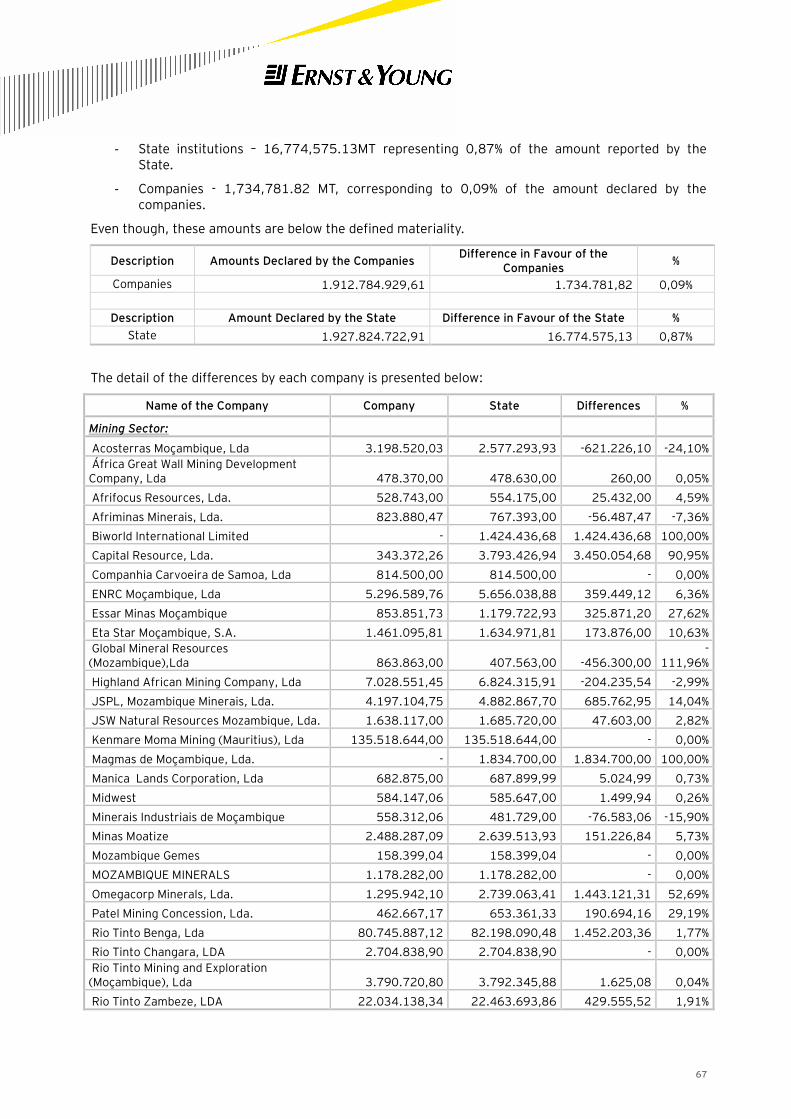
67
- State institutions – 16,774,575.13MT representing 0,87% of the amount reported by the State.
- Companies - 1,734,781.82 MT, corresponding to 0,09% of the amount declared by the companies.
Even though, these amounts are below the defined materiality.
Description Amounts Declared by the Companies Difference in Favour of the
Companies %
Companies 1.912.784.929,61 1.734.781,82 0,09%
Description Amount Declared by the State Difference in Favour of the State %
State 1.927.824.722,91 16.774.575,13 0,87%
The detail of the differences by each company is presented below:
Name of the Company Company State Differences %
Mining Sector:
Acosterras Moçambique, Lda 3.198.520,03 2.577.293,93 -621.226,10 -24,10%
África Great Wall Mining Development Company, Lda 478.370,00 478.630,00 260,00 0,05%
Afrifocus Resources, Lda. 528.743,00 554.175,00 25.432,00 4,59%
Afriminas Minerais, Lda. 823.880,47 767.393,00 -56.487,47 -7,36%
Biworld International Limited - 1.424.436,68 1.424.436,68 100,00%
Capital Resource, Lda. 343.372,26 3.793.426,94 3.450.054,68 90,95%
Companhia Carvoeira de Samoa, Lda 814.500,00 814.500,00 - 0,00%
ENRC Moçambique, Lda 5.296.589,76 5.656.038,88 359.449,12 6,36%
Essar Minas Moçambique 853.851,73 1.179.722,93 325.871,20 27,62%
Eta Star Moçambique, S.A. 1.461.095,81 1.634.971,81 173.876,00 10,63%
Global Mineral Resources (Mozambique),Lda 863.863,00 407.563,00 -456.300,00
-111,96%
Highland African Mining Company, Lda 7.028.551,45 6.824.315,91 -204.235,54 -2,99%
JSPL, Mozambique Minerais, Lda. 4.197.104,75 4.882.867,70 685.762,95 14,04%
JSW Natural Resources Mozambique, Lda. 1.638.117,00 1.685.720,00 47.603,00 2,82%
Kenmare Moma Mining (Mauritius), Lda 135.518.644,00 135.518.644,00 - 0,00%
Magmas de Moçambique, Lda. - 1.834.700,00 1.834.700,00 100,00%
Manica Lands Corporation, Lda 682.875,00 687.899,99 5.024,99 0,73%
Midwest 584.147,06 585.647,00 1.499,94 0,26%
Minerais Industriais de Moçambique 558.312,06 481.729,00 -76.583,06 -15,90%
Minas Moatize 2.488.287,09 2.639.513,93 151.226,84 5,73%
Mozambique Gemes 158.399,04 158.399,04 - 0,00%
MOZAMBIQUE MINERALS 1.178.282,00 1.178.282,00 - 0,00%
Omegacorp Minerals, Lda. 1.295.942,10 2.739.063,41 1.443.121,31 52,69%
Patel Mining Concession, Lda. 462.667,17 653.361,33 190.694,16 29,19%
Rio Tinto Benga, Lda 80.745.887,12 82.198.090,48 1.452.203,36 1,77%
Rio Tinto Changara, LDA 2.704.838,90 2.704.838,90 - 0,00%
Rio Tinto Mining and Exploration (Moçambique), Lda 3.790.720,80 3.792.345,88 1.625,08 0,04%
Rio Tinto Zambeze, LDA 22.034.138,34 22.463.693,86 429.555,52 1,91%
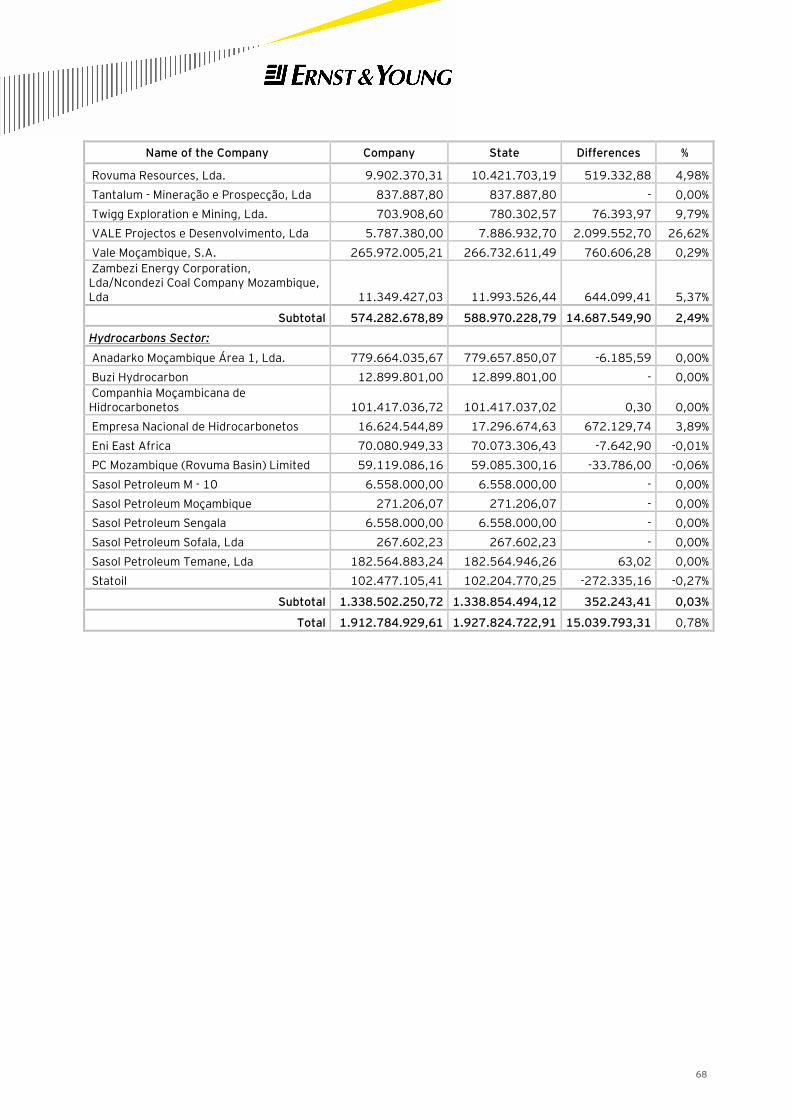
68
Name of the Company Company State Differences %
Rovuma Resources, Lda. 9.902.370,31 10.421.703,19 519.332,88 4,98%
Tantalum - Mineração e Prospecção, Lda 837.887,80 837.887,80 - 0,00%
Twigg Exploration e Mining, Lda. 703.908,60 780.302,57 76.393,97 9,79%
VALE Projectos e Desenvolvimento, Lda 5.787.380,00 7.886.932,70 2.099.552,70 26,62%
Vale Moçambique, S.A. 265.972.005,21 266.732.611,49 760.606,28 0,29%
Zambezi Energy Corporation, Lda/Ncondezi Coal Company Mozambique, Lda 11.349.427,03 11.993.526,44 644.099,41 5,37%
Subtotal 574.282.678,89 588.970.228,79 14.687.549,90 2,49%
Hydrocarbons Sector:
Anadarko Moçambique Área 1, Lda. 779.664.035,67 779.657.850,07 -6.185,59 0,00%
Buzi Hydrocarbon 12.899.801,00 12.899.801,00 - 0,00%
Companhia Moçambicana de Hidrocarbonetos 101.417.036,72 101.417.037,02 0,30 0,00%
Empresa Nacional de Hidrocarbonetos 16.624.544,89 17.296.674,63 672.129,74 3,89%
Eni East Africa 70.080.949,33 70.073.306,43 -7.642,90 -0,01%
PC Mozambique (Rovuma Basin) Limited 59.119.086,16 59.085.300,16 -33.786,00 -0,06%
Sasol Petroleum M - 10 6.558.000,00 6.558.000,00 - 0,00%
Sasol Petroleum Moçambique 271.206,07 271.206,07 - 0,00%
Sasol Petroleum Sengala 6.558.000,00 6.558.000,00 - 0,00%
Sasol Petroleum Sofala, Lda 267.602,23 267.602,23 - 0,00%
Sasol Petroleum Temane, Lda 182.564.883,24 182.564.946,26 63,02 0,00%
Statoil 102.477.105,41 102.204.770,25 -272.335,16 -0,27%
Subtotal 1.338.502.250,72 1.338.854.494,12 352.243,41 0,03%
Total 1.912.784.929,61 1.927.824.722,91 15.039.793,31 0,78%
69
10 Review of the Information used for the
Reconciliation
The reconciliation exercise comprised the gathering, organization and review of the information provided by the companies and the State institutions.
In order to comply with the terms of reference provided by the EITI, we took the precaution that we deemed necessary and appropriate for the reconciliation exercise. As decided by the Coordination Committee, it has been strictly agreed that the companies should send the information with copies of the support documentation of all the payments made or, alternatively, the information should have been certified by an external auditor.
Despite the fact that the companies are audited by international audit firms, they choose to provide us with the proof of payments which was extremely valuable for the reconciliation exercise as it allowed us to undertake a reliable cross-check of the information provided by the companies with the information provided by DGI.
Anyway, we found it prudent to undertake a detailed review of the matter associated with the information utilized for the reconciliation exercise.
10.1 Reporting Templates
Prior to any review, it is important to recall that the reporting templates were prepared in order to obtain information desegregated by type of tax and for each of the payments /receivables with detailed description of the monthly tax returns used for the payments of the taxes or fees (e.g. date, reference number, amount paid).
This detail enabled us to undertake an efficient and reliable individual reconciliation as it allowed the cross checking and validation of the information provided by the parties and, in case of inconsistency, to proceed with the relevant queries.
10.2 Information Made Available by the State Institutions
The State institutions selected for the gathering of the information, namely DGI and INP, provided the data requested by means of formal letters signed by the persons responsible.
While INP provided the reporting templates with the detail of the information, DGI, which is the entity that receives the larger amount of the revenue, has gone further than this. Besides filling in the reporting templates, DGI provided us with print outs of the reports on receivables directly extracted from the tax collection system in order to confirm the information contained in the templates.
This procedure gave us the required comfort for the undertaking of the work as the information in the print outs matches with the information provided by the companies.
70
Without prejudice to the issues raised under recommendations4 we considered that the information provided by the State institutions, in general, and particularly by DGI is reliable.
10.3 Information Provided by the Companies
Similarly to the State institutions, the companies supplied the reporting templates with the required detail (by tax and payment).
The companies also provided a file with the tax returns and other proof of payment of the taxes, fees and contributions. During the work and, as it proved to be necessary to reconcile the differences assessed, namely, emerging from the comparison with the information provided by DGI, we requested tax returns to the entities to which these differences refer.
With respect to the companies it was important to take into consideration that, in accordance with n.º 1 of article 1 of Decree n.º 32/90, dated 7th December, companies that enjoy a special customs and tax regime are required to have their financial statements audited by a professionally reliable independent auditor.
This obligation is extensive to foreign companies, defined as companies whose head offices are located outside the country.
Perusing the above legal ground, it is concluded that all companies operating in the extractive industry should have their financial statements certified by an independent auditor as they benefit/benefited from special tax regimes, namely, customs duty exemption on the importation of goods of class K.
As the companies provided proof of payment of the taxes, fees and contributions reflected on the Reporting Templates, we considered that the data provided is reliable and enabled us to conduct a rigorous and accurate exercise of reconciliation of the taxes and fees selected on the Scoping Study.
4 We verified that the information provided by DGI was prepared by each of the tax departments where the taxpayers are registered. During the reconciliation work it was necessary to resource to other information from the tax departments where the companies selected had branches and /or received payments from the companies.
71
11 Conclusions and Recommendations
11.1 Conclusions
The aim of the work conducted was to prepare the third report for reconciliation of payments made by the extractive industry. From the work performed, which had as a time scope, the payments made in calendar year 2010, we found that, in general, there were some discrepancies between the information provided by the companies and that provided by State institutions.
A situation of discrepancy results from the fact that the information provided by DGI for the Scoping Study is, in general, lower than that provided to the reconciliation report, having similarly found individual situations in which the information initially provided by DGI was higher than that reported on the reporting templates filled in.
Notwithstanding, it was possible to reconcile partially these differences through the analysis of the information available and that that was subsequently made available, namely, an audit to the proof of payment collected.
The difference assessed is under the materiality threshold defined by the coordination Committee of EITI and in our opinion it does not require further follow up. However, we consider that this difference may be reconciled upon presentation of proof of payment by the companies as it is with regards to them that the differences were found.
In summary, and taking as basis the information made available by the State institutions and, although only 44 companies have replied to the reporting templates, we found the following:
► The net difference prevailing after the exercise of reconciliation is 15,039.793.31MT, representing less than 0,78% of the total collection reported by the State institutions. To refer that this difference is in favour of the State, which in other words means that the State reported having received more than what the companies declare to have paid.
► Most of the differences result, in our opinion, from the following situations:
- Some payments made in tax departments different from that were the companies normally comply with
their tax obligations were not reported. It was only possible to identify this fact with the delivery of the
proof of payment by the companies.
- Payment of taxes specific to the mining activity with the tax registration number of the National Directorate of Mining.
We were unable to perform the reconciliation exercise with respect to all 46 companies selected because two (2) companies did not reply to the reporting template. With respect to these, the State institutions reported receipts of 3.259.136,68MT, representing 0,17% of the revenue received.
From what we understood, the fact that 2 companies did not reply to the reporting templates does not result from lack of cooperation but is due to other circumstances such as not considering this exercise as a priority.
On the other hand, it cannot be ignored that the access to the files of previous years is not an easy task neither for the companies that have large quantities of records, neither for the State. Note that we are in year 2012 reconciling payments of 2010.
In terms of payments / receipts, it has been found that the revenues from the companies of the sector of the extractive industry had a slight increase, despite the fact that in year 2010 only few companies were in the production phase.
72
Similarly, and as other companies begin the commercial production of minerals and hydrocarbons, and as the tax incentives granted are expiring, we believe that there will be significant increases in the fiscal revenue, namely that that is levied on profits and on the product extracted.
11.2 Recommendations
In general terms, the reconciliation exercise was conducted without major constraints, notwithstanding that significant delays were experienced, in most cases, attributable to the companies that did not respond to the reporting template within the established deadlines. Still, it is possible to present some recommendations to improve the next reconciliation exercises in order to be able to complete the reconciliation within the maximum period of one month. These are the following:
To stress that part of these recommendations were mentioned in previous reports. Nevertheless, we believe that there were time constraints in the implementation of the recommend amendments as the first report was disclosed on February 2011 and the second report on March 2012.
Moreover, we are similarly aware that the short period of time between the disclosure of these two reports and the preparation of the third report will not allow different conclusions and recommendations on the report to be prepared with regards to 2011.
The recommendations that we deem important to take to your consideration are as follows:
► Regular update of the database with regards to the mining and hydrocarbons sectors. It is essential for MIREM and DGI to have the contacts and the addresses of the companies and/or its representatives allowing for a shorter period for the remittance of the reporting templates.
- Part of this is associated to the fact that the majority of the companies is still in the exploration phase and does not have administrative structures in place. These are represented by consultants and lawyers who not always have the required financial information.
► DGI should ensure that payment of taxes is made in the name of the companies, not allowing payments in the name of State institutions (MIREM, MICOA or other). Also, it must be taken into consideration, during the information gathering, that some companies may pay their taxes, namely, Surface Tax, at different tax departments;
- As the system of tax revenue collection of DGI is decentralized and, consequently, not always allowing the gathering of full information in real time, it is necessary to endow the various tax departments with proper tools that allow the identification of the payments of taxpayers from other tax departments.
► The selection process cannot be limited to the information centrally provided by DGI as the same has to be validated by the several tax departments. This results from the fact that the information regarding the revenue of the central database diverges from that provided by the tax departments.
- In order to undertake this exercise timely, it is necessary to begin the reconciliation exercise earlier as the information shall be collected at the several tax departments, which are known not to be connected to the network or, if they are, not always provide information in real time.
► The reconciliation of the payments shall be made with regards to the previous year in order to avoid constraints associated with the difficult access to the files of earlier years that usually occurs, in particular, in companies with large quantities records.
73
As soon as the number of companies grows and the specific revenue of the extractive activity also grows, the focus should be on the payments made by the companies as taxpayers and not as tax substitutes.
The delivery of the proof of payments and receipts constitutes a very useful method of validation which in our opinion shall be kept in future work, as we understand that an additional burden to the companies by request them to provide information validated/certified by independents auditors cannot be imposed.
74
12 Annexure I: Terms of Reference
Annex A: TERMS OF REFERENCE FOR THE RECONCILER
FOR THE SECOND MEITI INDEPENDENT RECONCILIATION REPORT COVERING JANUARY 2010 TO DECEMBER 2010
Terms of Reference
for
CONSULTING SERVICES: SELECTION OF FIRM TO CARRY OUT SCOPING STUDY AND PRODUCE DE MEITI THIRD
RECONCILIATION REPORT
1. BACKGROUND 1.1 EITI is a global coalition of governments, companies, civil society, and investors committed to implement standardized and internationally recognized procedures for transparency in natural resource management. EITI programs help civil society groups, media and public at large to systematically review and assess what is being paid by the companies to, and received by government agencies. By making information on payments and revenues public, EITI improves trust among these groups and reduces risk of conflict and promote stability, which are essential in attaining sustainable economic development.
1.2 The Government of the Republic of Mozambique issued made a commitment to implement to increase transparency and accountability in the management of extractive industries. On May 15, 2009, Mozambique became an EITI Candidate Country. In May 2011, Mozambique completed an EITI validation exercise, which assessed its compliance with the EITI standard and principles. Successful validation leads to achieving EITI Compliant status. 1.3 Subsequently, the Board of the EITI concluded that Mozambique had made meaningful progress towards implementing the EITI standard and principles.The Board ruled that Mozambique would remain a Candidate country until February 2013, subject to a clearly defined and agreed work plan for achieving compliant status, including a schedule of its next Validation. Mozambique has been in the process of implementing a number of remedial
75
measures and recommendations proposed by the EITI Board following the validation exercise..
1.4 The implementation of the EITI in Mozambique is steered by a thirteen member Coordinating Committee. The Committee is headed by the Vice Minister of Mineral Resources, Abdul Razak Noormohamed and includes four representatives each selected by government, civil society, and the extractive companies. The work of the Committee is coordinated by a National Coordinator based in the Ministry of Mineral Resources. The Committee is supported by a Secretariat with staff and premises that are not part of the Ministry of Mineral Resources. The Secretariat is responsible for the day-to-day implementation of activities under the guidance of the Coordinating Committee.
1.5 The implementation of subsequent prerequisite EITI activities leading to full EITI Country Compliant Status is underway. These activities include among others, reconciliation of payments made by extractive companies to the Government and revenues received by the Government. The EITI Rules require that this task is undertaken by an independent Reconciler. To date, Mozambique has undertaken two reconciliation exercises (2008 and 2009).
1.6 The MEITI-Secretariat wishes to engage a qualified and experienced consultant (the “Consultant”) to prepare the third EITI Reconciliation Report of Mozambique according to The EITI Rules (2011 Edition). The Consultant will carry out reconciliation of payments made by mining, oil, and gas companies against revenues received by the Government, as provided in the EITI Guidelines for Reconciler.
2. SCOPE OF SERVICES
The assignment that the Consultant will undertake constitutes the following components which are crucial to undertaking successful reconciliation:
A. SCOPING STUDY
i. Survey all extractive (oil, gas and mining) companies operating in
Mozambique including potential small scale mining and provide list with their names, sectorial focus, and nature of operation (upstream/downstream). Categorize/group on basis of the type of operation (exploration or production) and scale of operation (e.g., US$100,000 – US$1,000,000 turnover /year).
76
ii. Identify the types of payments and income streams existing in the extractive sector in Mozambique.
iii. Identify the existence of in-kind payments, infrastructure provisions and other barter arrangements, and social payments and donations in Mozambique´s extractive sector. If they exist, recommend how to handle in the Reconciliation report in accordance with the New EITI Rules of 2011.
iv. Provide a map outlining the payment flows within the extractive
industry in Mozambique, including payments and transfers to/from local and district levels of government.
v. Propose the materiality threshold that shall be used to determine the extractive companies that shall be covered in the Reconciliation Report. As well, the unilateral disclosure of data from the Government side related to those companies that fall below the threshold (not subject to the reconciliation).
vi. Establish a list of all Government Agencies receiving payments from extractive industries.
vii. Establish a list of the extractive companies and Government agencies to be included in the Reconciliation Report. For each company, identify;
Company's Tax Payer Identification Number Type of company i.e. exploration, mining, quarrying, oil/gas, trading, etc Type of license(s) held and the license number(s) The company's main products Company's location(s) Companies reporting for the first time.
viii. Re-design or modify reporting templates in accordance with the results of
the scoping study if necessary. ix. Submit a draft scoping report and draft reporting templates to MEITI-
MSG (Multi-Stakeholders Group) for scrutiny and approval.
x. Prepare a final scoping report incorporating comments and suggestions made by MEITI-MSG.
77
B. TRAINING FOR REPORTING GOVERNMENT AGENCIES AND EXTRACTIVE COMPANIES
i. Organize a one-day training workshop for the extractive companies and
government agencies reporting in Third Reconciliation Report. Extractive companies and government agencies to have a clear understanding of the information to be provided.
ii. The extractive companies and government agencies to understand that only cash based payments and not accrual based payments will be used in the report.
iii. The requirement for data extracted from audited financial statements to meet international auditing standards to be explained.
iv. Provide guidelines for completing reporting templates and demonstrate how to properly fill in reporting templates, including providing clarifications on the use of cash based (not accrual based) payments.
v. Discuss and agree the type of evidence required for each payment stream.
vi. Explain the timeline and deadline for completing reporting templates.
C. RECONCILIATION EXERCISE
i. Review the existing reporting templates and update them in accordance
with the agreed scope of coverage for the third EITI report.
ii. Government and company reports must be based on accounts audited to international standards. Reporting government entities and companies are requested to have their reporting forms certified by their auditor before submitting them to the reconciler. In the cases where data has not been certified or audited to international standards, the reconciler must request supporting documentation (i.e. audited financial statements, receipts, banking records) to verify the veracity of company and government data.
iii. Distribute the reporting template directly to each Government agency and
to each of the extractive companies.
78
iv.Collect the reporting template directly from each Government agency and from each of the extractive companies.
v. Obtain any additional information from the extractive companies and
government agencies necessary to carry out the reconciliation, including requesting any missing data.
vi.Discuss with MEITI-MSG how to address any specific issues that may arise
which are related to meeting validation.
vii.Taking into account the recommendations contained in the previous Mozambique’s EITI Reports as well the main lessons learnt. Analyze and reconcile all material payments made by the extractive companies to the Government and material receipts by the Government from extractive companies for the period of January 1, 2010 to December 31, 2010.
viii.The social payments and payment in kinds shall be disclosed at the report,
when existing and not subject to the reconciliation as agreed by the MSG.
ix.Propose a mechanism for following up unresolved discrepancies between the companies and the government.
x.Produce a report that reflects above.. The reconciler shall work with both
parties to explain and resolve any discrepancies between the payments and receipts. The report shall highlight the reconciled discrepancies and the unresolved discrepancies and recommend action to be taken on the unresolved discrepancies.
xi. The Reconciliation report must:
Include an overview of EITI and the extractive sector in Mozambique.
Include the definition of ‘material payments and revenues’ agreed by MEITI-MSG.
List and describe the revenue and benefit streams that are included in the report.
Include a list of all licensed or registered companies involved in the extractive sector exploration and production, noting which companies participated in the EITI reporting process and those that did not (with an indication of the relative size whether by production or revenue/payments and reasons for non-participation).
State if any companies or government entities failed to participate in the reporting process, and assess whether this is likely to have had a material impact on the stated figures;
Describe the steps taken by the government and the MSG to ensure that company and government disclosures to the reconciler are based on audited accounts to international standards.
Describe the methodology adopted by the reconciler to identify discrepancies, and any further work to be undertaken by the reconciler, the MSG or the government to explain and, if necessary, address any discrepancies that have been identified.
79
Include the reconciler’s comments on the quality of the data.
Explain the procedure and methodology in order to facilitate and prepare future reconciliation exercises; and
Set out recommendations for how to strengthen the exercise in future
xii.A draft report to be submitted to the MSG for approval with a power point
presentation on the main findings and recommendations.
xiii.The report shall be published and disseminated to the public in an accessible, comprehensive and comprehensible manner.
xiv. Produce a summary of the Reconciliation report in a clear and comprehensible manner for wider dissemination to the public.
xv. The reconciler shall prepare short and long versions of the reconciliation report in Portuguese and English
xvi. The reconciler shall present the report at a national workshop to be held after its approval by the MEITI – MSG.
3. WORK PLAN
At the commencement of the assignment, the Consultant shall, within one (1) week after signing the contract, prepare an inception report detailing work plan for the implementation of the entire assignment including a Completed Desk Review of the Detailed Field-Work Plan for scoping component and submit the plan to the MEITI Secretariat for approval before proceeding to implement it.
The Inception Report will outline detailed research methodology (including a detailed presentation of the assignment and participatory research technologies to be employed), including a detailed report outline, key questions to be investigated, a proposed evaluation strategy, participatory analysis and instruments to be used. The Inception Report should also include an initial literature review and preliminary stakeholder analysis.
.
80
4. DELIVERABLES
4.1 Scoping Report
At the end of the second (2th) week after contract signing, the Consultant shall submit to the Client through MEITI Coordinator a draft Scoping Report and reporting templates in three (3) Portuguese hard copies and one electronic (MS Words) copy. The Client will review the draft Report and reporting templates and submit comments in two days for consultant to compile and submit final report (billing Portuguese and English) and reporting templates (Portuguese) at the end of fifth (5th) week after contract signing.
4.2 Stakeholder’s Training
On the fifth (5th) week after commencement of the assignment, the Consultant shall provide a specialized training on the assignment to at least thirty (50) nominated representatives of the Government entities and Extractive Companies covering the trainer’s assessment of the scope of training and recommendations. The developed training materials and guidelines for completion of the reporting templates shall be presented during the training session. The Client shall coordinate the training, nominate the candidates and bear the cost of the workshop.
4.3 Draft Final Reconciliation Report
The draft Reconciliation Report shall be prepared on the eleventh (11th)
week after commencement of the assignment and submitted to the client in four (4) hard copies (billing Portuguese and English) and one electronic (MS Words) copy. It will address all key tasks towards the end of assignment representing key aspects as given in the Terms of Reference with recommendations for future course of action that ensure successful implementation of the Action Plans resulting from the assignment. This draft report will be the basis of seeking guidance from the Client and other stakeholders. The comments from Client shall be incorporated into the Final Draft Report within four (4) days upon receipt of such comments.
4.4 Reconciliation meeting with MSG
The reconciliation workshop shall be conducted in Maputo, on the thirteenth (12th) week after commencement of the assignment, in which the draft final Reconciliation Report will be discussed and validated by stakeholders. It is anticipated that the workshop resolutions and key contributions of the stakeholders will be reflected in the Final Reconciliation Report. The Client
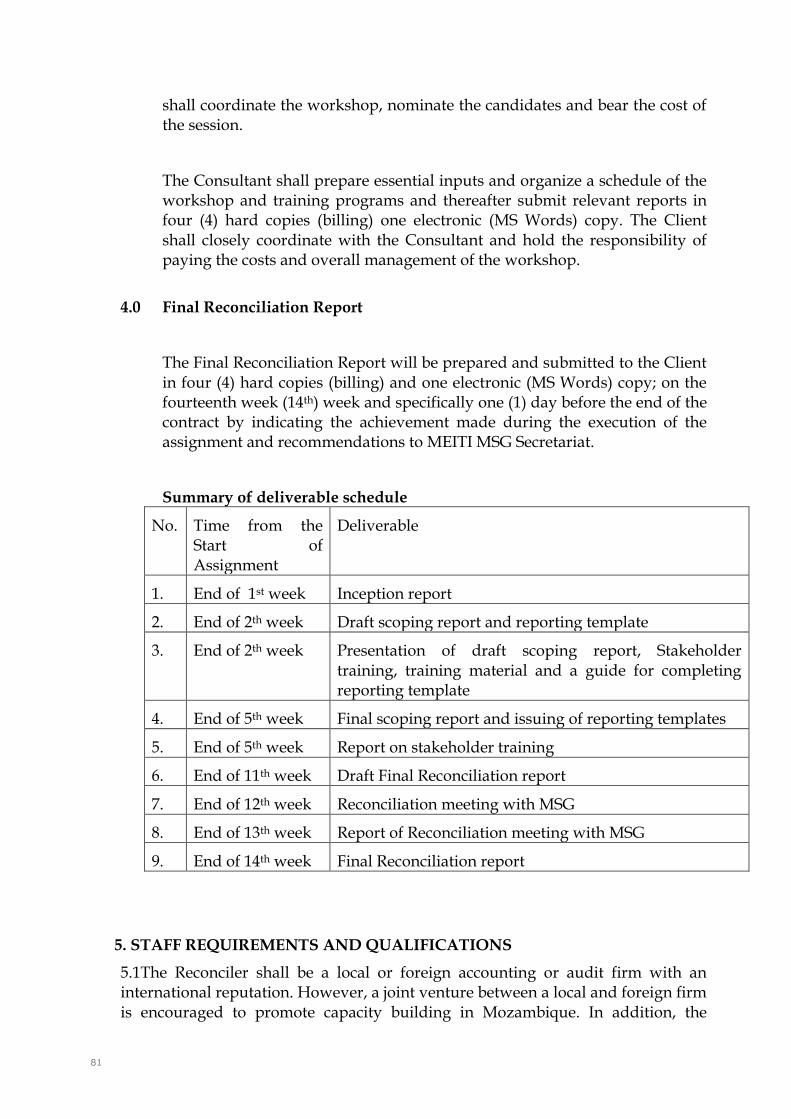
81
shall coordinate the workshop, nominate the candidates and bear the cost of the session.
The Consultant shall prepare essential inputs and organize a schedule of the workshop and training programs and thereafter submit relevant reports in four (4) hard copies (billing) one electronic (MS Words) copy. The Client shall closely coordinate with the Consultant and hold the responsibility of paying the costs and overall management of the workshop.
4.0 Final Reconciliation Report
The Final Reconciliation Report will be prepared and submitted to the Client in four (4) hard copies (billing) and one electronic (MS Words) copy; on the fourteenth week (14th) week and specifically one (1) day before the end of the contract by indicating the achievement made during the execution of the assignment and recommendations to MEITI MSG Secretariat.
Summary of deliverable schedule
No. Time from the Start of Assignment
Deliverable
1. End of 1st week Inception report
2. End of 2th week Draft scoping report and reporting template
3. End of 2th week Presentation of draft scoping report, Stakeholder training, training material and a guide for completing reporting template
4. End of 5th week Final scoping report and issuing of reporting templates
5. End of 5th week Report on stakeholder training
6. End of 11th week Draft Final Reconciliation report
7. End of 12th week Reconciliation meeting with MSG
8. End of 13th week Report of Reconciliation meeting with MSG
9. End of 14th week Final Reconciliation report
5. STAFF REQUIREMENTS AND QUALIFICATIONS
5.1The Reconciler shall be a local or foreign accounting or audit firm with an international reputation. However, a joint venture between a local and foreign firm is encouraged to promote capacity building in Mozambique. In addition, the
82
Reconciler should be reliable and impartial to all the parties (extractive Companies and Government) involved in the EITI initiative.
5.2 The selecting process of the Reconciler, all interviews or meetings to be held by the reconciler shall be conducted in Portuguese (official language in Mozambique). The inception Report, draft and final Reports must be submitted to the MEITI-MSG for comments in Portuguese and after its approval the English version can be delivered.
5.3 Other preferred qualifications are as follows:
a) Team Leader: i). Possess Master degree (CPA, ACCA or equivalent) in taxation; ii). At least 5 years of experience in the area of taxation in public or
corporate accounting; iii). Experience in similar EITI reconciliation assignments; and iv). Experience in the extractive sector in Africa is required.
b) One Taxation expert: i). Possess graduate degree in accounting or economics; ii). At least 3 years of experience in the area of taxation in Africa; iii). Experience in similar EITI reconciliation assignments or equivalent
experience in the extractive sector in Africa.
Administrative Arrangements
1. The Reconciler shall report to the MEITI-Secretariat and liaise on a day-to-day basis with the Head of the Secretariat on contractual and on all technical matters pertaining to the implementation of the Project. The Head of the Secretariat will be the Reconciler’s contact person in the course of implementation of the Project.
6.Support to be provided by the MEITI
2. The MEITI Secretariat will provide the Reconciler with the following support:-
i) Liaison with the members of the MEITI-MSG;
ii) Liaison with reporting entities (extractive companies and all the relevant
Ministries and Government agencies) to facilitate Reconciler’s work;
83
iii) Provide any of the reference materials mentioned in this assignment.
DURATION OF THE PROJECT
The work will be allocated to a total of 14 weeks. The Project shall be completed for a period not exceeding 100 days from the Effective Date of Contract.
Ernst & Young
Assurance | Tax | Transactions | Advisory
Acerca da Ernst & Young
A Ernst & Young é um líder global em auditoria, fiscalidade e serviços de consultoria e apoio a transacções.
Globalmente, os nossos 152.000 colaboradores estão unidos pela partilha dos nossos valores e um compromisso firme com a qualidade. Fazemos a diferença pelo apoio aos nossos colaboradores, aos nossos clientes e às comunidades globais para atingirem o seu potencial.
Para mais informação, visite www.ey.com, www.ey.com/ifrs e www.ey.com/mz
A Ernst & Young comporta a Organização internacional de membros da Ernst & Young Global Limited, sendo cada uma delas uma entidade legal separada. A Ernst & Young Global Limited, uma entidade limitada no Reino Unido, não presta serviços a clientes.
© 2012 Ernst & Young, Lda
Todos os direitos reservados.