Embed Size (px)
Citation preview
emotional intelligence
questionnaire
> User Manual
Reviewed by BUROS CENTER FOR TESTING

© 2014, MySkillsProfile.com Limited. www.myskillsprofile.com.com.
EIQ16 is a trademark of MySkillsProfile.com Limited.
All rights reserved. No part of this publication may be reproduced or distributed in any form or by any means or stored in a database or retrieval system without the prior written permission of MySkillsProfile.com Limited.
myskillsprofile.com
3 EIQ16 User Manual
Contents 1.0 INTRODUCTION ................................................................................................. 5
1.1 EIQ16 Questionnaire .......................................................................................... 5
1.2 Concept Model ................................................................................................... 5
1.3 Versions ............................................................................................................. 6
1.4 Access ................................................................................................................ 6
1.5 Design Criteria .................................................................................................... 6
1.6 Development Overview ....................................................................................... 6
1.7 EI Models............................................................................................................ 7
1.8 EI Measures ....................................................................................................... 8
1.9 EIQ16 Emotional Intelligence Test .................................................................... 11
2.0 ADMINISTRATION ............................................................................................ 16 2.1 Administered by Professional ............................................................................ 16
2.2 Direct Access .................................................................................................... 16
2.3 Scoring and Norming ........................................................................................ 16
3.0 SCALE DESCRIPTIONS ................................................................................... 17 3.1 Scale Items ....................................................................................................... 17
3.2 Relationships with Other Scales ....................................................................... 17
3.3 Scale Contents ................................................................................................. 17
4.0 INTERPRETATION AND FEEDBACK REPORT .............................................. 35 4.1 Sten Scores ...................................................................................................... 35
4.2 Feedback Report .............................................................................................. 36
5.0 RELIABILITY AND VALIDITY .......................................................................... 37 5.1 Internal Consistency Reliabilities ...................................................................... 37
5.2 Correlations between Versions ......................................................................... 38
5.3 Scale Intercorrelations ...................................................................................... 39
5.4 Intercorrelations and Reliability ......................................................................... 39
myskillsprofile.com
4 EIQ16 User Manual
5.5 Standard Error of Difference ............................................................................. 39
5.6 Factor Analysis ................................................................................................. 43
5.7 Relationship to Other Measures ........................................................................ 44
5.8 Correlations with Job Performance ................................................................... 45
5.9 Demographics and EIQ16 scales ...................................................................... 49
5.10 Impression Management ................................................................................ 53
6.0 NORMS ............................................................................................................. 54
7.0 REFERENCES .................................................................................................. 61
myskillsprofile.com
5 EIQ16 User Manual
1.0 Introduction
This User Manual describes the administration, interpretation and technical properties of the
EIQ16. It is available as a soft copy download only from myskillsprofile.com.
1.1 EIQ16 Questionnaire
The EIQ16 emotional intelligence questionnaire is designed to provide information about a
person’s emotional intelligence. The purpose of the instrument is to help people understand
and develop emotional qualities, competencies and skills to improve their performance and
reach their potential.
1.2 Concept Model
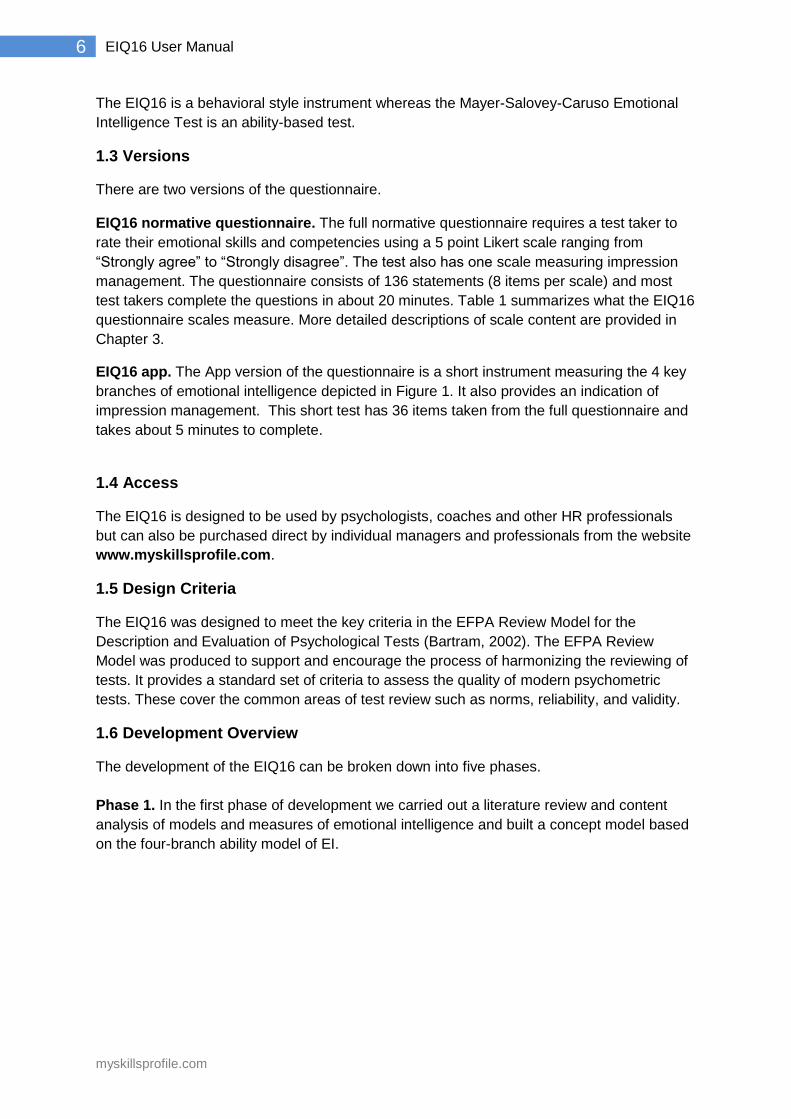
The EIQ16 questionnaire is based on the model of emotional intelligence developed by
Mayer, Salovey and Caruso (2002). This model of emotional intelligence has four key
branches which in the EIQ16 are named as follows: Reading People, Using Emotions,
Understanding Emotions, and Managing Emotions.
Figure 1. Mayer, Salovey and Caruso model of emotional intelligence
Reading people, according to Mayer at al, covers the ability to recognize emotions in oneself
and others as well as in objects, art, stories, music and other phenomena. Using emotions is
the ability to generate, use and feel emotion to communicate feelings and employ them in
thinking and decision making. Understanding emotions means being able to appreciate
emotional information and to realize how emotions combine and progress through
relationship transitions. Managing emotions describes the ability to be open to feelings and
to control them in oneself and others in order to advance personal understanding and
growth.
Reading People
Using Emotions
Understanding Emotions
Managing Emotions
myskillsprofile.com
6 EIQ16 User Manual
The EIQ16 is a behavioral style instrument whereas the Mayer-Salovey-Caruso Emotional
Intelligence Test is an ability-based test.
1.3 Versions
There are two versions of the questionnaire. EIQ16 normative questionnaire. The full normative questionnaire requires a test taker to
rate their emotional skills and competencies using a 5 point Likert scale ranging from
“Strongly agree” to “Strongly disagree”. The test also has one scale measuring impression
management. The questionnaire consists of 136 statements (8 items per scale) and most
test takers complete the questions in about 20 minutes. Table 1 summarizes what the EIQ16
questionnaire scales measure. More detailed descriptions of scale content are provided in
Chapter 3.
EIQ16 app. The App version of the questionnaire is a short instrument measuring the 4 key
branches of emotional intelligence depicted in Figure 1. It also provides an indication of
impression management. This short test has 36 items taken from the full questionnaire and
takes about 5 minutes to complete.
1.4 Access
The EIQ16 is designed to be used by psychologists, coaches and other HR professionals
but can also be purchased direct by individual managers and professionals from the website
www.myskillsprofile.com.
1.5 Design Criteria
The EIQ16 was designed to meet the key criteria in the EFPA Review Model for the
Description and Evaluation of Psychological Tests (Bartram, 2002). The EFPA Review
Model was produced to support and encourage the process of harmonizing the reviewing of
tests. It provides a standard set of criteria to assess the quality of modern psychometric
tests. These cover the common areas of test review such as norms, reliability, and validity.
1.6 Development Overview
The development of the EIQ16 can be broken down into five phases.
Phase 1. In the first phase of development we carried out a literature review and content
analysis of models and measures of emotional intelligence and built a concept model based
on the four-branch ability model of EI.
myskillsprofile.com
7 EIQ16 User Manual
Phase 2. In the beta phase, we created an inventory with emotional competency scales and
an impression management scale in the style of a behavioral style assessment test. We
piloted the inventory online, analyzed the reliability and validity, generated norms, and
produced a technical manual. The assessment was initially made available as a free test for
several months before the first commercial version was launched in 2006.
Phase 3. In the third phase of development, we collected more data, conducted further
analysis, and made incremental improvements to enhance the reliability of the scales and
improve the format and contents of the computer-generated feedback report. We updated
the user manual in the second half of 2011 in preparation for a test review. We submitted the
instrument to the British Psychological Society (BPS) for review in the first half of 2012 and
the review was published in July 2012.
Phase 4. In the fourth phase of development, we built a short 4 scale version of the
questionnaire which we published as a free app in 2013. The items for the app were
selected by carrying out a 4-factor forced extraction and selecting the items that loaded
highest on each factor. The free app can be downloaded from Google Play.
Phase 5. In the fifth phase of development following the BPS review, we decided to look
again at the factor structure of the instrument using a procedure researchers have utilized to
remove response acquiescence. With response acquiescence removed, we found stronger
evidence for a factor model more congruent with the original concept model. We revised the
user manual to reflect these findings and address other issues raised by the BPS review.
The revised manual was published in October 2014 and submitted to the Buros Center for
Testing for Review in 2015. The review is due to appear in The Twentieth Mental
Measurements Yearbook in 2017.
The rest of this chapter describes the development process and rationale for the design of
the assessment in more detail.
1.7 EI Models
There are three distinct models/frameworks in the field of emotional intelligence (Cherniss,
2010): an ability model, a competency model, and a personality trait model.
Ability model. Mayer and Salovey are the leading exponents of the ability model. In their
1990 article, Mayer and Salovey define EI as “a subset of social intelligence that involves the
ability to monitor one’s own and others feelings and emotions, to discriminate among them
and to use this information to guide one’s thinking and actions”. Further work and reviews of
the literature led the authors to divide EI skills and abilities into four areas covering the ability
to (a) perceive emotion, (b) use emotion to facilitate thought, (c) understand emotions, and
(d) manage emotions. Mayer, Salovey, and Caruso (2004) state that EI is a member of a
class of “hot” intelligences dealing with personal and emotional cognitive processes.
The Mayer-Salovey-Caruso Emotional Intelligence Test (MSCEIT) has eight scales with two
measuring each of the four branches of EI. The Perceiving Emotions’ scales ask test takers
to identify (a) emotions in faces, and (b) the emotions conveyed by landscapes and designs.
The Using Emotions’ scales ask test takers to (a) compare emotions to other tactile and
myskillsprofile.com
8 EIQ16 User Manual
sensory stimuli, and (b) identify the emotions that facilitate different types of thinking. The
Understanding Emotions’ scales test a person’s understanding of (a) how emotions change
in intensity and type and (b) how emotions can blend into complex emotional states. The
Managing Emotions’ scales ask test takers how they would manage (a) their own feelings
and emotions, and (b) other people’s feelings and emotions in different scenarios.
Competency model. Daniel Goleman has been a leading exponent of the competency
model and he has been largely responsible for popularizing the concept of EI in the
workplace. Goleman’s 1998 Harvard Business Review article entitled “What makes a
leader?” applied the construct to business leadership. In his article, Goleman argued that
intelligence, toughness, determination, and vision were not enough to be successful. In order
to succeed in business, you also needed to possess a high degree of EI. Goleman identified
five groups of EI competencies: self-awareness, self-regulation, motivation, empathy, and
social skill. Goleman’s Emotional Competence Framework published by the Consortium for
Research on Emotional Intelligence defines these competencies and their elements.
Personality/trait model. The personality or trait model of emotional intelligence has been
led by Petrides and Furnham at the London Psychometric Laboratory. Using content
analysis, Petrides and Furnham (2001) identified 15 facets of personality relevant to EI
which formed the basis of their Trait Emotional Intelligence Questionnaire (TEIQue). Factor
analysis of the instrument indicates that trait EI covers 4 areas which in the TEIQue are
labeled as Well-Being, Self-Control, Emotionality, and Sociability. The TEIQue total score
correlates strongly with three of the Big Five personality factors (Conscientiousness,
Extraversion, and Emotional Stability) and with the General Factor of Personality (GFP).
According to Petrides et al (2007), trait EI (also defined as trait emotional self-efficacy)
“refers to a constellation of emotional self-perceptions located at the lower levels of
personality hierarchies”.
1.8 EI Measures
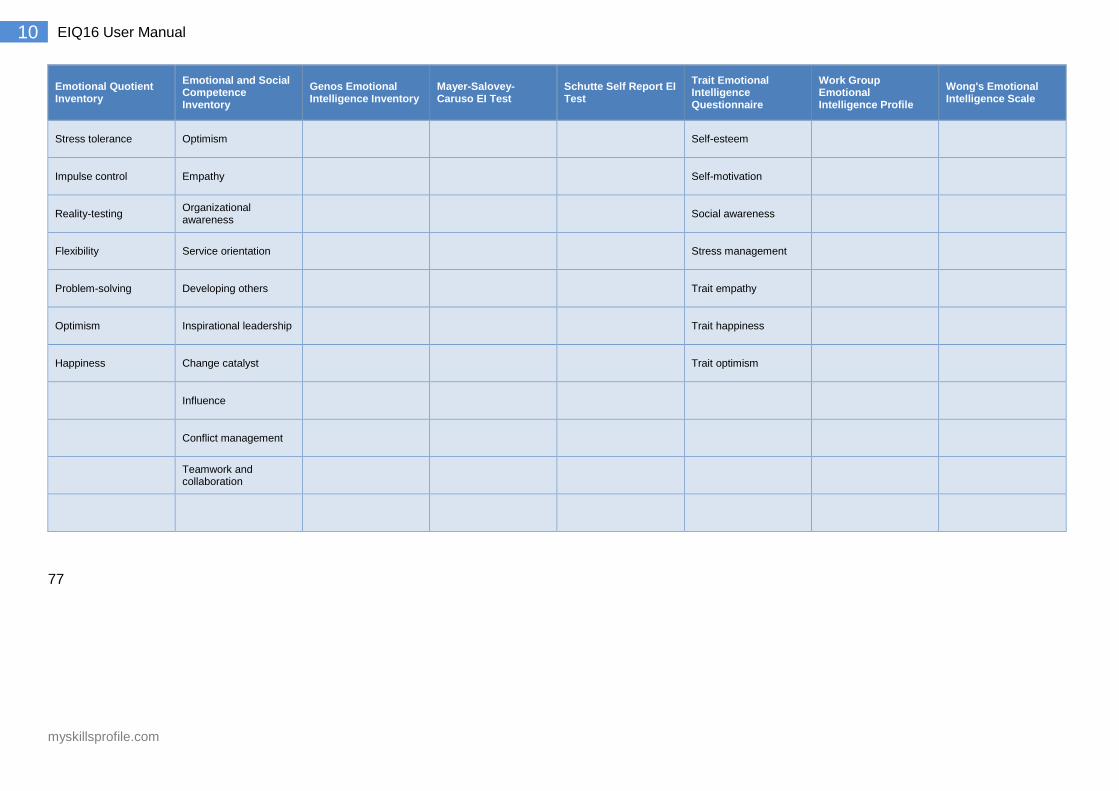
Table 1 provides a summary of eight measures of emotional intelligence that have been
reviewed by the Consortium for Research on Emotional Intelligence in Organizations and for
which there is “a substantial body of research” (defined as at least five published journal
articles or book chapters that provide empirical data based on the test).
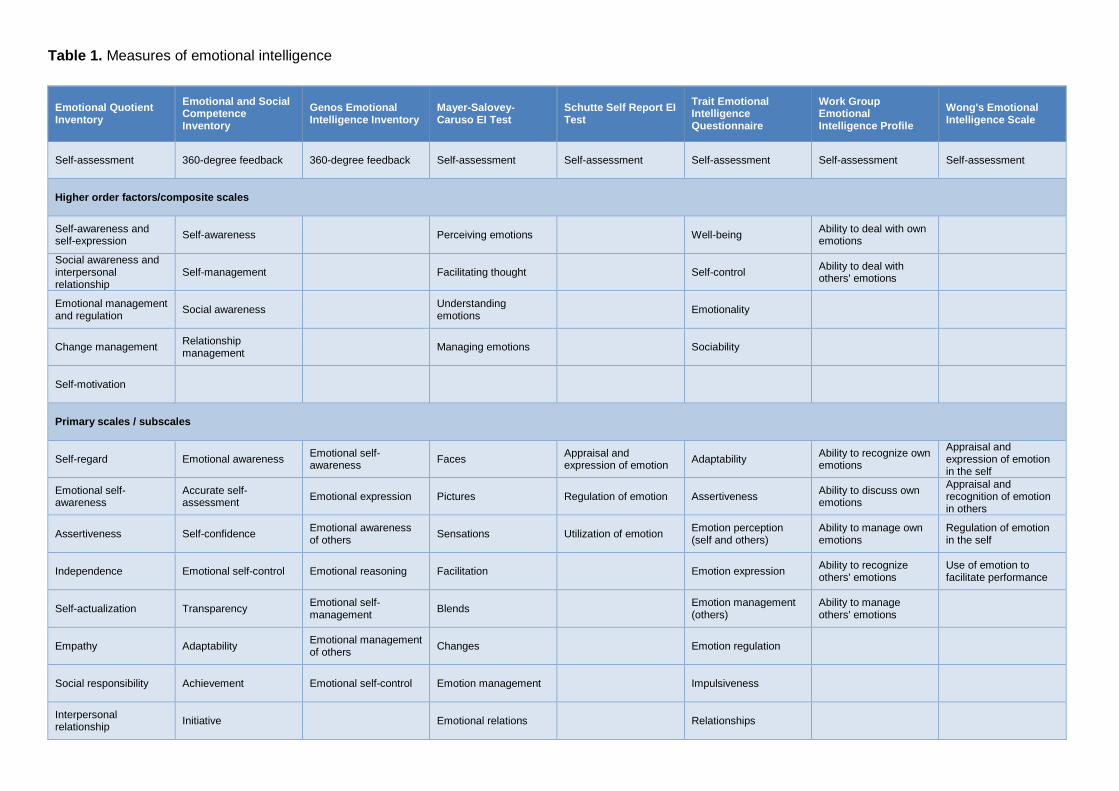
Table 1. Measures of emotional intelligence
Emotional Quotient Inventory
Emotional and Social Competence Inventory
Genos Emotional Intelligence Inventory
Mayer-Salovey-Caruso EI Test
Schutte Self Report EI Test
Trait Emotional Intelligence Questionnaire
Work Group Emotional Intelligence Profile
Wong's Emotional Intelligence Scale
Self-assessment 360-degree feedback 360-degree feedback Self-assessment Self-assessment Self-assessment Self-assessment Self-assessment
Higher order factors/composite scales
Self-awareness and self-expression
Self-awareness Perceiving emotions Well-being Ability to deal with own emotions
Social awareness and interpersonal relationship
Self-management Facilitating thought Self-control Ability to deal with others' emotions
Emotional management and regulation
Social awareness Understanding emotions
Emotionality
Change management Relationship management
Managing emotions Sociability
Self-motivation
Primary scales / subscales
Self-regard Emotional awareness Emotional self-awareness
Faces Appraisal and expression of emotion
Adaptability Ability to recognize own emotions
Appraisal and expression of emotion in the self
Emotional self-awareness
Accurate self-assessment
Emotional expression Pictures Regulation of emotion Assertiveness Ability to discuss own emotions
Appraisal and recognition of emotion in others
Assertiveness Self-confidence Emotional awareness of others
Sensations Utilization of emotion Emotion perception (self and others)
Ability to manage own emotions
Regulation of emotion in the self
Independence Emotional self-control Emotional reasoning Facilitation Emotion expression Ability to recognize others' emotions
Use of emotion to facilitate performance
Self-actualization Transparency Emotional self-management
Blends Emotion management (others)
Ability to manage others' emotions
Empathy Adaptability Emotional management of others
Changes Emotion regulation
Social responsibility Achievement Emotional self-control Emotion management Impulsiveness
Interpersonal relationship
Initiative Emotional relations Relationships
myskillsprofile.com
10 EIQ16 User Manual
Emotional Quotient Inventory
Emotional and Social Competence Inventory
Genos Emotional Intelligence Inventory
Mayer-Salovey-Caruso EI Test
Schutte Self Report EI Test
Trait Emotional Intelligence Questionnaire
Work Group Emotional Intelligence Profile
Wong's Emotional Intelligence Scale
Stress tolerance Optimism Self-esteem
Impulse control Empathy Self-motivation
Reality-testing Organizational awareness
Social awareness
Flexibility Service orientation Stress management
Problem-solving Developing others Trait empathy
Optimism Inspirational leadership Trait happiness
Happiness Change catalyst Trait optimism
Influence
Conflict management
Teamwork and collaboration
77
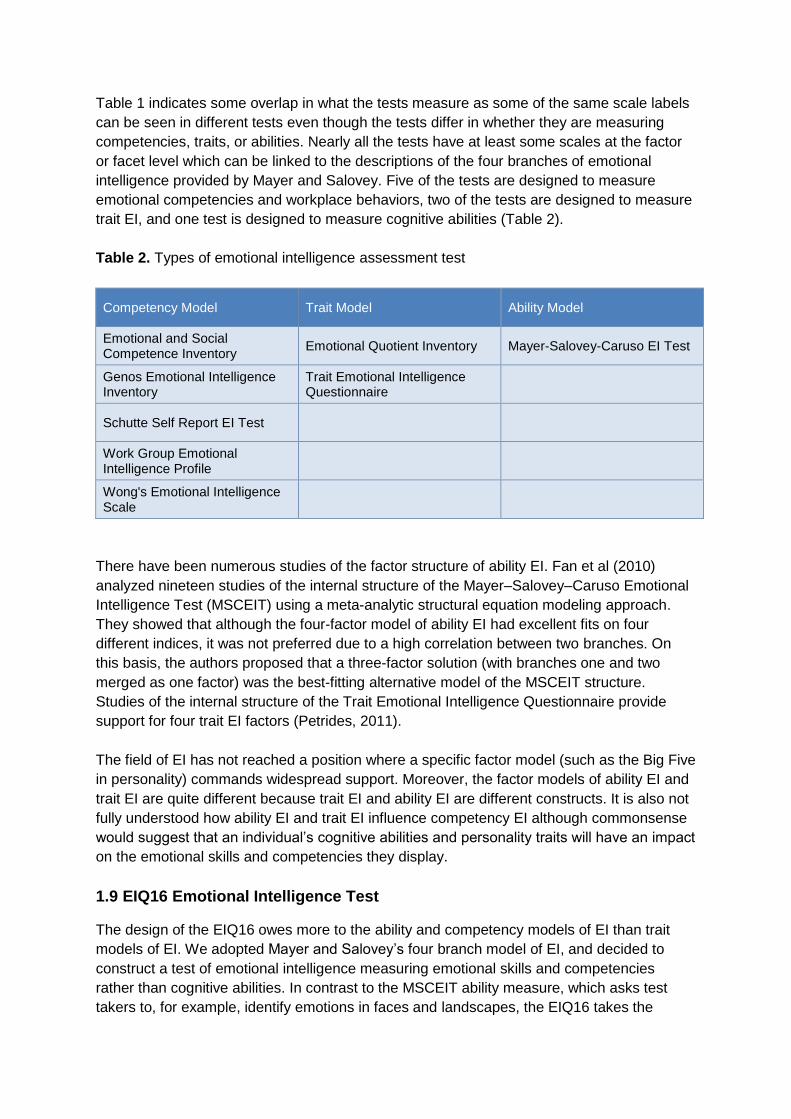
Table 1 indicates some overlap in what the tests measure as some of the same scale labels
can be seen in different tests even though the tests differ in whether they are measuring
competencies, traits, or abilities. Nearly all the tests have at least some scales at the factor
or facet level which can be linked to the descriptions of the four branches of emotional
intelligence provided by Mayer and Salovey. Five of the tests are designed to measure
emotional competencies and workplace behaviors, two of the tests are designed to measure
trait EI, and one test is designed to measure cognitive abilities (Table 2).
Table 2. Types of emotional intelligence assessment test
Competency Model Trait Model Ability Model
Emotional and Social Competence Inventory
Emotional Quotient Inventory Mayer-Salovey-Caruso EI Test
Genos Emotional Intelligence Inventory
Trait Emotional Intelligence Questionnaire
Schutte Self Report EI Test
Work Group Emotional Intelligence Profile
Wong's Emotional Intelligence Scale
There have been numerous studies of the factor structure of ability EI. Fan et al (2010)
analyzed nineteen studies of the internal structure of the Mayer–Salovey–Caruso Emotional
Intelligence Test (MSCEIT) using a meta-analytic structural equation modeling approach.
They showed that although the four-factor model of ability EI had excellent fits on four
different indices, it was not preferred due to a high correlation between two branches. On
this basis, the authors proposed that a three-factor solution (with branches one and two
merged as one factor) was the best-fitting alternative model of the MSCEIT structure.
Studies of the internal structure of the Trait Emotional Intelligence Questionnaire provide
support for four trait EI factors (Petrides, 2011).
The field of EI has not reached a position where a specific factor model (such as the Big Five
in personality) commands widespread support. Moreover, the factor models of ability EI and
trait EI are quite different because trait EI and ability EI are different constructs. It is also not
fully understood how ability EI and trait EI influence competency EI although commonsense
would suggest that an individual’s cognitive abilities and personality traits will have an impact
on the emotional skills and competencies they display.
1.9 EIQ16 Emotional Intelligence Test
The design of the EIQ16 owes more to the ability and competency models of EI than trait
models of EI. We adopted Mayer and Salovey’s four branch model of EI, and decided to
construct a test of emotional intelligence measuring emotional skills and competencies
rather than cognitive abilities. In contrast to the MSCEIT ability measure, which asks test
takers to, for example, identify emotions in faces and landscapes, the EIQ16 takes the
myskillsprofile.com
12 EIQ16 User Manual
approach of a behavioral style assessment test, and asks test takers how far they agree with
a series of statements about their emotional skills and competencies.
We embraced Mayer and Salovey’s framework because we wanted our measure to focus on
emotional skills and abilities and not stray into the assessment of broader management and
leadership competencies that are included in, for example, the Emotional and Social
Competence Inventory and the Emotional Competence Framework. We also envisioned that
the primary application of the instrument would be in development applications, and we
wanted to create a relatively short measure that participants would take as part of executive
learning programs. This led us to utilize the format of a behavioral style self-assessment test
(rather than an ability test or a 360-degree feedback survey).
The EIQ16 concept model (Figure 2) has sixteen emotional competencies covering the four
branches of emotional intelligence identified by Mayer and Salovey (four clusters of four
emotional competencies). These facets of emotional competence were identified by
analyzing the contents of existing models and measures, and the rationale for positioning
particular facets under particular branches is based in the main on content analysis of
theories and conceptual models of EI in the literature rather than empirical evidence.
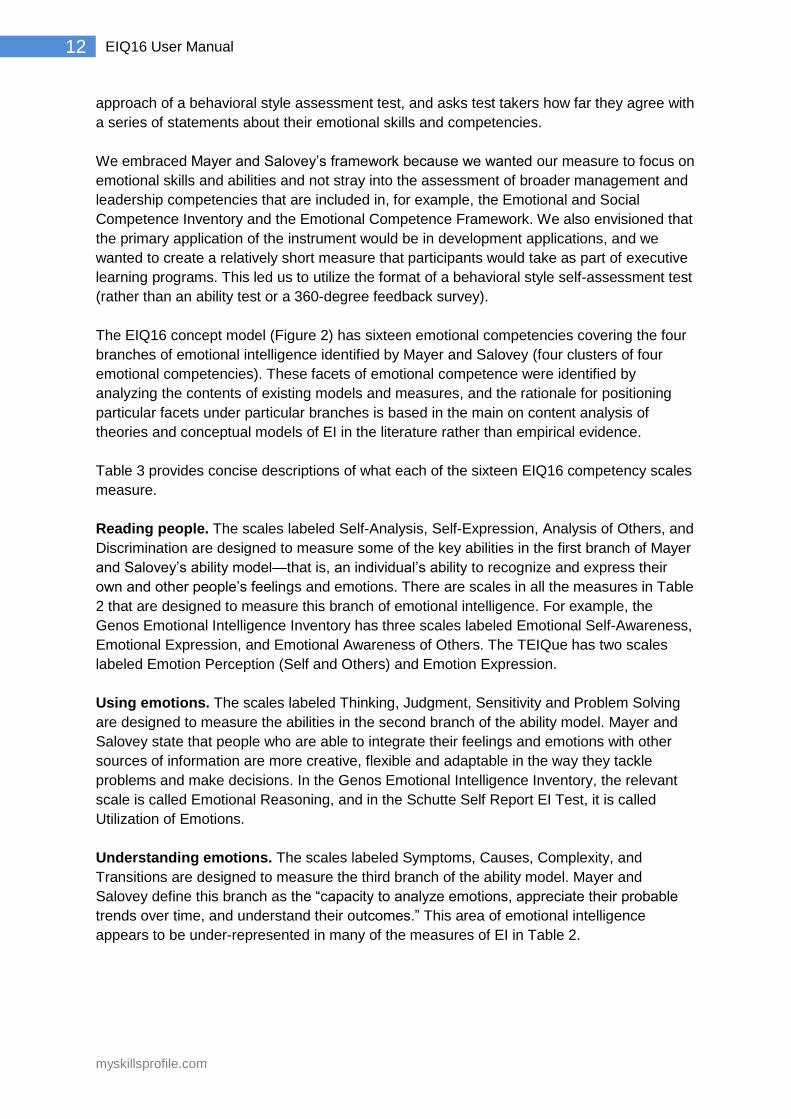
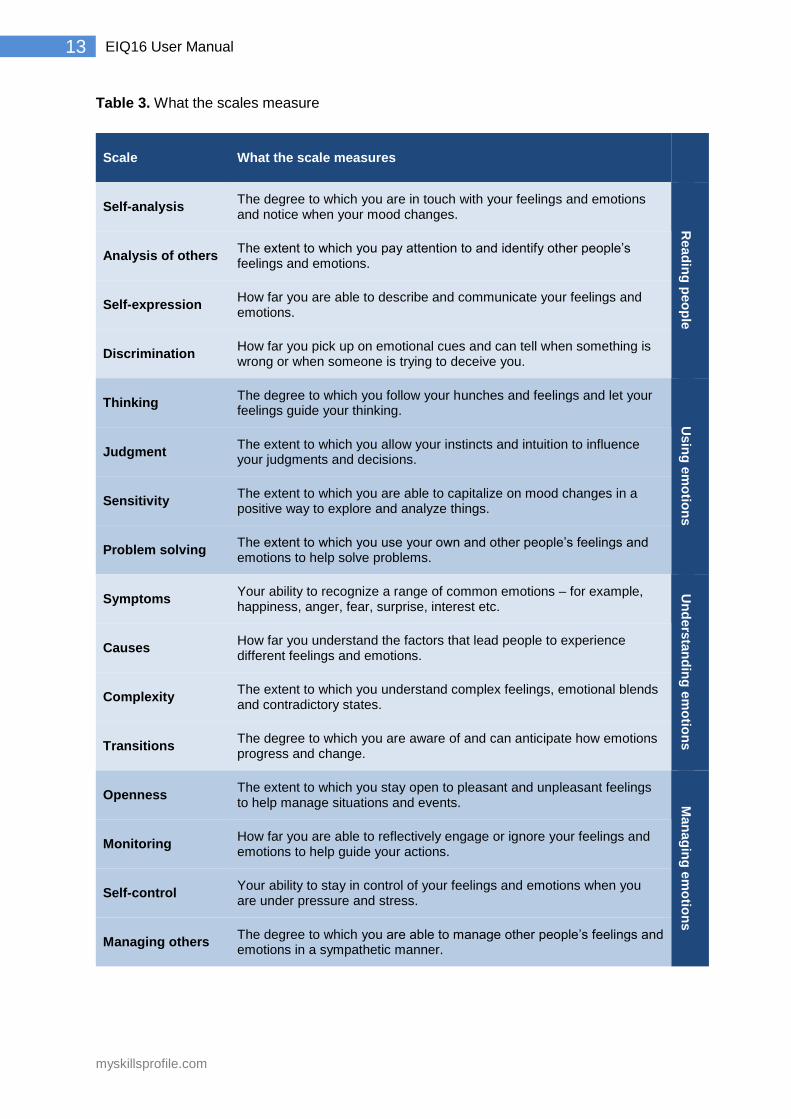
Table 3 provides concise descriptions of what each of the sixteen EIQ16 competency scales
measure.
Reading people. The scales labeled Self-Analysis, Self-Expression, Analysis of Others, and
Discrimination are designed to measure some of the key abilities in the first branch of Mayer
and Salovey’s ability model—that is, an individual’s ability to recognize and express their
own and other people’s feelings and emotions. There are scales in all the measures in Table
2 that are designed to measure this branch of emotional intelligence. For example, the
Genos Emotional Intelligence Inventory has three scales labeled Emotional Self-Awareness,
Emotional Expression, and Emotional Awareness of Others. The TEIQue has two scales
labeled Emotion Perception (Self and Others) and Emotion Expression.
Using emotions. The scales labeled Thinking, Judgment, Sensitivity and Problem Solving
are designed to measure the abilities in the second branch of the ability model. Mayer and
Salovey state that people who are able to integrate their feelings and emotions with other
sources of information are more creative, flexible and adaptable in the way they tackle
problems and make decisions. In the Genos Emotional Intelligence Inventory, the relevant
scale is called Emotional Reasoning, and in the Schutte Self Report EI Test, it is called
Utilization of Emotions.
Understanding emotions. The scales labeled Symptoms, Causes, Complexity, and
Transitions are designed to measure the third branch of the ability model. Mayer and
Salovey define this branch as the “capacity to analyze emotions, appreciate their probable
trends over time, and understand their outcomes.” This area of emotional intelligence
appears to be under-represented in many of the measures of EI in Table 2.
myskillsprofile.com
13 EIQ16 User Manual
Table 3. What the scales measure
Scale What the scale measures
Self-analysis The degree to which you are in touch with your feelings and emotions and notice when your mood changes.
Read
ing
peo
ple
Analysis of others The extent to which you pay attention to and identify other people’s feelings and emotions.
Self-expression How far you are able to describe and communicate your feelings and emotions.
Discrimination How far you pick up on emotional cues and can tell when something is wrong or when someone is trying to deceive you.
Thinking The degree to which you follow your hunches and feelings and let your feelings guide your thinking.
Usin
g e
mo
tion
s
Judgment The extent to which you allow your instincts and intuition to influence your judgments and decisions.
Sensitivity The extent to which you are able to capitalize on mood changes in a positive way to explore and analyze things.
Problem solving The extent to which you use your own and other people’s feelings and emotions to help solve problems.
Symptoms Your ability to recognize a range of common emotions – for example, happiness, anger, fear, surprise, interest etc.
Un
ders
tan
din
g e
mo
tion
s
Causes How far you understand the factors that lead people to experience different feelings and emotions.
Complexity The extent to which you understand complex feelings, emotional blends and contradictory states.
Transitions The degree to which you are aware of and can anticipate how emotions progress and change.
Openness The extent to which you stay open to pleasant and unpleasant feelings to help manage situations and events. M
an
ag
ing
em
otio
ns
Monitoring How far you are able to reflectively engage or ignore your feelings and emotions to help guide your actions.
Self-control Your ability to stay in control of your feelings and emotions when you are under pressure and stress.
Managing others The degree to which you are able to manage other people’s feelings and emotions in a sympathetic manner.
myskillsprofile.com
14 EIQ16 User Manual
Managing emotions. The scales labeled Openness, Monitoring, Self-Control, and
Managing Others are designed to measure some of the key skills in the fourth branch of the
ability model. Mayer and Salovey state that emotionally intelligent individuals are adept at
regulating emotion in themselves and others. They are able to enhance their own and other
people’s moods in order to help achieve particular outcomes—for example, motivating team
members to achieve team goals. This area of EI features strongly in the eight EI measures in
Table 1.
Impression management. In addition to the competency scales, the EIQ16 has an
impression management scale to throw light on response bias, a common issue with
normative assessments. The core items for the IM scale were drawn from the International
Personality Item Pool (Goldberg, 1997).
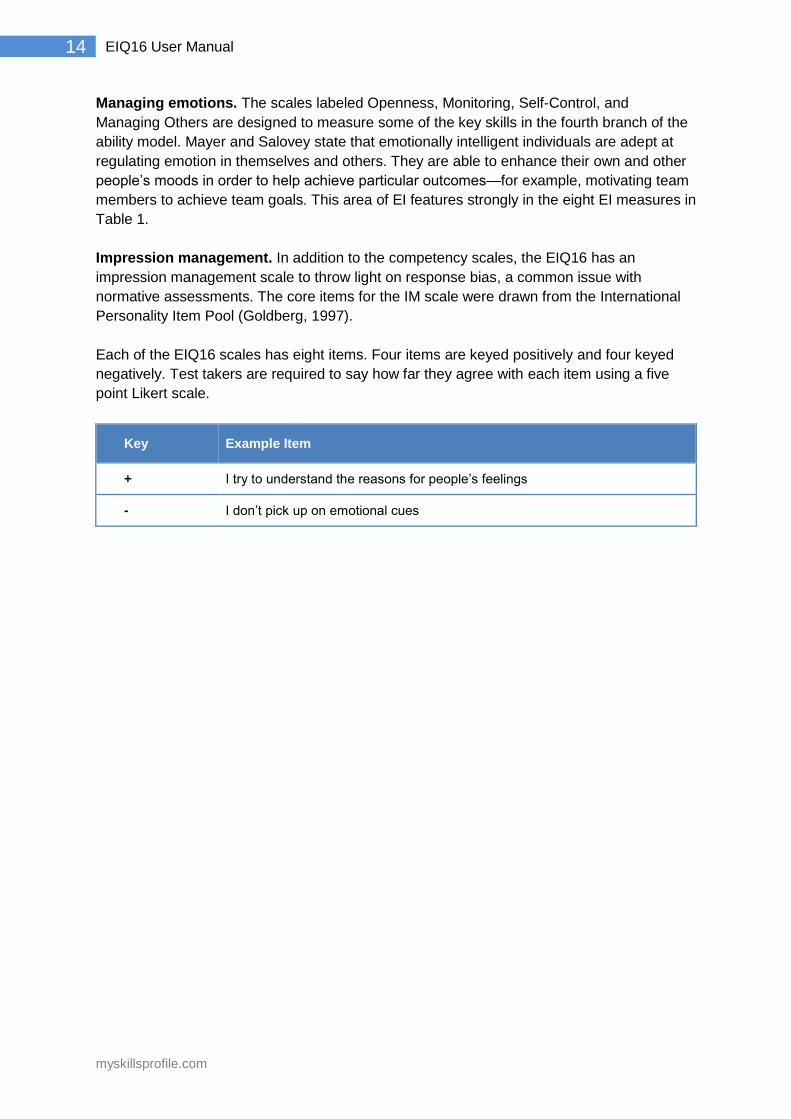
Each of the EIQ16 scales has eight items. Four items are keyed positively and four keyed
negatively. Test takers are required to say how far they agree with each item using a five
point Likert scale.
Key Example Item
+ I try to understand the reasons for people’s feelings
- I don’t pick up on emotional cues
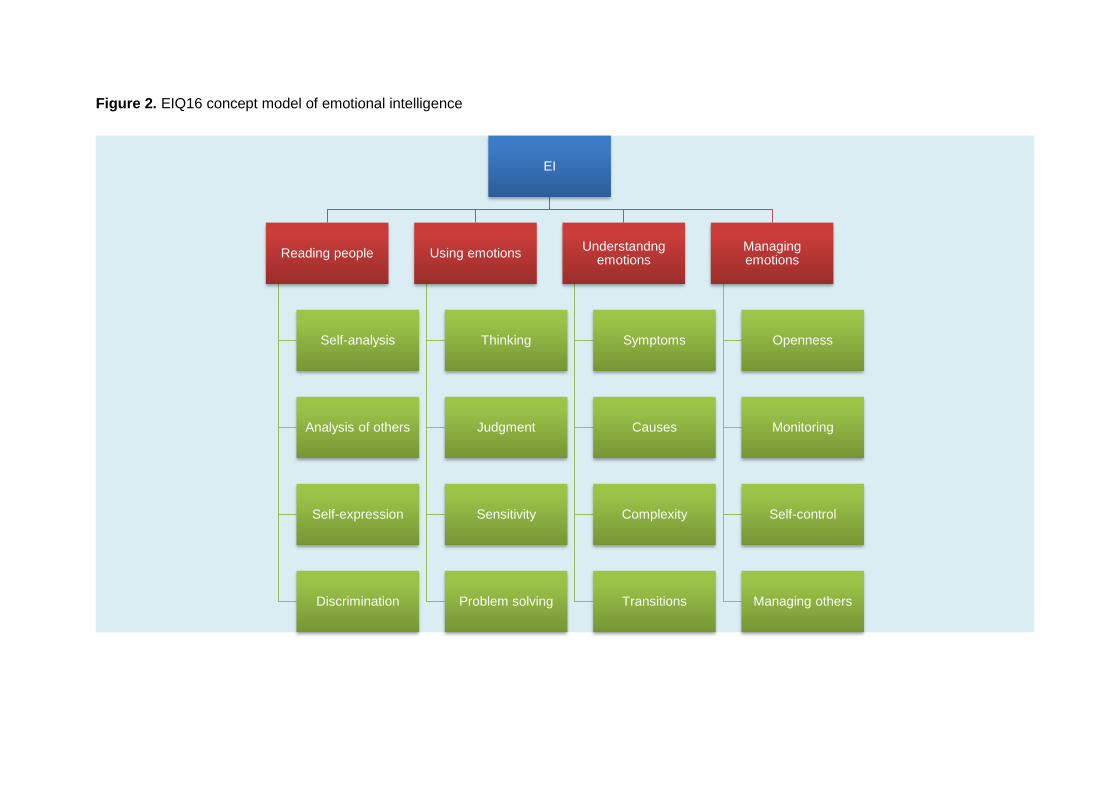
Figure 2. EIQ16 concept model of emotional intelligence
EI
Reading people
Self-analysis
Analysis of others
Self-expression
Discrimination
Using emotions
Thinking
Judgment
Sensitivity
Problem solving
Understandng emotions
Symptoms
Causes
Complexity
Transitions
Managing emotions
Openness
Monitoring
Self-control
Managing others
2.0 Administration
The EIQ16 is administered online via the Internet. There are two ways that persons can be
tested.
2.1 Administered by Professional
Where the test is being administered to a group of people by a psychologist or coach, the
test taker receives an email from the test administrator containing a hyperlink which takes
the test taker to a testing screen with instructions on how to complete the test. The test taker
then goes through a series of screens with the questions and completes a personal details
form.
Once the assessment test has been completed, the client may view or download the
computer-generated feedback report if the online testing service has been set up to provide
feedback reports to test takers. The online testing system can be set up by a test
administrator to have feedback reports emailed to the test administrator, or to the test taker,
or to the test taker and to the test administrator.
2.2 Direct Access
Individuals can also purchase the EIQ16 assessment test direct from myskillsprofile.com.
In this instance, the test taker is presented with instructions about how to complete the test,
does the test and then completes a personal details form. The individual then pays for the
assessment by credit card and once the transaction has been processed, the test taker can
view and download the feedback report in PDF format. Test takers can also request a copy
of their feedback report to be emailed to them.
2.3 Scoring and Norming
The scoring and generation of feedback reports are done online. A person’s EIQ16 raw
scores are compared to a very large international comparison group of people who have
answered the questionnaire. Details of this norm group are given in Chapter 6.
myskillsprofile.com
17 EIQ16 User Manual
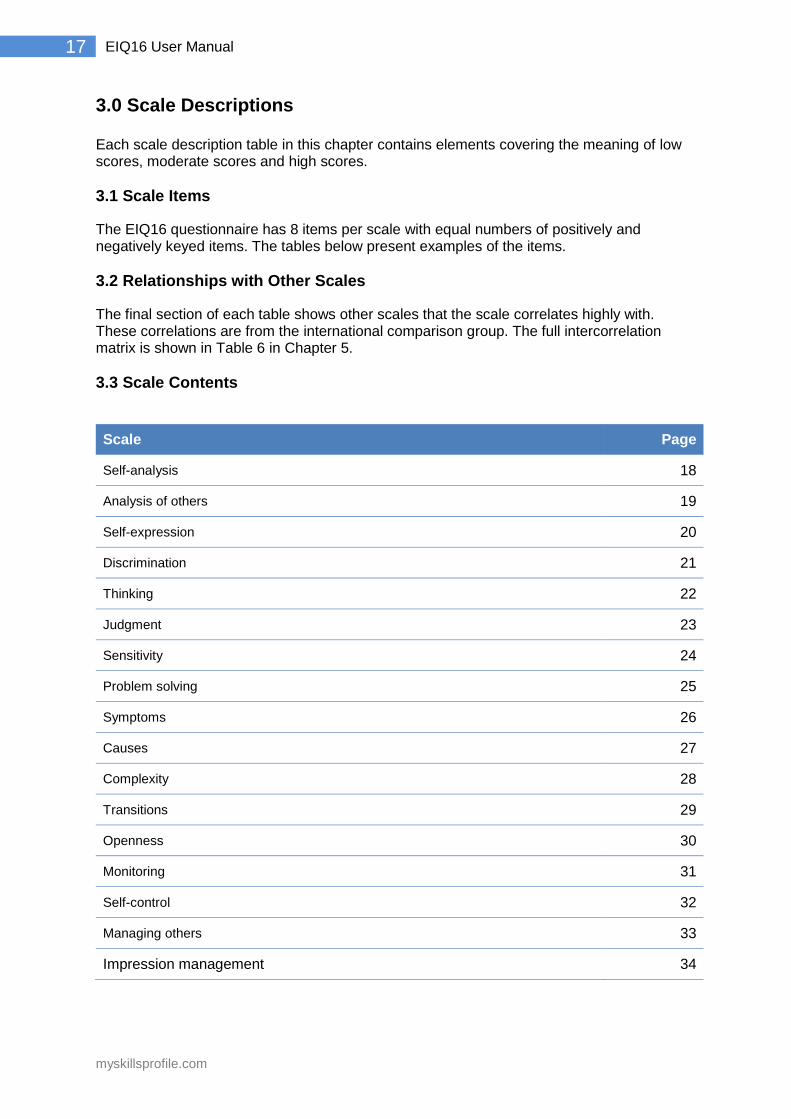
3.0 Scale Descriptions Each scale description table in this chapter contains elements covering the meaning of low scores, moderate scores and high scores.
3.1 Scale Items
The EIQ16 questionnaire has 8 items per scale with equal numbers of positively and negatively keyed items. The tables below present examples of the items.
3.2 Relationships with Other Scales
The final section of each table shows other scales that the scale correlates highly with. These correlations are from the international comparison group. The full intercorrelation matrix is shown in Table 6 in Chapter 5.
3.3 Scale Contents
Scale Page
Self-analysis 18
Analysis of others 19
Self-expression 20
Discrimination 21
Thinking 22
Judgment 23
Sensitivity 24
Problem solving 25
Symptoms 26
Causes 27
Complexity 28
Transitions 29
Openness 30
Monitoring 31
Self-control 32
Managing others 33
Impression management 34
myskillsprofile.com
18 EIQ16 User Manual
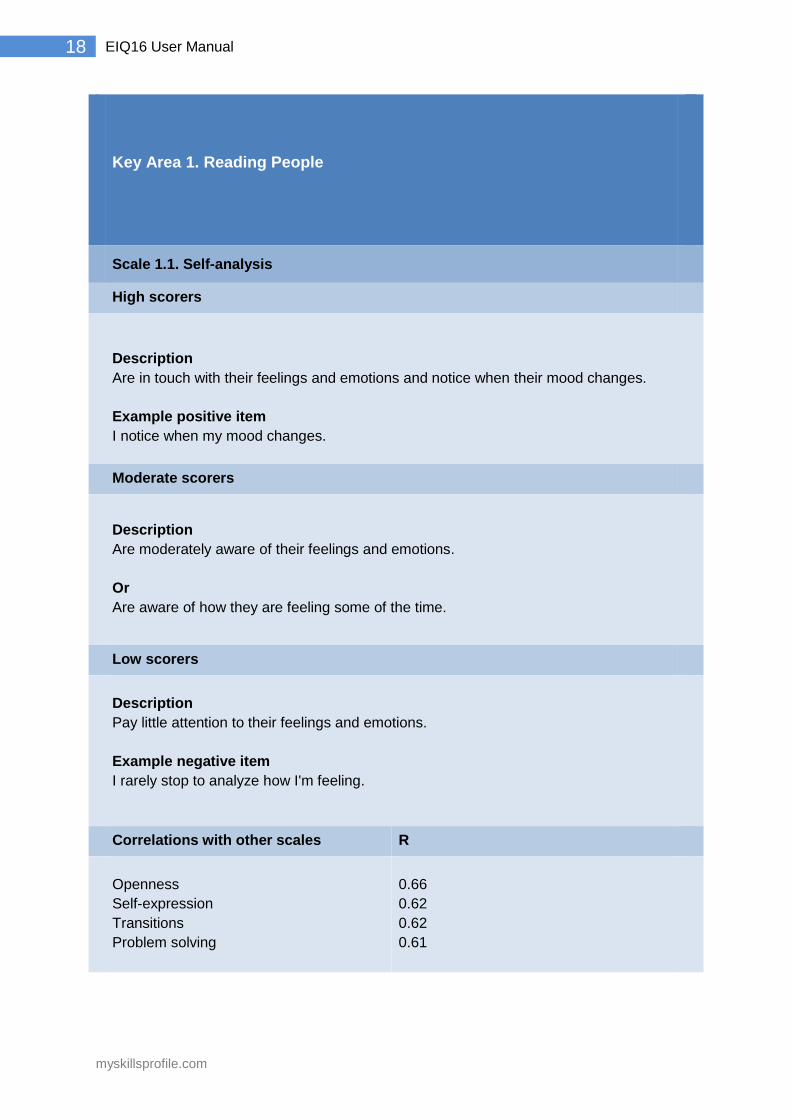
Key Area 1. Reading People
Scale 1.1. Self-analysis
High scorers
Description
Are in touch with their feelings and emotions and notice when their mood changes.
Example positive item
I notice when my mood changes.
Moderate scorers
Description
Are moderately aware of their feelings and emotions.
Or
Are aware of how they are feeling some of the time.
Low scorers
Description
Pay little attention to their feelings and emotions.
Example negative item
I rarely stop to analyze how I'm feeling.
Correlations with other scales R
Openness
Self-expression
Transitions
Problem solving
0.66
0.62
0.62
0.61

myskillsprofile.com
19 EIQ16 User Manual
Key Area 1. Reading People
Scale 1.2. Analysis of others
High scorers
Description
Pay close attention to and identify other people’s feelings and emotions.
Example positive item
I am good at sensing what others are feeling.
Moderate scorers
Description
Pay some attention to other people’s feelings and emotions.
Or
Pay attention to and identify other people’s feelings and emotions in some situations
but not others.
Low scorers
Description
Pay very little attention to and do not tend to identify other people’s feelings and
emotions.
Example negative item
I am indifferent to the feelings of others.
Correlations with other scales R
Openness
Transitions
Complexity
Managing others
0.65
0.64
0.64
0.63
myskillsprofile.com
20 EIQ16 User Manual
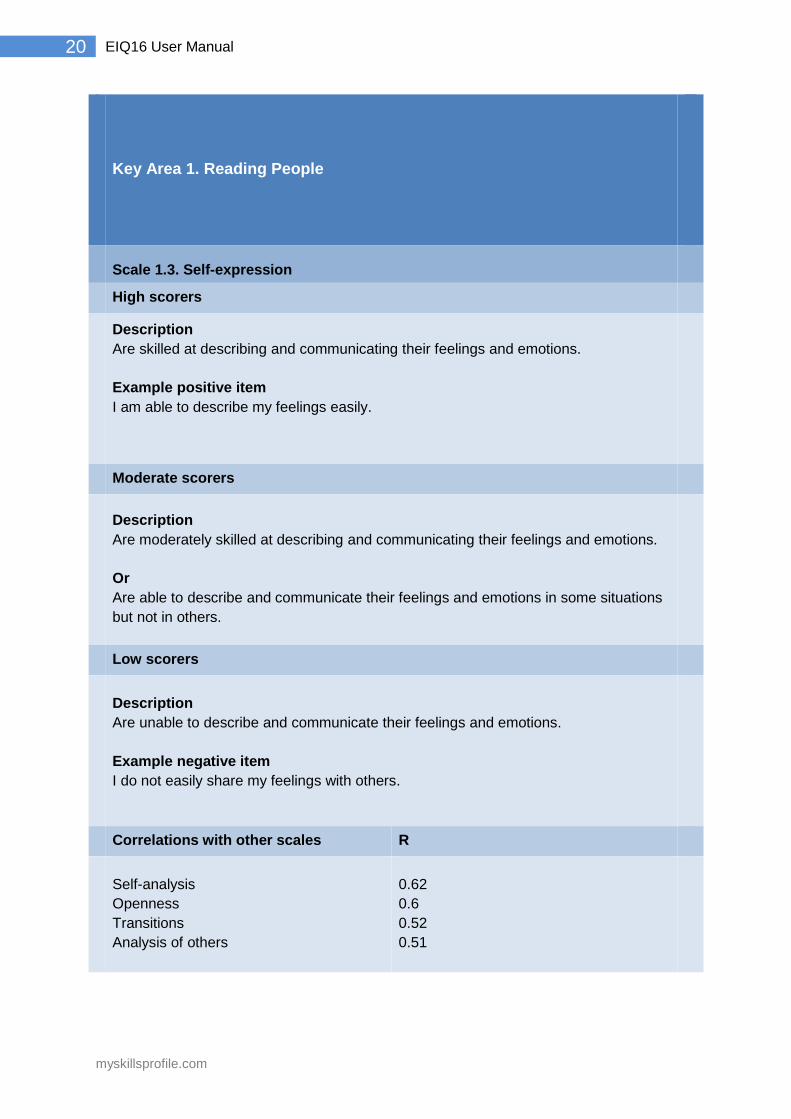
Key Area 1. Reading People
Scale 1.3. Self-expression
High scorers
Description
Are skilled at describing and communicating their feelings and emotions.
Example positive item
I am able to describe my feelings easily.
Moderate scorers
Description
Are moderately skilled at describing and communicating their feelings and emotions.
Or
Are able to describe and communicate their feelings and emotions in some situations
but not in others.
Low scorers
Description
Are unable to describe and communicate their feelings and emotions.
Example negative item
I do not easily share my feelings with others.
Correlations with other scales R
Self-analysis
Openness
Transitions
Analysis of others
0.62
0.6
0.52
0.51
myskillsprofile.com
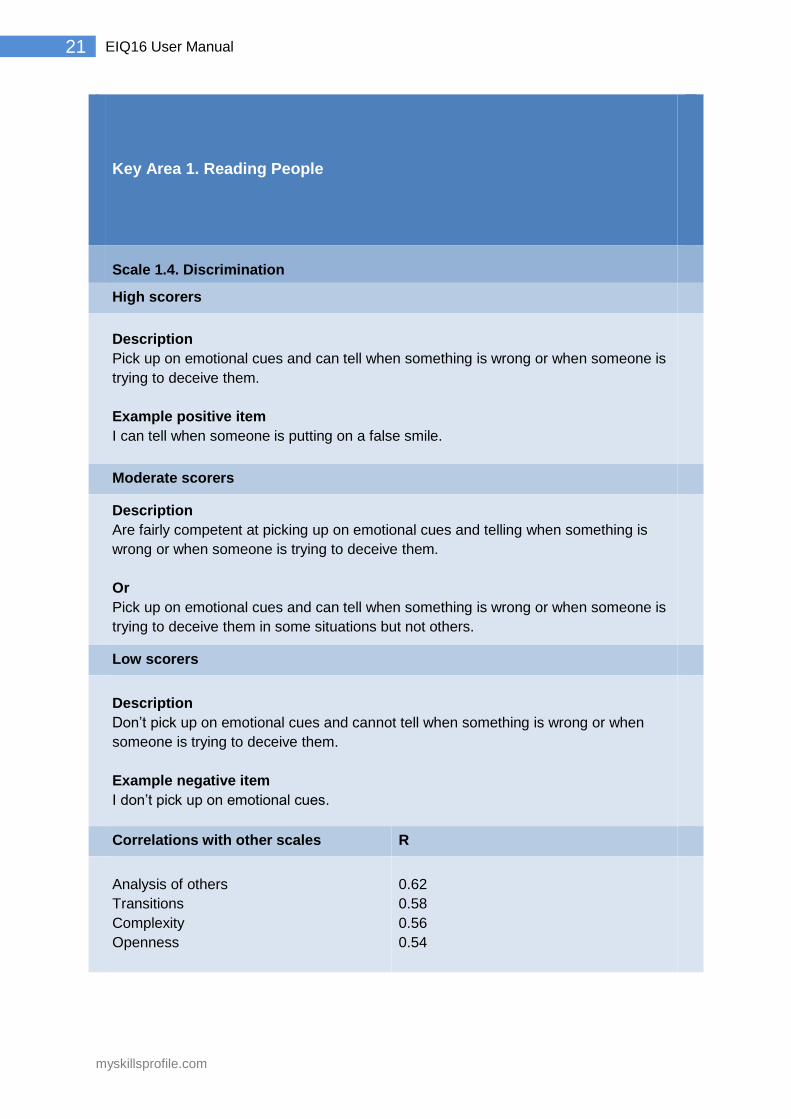
21 EIQ16 User Manual
Key Area 1. Reading People
Scale 1.4. Discrimination
High scorers
Description
Pick up on emotional cues and can tell when something is wrong or when someone is
trying to deceive them.
Example positive item
I can tell when someone is putting on a false smile.
Moderate scorers
Description
Are fairly competent at picking up on emotional cues and telling when something is
wrong or when someone is trying to deceive them.
Or
Pick up on emotional cues and can tell when something is wrong or when someone is
trying to deceive them in some situations but not others.
Low scorers
Description
Don’t pick up on emotional cues and cannot tell when something is wrong or when
someone is trying to deceive them.
Example negative item
I don’t pick up on emotional cues.
Correlations with other scales R
Analysis of others
Transitions
Complexity
Openness
0.62
0.58
0.56
0.54

myskillsprofile.com
22 EIQ16 User Manual
Key Area 2. Using Emotions
Scale 2.1. Thinking
High scorers
Description
Follow their hunches and feelings and let their feelings guide their thinking.
Example positive item
My feelings help me focus on what’s important.
Moderate scorers
Description
Follow their hunches and feelings and let their feelings guide their thinking to a
moderate degree.
Or
Follow their hunches and feelings and let their feelings guide their thinking in some
situations but not in others.
Low scorers
Description
Use data and information rather hunches and feelings to guide their thinking.
Example negative item
I prefer to deal with information rather than emotions.
Correlations with other scales R
Judgment
Problem solving
Sensitivity
Self-analysis
0.69
0.59
0.44
0.43

myskillsprofile.com
23 EIQ16 User Manual
Key Area 2. Using Emotions
Scale 2.2. Judgment
High scorers
Description
Allow their instincts and intuition to influence their judgments and decisions.
Example positive item
I follow my instincts when I have an important decision to take.
Moderate scorers
Description
Allow instincts and intuition to influence their judgments and decisions to a moderate
extent.
Or
Allow their instincts and intuition to influence their judgments and decisions in some
situations but not others.
Low scorers
Description
Do not allow their instincts and intuition to influence their judgments and decisions.
Example negative item
I try not to let emotions sway my judgment.
Correlations with other scales R
Thinking
Problem solving
Sensitivity
Self-analysis
0.69
0.58
0.41
0.38

myskillsprofile.com
24 EIQ16 User Manual
Key Area 2. Using Emotions
Scale 2.3. Sensitivity
High scorers
Description
Are able to capitalize on mood changes in a positive way to explore and analyze
issues and problems.
Example positive item
I use mood changes to help see a problem from different points of view.
Moderate scorers
Description
Possess some ability to capitalize on mood changes in a positive way to explore and
analyze issues.
Or
Use mood changes in a positive way to explore and analyze issues in some situations
but not others.
Low scorers
Description
Are unable to capitalize on mood changes in a positive way to explore and analyze
issues and problems.
Example negative item
I am always in the same mood.
Correlations with other scales R
Thinking
Judgment
Problem solving
Self-analysis
0.44
0.41
0.37
0.23
myskillsprofile.com
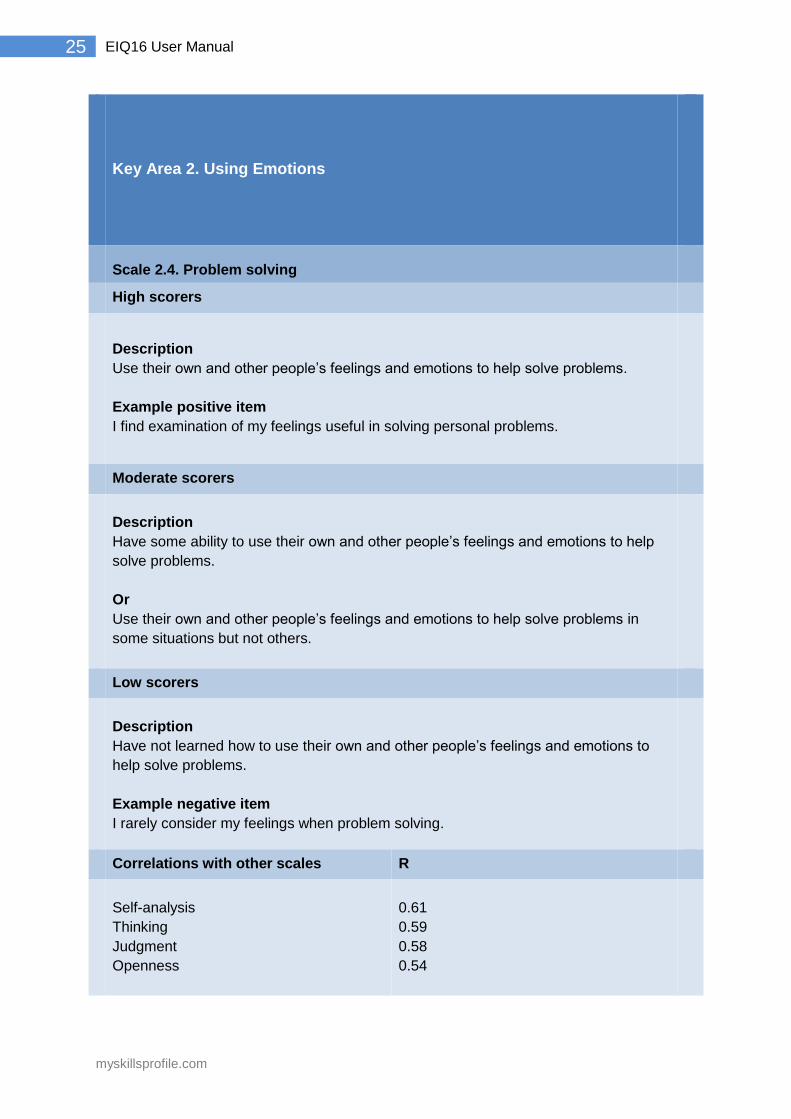
25 EIQ16 User Manual
Key Area 2. Using Emotions
Scale 2.4. Problem solving
High scorers
Description
Use their own and other people’s feelings and emotions to help solve problems.
Example positive item
I find examination of my feelings useful in solving personal problems.
Moderate scorers
Description
Have some ability to use their own and other people’s feelings and emotions to help
solve problems.
Or
Use their own and other people’s feelings and emotions to help solve problems in
some situations but not others.
Low scorers
Description
Have not learned how to use their own and other people’s feelings and emotions to
help solve problems.
Example negative item
I rarely consider my feelings when problem solving.
Correlations with other scales R
Self-analysis
Thinking
Judgment
Openness
0.61
0.59
0.58
0.54
myskillsprofile.com
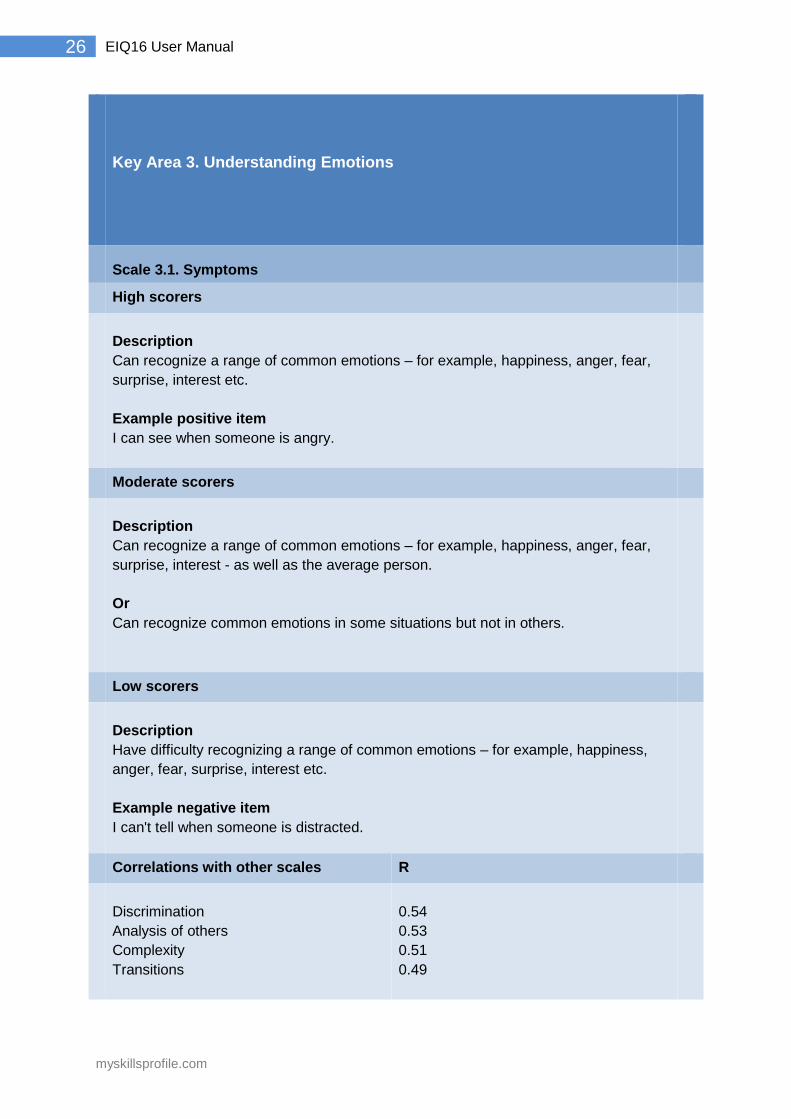
26 EIQ16 User Manual
Key Area 3. Understanding Emotions
Scale 3.1. Symptoms
High scorers
Description
Can recognize a range of common emotions – for example, happiness, anger, fear,
surprise, interest etc.
Example positive item
I can see when someone is angry.
Moderate scorers
Description
Can recognize a range of common emotions – for example, happiness, anger, fear,
surprise, interest - as well as the average person.
Or
Can recognize common emotions in some situations but not in others.
Low scorers
Description
Have difficulty recognizing a range of common emotions – for example, happiness,
anger, fear, surprise, interest etc.
Example negative item
I can't tell when someone is distracted.
Correlations with other scales R
Discrimination
Analysis of others
Complexity
Transitions
0.54
0.53
0.51
0.49
myskillsprofile.com
27 EIQ16 User Manual
Key Area 3. Understanding Emotions
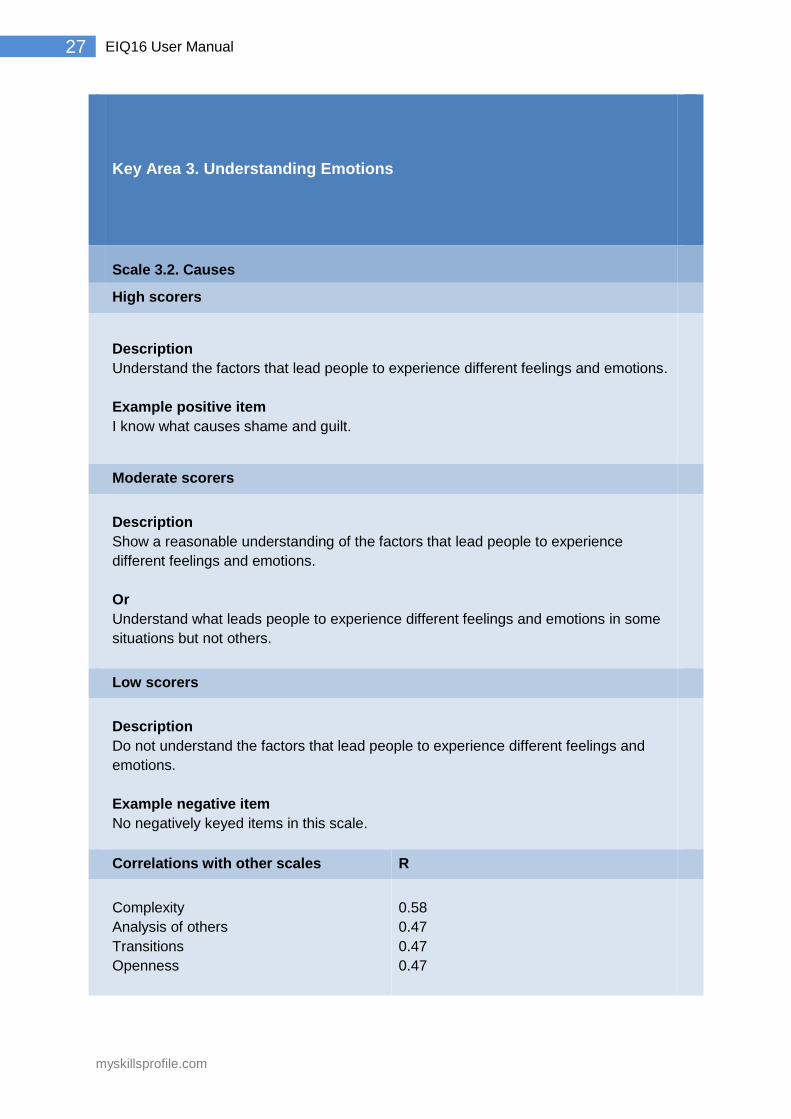
Scale 3.2. Causes
High scorers
Description
Understand the factors that lead people to experience different feelings and emotions.
Example positive item
I know what causes shame and guilt.
Moderate scorers
Description
Show a reasonable understanding of the factors that lead people to experience
different feelings and emotions.
Or
Understand what leads people to experience different feelings and emotions in some
situations but not others.
Low scorers
Description
Do not understand the factors that lead people to experience different feelings and
emotions.
Example negative item
No negatively keyed items in this scale.
Correlations with other scales R
Complexity
Analysis of others
Transitions
Openness
0.58
0.47
0.47
0.47
myskillsprofile.com
28 EIQ16 User Manual
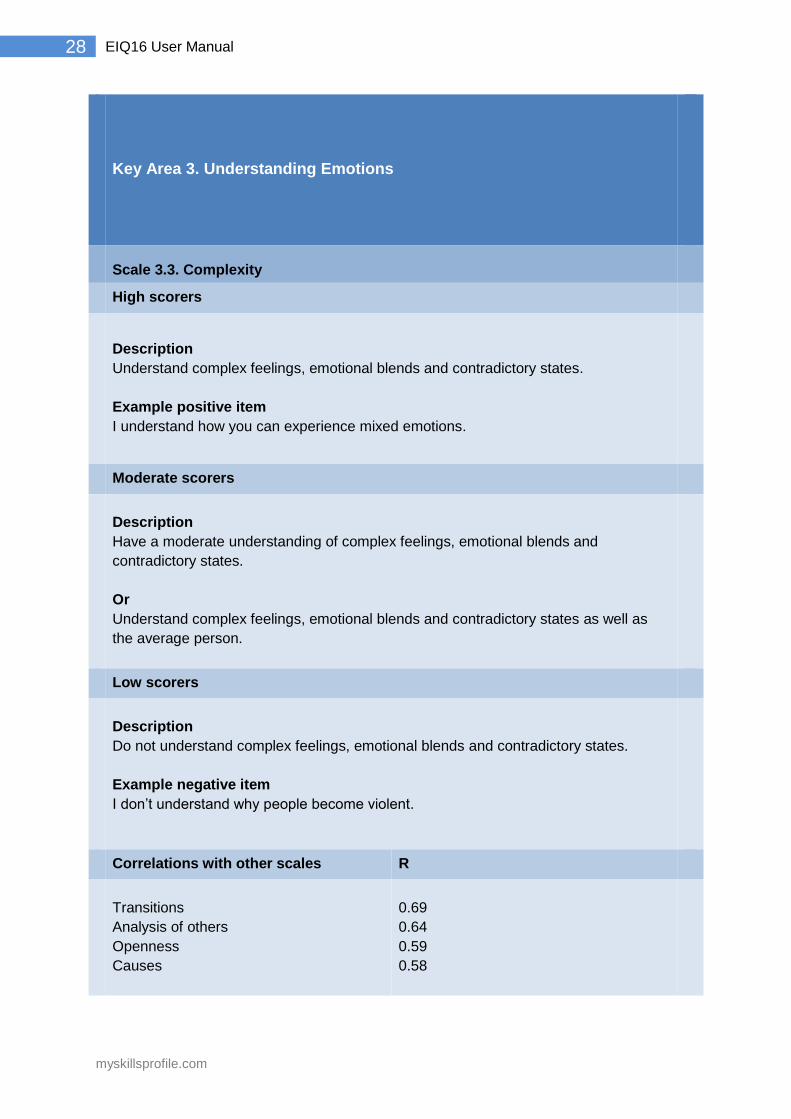
Key Area 3. Understanding Emotions
Scale 3.3. Complexity
High scorers
Description
Understand complex feelings, emotional blends and contradictory states.
Example positive item
I understand how you can experience mixed emotions.
Moderate scorers
Description
Have a moderate understanding of complex feelings, emotional blends and
contradictory states.
Or
Understand complex feelings, emotional blends and contradictory states as well as
the average person.
Low scorers
Description
Do not understand complex feelings, emotional blends and contradictory states.
Example negative item
I don’t understand why people become violent.
Correlations with other scales R
Transitions
Analysis of others
Openness
Causes
0.69
0.64
0.59
0.58
myskillsprofile.com
29 EIQ16 User Manual
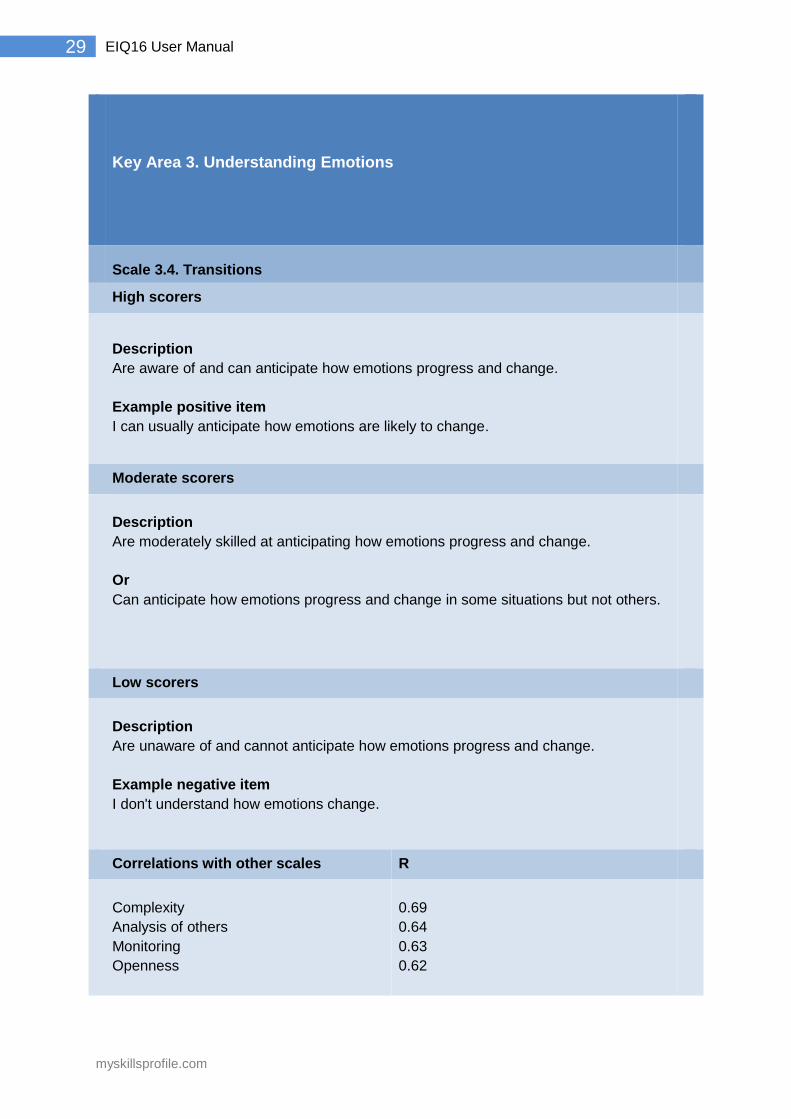
Key Area 3. Understanding Emotions
Scale 3.4. Transitions
High scorers
Description
Are aware of and can anticipate how emotions progress and change.
Example positive item
I can usually anticipate how emotions are likely to change.
Moderate scorers
Description
Are moderately skilled at anticipating how emotions progress and change.
Or
Can anticipate how emotions progress and change in some situations but not others.
Low scorers
Description
Are unaware of and cannot anticipate how emotions progress and change.
Example negative item
I don't understand how emotions change.
Correlations with other scales R
Complexity
Analysis of others
Monitoring
Openness
0.69
0.64
0.63
0.62
myskillsprofile.com
30 EIQ16 User Manual
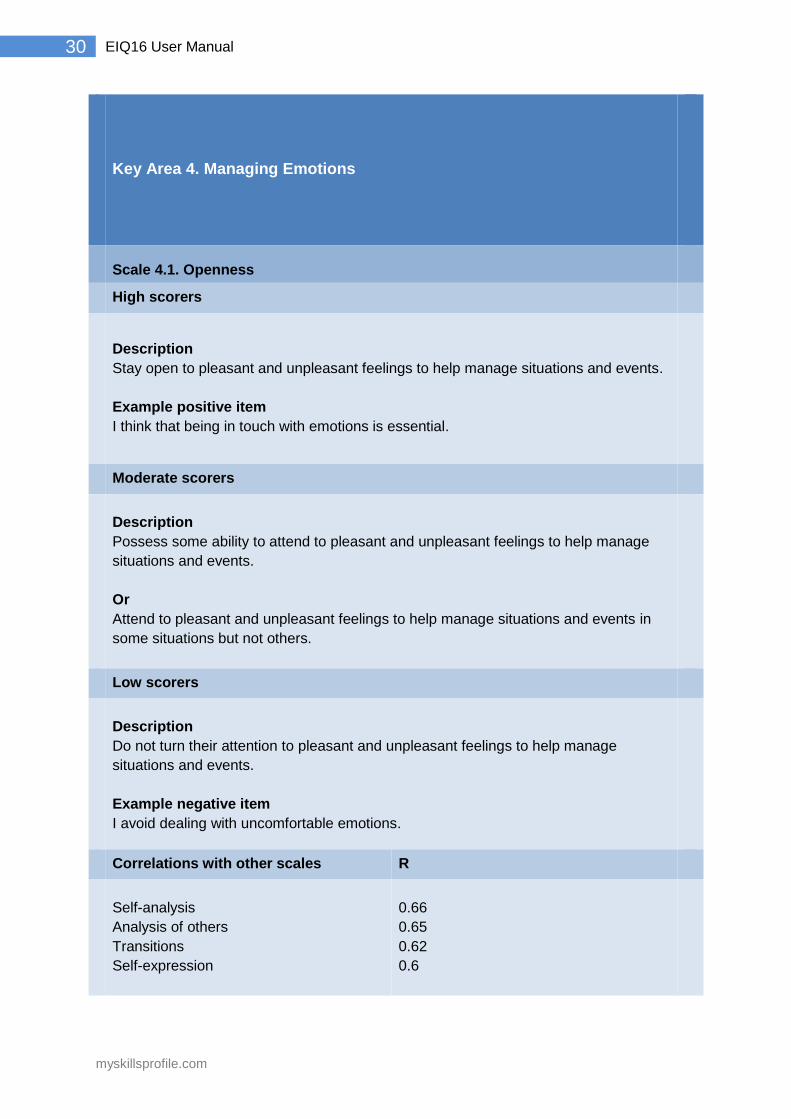
Key Area 4. Managing Emotions
Scale 4.1. Openness
High scorers
Description
Stay open to pleasant and unpleasant feelings to help manage situations and events.
Example positive item
I think that being in touch with emotions is essential.
Moderate scorers
Description
Possess some ability to attend to pleasant and unpleasant feelings to help manage
situations and events.
Or
Attend to pleasant and unpleasant feelings to help manage situations and events in
some situations but not others.
Low scorers
Description
Do not turn their attention to pleasant and unpleasant feelings to help manage
situations and events.
Example negative item
I avoid dealing with uncomfortable emotions.
Correlations with other scales R
Self-analysis
Analysis of others
Transitions
Self-expression
0.66
0.65
0.62
0.6

myskillsprofile.com
31 EIQ16 User Manual
Key Area 4. Managing Emotions
Scale 4.2. Monitoring
High scorers
Description
Are able to reflectively engage or ignore their feelings and emotions to help guide their
actions.
Example positive item
I psych myself up when necessary.
Moderate scorers
Description
Possess a moderate ability to reflectively engage or ignore their feelings and emotions
to help guide their actions.
Or
Are able to reflectively engage or ignore their feelings and emotions to help guide their
actions in some situations but not others.
Low scorers
Description
Are unable to reflectively engage or ignore their feelings and emotions to help guide
their actions.
Example negative item
I don't evaluate the usefulness of my emotions.
Correlations with other scales R
Transitions
Self-control
Complexity
Analysis of others
0.63
0.56
0.52
0.48

myskillsprofile.com
32 EIQ16 User Manual
Key Area 4. Managing Emotions
Scale 4.3. Self-control
High scorers
Description
Are able to stay in control of their feelings and emotions when they are under
pressure and stress.
Example positive item
I think clearly and stay focused under pressure.
Moderate scorers
Description
Are as capable as the average person of staying in control of their feelings and
emotions when they are under pressure and stress.
Or
Manage to stay calm and in control in some situations but have difficulty in others.
Low scorers
Description
Have difficulty staying in control of their feelings and emotions when they are under
pressure and stress.
Example negative item
I take my feelings out on others.
Correlations with other scales R
Monitoring
Transitions
Complexity
Discrimination
0.56
0.42
0.41
0.39
myskillsprofile.com
33 EIQ16 User Manual
Key Area 4. Managing Emotions
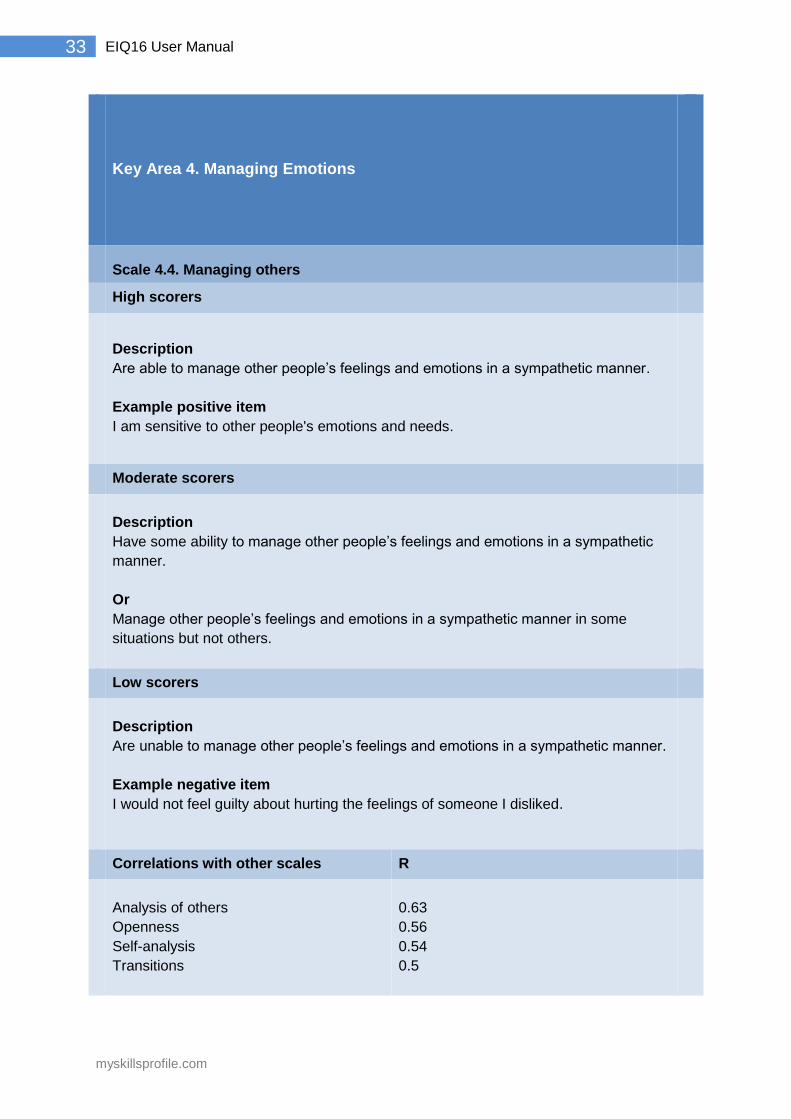
Scale 4.4. Managing others
High scorers
Description
Are able to manage other people’s feelings and emotions in a sympathetic manner.
Example positive item
I am sensitive to other people's emotions and needs.
Moderate scorers
Description
Have some ability to manage other people’s feelings and emotions in a sympathetic
manner.
Or
Manage other people’s feelings and emotions in a sympathetic manner in some
situations but not others.
Low scorers
Description
Are unable to manage other people’s feelings and emotions in a sympathetic manner.
Example negative item
I would not feel guilty about hurting the feelings of someone I disliked.
Correlations with other scales R
Analysis of others
Openness
Self-analysis
Transitions
0.63
0.56
0.54
0.5
myskillsprofile.com
34 EIQ16 User Manual
Response Style
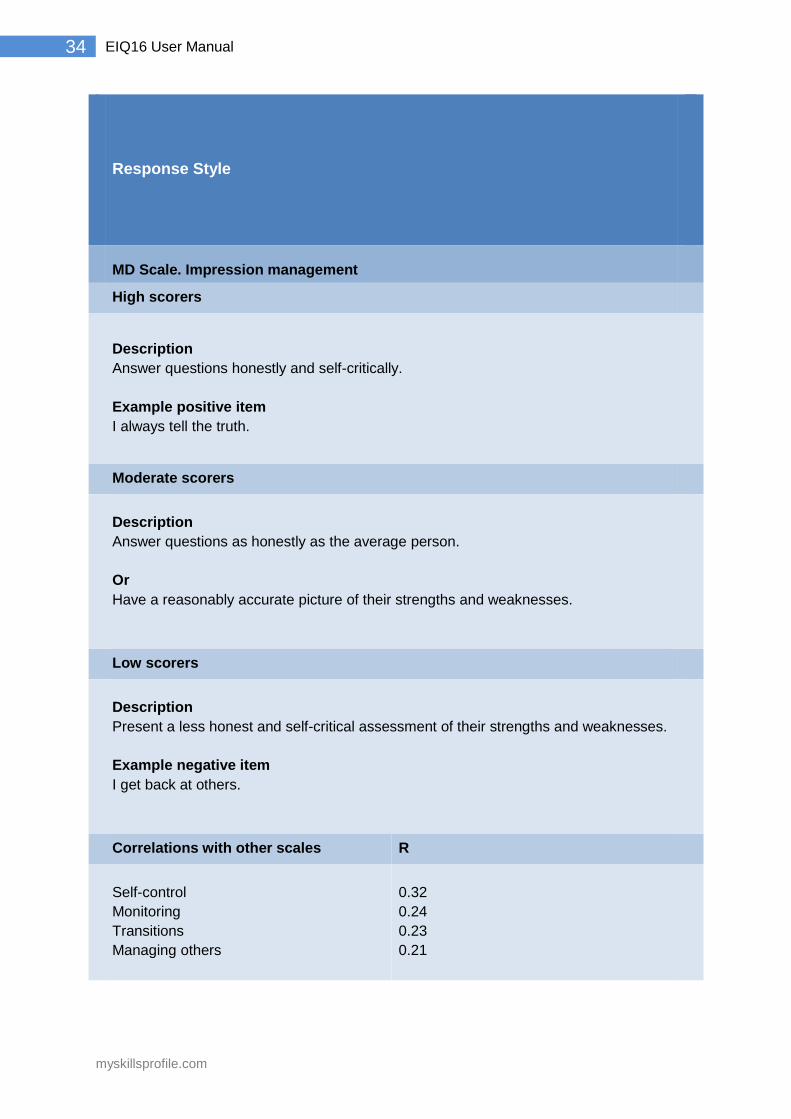
MD Scale. Impression management
High scorers
Description
Answer questions honestly and self-critically.
Example positive item
I always tell the truth.
Moderate scorers
Description
Answer questions as honestly as the average person.
Or
Have a reasonably accurate picture of their strengths and weaknesses.
Low scorers
Description
Present a less honest and self-critical assessment of their strengths and weaknesses.
Example negative item
I get back at others.
Correlations with other scales R
Self-control
Monitoring
Transitions
Managing others
0.32
0.24
0.23
0.21
myskillsprofile.com
35 EIQ16 User Manual
4.0 Interpretation and Feedback Report
This chapter describes how the EIQ16 sten scoring system works, and explains how the
EIQ16 computer-generated feedback report is constructed.
4.1 Sten Scores
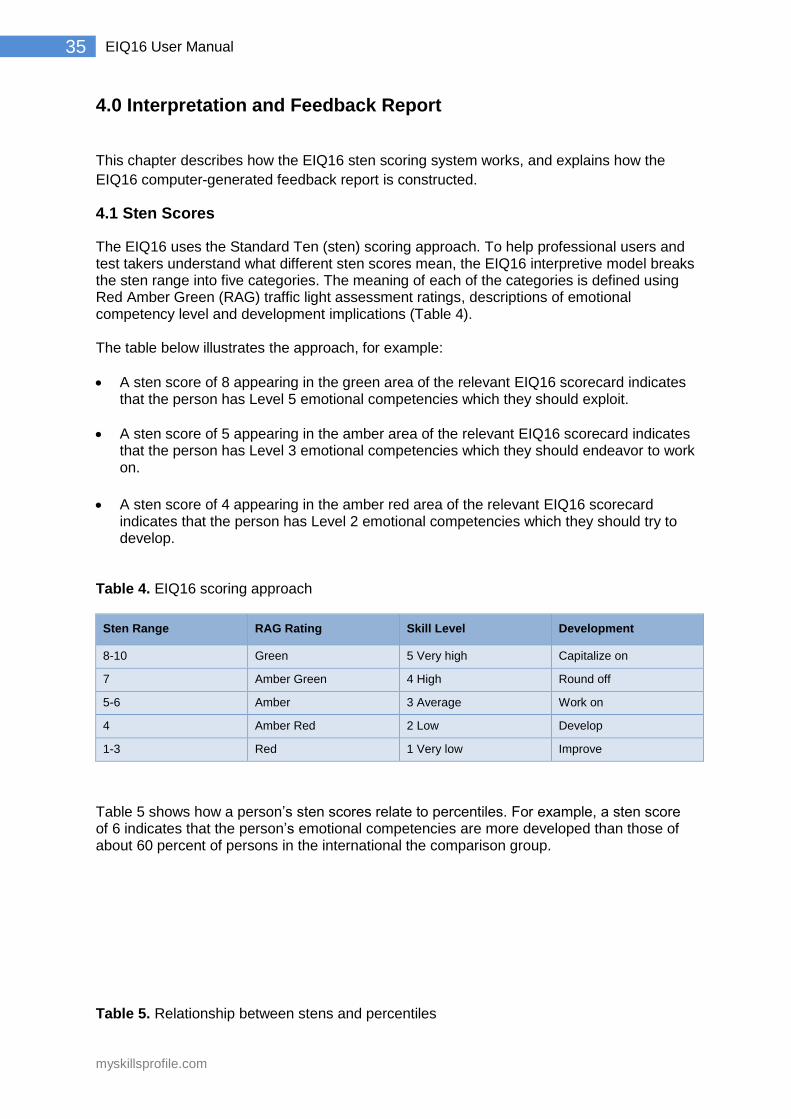
The EIQ16 uses the Standard Ten (sten) scoring approach. To help professional users and test takers understand what different sten scores mean, the EIQ16 interpretive model breaks the sten range into five categories. The meaning of each of the categories is defined using Red Amber Green (RAG) traffic light assessment ratings, descriptions of emotional competency level and development implications (Table 4). The table below illustrates the approach, for example:
A sten score of 8 appearing in the green area of the relevant EIQ16 scorecard indicates that the person has Level 5 emotional competencies which they should exploit.
A sten score of 5 appearing in the amber area of the relevant EIQ16 scorecard indicates that the person has Level 3 emotional competencies which they should endeavor to work on.
A sten score of 4 appearing in the amber red area of the relevant EIQ16 scorecard indicates that the person has Level 2 emotional competencies which they should try to develop.
Table 4. EIQ16 scoring approach
Sten Range RAG Rating Skill Level Development
8-10 Green 5 Very high Capitalize on
7 Amber Green 4 High Round off
5-6 Amber 3 Average Work on
4 Amber Red 2 Low Develop
1-3 Red 1 Very low Improve
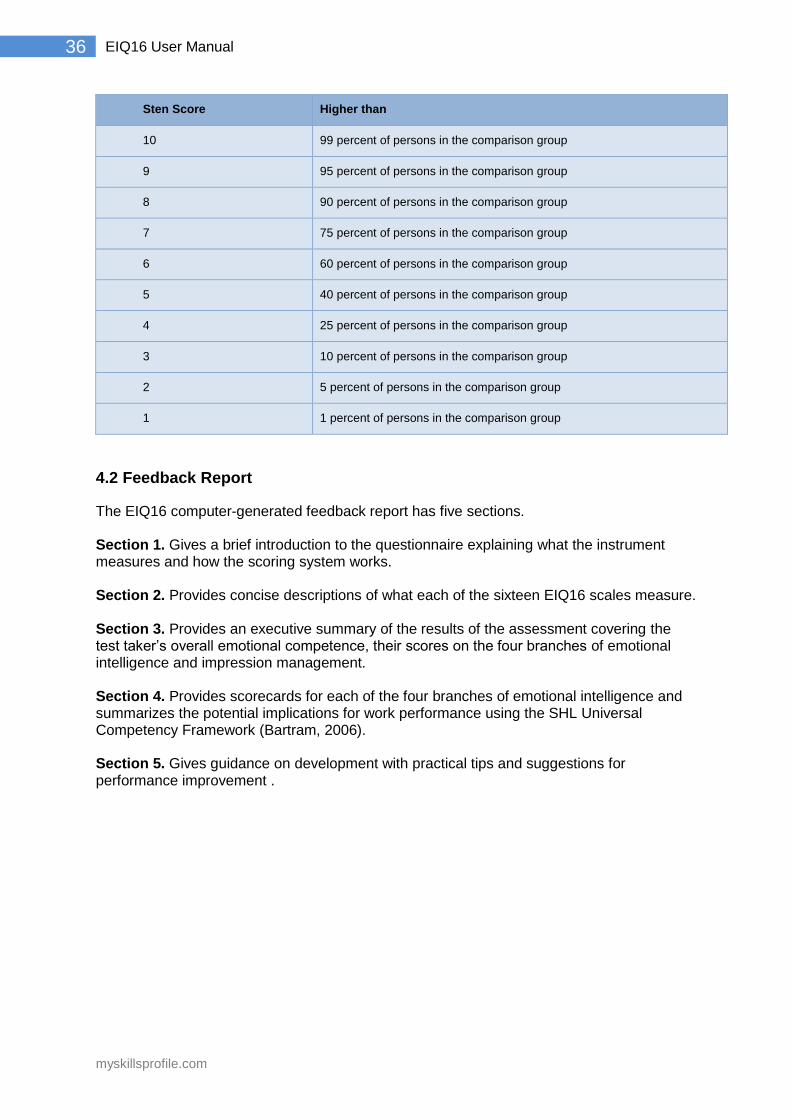
Table 5 shows how a person’s sten scores relate to percentiles. For example, a sten score of 6 indicates that the person’s emotional competencies are more developed than those of about 60 percent of persons in the international the comparison group. Table 5. Relationship between stens and percentiles
myskillsprofile.com
36 EIQ16 User Manual
Sten Score Higher than
10 99 percent of persons in the comparison group
9 95 percent of persons in the comparison group
8 90 percent of persons in the comparison group
7 75 percent of persons in the comparison group
6 60 percent of persons in the comparison group
5 40 percent of persons in the comparison group
4 25 percent of persons in the comparison group
3 10 percent of persons in the comparison group
2 5 percent of persons in the comparison group
1 1 percent of persons in the comparison group
4.2 Feedback Report
The EIQ16 computer-generated feedback report has five sections. Section 1. Gives a brief introduction to the questionnaire explaining what the instrument measures and how the scoring system works. Section 2. Provides concise descriptions of what each of the sixteen EIQ16 scales measure. Section 3. Provides an executive summary of the results of the assessment covering the test taker’s overall emotional competence, their scores on the four branches of emotional intelligence and impression management. Section 4. Provides scorecards for each of the four branches of emotional intelligence and summarizes the potential implications for work performance using the SHL Universal Competency Framework (Bartram, 2006). Section 5. Gives guidance on development with practical tips and suggestions for performance improvement .
myskillsprofile.com
37 EIQ16 User Manual
5.0 Reliability and Validity
5.1 Internal Consistency Reliabilities
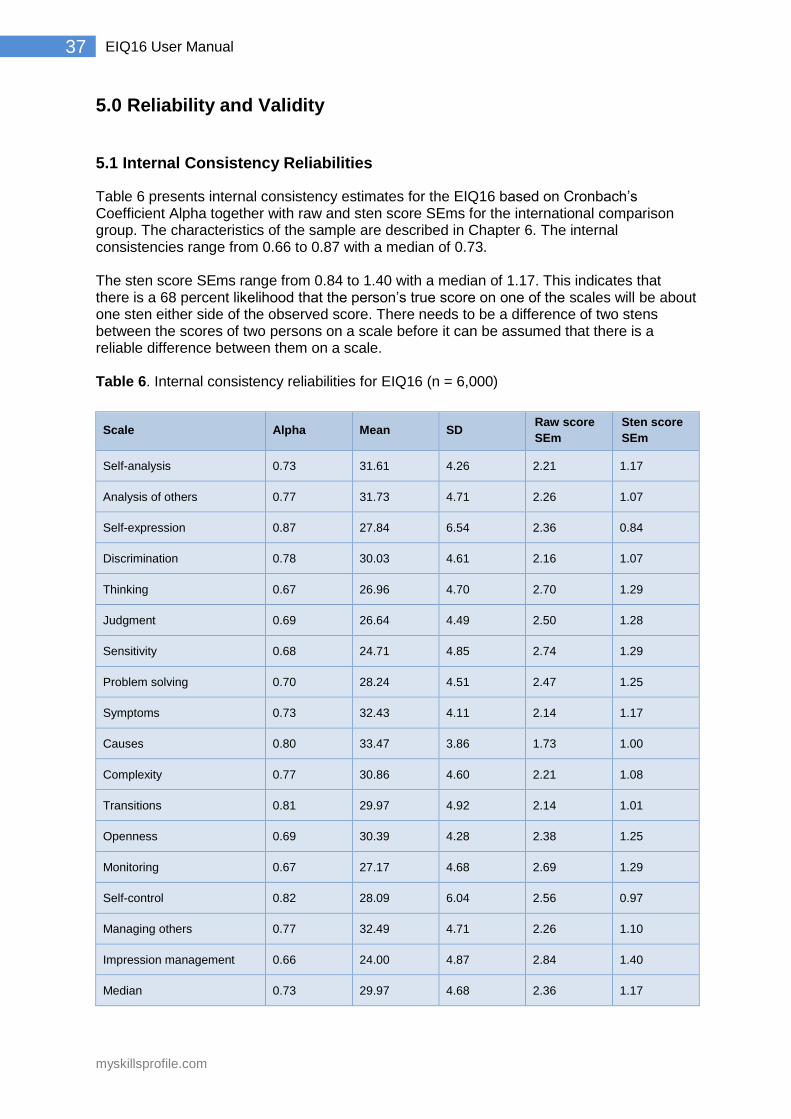
Table 6 presents internal consistency estimates for the EIQ16 based on Cronbach’s Coefficient Alpha together with raw and sten score SEms for the international comparison group. The characteristics of the sample are described in Chapter 6. The internal consistencies range from 0.66 to 0.87 with a median of 0.73. The sten score SEms range from 0.84 to 1.40 with a median of 1.17. This indicates that there is a 68 percent likelihood that the person’s true score on one of the scales will be about one sten either side of the observed score. There needs to be a difference of two stens between the scores of two persons on a scale before it can be assumed that there is a reliable difference between them on a scale. Table 6. Internal consistency reliabilities for EIQ16 (n = 6,000)
Scale Alpha Mean SD Raw score
SEm
Sten score
SEm
Self-analysis 0.73 31.61 4.26 2.21 1.17
Analysis of others 0.77 31.73 4.71 2.26 1.07
Self-expression 0.87 27.84 6.54 2.36 0.84
Discrimination 0.78 30.03 4.61 2.16 1.07
Thinking 0.67 26.96 4.70 2.70 1.29
Judgment 0.69 26.64 4.49 2.50 1.28
Sensitivity 0.68 24.71 4.85 2.74 1.29
Problem solving 0.70 28.24 4.51 2.47 1.25
Symptoms 0.73 32.43 4.11 2.14 1.17
Causes 0.80 33.47 3.86 1.73 1.00
Complexity 0.77 30.86 4.60 2.21 1.08
Transitions 0.81 29.97 4.92 2.14 1.01
Openness 0.69 30.39 4.28 2.38 1.25
Monitoring 0.67 27.17 4.68 2.69 1.29
Self-control 0.82 28.09 6.04 2.56 0.97
Managing others 0.77 32.49 4.71 2.26 1.10
Impression management 0.66 24.00 4.87 2.84 1.40
Median 0.73 29.97 4.68 2.36 1.17
myskillsprofile.com
38 EIQ16 User Manual
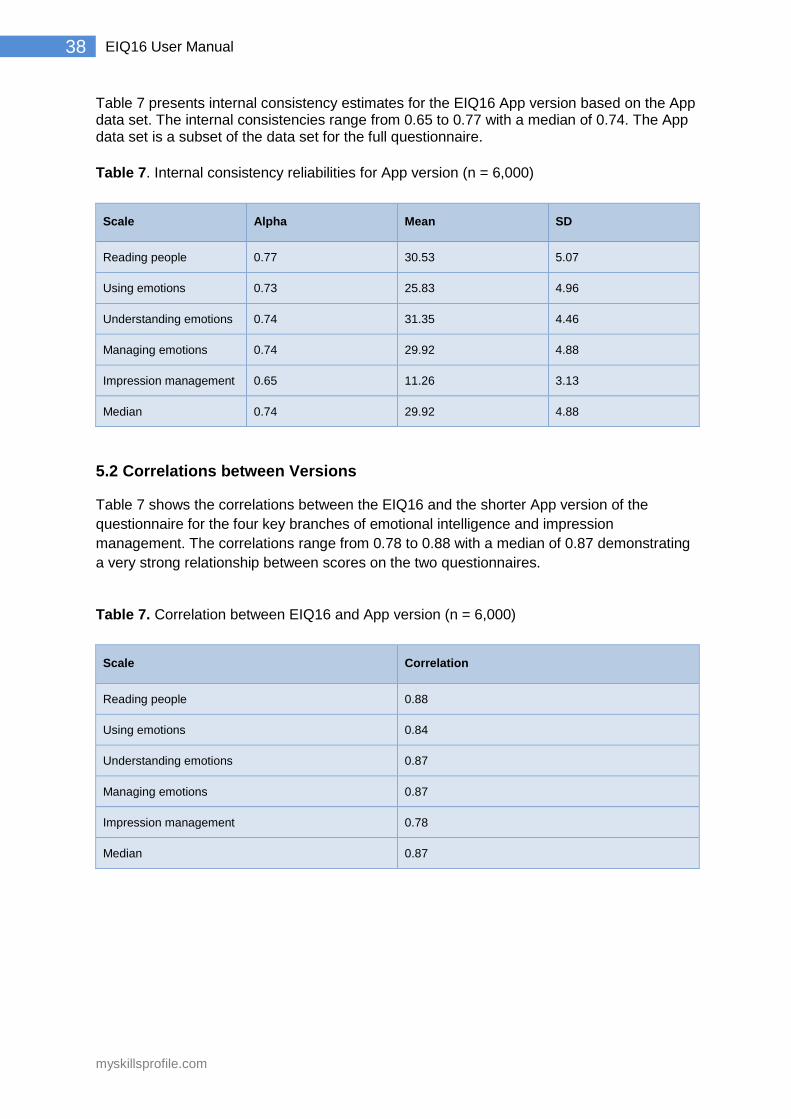
Table 7 presents internal consistency estimates for the EIQ16 App version based on the App data set. The internal consistencies range from 0.65 to 0.77 with a median of 0.74. The App data set is a subset of the data set for the full questionnaire.
Table 7. Internal consistency reliabilities for App version (n = 6,000)
Scale Alpha Mean SD
Reading people 0.77 30.53 5.07
Using emotions 0.73 25.83 4.96
Understanding emotions 0.74 31.35 4.46
Managing emotions 0.74 29.92 4.88
Impression management 0.65 11.26 3.13
Median 0.74 29.92 4.88
5.2 Correlations between Versions
Table 7 shows the correlations between the EIQ16 and the shorter App version of the
questionnaire for the four key branches of emotional intelligence and impression
management. The correlations range from 0.78 to 0.88 with a median of 0.87 demonstrating
a very strong relationship between scores on the two questionnaires.
Table 7. Correlation between EIQ16 and App version (n = 6,000)
Scale Correlation
Reading people 0.88
Using emotions 0.84
Understanding emotions 0.87
Managing emotions 0.87
Impression management 0.78
Median 0.87
myskillsprofile.com
39 EIQ16 User Manual
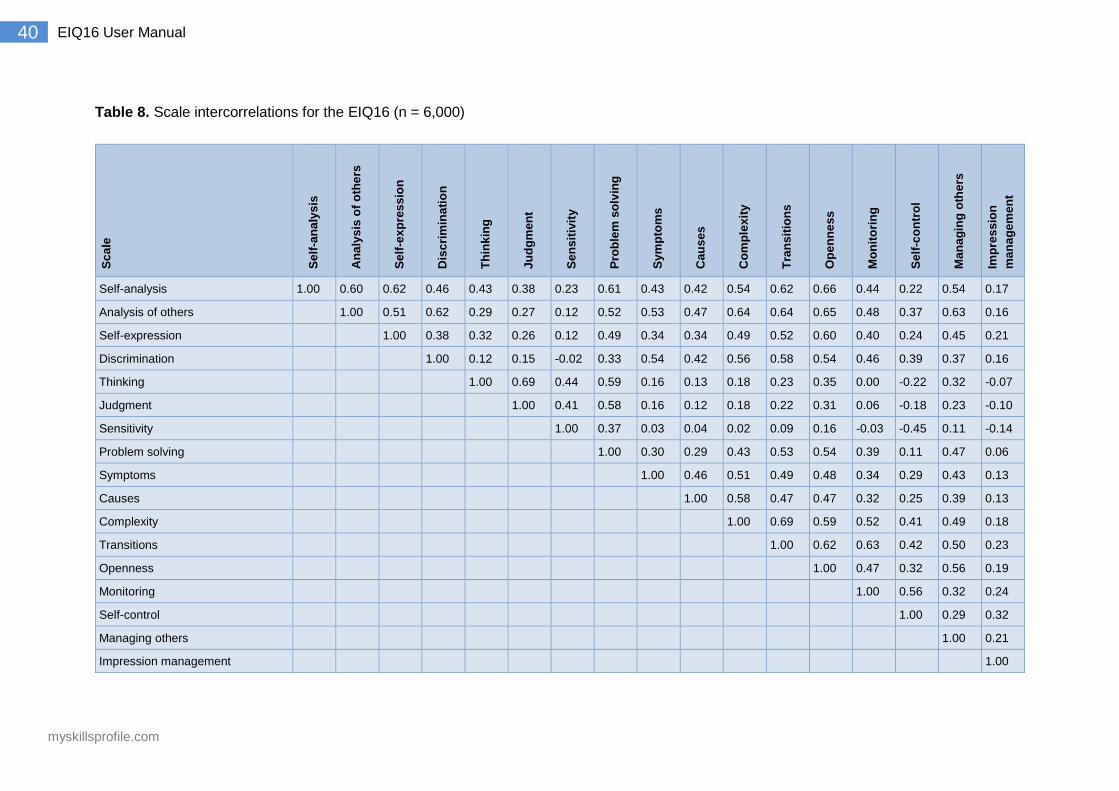
5.3 Scale Intercorrelations
Intercorrelations indicate how closely related or independent the EIQ16 scales are. This
helps interpretation and throws light on construct validity. Table 8 shows the intercorrelations
of the EIQ16 scales. The correlations for the EIQ16 range from -0.45 to 0.68 with a median
of 0.38. About three quarters of the intercorrelations were less than 0.50. This indicates a
reasonable degree of independence between the scales.
5.4 Intercorrelations and Reliability
In order to determine how well an assessment test differentiates between the different
dimensions it is designed to measure, it is necessary to correct the correlations for
unreliability. A correlation needs to be divided by the square root of the product of the two
variables’ reliability to determine what the correlation between the two variables would be if
the variables’ reliabilities were perfect. If two scales share less than 50 percent reliable
variance, then we can be reasonably certain that they are independent.
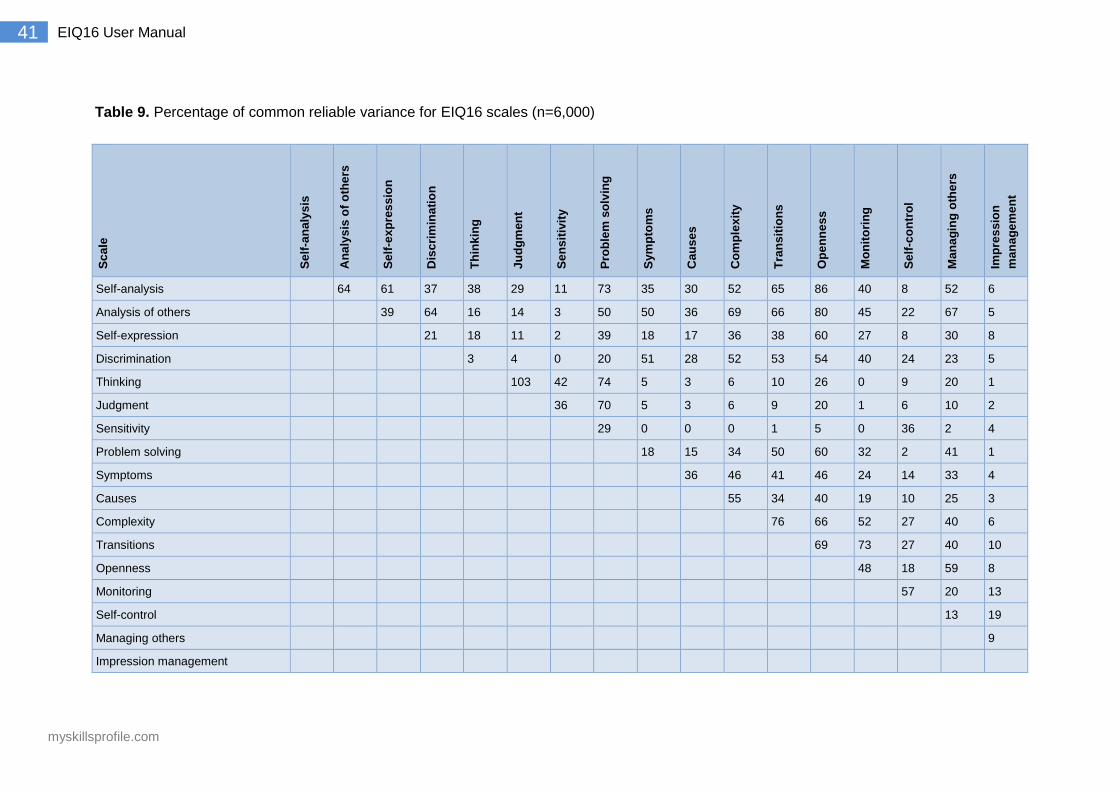
Table 9 shows the percentage of common reliable variance for the EIQ16 scales. Forty nine
percent of the EIQ16 scale pairs share less than 25 percent common variance and 76
percent share less than 50 percent indicating that the scales show a fair degree of
independence.
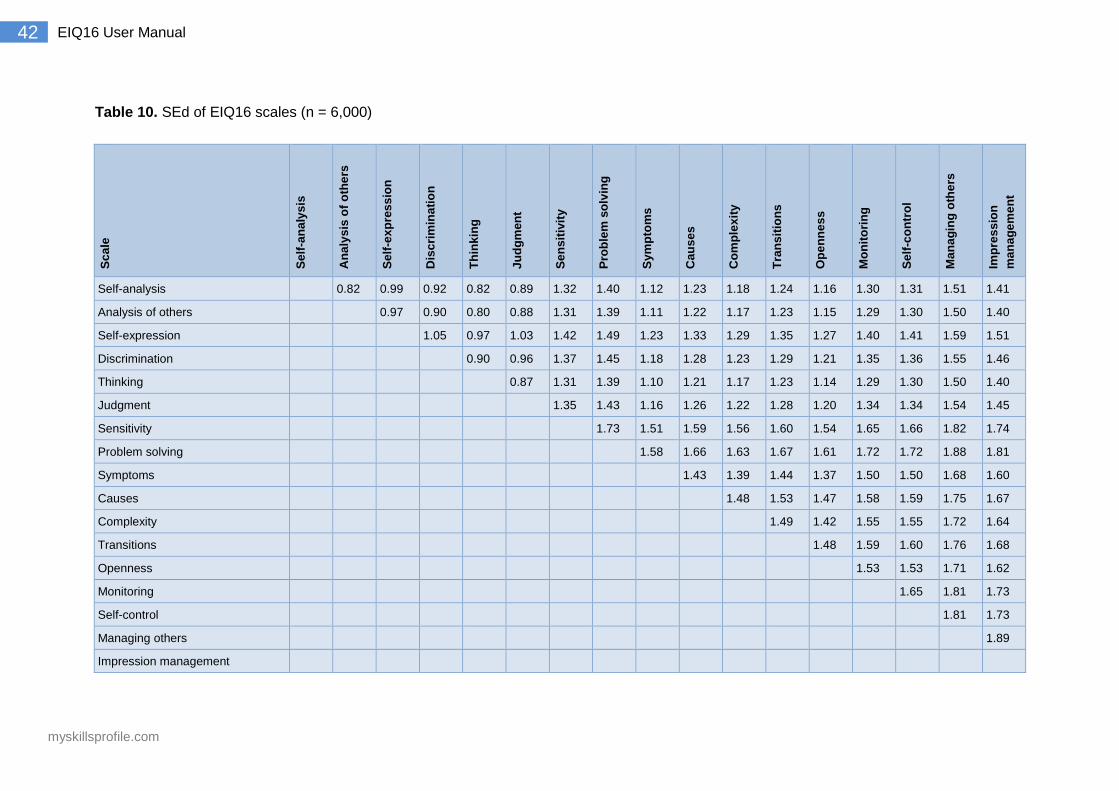
5.5 Standard Error of Difference
The Standard Error of Difference (SEd) helps determine the size of the gap that you need to
see between a person’s scores on any two scales before you can conclude that the
difference is real. The SEd depends on the reliability of the scales – the higher the reliability
the smaller the SEd is. If there are two full SEds between the scores on two scales, then
there is a 95 percent likelihood that there is a real difference.
Table 10 shows the SEds for the EIQ16. The median SEd for the EIQ16 primary scales is
1.41 indicating that a difference of 3 stens is likely to indicate a real difference between one
scale score and another. In other words, you need to see a difference of 3 stens (depending
on the scales in question) before you can say that a person has more emotional
competencies in one area than another.
myskillsprofile.com
40 EIQ16 User Manual
Table 8. Scale intercorrelations for the EIQ16 (n = 6,000)
Sc
ale
Se
lf-a
na
lys
is
An
aly
sis
of
oth
ers
Se
lf-e
xp
res
sio
n
Dis
cri
min
ati
on
Th
ink
ing
Ju
dg
men
t
Se
ns
itiv
ity
Pro
ble
m s
olv
ing
Sy
mp
tom
s
Cau
se
s
Co
mp
lex
ity
Tra
ns
itio
ns
Op
en
ne
ss
Mo
nit
ori
ng
Se
lf-c
on
tro
l
Ma
na
gin
g o
the
rs
Imp
res
sio
n
ma
na
ge
me
nt
Self-analysis 1.00 0.60 0.62 0.46 0.43 0.38 0.23 0.61 0.43 0.42 0.54 0.62 0.66 0.44 0.22 0.54 0.17
Analysis of others 1.00 0.51 0.62 0.29 0.27 0.12 0.52 0.53 0.47 0.64 0.64 0.65 0.48 0.37 0.63 0.16
Self-expression 1.00 0.38 0.32 0.26 0.12 0.49 0.34 0.34 0.49 0.52 0.60 0.40 0.24 0.45 0.21
Discrimination 1.00 0.12 0.15 -0.02 0.33 0.54 0.42 0.56 0.58 0.54 0.46 0.39 0.37 0.16
Thinking 1.00 0.69 0.44 0.59 0.16 0.13 0.18 0.23 0.35 0.00 -0.22 0.32 -0.07
Judgment 1.00 0.41 0.58 0.16 0.12 0.18 0.22 0.31 0.06 -0.18 0.23 -0.10
Sensitivity 1.00 0.37 0.03 0.04 0.02 0.09 0.16 -0.03 -0.45 0.11 -0.14
Problem solving 1.00 0.30 0.29 0.43 0.53 0.54 0.39 0.11 0.47 0.06
Symptoms 1.00 0.46 0.51 0.49 0.48 0.34 0.29 0.43 0.13
Causes 1.00 0.58 0.47 0.47 0.32 0.25 0.39 0.13
Complexity 1.00 0.69 0.59 0.52 0.41 0.49 0.18
Transitions 1.00 0.62 0.63 0.42 0.50 0.23
Openness 1.00 0.47 0.32 0.56 0.19
Monitoring 1.00 0.56 0.32 0.24
Self-control 1.00 0.29 0.32
Managing others 1.00 0.21
Impression management 1.00
myskillsprofile.com
41 EIQ16 User Manual
Table 9. Percentage of common reliable variance for EIQ16 scales (n=6,000)
Sc
ale
Se
lf-a
na
lys
is
An
aly
sis
of
oth
ers
Se
lf-e
xp
res
sio
n
Dis
cri
min
ati
on
Th
ink
ing
Ju
dg
men
t
Se
ns
itiv
ity
Pro
ble
m s
olv
ing
Sy
mp
tom
s
Cau
se
s
Co
mp
lex
ity
Tra
ns
itio
ns
Op
en
ne
ss
Mo
nit
ori
ng
Se
lf-c
on
tro
l
Ma
na
gin
g o
the
rs
Imp
res
sio
n
ma
na
ge
me
nt
Self-analysis 64 61 37 38 29 11 73 35 30 52 65 86 40 8 52 6
Analysis of others
39 64 16 14 3 50 50 36 69 66 80 45 22 67 5
Self-expression
21 18 11 2 39 18 17 36 38 60 27 8 30 8
Discrimination
3 4 0 20 51 28 52 53 54 40 24 23 5
Thinking
103 42 74 5 3 6 10 26 0 9 20 1
Judgment
36 70 5 3 6 9 20 1 6 10 2
Sensitivity
29 0 0 0 1 5 0 36 2 4
Problem solving
18 15 34 50 60 32 2 41 1
Symptoms
36 46 41 46 24 14 33 4
Causes
55 34 40 19 10 25 3
Complexity
76 66 52 27 40 6
Transitions
69 73 27 40 10
Openness
48 18 59 8
Monitoring
57 20 13
Self-control
13 19
Managing others
9
Impression management
myskillsprofile.com
42 EIQ16 User Manual
Table 10. SEd of EIQ16 scales (n = 6,000)
Sc
ale
Se
lf-a
na
lys
is
An
aly
sis
of
oth
ers
Se
lf-e
xp
res
sio
n
Dis
cri
min
ati
on
Th
ink
ing
Ju
dg
men
t
Se
ns
itiv
ity
Pro
ble
m s
olv
ing
Sy
mp
tom
s
Cau
se
s
Co
mp
lex
ity
Tra
ns
itio
ns
Op
en
ne
ss
Mo
nit
ori
ng
Se
lf-c
on
tro
l
Ma
na
gin
g o
the
rs
Imp
res
sio
n
ma
na
ge
me
nt
Self-analysis
0.82 0.99 0.92 0.82 0.89 1.32 1.40 1.12 1.23 1.18 1.24 1.16 1.30 1.31 1.51 1.41
Analysis of others
0.97 0.90 0.80 0.88 1.31 1.39 1.11 1.22 1.17 1.23 1.15 1.29 1.30 1.50 1.40
Self-expression
1.05 0.97 1.03 1.42 1.49 1.23 1.33 1.29 1.35 1.27 1.40 1.41 1.59 1.51
Discrimination
0.90 0.96 1.37 1.45 1.18 1.28 1.23 1.29 1.21 1.35 1.36 1.55 1.46
Thinking
0.87 1.31 1.39 1.10 1.21 1.17 1.23 1.14 1.29 1.30 1.50 1.40
Judgment
1.35 1.43 1.16 1.26 1.22 1.28 1.20 1.34 1.34 1.54 1.45
Sensitivity
1.73 1.51 1.59 1.56 1.60 1.54 1.65 1.66 1.82 1.74
Problem solving
1.58 1.66 1.63 1.67 1.61 1.72 1.72 1.88 1.81
Symptoms
1.43 1.39 1.44 1.37 1.50 1.50 1.68 1.60
Causes
1.48 1.53 1.47 1.58 1.59 1.75 1.67
Complexity
1.49 1.42 1.55 1.55 1.72 1.64
Transitions
1.48 1.59 1.60 1.76 1.68
Openness
1.53 1.53 1.71 1.62
Monitoring
1.65 1.81 1.73
Self-control
1.81 1.73
Managing others
1.89
Impression management
myskillsprofile.com
43 EIQ16 User Manual
5.6 Factor Analysis
Response bias is a common problem with normative assessments especially where the
items are transparent. Recent studies in the field of personality (Rammstedt, Kemper, and
Borg, 2013; Rammstedt, Goldberg, and Borg, 2010; Rammstedt and Kemper, 2011) suggest
that the structure of instruments assessing the Big Five personality factors is sensitive to
effects of acquiescent responding. When acquiescence was controlled for through
ipsatization, the Big Five factor structure became much clearer and more congruent with
simple structure.
Previous factor analyses of the EIQ16 have provided evidence for two, three, and four-factor
models. In the most recent study of the factor structure of the inventory, we carried out
analyses using normative scores, ipsatized scores, and combined scores (the mean of
standardized normative and standardized ipsatized scores). Ipsatization transforms a
respondent’s scores relative to their average response so that their scale scores represent
deviations from their average scale score.
Factor analysis with the combined scale scores produced solutions that bore closest
resemblance to the four-branch concept model and these are reported below.
Principal axis extraction with oblique rotation was performed on the EIQ16 scales separately
for men and women on an international sample of 1,293 men and 1,288 women. The Kaiser-
Meyer-Olkin Measure of Sampling Adequacy was above 0.8 in each analysis, well above 0.6
required for a good factor analysis.
Four factors were extracted with eigenvalues over 1 for men and women accounting for 54
percent and 48 percent of variance. The variables were on the whole reasonably well-
defined by the factor solutions. The median communality values were 0.54 and 0.47. Table
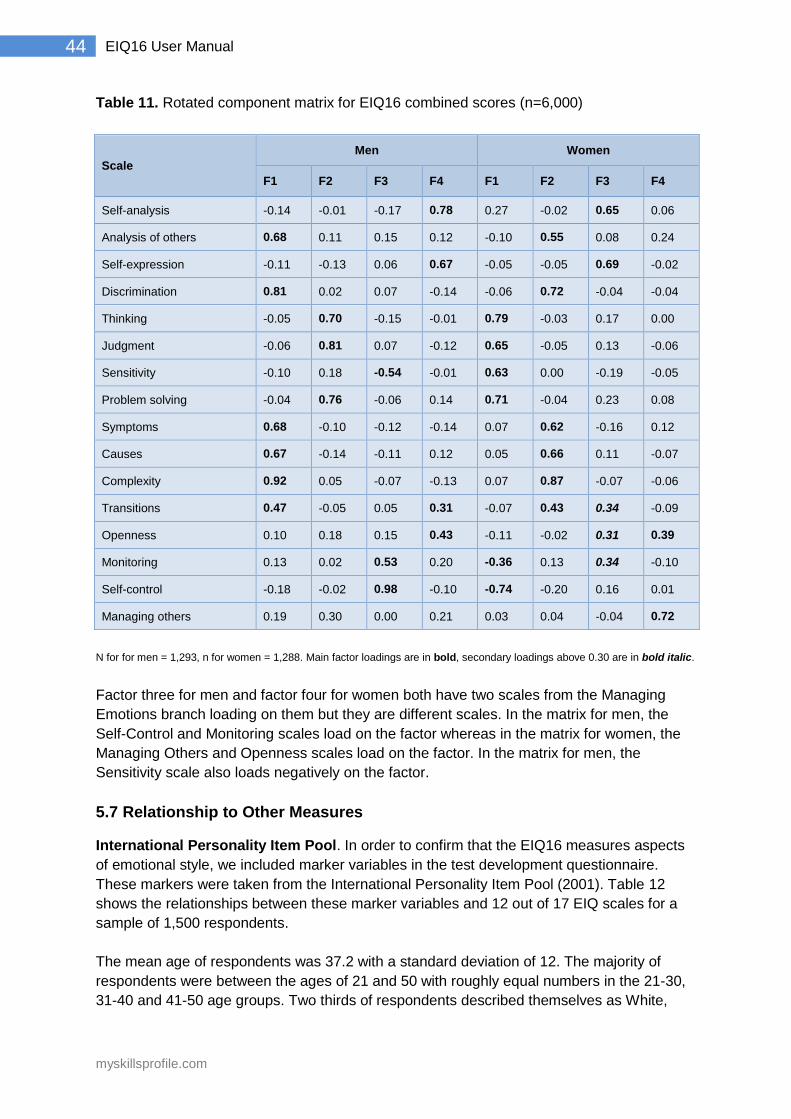
11 shows loadings of variables on factors.
The first factor for men and the third factor for women have six scales loading on them and
we interpret this factor as measuring the Understanding Emotions branch in the four-branch
ability model. The following scales loaded on this factor: Complexity, Discrimination, Analysis
of Others, Symptoms, Causes, and Transitions.
Factor two for men and factor one for women both have the following scales loading them:
Judgment, Problem Solving, and Thinking. This factor appears to be measuring the Using
Emotions branch in the four-branch model. In the matrix for women, the Sensitivity scale
also loads positively on this factor, and the Self-Control and Monitoring scales load
negatively. It seems that women who allow their emotions to influence their thinking have
difficulty regulating their emotions; and, women who regulate their emotions tend not to allow
their emotions to influence their thinking.
Factor four for men and factor three for women both have the following scales loading on
them: Self-Analysis, Self-expression, Openness, and Transitions. This factor appears to be
tapping the Reading People branch in the four-branch model. In the matrix for women, the
Monitoring scale also loads on this factor.
myskillsprofile.com
44 EIQ16 User Manual
Table 11. Rotated component matrix for EIQ16 combined scores (n=6,000)
Scale
Men Women
F1 F2 F3 F4 F1 F2 F3 F4
Self-analysis -0.14 -0.01 -0.17 0.78 0.27 -0.02 0.65 0.06
Analysis of others 0.68 0.11 0.15 0.12 -0.10 0.55 0.08 0.24
Self-expression -0.11 -0.13 0.06 0.67 -0.05 -0.05 0.69 -0.02
Discrimination 0.81 0.02 0.07 -0.14 -0.06 0.72 -0.04 -0.04
Thinking -0.05 0.70 -0.15 -0.01 0.79 -0.03 0.17 0.00
Judgment -0.06 0.81 0.07 -0.12 0.65 -0.05 0.13 -0.06
Sensitivity -0.10 0.18 -0.54 -0.01 0.63 0.00 -0.19 -0.05
Problem solving -0.04 0.76 -0.06 0.14 0.71 -0.04 0.23 0.08
Symptoms 0.68 -0.10 -0.12 -0.14 0.07 0.62 -0.16 0.12
Causes 0.67 -0.14 -0.11 0.12 0.05 0.66 0.11 -0.07
Complexity 0.92 0.05 -0.07 -0.13 0.07 0.87 -0.07 -0.06
Transitions 0.47 -0.05 0.05 0.31 -0.07 0.43 0.34 -0.09
Openness 0.10 0.18 0.15 0.43 -0.11 -0.02 0.31 0.39
Monitoring 0.13 0.02 0.53 0.20 -0.36 0.13 0.34 -0.10
Self-control -0.18 -0.02 0.98 -0.10 -0.74 -0.20 0.16 0.01
Managing others 0.19 0.30 0.00 0.21 0.03 0.04 -0.04 0.72
N for for men = 1,293, n for women = 1,288. Main factor loadings are in bold, secondary loadings above 0.30 are in bold italic.
Factor three for men and factor four for women both have two scales from the Managing
Emotions branch loading on them but they are different scales. In the matrix for men, the
Self-Control and Monitoring scales load on the factor whereas in the matrix for women, the
Managing Others and Openness scales load on the factor. In the matrix for men, the
Sensitivity scale also loads negatively on the factor.
5.7 Relationship to Other Measures
International Personality Item Pool. In order to confirm that the EIQ16 measures aspects
of emotional style, we included marker variables in the test development questionnaire.
These markers were taken from the International Personality Item Pool (2001). Table 12
shows the relationships between these marker variables and 12 out of 17 EIQ scales for a
sample of 1,500 respondents.
The mean age of respondents was 37.2 with a standard deviation of 12. The majority of
respondents were between the ages of 21 and 50 with roughly equal numbers in the 21-30,
31-40 and 41-50 age groups. Two thirds of respondents described themselves as White,
myskillsprofile.com
45 EIQ16 User Manual
7.6% said they were Asian, 7% said they were Black, and 4.2% of a mixed background.
Approximately half of the respondents were from the United States and one fifth from the
United Kingdom. About a fifth of respondents were from Canada, Australia, and New
Zealand.
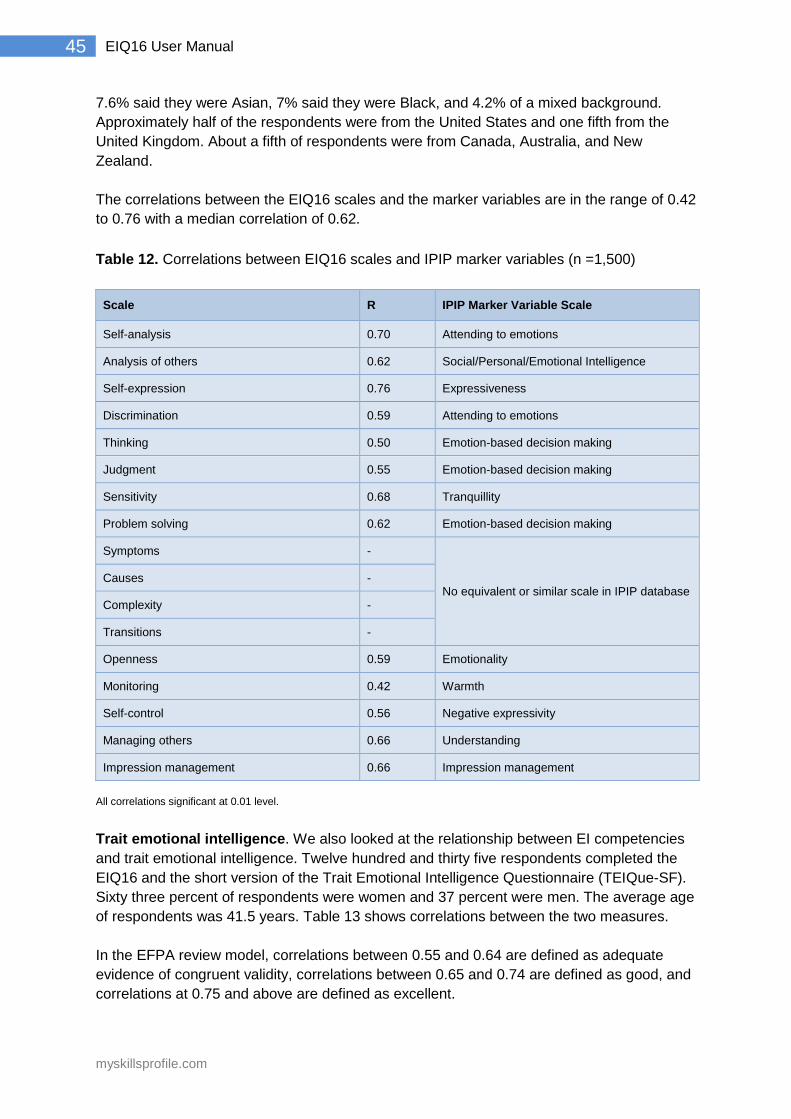
The correlations between the EIQ16 scales and the marker variables are in the range of 0.42
to 0.76 with a median correlation of 0.62.
Table 12. Correlations between EIQ16 scales and IPIP marker variables (n =1,500)
Scale R IPIP Marker Variable Scale
Self-analysis 0.70 Attending to emotions
Analysis of others 0.62 Social/Personal/Emotional Intelligence
Self-expression 0.76 Expressiveness
Discrimination 0.59 Attending to emotions
Thinking 0.50 Emotion-based decision making
Judgment 0.55 Emotion-based decision making
Sensitivity 0.68 Tranquillity
Problem solving 0.62 Emotion-based decision making
Symptoms -
No equivalent or similar scale in IPIP database Causes -
Complexity -
Transitions -
Openness 0.59 Emotionality
Monitoring 0.42 Warmth
Self-control 0.56 Negative expressivity
Managing others 0.66 Understanding
Impression management 0.66 Impression management
All correlations significant at 0.01 level.
Trait emotional intelligence. We also looked at the relationship between EI competencies
and trait emotional intelligence. Twelve hundred and thirty five respondents completed the
EIQ16 and the short version of the Trait Emotional Intelligence Questionnaire (TEIQue-SF).
Sixty three percent of respondents were women and 37 percent were men. The average age
of respondents was 41.5 years. Table 13 shows correlations between the two measures.
In the EFPA review model, correlations between 0.55 and 0.64 are defined as adequate
evidence of congruent validity, correlations between 0.65 and 0.74 are defined as good, and
correlations at 0.75 and above are defined as excellent.
myskillsprofile.com
46 EIQ16 User Manual
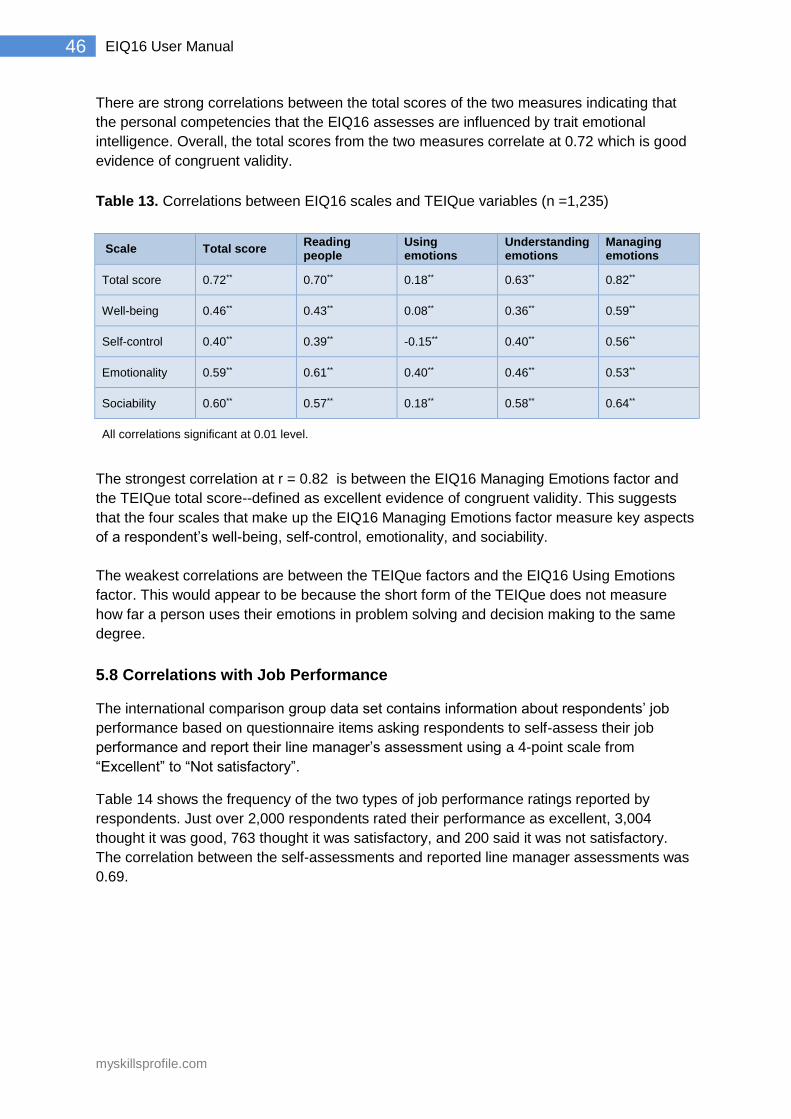
There are strong correlations between the total scores of the two measures indicating that
the personal competencies that the EIQ16 assesses are influenced by trait emotional
intelligence. Overall, the total scores from the two measures correlate at 0.72 which is good
evidence of congruent validity.
Table 13. Correlations between EIQ16 scales and TEIQue variables (n =1,235)
Scale Total score Reading people
Using emotions
Understanding emotions
Managing emotions
Total score 0.72** 0.70** 0.18** 0.63** 0.82**
Well-being 0.46** 0.43** 0.08** 0.36** 0.59**
Self-control 0.40** 0.39** -0.15** 0.40** 0.56**
Emotionality 0.59** 0.61** 0.40** 0.46** 0.53**
Sociability 0.60** 0.57** 0.18** 0.58** 0.64**
All correlations significant at 0.01 level.
The strongest correlation at r = 0.82 is between the EIQ16 Managing Emotions factor and
the TEIQue total score--defined as excellent evidence of congruent validity. This suggests
that the four scales that make up the EIQ16 Managing Emotions factor measure key aspects
of a respondent’s well-being, self-control, emotionality, and sociability.
The weakest correlations are between the TEIQue factors and the EIQ16 Using Emotions
factor. This would appear to be because the short form of the TEIQue does not measure
how far a person uses their emotions in problem solving and decision making to the same
degree.
5.8 Correlations with Job Performance
The international comparison group data set contains information about respondents’ job
performance based on questionnaire items asking respondents to self-assess their job
performance and report their line manager’s assessment using a 4-point scale from
“Excellent” to “Not satisfactory”.
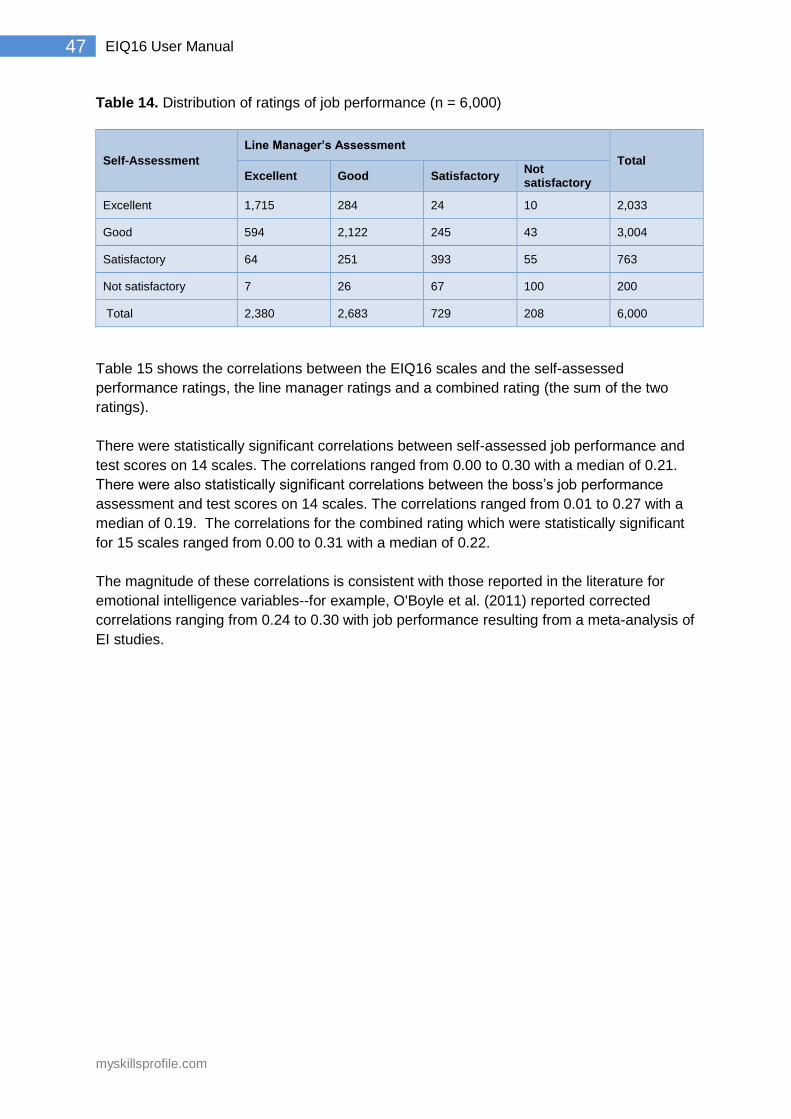
Table 14 shows the frequency of the two types of job performance ratings reported by
respondents. Just over 2,000 respondents rated their performance as excellent, 3,004
thought it was good, 763 thought it was satisfactory, and 200 said it was not satisfactory.
The correlation between the self-assessments and reported line manager assessments was
0.69.
myskillsprofile.com
47 EIQ16 User Manual
Table 14. Distribution of ratings of job performance (n = 6,000)
Self-Assessment
Line Manager’s Assessment
Total
Excellent Good Satisfactory Not satisfactory
Excellent 1,715 284 24 10 2,033
Good 594 2,122 245 43 3,004
Satisfactory 64 251 393 55 763
Not satisfactory 7 26 67 100 200
Total 2,380 2,683 729 208 6,000
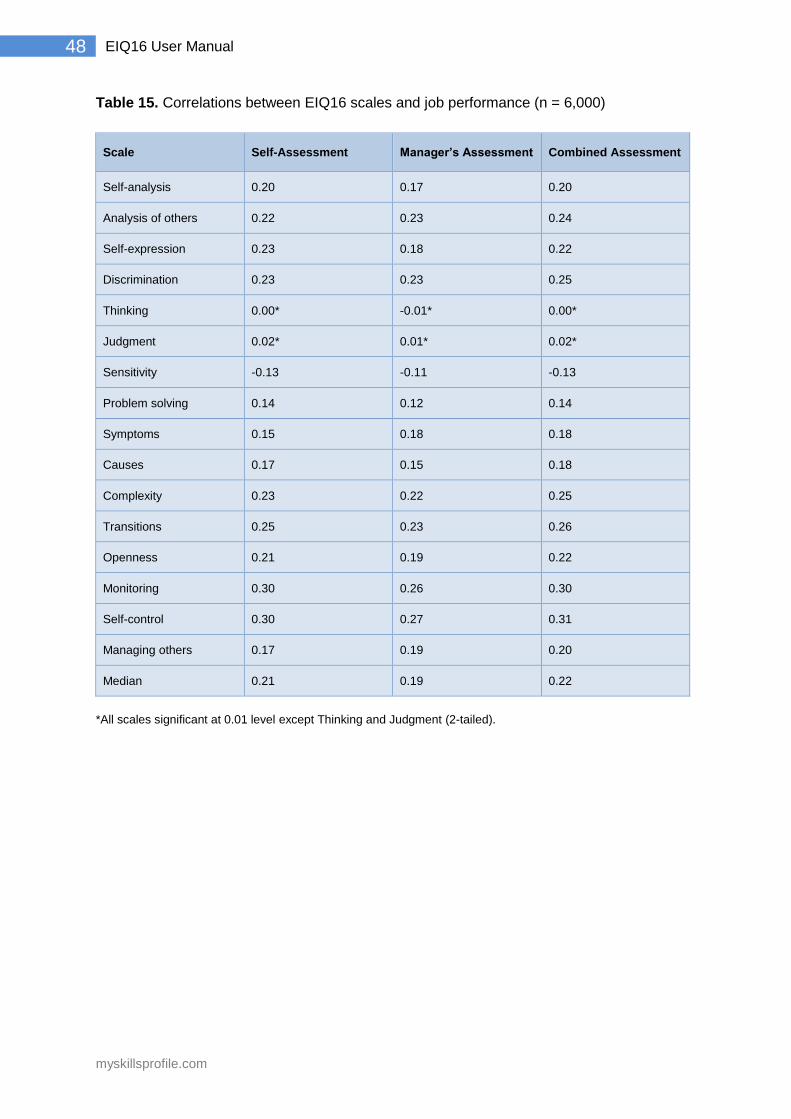
Table 15 shows the correlations between the EIQ16 scales and the self-assessed
performance ratings, the line manager ratings and a combined rating (the sum of the two
ratings).
There were statistically significant correlations between self-assessed job performance and
test scores on 14 scales. The correlations ranged from 0.00 to 0.30 with a median of 0.21.
There were also statistically significant correlations between the boss’s job performance
assessment and test scores on 14 scales. The correlations ranged from 0.01 to 0.27 with a
median of 0.19. The correlations for the combined rating which were statistically significant
for 15 scales ranged from 0.00 to 0.31 with a median of 0.22.
The magnitude of these correlations is consistent with those reported in the literature for
emotional intelligence variables--for example, O'Boyle et al. (2011) reported corrected
correlations ranging from 0.24 to 0.30 with job performance resulting from a meta-analysis of
EI studies.
myskillsprofile.com
48 EIQ16 User Manual
Table 15. Correlations between EIQ16 scales and job performance (n = 6,000)
Scale Self-Assessment Manager’s Assessment Combined Assessment
Self-analysis 0.20 0.17 0.20
Analysis of others 0.22 0.23 0.24
Self-expression 0.23 0.18 0.22
Discrimination 0.23 0.23 0.25
Thinking 0.00* -0.01* 0.00*
Judgment 0.02* 0.01* 0.02*
Sensitivity -0.13 -0.11 -0.13
Problem solving 0.14 0.12 0.14
Symptoms 0.15 0.18 0.18
Causes 0.17 0.15 0.18
Complexity 0.23 0.22 0.25
Transitions 0.25 0.23 0.26
Openness 0.21 0.19 0.22
Monitoring 0.30 0.26 0.30
Self-control 0.30 0.27 0.31
Managing others 0.17 0.19 0.20
Median 0.21 0.19 0.22
*All scales significant at 0.01 level except Thinking and Judgment (2-tailed).
myskillsprofile.com
49 EIQ16 User Manual
5.9 Demographics and EIQ16 scales
The EIQ16 is designed to be used in different countries by adults of all ages. In this section,
we examine the influence of age, gender, ethnic origin and country of origin. The analyses
were carried out on the international comparison group.
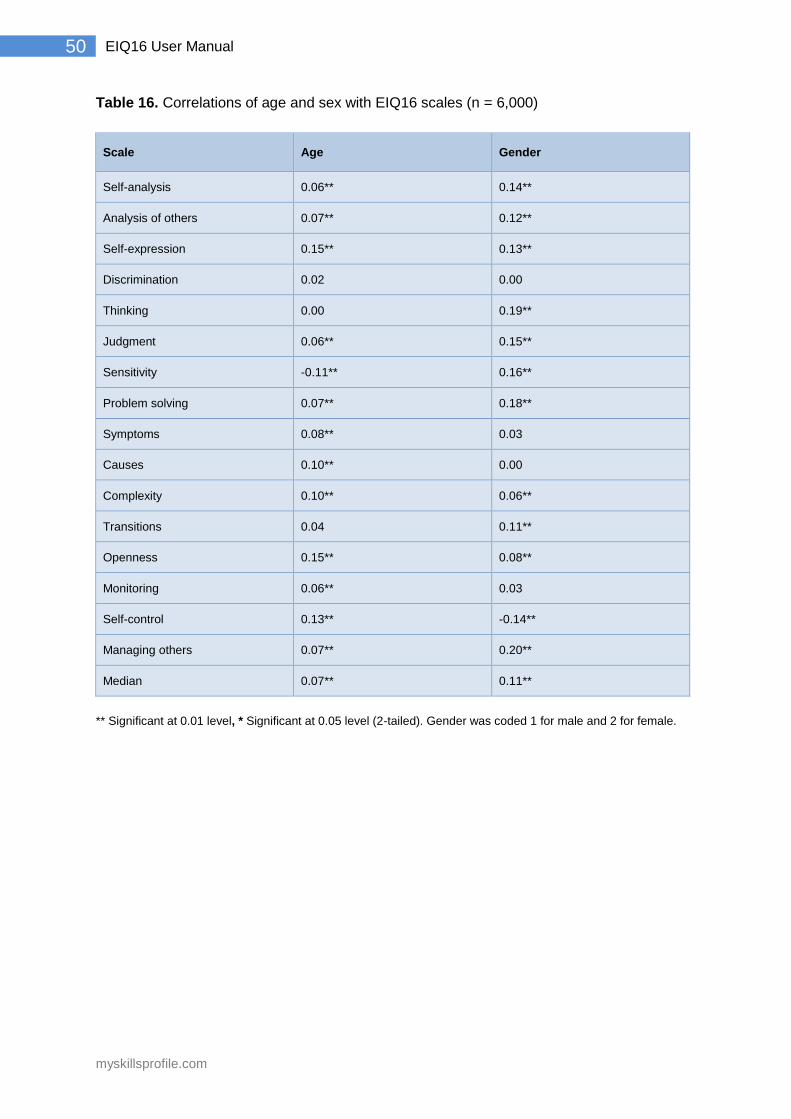
Age. Table 16 shows the correlations between age and EIQ16 test scores. There are
statistically significant correlations between age and test scores in 14 scales but all of these
are below 0.20 in absolute magnitude. Self-expression, Openness and Self-Control correlate
strongest with age demonstrating that older people are, for example, more able to express
their feelings and emotions, more open to feelings and emotions, and more capable of
controlling their feelings and emotions. There would seem to be no need for separate norm
groups for adults in different age groups, however, because the observed age differences
are very small.
Gender. There were statistically significant correlations between gender and test scores in
13 scales but the observed gender differences are again quite small (Table 16). Only one
reaches 0.20 in absolute magnitude. Women tend to score higher than men on all but one of
the scales--the exception being Self-Control. As the differences are again quite insignificant
in scale, it would seem to be acceptable to use combined sex norms.
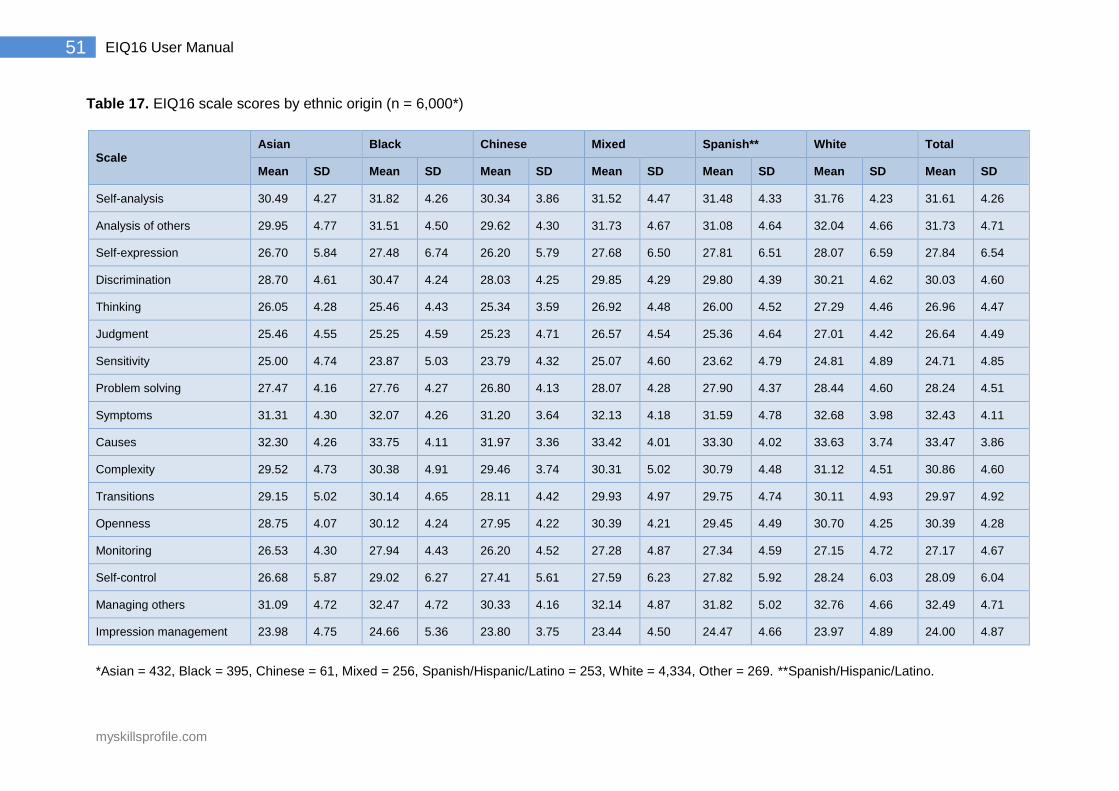
Ethnic origin. Table 17 shows means and standard deviations on EIQ16 scales for six race
and ethnicity categories. Analysis of variance showed that the differences in scores between
the groups were statistically significant on all the scales but the differences were once again
quite modest in size. People of Chinese and Asian origin tended to have slightly lower
scores generally on the EIQ16 scales but as with age and gender, the differences are quite
modest.
Country of origin. Table 18 gives means and standard deviations on EIQ16 scales for
respondents from the United States, the United Kingdom, Canada, Australia and the rest of
the world. Analysis of variance revealed statistically significant differences on all the scales
but as with the other demographic variables, the differences were once again quite slender
in size. These findings would seem to suggest that a combined country international sample
is justified.
myskillsprofile.com
50 EIQ16 User Manual
Table 16. Correlations of age and sex with EIQ16 scales (n = 6,000)
Scale Age Gender
Self-analysis 0.06** 0.14**
Analysis of others 0.07** 0.12**
Self-expression 0.15** 0.13**
Discrimination 0.02 0.00
Thinking 0.00 0.19**
Judgment 0.06** 0.15**
Sensitivity -0.11** 0.16**
Problem solving 0.07** 0.18**
Symptoms 0.08** 0.03
Causes 0.10** 0.00
Complexity 0.10** 0.06**
Transitions 0.04 0.11**
Openness 0.15** 0.08**
Monitoring 0.06** 0.03
Self-control 0.13** -0.14**
Managing others 0.07** 0.20**
Median 0.07** 0.11**
** Significant at 0.01 level, * Significant at 0.05 level (2-tailed). Gender was coded 1 for male and 2 for female.
myskillsprofile.com
51 EIQ16 User Manual
Table 17. EIQ16 scale scores by ethnic origin (n = 6,000*)
Scale Asian Black Chinese Mixed Spanish** White Total
Mean SD Mean SD Mean SD Mean SD Mean SD Mean SD Mean SD
Self-analysis 30.49 4.27 31.82 4.26 30.34 3.86 31.52 4.47 31.48 4.33 31.76 4.23 31.61 4.26
Analysis of others 29.95 4.77 31.51 4.50 29.62 4.30 31.73 4.67 31.08 4.64 32.04 4.66 31.73 4.71
Self-expression 26.70 5.84 27.48 6.74 26.20 5.79 27.68 6.50 27.81 6.51 28.07 6.59 27.84 6.54
Discrimination 28.70 4.61 30.47 4.24 28.03 4.25 29.85 4.29 29.80 4.39 30.21 4.62 30.03 4.60
Thinking 26.05 4.28 25.46 4.43 25.34 3.59 26.92 4.48 26.00 4.52 27.29 4.46 26.96 4.47
Judgment 25.46 4.55 25.25 4.59 25.23 4.71 26.57 4.54 25.36 4.64 27.01 4.42 26.64 4.49
Sensitivity 25.00 4.74 23.87 5.03 23.79 4.32 25.07 4.60 23.62 4.79 24.81 4.89 24.71 4.85
Problem solving 27.47 4.16 27.76 4.27 26.80 4.13 28.07 4.28 27.90 4.37 28.44 4.60 28.24 4.51
Symptoms 31.31 4.30 32.07 4.26 31.20 3.64 32.13 4.18 31.59 4.78 32.68 3.98 32.43 4.11
Causes 32.30 4.26 33.75 4.11 31.97 3.36 33.42 4.01 33.30 4.02 33.63 3.74 33.47 3.86
Complexity 29.52 4.73 30.38 4.91 29.46 3.74 30.31 5.02 30.79 4.48 31.12 4.51 30.86 4.60
Transitions 29.15 5.02 30.14 4.65 28.11 4.42 29.93 4.97 29.75 4.74 30.11 4.93 29.97 4.92
Openness 28.75 4.07 30.12 4.24 27.95 4.22 30.39 4.21 29.45 4.49 30.70 4.25 30.39 4.28
Monitoring 26.53 4.30 27.94 4.43 26.20 4.52 27.28 4.87 27.34 4.59 27.15 4.72 27.17 4.67
Self-control 26.68 5.87 29.02 6.27 27.41 5.61 27.59 6.23 27.82 5.92 28.24 6.03 28.09 6.04
Managing others 31.09 4.72 32.47 4.72 30.33 4.16 32.14 4.87 31.82 5.02 32.76 4.66 32.49 4.71
Impression management 23.98 4.75 24.66 5.36 23.80 3.75 23.44 4.50 24.47 4.66 23.97 4.89 24.00 4.87
*Asian = 432, Black = 395, Chinese = 61, Mixed = 256, Spanish/Hispanic/Latino = 253, White = 4,334, Other = 269. **Spanish/Hispanic/Latino.
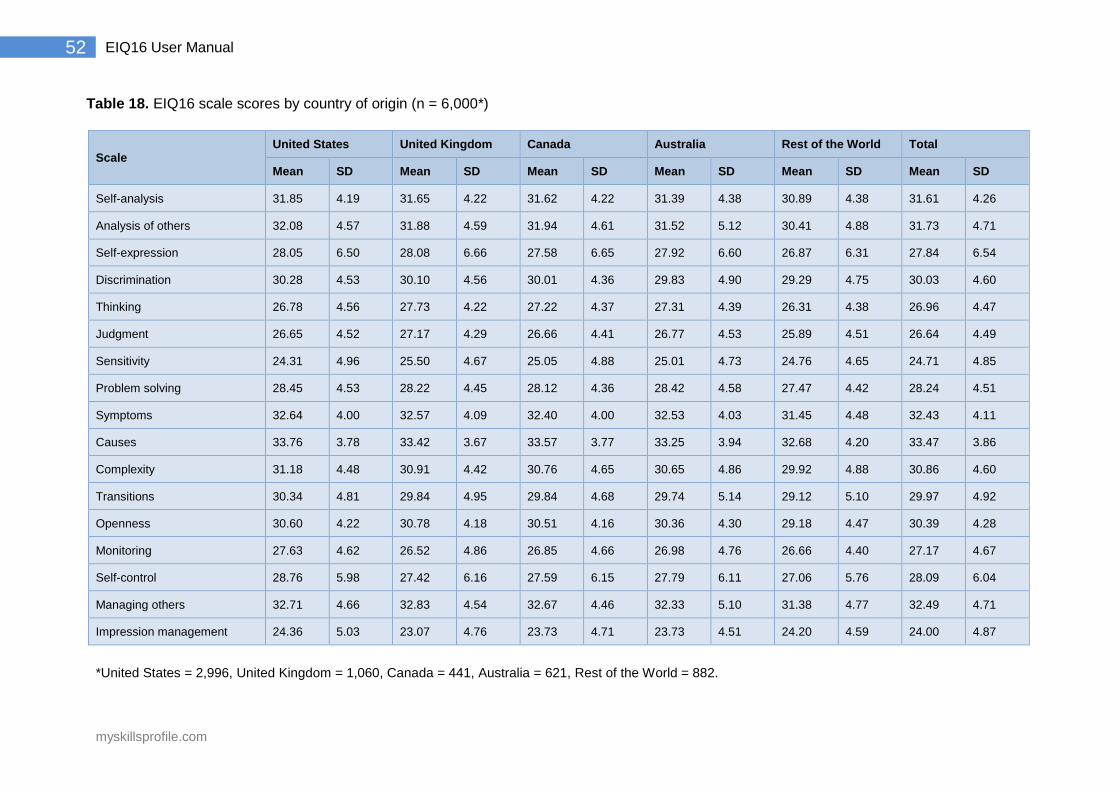
myskillsprofile.com
52 EIQ16 User Manual
Table 18. EIQ16 scale scores by country of origin (n = 6,000*)
Scale United States United Kingdom Canada Australia Rest of the World Total
Mean SD Mean SD Mean SD Mean SD Mean SD Mean SD
Self-analysis 31.85 4.19 31.65 4.22 31.62 4.22 31.39 4.38 30.89 4.38 31.61 4.26
Analysis of others 32.08 4.57 31.88 4.59 31.94 4.61 31.52 5.12 30.41 4.88 31.73 4.71
Self-expression 28.05 6.50 28.08 6.66 27.58 6.65 27.92 6.60 26.87 6.31 27.84 6.54
Discrimination 30.28 4.53 30.10 4.56 30.01 4.36 29.83 4.90 29.29 4.75 30.03 4.60
Thinking 26.78 4.56 27.73 4.22 27.22 4.37 27.31 4.39 26.31 4.38 26.96 4.47
Judgment 26.65 4.52 27.17 4.29 26.66 4.41 26.77 4.53 25.89 4.51 26.64 4.49
Sensitivity 24.31 4.96 25.50 4.67 25.05 4.88 25.01 4.73 24.76 4.65 24.71 4.85
Problem solving 28.45 4.53 28.22 4.45 28.12 4.36 28.42 4.58 27.47 4.42 28.24 4.51
Symptoms 32.64 4.00 32.57 4.09 32.40 4.00 32.53 4.03 31.45 4.48 32.43 4.11
Causes 33.76 3.78 33.42 3.67 33.57 3.77 33.25 3.94 32.68 4.20 33.47 3.86
Complexity 31.18 4.48 30.91 4.42 30.76 4.65 30.65 4.86 29.92 4.88 30.86 4.60
Transitions 30.34 4.81 29.84 4.95 29.84 4.68 29.74 5.14 29.12 5.10 29.97 4.92
Openness 30.60 4.22 30.78 4.18 30.51 4.16 30.36 4.30 29.18 4.47 30.39 4.28
Monitoring 27.63 4.62 26.52 4.86 26.85 4.66 26.98 4.76 26.66 4.40 27.17 4.67
Self-control 28.76 5.98 27.42 6.16 27.59 6.15 27.79 6.11 27.06 5.76 28.09 6.04
Managing others 32.71 4.66 32.83 4.54 32.67 4.46 32.33 5.10 31.38 4.77 32.49 4.71
Impression management 24.36 5.03 23.07 4.76 23.73 4.71 23.73 4.51 24.20 4.59 24.00 4.87
*United States = 2,996, United Kingdom = 1,060, Canada = 441, Australia = 621, Rest of the World = 882.
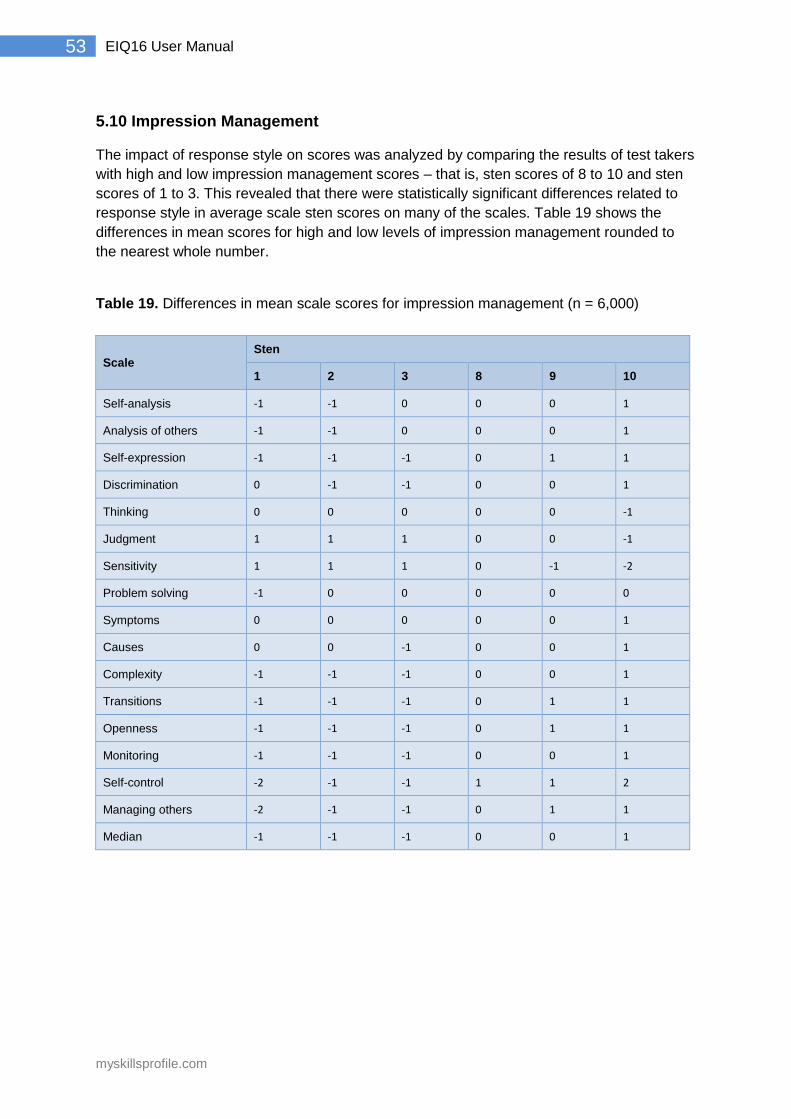
myskillsprofile.com
53 EIQ16 User Manual
5.10 Impression Management
The impact of response style on scores was analyzed by comparing the results of test takers
with high and low impression management scores – that is, sten scores of 8 to 10 and sten
scores of 1 to 3. This revealed that there were statistically significant differences related to
response style in average scale sten scores on many of the scales. Table 19 shows the
differences in mean scores for high and low levels of impression management rounded to
the nearest whole number.
Table 19. Differences in mean scale scores for impression management (n = 6,000)
Scale Sten
1 2 3 8 9 10
Self-analysis -1 -1 0 0 0 1
Analysis of others -1 -1 0 0 0 1
Self-expression -1 -1 -1 0 1 1
Discrimination 0 -1 -1 0 0 1
Thinking 0 0 0 0 0 -1
Judgment 1 1 1 0 0 -1
Sensitivity 1 1 1 0 -1 -2
Problem solving -1 0 0 0 0 0
Symptoms 0 0 0 0 0 1
Causes 0 0 -1 0 0 1
Complexity -1 -1 -1 0 0 1
Transitions -1 -1 -1 0 1 1
Openness -1 -1 -1 0 1 1
Monitoring -1 -1 -1 0 0 1
Self-control -2 -1 -1 1 1 2
Managing others -2 -1 -1 0 1 1
Median -1 -1 -1 0 0 1
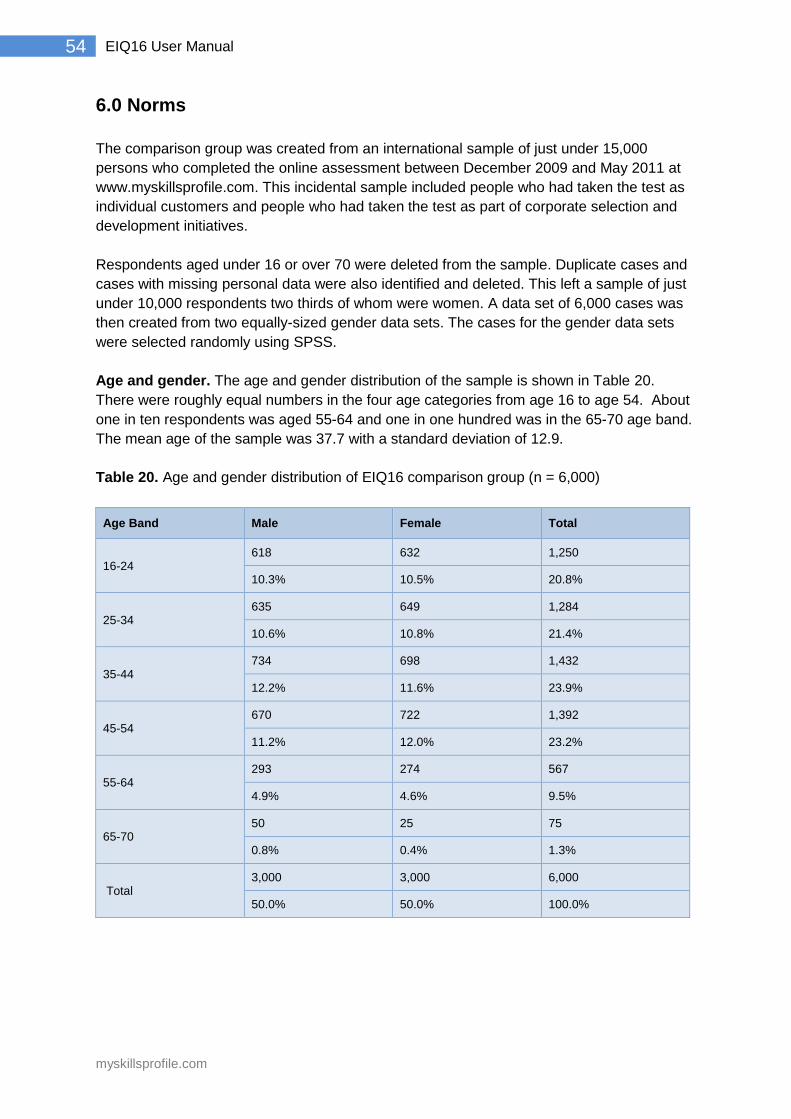
myskillsprofile.com
54 EIQ16 User Manual
6.0 Norms
The comparison group was created from an international sample of just under 15,000
persons who completed the online assessment between December 2009 and May 2011 at
www.myskillsprofile.com. This incidental sample included people who had taken the test as
individual customers and people who had taken the test as part of corporate selection and
development initiatives.
Respondents aged under 16 or over 70 were deleted from the sample. Duplicate cases and
cases with missing personal data were also identified and deleted. This left a sample of just
under 10,000 respondents two thirds of whom were women. A data set of 6,000 cases was
then created from two equally-sized gender data sets. The cases for the gender data sets
were selected randomly using SPSS.
Age and gender. The age and gender distribution of the sample is shown in Table 20.
There were roughly equal numbers in the four age categories from age 16 to age 54. About
one in ten respondents was aged 55-64 and one in one hundred was in the 65-70 age band.
The mean age of the sample was 37.7 with a standard deviation of 12.9.
Table 20. Age and gender distribution of EIQ16 comparison group (n = 6,000)
Age Band Male Female Total
16-24 618 632 1,250
10.3% 10.5% 20.8%
25-34 635 649 1,284
10.6% 10.8% 21.4%
35-44 734 698 1,432
12.2% 11.6% 23.9%
45-54 670 722 1,392
11.2% 12.0% 23.2%
55-64 293 274 567
4.9% 4.6% 9.5%
65-70 50 25 75
0.8% 0.4% 1.3%
Total 3,000 3,000 6,000
50.0% 50.0% 100.0%
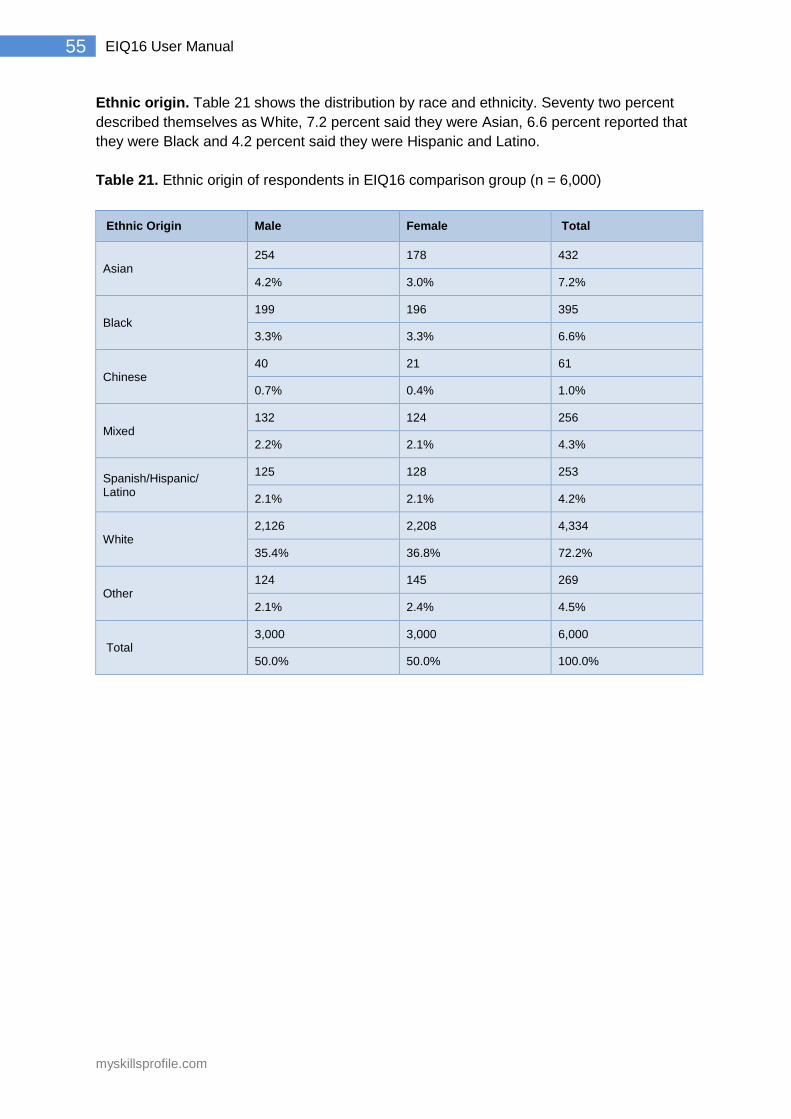
myskillsprofile.com
55 EIQ16 User Manual
Ethnic origin. Table 21 shows the distribution by race and ethnicity. Seventy two percent
described themselves as White, 7.2 percent said they were Asian, 6.6 percent reported that
they were Black and 4.2 percent said they were Hispanic and Latino.
Table 21. Ethnic origin of respondents in EIQ16 comparison group (n = 6,000)
Ethnic Origin Male Female Total
Asian 254 178 432
4.2% 3.0% 7.2%
Black 199 196 395
3.3% 3.3% 6.6%
Chinese 40 21 61
0.7% 0.4% 1.0%
Mixed 132 124 256
2.2% 2.1% 4.3%
Spanish/Hispanic/ Latino
125 128 253
2.1% 2.1% 4.2%
White 2,126 2,208 4,334
35.4% 36.8% 72.2%
Other 124 145 269
2.1% 2.4% 4.5%
Total 3,000 3,000 6,000
50.0% 50.0% 100.0%
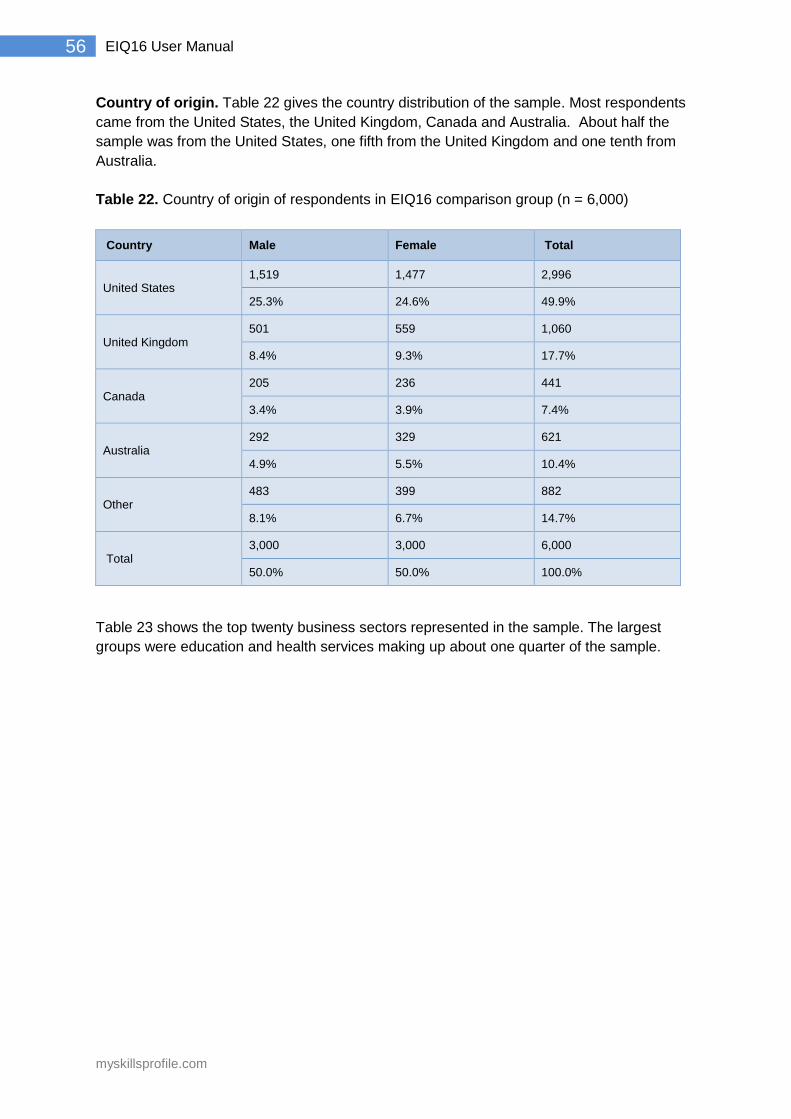
myskillsprofile.com
56 EIQ16 User Manual
Country of origin. Table 22 gives the country distribution of the sample. Most respondents
came from the United States, the United Kingdom, Canada and Australia. About half the
sample was from the United States, one fifth from the United Kingdom and one tenth from
Australia.
Table 22. Country of origin of respondents in EIQ16 comparison group (n = 6,000)
Country Male Female Total
United States 1,519 1,477 2,996
25.3% 24.6% 49.9%
United Kingdom 501 559 1,060
8.4% 9.3% 17.7%
Canada 205 236 441
3.4% 3.9% 7.4%
Australia 292 329 621
4.9% 5.5% 10.4%
Other 483 399 882
8.1% 6.7% 14.7%
Total 3,000 3,000 6,000
50.0% 50.0% 100.0%
Table 23 shows the top twenty business sectors represented in the sample. The largest
groups were education and health services making up about one quarter of the sample.
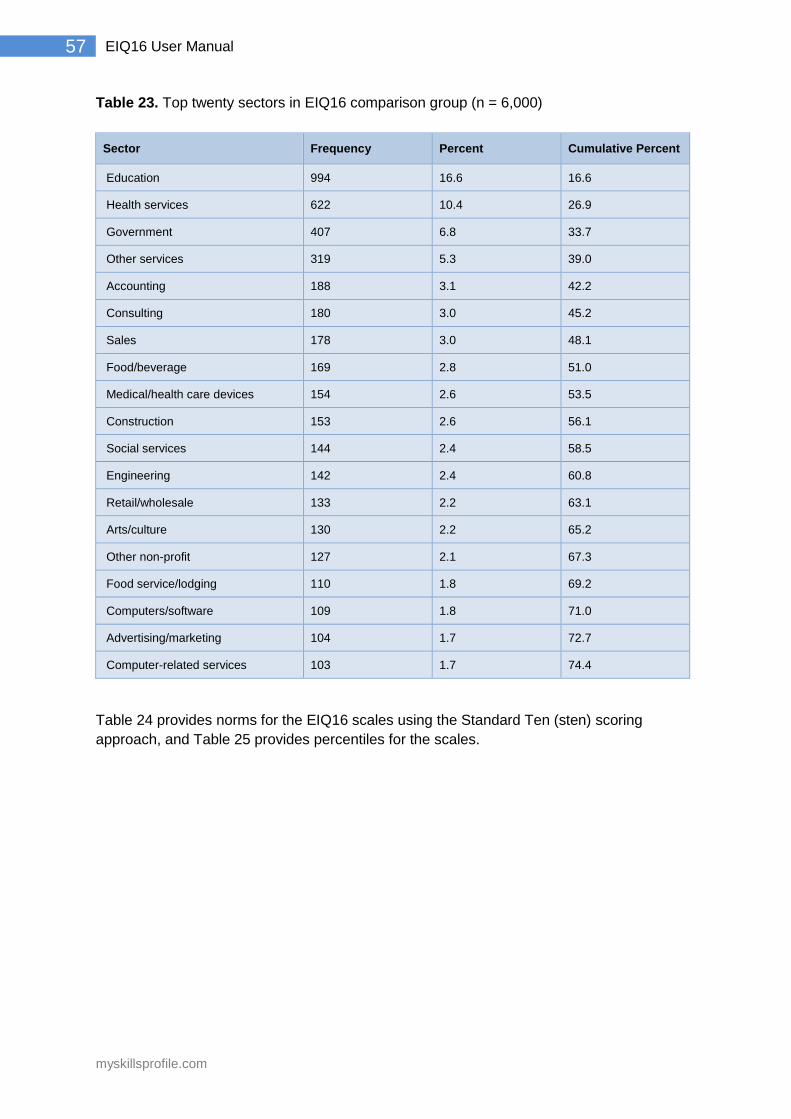
myskillsprofile.com
57 EIQ16 User Manual
Table 23. Top twenty sectors in EIQ16 comparison group (n = 6,000)
Sector Frequency Percent Cumulative Percent
Education 994 16.6 16.6
Health services 622 10.4 26.9
Government 407 6.8 33.7
Other services 319 5.3 39.0
Accounting 188 3.1 42.2
Consulting 180 3.0 45.2
Sales 178 3.0 48.1
Food/beverage 169 2.8 51.0
Medical/health care devices 154 2.6 53.5
Construction 153 2.6 56.1
Social services 144 2.4 58.5
Engineering 142 2.4 60.8
Retail/wholesale 133 2.2 63.1
Arts/culture 130 2.2 65.2
Other non-profit 127 2.1 67.3
Food service/lodging 110 1.8 69.2
Computers/software 109 1.8 71.0
Advertising/marketing 104 1.7 72.7
Computer-related services 103 1.7 74.4
Table 24 provides norms for the EIQ16 scales using the Standard Ten (sten) scoring
approach, and Table 25 provides percentiles for the scales.
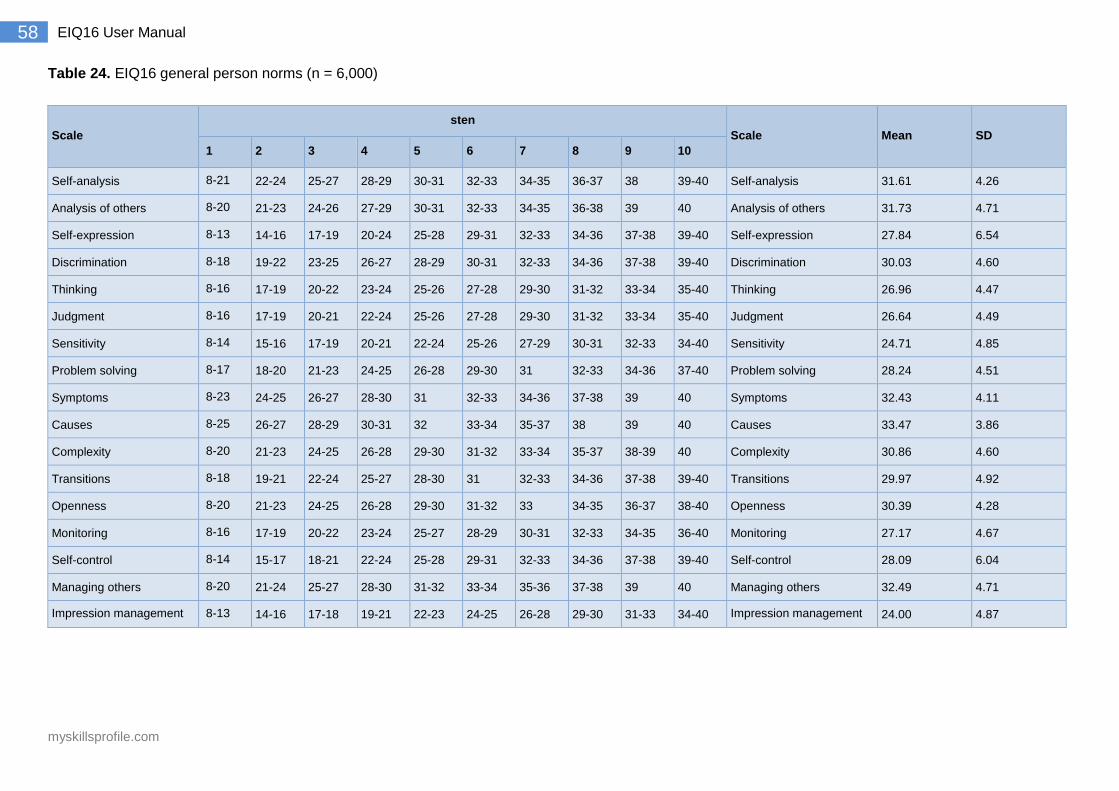
myskillsprofile.com
58 EIQ16 User Manual
Table 24. EIQ16 general person norms (n = 6,000)
Scale
sten
Scale Mean SD
1 2 3 4 5 6 7 8 9 10
Self-analysis 8-21 22-24 25-27 28-29 30-31 32-33 34-35 36-37 38 39-40 Self-analysis 31.61 4.26
Analysis of others 8-20 21-23 24-26 27-29 30-31 32-33 34-35 36-38 39 40 Analysis of others 31.73 4.71
Self-expression 8-13 14-16 17-19 20-24 25-28 29-31 32-33 34-36 37-38 39-40 Self-expression 27.84 6.54
Discrimination 8-18 19-22 23-25 26-27 28-29 30-31 32-33 34-36 37-38 39-40 Discrimination 30.03 4.60
Thinking 8-16 17-19 20-22 23-24 25-26 27-28 29-30 31-32 33-34 35-40 Thinking 26.96 4.47
Judgment 8-16 17-19 20-21 22-24 25-26 27-28 29-30 31-32 33-34 35-40 Judgment 26.64 4.49
Sensitivity 8-14 15-16 17-19 20-21 22-24 25-26 27-29 30-31 32-33 34-40 Sensitivity 24.71 4.85
Problem solving 8-17 18-20 21-23 24-25 26-28 29-30 31 32-33 34-36 37-40 Problem solving 28.24 4.51
Symptoms 8-23 24-25 26-27 28-30 31 32-33 34-36 37-38 39 40 Symptoms 32.43 4.11
Causes 8-25 26-27 28-29 30-31 32 33-34 35-37 38 39 40 Causes 33.47 3.86
Complexity 8-20 21-23 24-25 26-28 29-30 31-32 33-34 35-37 38-39 40 Complexity 30.86 4.60
Transitions 8-18 19-21 22-24 25-27 28-30 31 32-33 34-36 37-38 39-40 Transitions 29.97 4.92
Openness 8-20 21-23 24-25 26-28 29-30 31-32 33 34-35 36-37 38-40 Openness 30.39 4.28
Monitoring 8-16 17-19 20-22 23-24 25-27 28-29 30-31 32-33 34-35 36-40 Monitoring 27.17 4.67
Self-control 8-14 15-17 18-21 22-24 25-28 29-31 32-33 34-36 37-38 39-40 Self-control 28.09 6.04
Managing others 8-20 21-24 25-27 28-30 31-32 33-34 35-36 37-38 39 40 Managing others 32.49 4.71
Impression management 8-13 14-16 17-18 19-21 22-23 24-25 26-28 29-30 31-33 34-40 Impression management 24.00 4.87
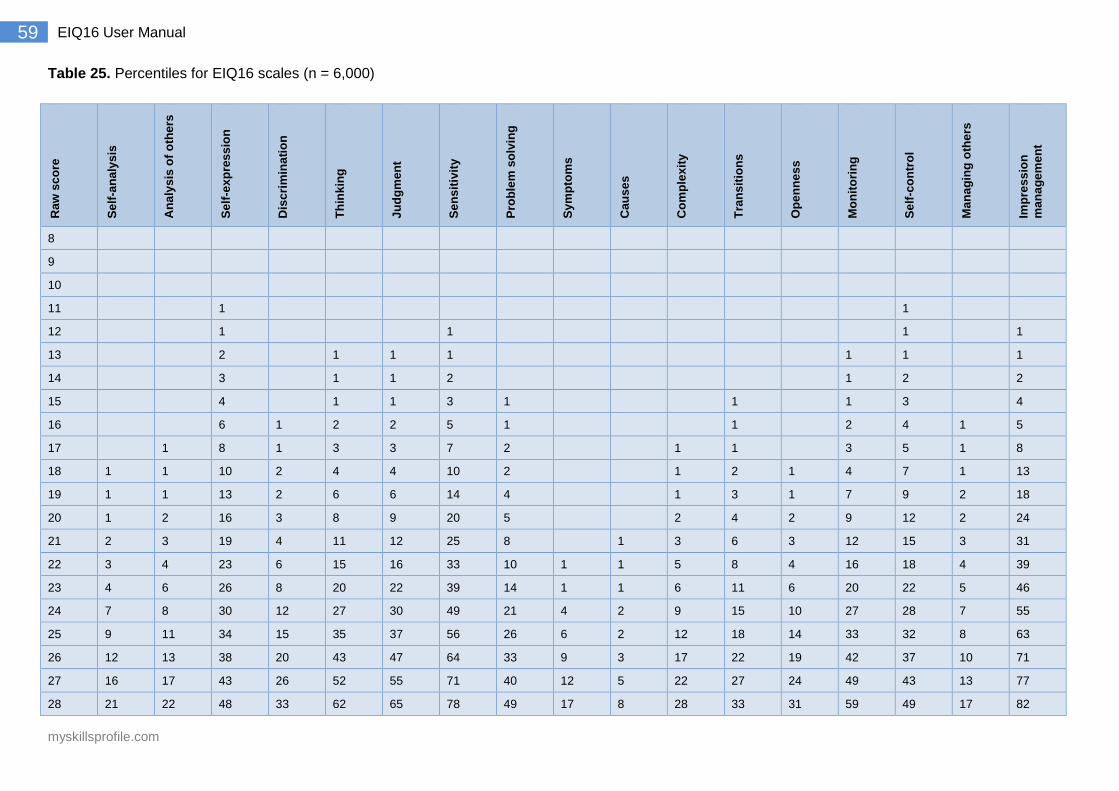
myskillsprofile.com
59 EIQ16 User Manual
Table 25. Percentiles for EIQ16 scales (n = 6,000)
Raw
sc
ore
Se
lf-a
na
lys
is
An
aly
sis
of
oth
ers
Se
lf-e
xp
res
sio
n
Dis
cri
min
ati
on
Th
ink
ing
Ju
dg
men
t
Se
ns
itiv
ity
Pro
ble
m s
olv
ing
Sy
mp
tom
s
Cau
se
s
Co
mp
lex
ity
Tra
ns
itio
ns
Op
en
ne
ss
Mo
nit
ori
ng
Se
lf-c
on
tro
l
Ma
na
gin
g o
the
rs
Imp
res
sio
n
ma
na
ge
me
nt
8
9
10
11 1 1
12 1 1 1 1
13 2 1 1 1 1 1 1
14 3 1 1 2 1 2 2
15 4 1 1 3 1 1 1 3 4
16 6 1 2 2 5 1 1 2 4 1 5
17 1 8 1 3 3 7 2 1 1 3 5 1 8
18 1 1 10 2 4 4 10 2 1 2 1 4 7 1 13
19 1 1 13 2 6 6 14 4 1 3 1 7 9 2 18
20 1 2 16 3 8 9 20 5 2 4 2 9 12 2 24
21 2 3 19 4 11 12 25 8 1 3 6 3 12 15 3 31
22 3 4 23 6 15 16 33 10 1 1 5 8 4 16 18 4 39
23 4 6 26 8 20 22 39 14 1 1 6 11 6 20 22 5 46
24 7 8 30 12 27 30 49 21 4 2 9 15 10 27 28 7 55
25 9 11 34 15 35 37 56 26 6 2 12 18 14 33 32 8 63
26 12 13 38 20 43 47 64 33 9 3 17 22 19 42 37 10 71
27 16 17 43 26 52 55 71 40 12 5 22 27 24 49 43 13 77
28 21 22 48 33 62 65 78 49 17 8 28 33 31 59 49 17 82
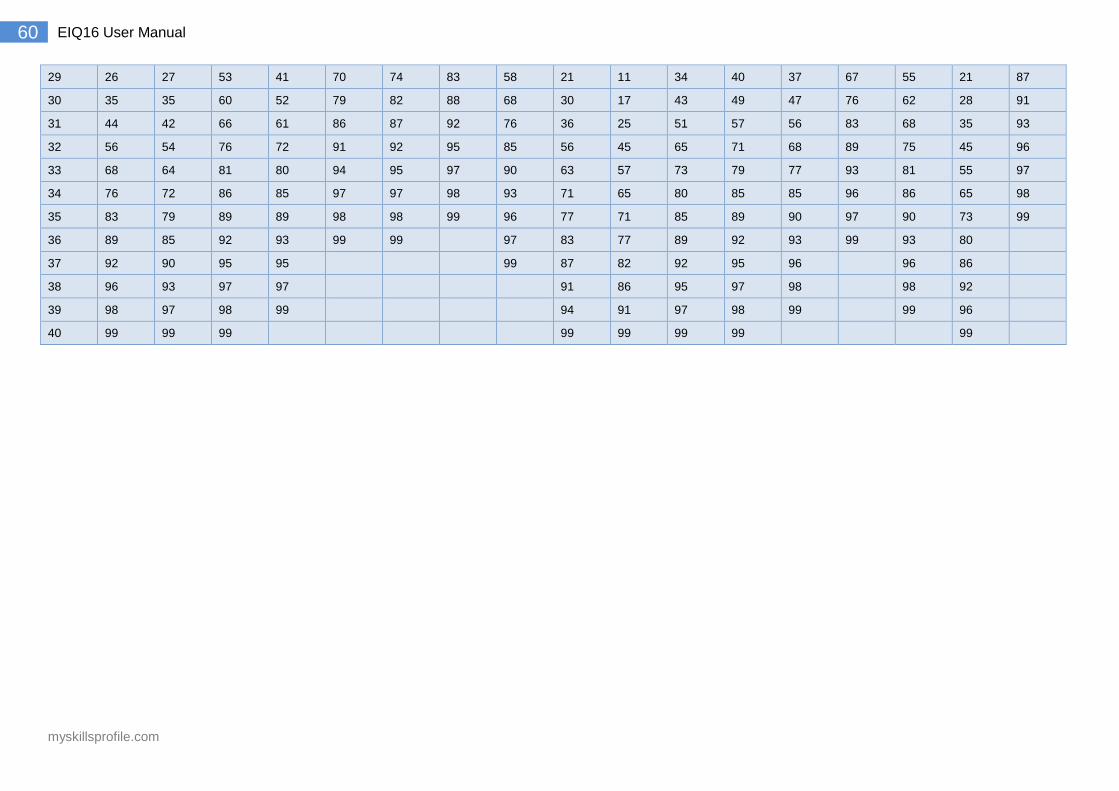
myskillsprofile.com
60 EIQ16 User Manual
29 26 27 53 41 70 74 83 58 21 11 34 40 37 67 55 21 87
30 35 35 60 52 79 82 88 68 30 17 43 49 47 76 62 28 91
31 44 42 66 61 86 87 92 76 36 25 51 57 56 83 68 35 93
32 56 54 76 72 91 92 95 85 56 45 65 71 68 89 75 45 96
33 68 64 81 80 94 95 97 90 63 57 73 79 77 93 81 55 97
34 76 72 86 85 97 97 98 93 71 65 80 85 85 96 86 65 98
35 83 79 89 89 98 98 99 96 77 71 85 89 90 97 90 73 99
36 89 85 92 93 99 99
97 83 77 89 92 93 99 93 80
37 92 90 95 95
99 87 82 92 95 96
96 86
38 96 93 97 97
91 86 95 97 98
98 92
39 98 97 98 99 94 91 97 98 99
99 96
40 99 99 99
99 99 99 99
99
myskillsprofile.com
61 EIQ16 User Manual
7.0 References
Bar-On, R. (2006). The Bar-On model of emotional-social intelligence (ESI). Psicothema, 18 , supl., 13-25. Bartram, D. (2002). EFPA Review Model for the Description and Evaluation of Psychological Tests: Notes for Reviewers: European Federation of Psychologists’ Associations. Bartram, D. (2006). The SHL Universal Competency Framework. SHL White Paper. Thames Ditton: SHL Group plc. Fan, H., Jackson, T., Yang, X., Tang, W., Zhang, J. (2010). The factor structure of the Mayer–Salovey–Caruso Emotional Intelligence Test V 2.0 (MSCEIT): A meta-analytic structural equation modeling approach. Personality and Individual Differences, 48,7, 781-785. Freudenthaler, H. H., Neubauer, A. C., Gabler, P., & Scherl, W. G. (2008). Testing the Trait Emotional Intelligence Questionnaire (TEIQue) in a German-speaking sample. Personality and Individual Differences, 45, 673-678. Goldberg, L. R., Johnson, J. A., Eber, H. W., Hogan, R., Ashton, M. C., Cloninger, C. R., & Gough, H. C. (2006). The International Personality Item Pool and the future of public-domain personality measures. Journal of Research in Personality, 40, 84-96. Goleman, D. (1998). What Makes a Leader? Harvard Business Review Harvard Business Review. International Personality Item Pool (2001). A Scientific Collaboratory for the Development of Advanced Measures of Personality Traits and Other Individual Differences. Mayer J.D., Salovey P. and Caruso D.R. (2002). Mayer-Salovey-Caruso Emotional Intelligence Test (MSCEIT). Multi-Health Systems, Inc. Toronto, Ontario. Mayer, J. D., Salovey, P., Caruso, D. R., & Sitarenios, G. (2003). Measuring emotional intelligence with the MSCEIT V2.0. Emotion, 3, 97-105. Mayer, J.D., Salovey, P., and Caruso, D.R. (2004). Emotional Intelligence: Theory, Findings and Implications. Psychological Inquiry, 15, 3, 197-215. Mikolajczak, M., Luminet, O., Leroy, C., & Roy, E. (2007). Psychometric properties of the Trait Emotional Intelligence Questionnaire. Journal of Personality Assessment, 88, 338-353. Ernest H. O'Boyle E.H., Humphrey, R.H., Pollack, J.M., Hawver, T.H. and Story, P.A. (2011). The relation between emotional intelligence and job performance: A meta-analysis. Journal of Organizational Behavior, 32, 5, 788–818. Palmer, B.R., & Stough, C. (2000). The Swinburne University Emotional Intelligence Test: Technical Manual, Published by Swinburne University of Technology.
myskillsprofile.com
62 EIQ16 User Manual
Petrides, K. V. & Furnham, A. (2001). Trait emotional intelligence: Psychometric investigation with reference to established trait taxonomies. European Journal of Personality, 15, 425-448. Petrides, K. V. (2009). Technical manual for the Trait Emotional Intelligence Questionnaires (TEIQue). London: London Psychometric Laboratory. Petrides, K. V. (2011). Ability and trait emotional intelligence. In Chamorro-Premuzic, T., Furnham, A., & von Stumm, S. (Eds.), The Blackwell-Wiley Handbook of Individual Differences. New York: Wiley. Petrides, K. V., Pita, R., & Kokkinaki, F. (2007). The location of trait emotional intelligence in personality factor space. British Journal of Psychology, 98, 273-289. Rammstedt, B., Goldberg, L. R., & Borg, I. (2010). The measurement equivalence of Big-Five
factor markers for persons with different levels of education. Journal of Research in Personality,
44, 53-61.
Rammstedt, B. & Kemper, C. J. (2011). Measurement equivalence of the Big Five: Shedding
further light on potential causes of the educational bias. Journal of Research in Personality, 45,
121-125.
Rammstedt, B., Kemper, C. J., & Borg, I. (2013). Correcting Big Five personality measurements
for acquiescence: An 18-country cross-cultural study.
European Journal of Personality, 27, 71-81.
Robertson, I. T. (1997). Personality and Work Behaviour: Keynote Address to 2nd Rossen, E., Kranzler, J.H., and Algina, J. (2008). Confirmatory factor analysis of the Mayer–Salovey–Caruso Emotional Intelligence Test V 2.0 (MSCEIT). Personality and Individual Differences, 44, 5, pages 1258–1269. Schutte, N.S., Malouff, J.M., Hall, L.E., Haggerty, D.J., Cooper, J.T., Golden, C.J., et al. (1998). Development and validation of a measure of emotional intelligence. Personality and Individual Differences, 25, 167-177. SPSS for Windows, Rel. 11.0.1. 2001. Chicago: SPSS Inc. Tabachnick, G.T. and Fidell, S. (1989). Using Multivariate Statistics. HarperCollinsPublishers, Inc.

© 2014, MySkillsProfile.com Limited. www.myskillsprofile.com.com.
EIQ16 is a trademark of MySkillsProfile.com Limited.
All rights reserved. No part of this publication may be reproduced or distributed
in any form or by any means or stored in a database or retrieval system without the prior written permission of MySkillsProfile.com Limited.