Embed Size (px)
Citation preview
May 9, 2017
ICICI Securities Ltd | Retail Equity Research
Result Update
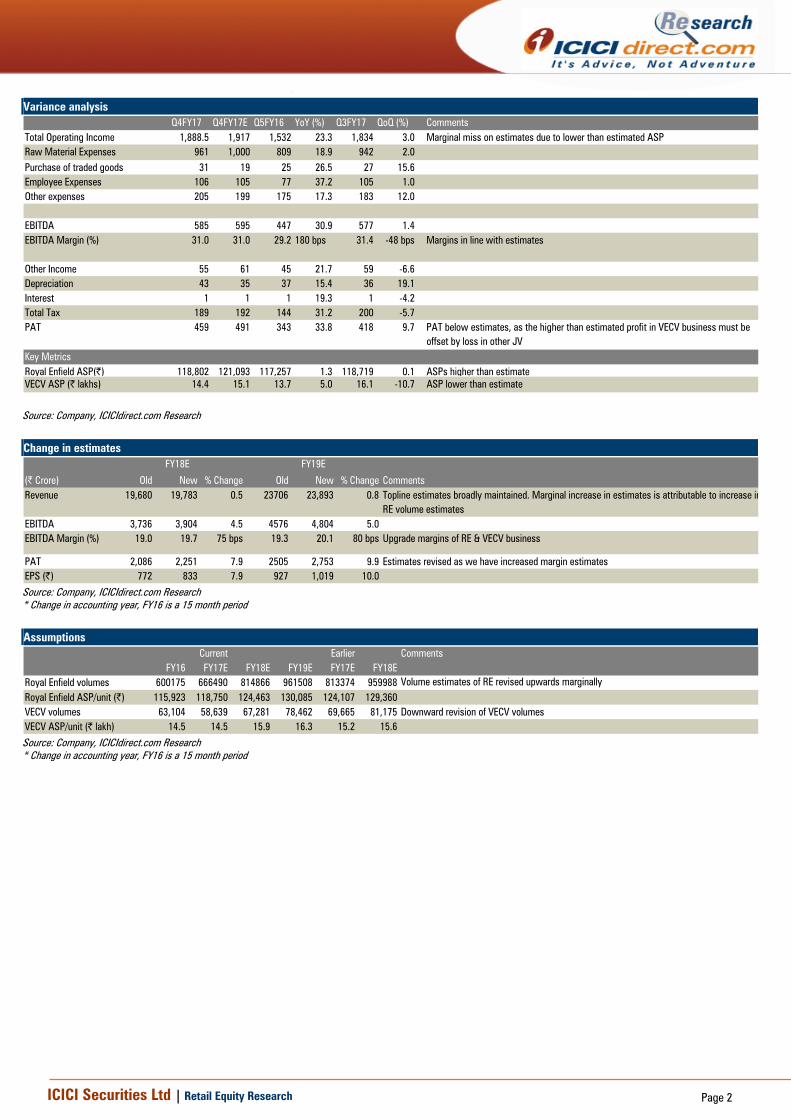
Strong performance continues... • Eicher Motors reported its Q4FY17 numbers, with the topline and
bottomline below our estimates while EBITDA margins were in line with our estimates. Post adoption of Ind-AS, VECV, considered a subsidiary under Indian GAAP, is now a joint controlled entity. Hence, it was consolidated under the equity method
• Revenues for Q3FY17 came in at | 1888.5 crore (up 23.3% YoY, 3% QoQ), marginally below our estimate of | 1917 crore. The revenue miss was due to lower than estimated ASPs in RE (2-W) business
• EBITDA came in at | 585 crore (30.9% YoY, 1.4% QoQ) against our estimate of | 595 crore. EBITDA margins were at 31% (up 180 bps YoY, down 48 bps QoQ) in line with our estimate of 31%
• RE volumes were at 1,78,345 units, up 20.8% YoY while VECV volumes grew 12.6% YoY to 17341 units
• VECV revenues came in at | 2554 crore, up 23.1% YoY, against our estimate of | 2629 crore. VECV margins came in at 8.2%, up 370 bps YoY, vs. our estimate of 6% while VECV PAT came in at | 116 crore (| 6 crore in Q5FY16) against our estimate of | 77 crore
• Consequently, consolidated PAT grew 33.8% YoY, 9.7% QoQ to | 459 crore against our estimate of | 491 crore
RE business- multiple levers for growth RE’s strong brand equity is reflected in its H2FY17 performance (marred by demonetisation) performance, where volumes grew ~29% YoY, when the 2-W industry declined 2.7% YoY. The waiting period for Classic 350 continues to be stable at two months, indicating that demand continues to outpace supply. RE has maintained its same store sales growth of 15%. Its dealer network was at 675 dealers. The company will add 150 dealers this year. EML’s current production rate of ~60,000/month will continue till the commencement of its third plant at Vallam Vadagal in August FY18. The company has guided an exit capacity of 825,000 units for FY18E. Based on demand, phase II at Vallam Vadagal can take the total capacity to ~1.2 million units. EML is looking to capture the under-penetrated 250-750 cc market globally and has already opened exclusive stores in Sao Paulo (Brazil), Colombia, two in UK, one each in UAE, France, Spain, Australia and Indonesia. We estimate volumes will grow at 20% CAGR to 961508 motorcycles in FY19E. VECV-market share gain across segments In FY14-16, VECV underperformed industry growth mainly due to concentration of VECV’s product portfolio towards intermediate commercial vehicle (ICV-7.5-12 tonne), which are mainly used as distribution vehicles (ICV forms ~39% of VECV’s product portfolio). However, in FY17, VECV outpaced industry growth in all sub-segments, thus gaining market share. VECV’s domestic volumes have grown 12.6% outpacing industry growth of 2.6% in FY17. Going ahead, we expect the next phase of growth in M&HCV to come from medium duty vehicles due to the trickle-down effect, which will benefit VECV most as it is a market leader in the ICV segment. Premium valuations for strong earnings growth visibility EML has justifiably commanded a premium over other auto OEMs as RE’s business is in full throttle and VECV reaps the benefits of an economic revival. We ascribe a multiple of 28x FY19E EPS for RE, VECV at 10x FY17E EV/EBITDA, respectively, to arrive at an SOTP target price of | 30500. We have a BUY recommendation on the stock with an upside potential of 13%.
Rating matrix Rating : BuyTarget : | 30500Target Period : 12 monthsPotential Upside : 13%
What’s Changed?
Target Changed from | 28970 to | 30500EPS FY18E Changed from | 772 to |833.2EPS FY19E Changed from | 927 to |1019Rating Unchanged
Quarterly Performance
Q4FY17 Q5FY16 YoY (%) Q3FY17 QoQ (%)Revenue 1,888.5 1,532.2 23.3 1,834.4 3.0EBITDA 584.8 446.8 30.9 576.8 1.4EBITDA (%) 31.0 29.2 359 bps 31.4 55 bpsPAT 459 343.1 33.8 418.4 9.7
Change in accounting year, FY16 is a 15 month period Key Financials | Crore FY16 FY17E FY18E FY19ENet Sales 15,429 15,601 19,783 23,893 EBITDA 2,447 2,884 3,904 4,804 Net Profit 1,278 1,772 2,251 2,753 EPS (|) 471.5 655.9 833.2 1,019.4
* Change in accounting year, FY16 is a 15 month period Valuation summary
FY16 FY17E FY18E FY19EP/E (x) 57.3 41.2 32.4 26.5 Adj. EV/E (x) 223.6 154.0 87.1 38.6 Tgt.Adj.EV/E(x) 197.7 136.2 77.1 34.2 P/BV (x) 21.1 14.8 10.9 8.2 RoNW (%) 36.9 36.0 33.6 30.9 RoCE (%) 42.4 39.2 41.1 39.1
* Change in accounting year, FY16 is a 15 month period Stock data Particular AmountMarket Capitalization | 72927 CroreTotal Debt (FY16) | 85.9 CroreCash and Investments (FY16) | 582.7 CroreEV (FY16) | 72430.1 Crore52 week H/L (|) 26964 / 18000Equity capital (| crore) | 27 CroreFace value (|) | 10
Price performance (%)
1M 3M 6M 12MEicher Motors Ltd 0.3 10.5 8.0 31.2Tata Motors Ltd -11.4 -19.7 -18.1 7.3M&M Ltd 2.4 4.8 -3.7 0.0
Eicher Motors (EICMOT) | 27000
Research Analyst
Nishit Zota
Vidrum Mehta
ICICI Securities Ltd | Retail Equity Research Page 2
Company Analysis Our demographic analysis reveals that in the coming decade (2021) we could witness the share of the 15-40 years age population declining to 60% from 64% of total driveable population (>15<70 years). We observe that the first generation Splendor (Launched 1994) driving population (15>) would have been born <1980s. The same generation in 2014 would be aged ~ 34+ highlighting that as we move into 2021 the same class of buyers would be >42+. We assume that a bulk of 2-W drivers would be young (15-40 years). Thus, we interpret the fact that as we move into the next decade, bulk of the young population i.e. (>15<30 years- Gen Z) would have been born in the nineties and beyond, thereby having vastly different purchase habits and priorities (e.g. mileage/affordability vs. brand perception/comfort to their fathers (born <1980’s- Gen Y). Royal Enfield (RE), the world’s oldest active motorcycle brand, with its uniquely classical and powerful bikes, always enjoyed cult status among bike lovers. However, in the recent past, the new Indian emerging higher middle class have taken to it with few comparables. Exhibit 1: Young India to be big buyer class in next decade
30 24 20
2728
27
1415
15
18 21 22
5 5 6
5 7 9
0%
20%
40%
60%
80%
100%
2011 2016 20210 year> 15 year> 30 year> 40 year> 60 year> 70 year>
Source: Company, CIA World Fact book, ICICIdirect.com Research Assumed 1.25% CAGR population growth
Exhibit 2: Shift in popular products preferences from Gen Y to Gen Z
Source: Company, ICICIdirect.com Research
Variance analysis Q4FY17 Q4FY17E Q5FY16 YoY (%) Q3FY17 QoQ (%) Comments
Total Operating Income 1,888.5 1,917 1,532 23.3 1,834 3.0 Marginal miss on estimates due to lower than estimated ASP Raw Material Expenses 961 1,000 809 18.9 942 2.0Purchase of traded goods 31 19 25 26.5 27 15.6Employee Expenses 106 105 77 37.2 105 1.0Other expenses 205 199 175 17.3 183 12.0
EBITDA 585 595 447 30.9 577 1.4EBITDA Margin (%) 31.0 31.0 29.2 180 bps 31.4 -48 bps Margins in line with estimates
Other Income 55 61 45 21.7 59 -6.6Depreciation 43 35 37 15.4 36 19.1Interest 1 1 1 19.3 1 -4.2Total Tax 189 192 144 31.2 200 -5.7PAT 459 491 343 33.8 418 9.7 PAT below estimates, as the higher than estimated profit in VECV business must be
offset by loss in other JVKey MetricsRoyal Enfield ASP(|) 118,802 121,093 117,257 1.3 118,719 0.1 ASPs higher than estimateVECV ASP (| lakhs) 14.4 15.1 13.7 5.0 16.1 -10.7 ASP lower than estimate
Source: Company, ICICIdirect.com Research Change in estimates
(| Crore) Old New % Change Old New % Change CommentsRevenue 19,680 19,783 0.5 23706 23,893 0.8 Topline estimates broadly maintained. Marginal increase in estimates is attributable to increase in
RE volume estimatesEBITDA 3,736 3,904 4.5 4576 4,804 5.0EBITDA Margin (%) 19.0 19.7 75 bps 19.3 20.1 80 bps Upgrade margins of RE & VECV business
PAT 2,086 2,251 7.9 2505 2,753 9.9 Estimates revised as we have increased margin estimatesEPS (|) 772 833 7.9 927 1,019 10.0
FY18E FY19E
Source: Company, ICICIdirect.com Research * Change in accounting year, FY16 is a 15 month period Assumptions
Current Earlier CommentsFY16 FY17E FY18E FY19E FY17E FY18E
Royal Enfield volumes 600175 666490 814866 961508 813374 959988 Volume estimates of RE revised upwards marginallyRoyal Enfield ASP/unit (|) 115,923 118,750 124,463 130,085 124,107 129,360VECV volumes 63,104 58,639 67,281 78,462 69,665 81,175 Downward revision of VECV volumesVECV ASP/unit (| lakh) 14.5 14.5 15.9 16.3 15.2 15.6
Source: Company, ICICIdirect.com Research * Change in accounting year, FY16 is a 15 month period
ICICI Securities Ltd | Retail Equity Research Page 3
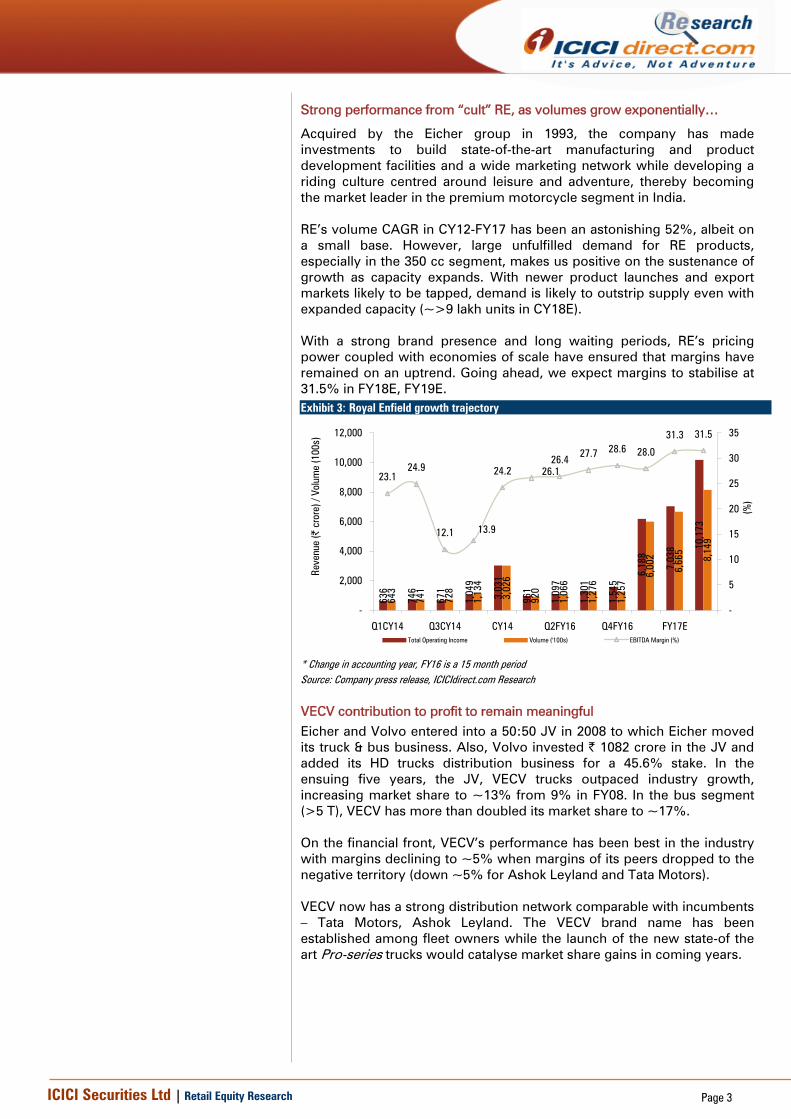
Strong performance from “cult” RE, as volumes grow exponentially…
Acquired by the Eicher group in 1993, the company has made investments to build state-of-the-art manufacturing and product development facilities and a wide marketing network while developing a riding culture centred around leisure and adventure, thereby becoming the market leader in the premium motorcycle segment in India. RE’s volume CAGR in CY12-FY17 has been an astonishing 52%, albeit on a small base. However, large unfulfilled demand for RE products, especially in the 350 cc segment, makes us positive on the sustenance of growth as capacity expands. With newer product launches and export markets likely to be tapped, demand is likely to outstrip supply even with expanded capacity (~>9 lakh units in CY18E). With a strong brand presence and long waiting periods, RE’s pricing power coupled with economies of scale have ensured that margins have remained on an uptrend. Going ahead, we expect margins to stabilise at 31.5% in FY18E, FY19E.
VECV contribution to profit to remain meaningful Eicher and Volvo entered into a 50:50 JV in 2008 to which Eicher moved its truck & bus business. Also, Volvo invested | 1082 crore in the JV and added its HD trucks distribution business for a 45.6% stake. In the ensuing five years, the JV, VECV trucks outpaced industry growth, increasing market share to ~13% from 9% in FY08. In the bus segment (>5 T), VECV has more than doubled its market share to ~17%. On the financial front, VECV’s performance has been best in the industry with margins declining to ~5% when margins of its peers dropped to the negative territory (down ~5% for Ashok Leyland and Tata Motors). VECV now has a strong distribution network comparable with incumbents – Tata Motors, Ashok Leyland. The VECV brand name has been established among fleet owners while the launch of the new state-of the art Pro-series trucks would catalyse market share gains in coming years.
Exhibit 3: Royal Enfield growth trajectory
636
746
671 3,03
1
961
1,09
7
1,30
1
1,54
5
6,18
8
7,03
8 10,1
73
643
741
728 3,02
6
920
1,06
6
1,27
6
1,25
7
6,00
2
6,66
5
8,14
9
1,04
91,
134
23.124.9
12.1
24.226.4 27.7 28.6 28.0
31.3 31.5
13.9
26.1
-
2,000
4,000
6,000
8,000
10,000
12,000
Q1CY14 Q3CY14 CY14 Q2FY16 Q4FY16 FY17E
Reve
nue
(| c
rore
) / V
olum
e (1
00s)
-
5
10
15
20
25
30
35
(%)
Total Operating Income Volume ('100s) EBITDA Margin (%)
* Change in accounting year, FY16 is a 15 month period Source: Company press release, ICICIdirect.com Research
ICICI Securities Ltd | Retail Equity Research Page 4
Strong overall financial performance
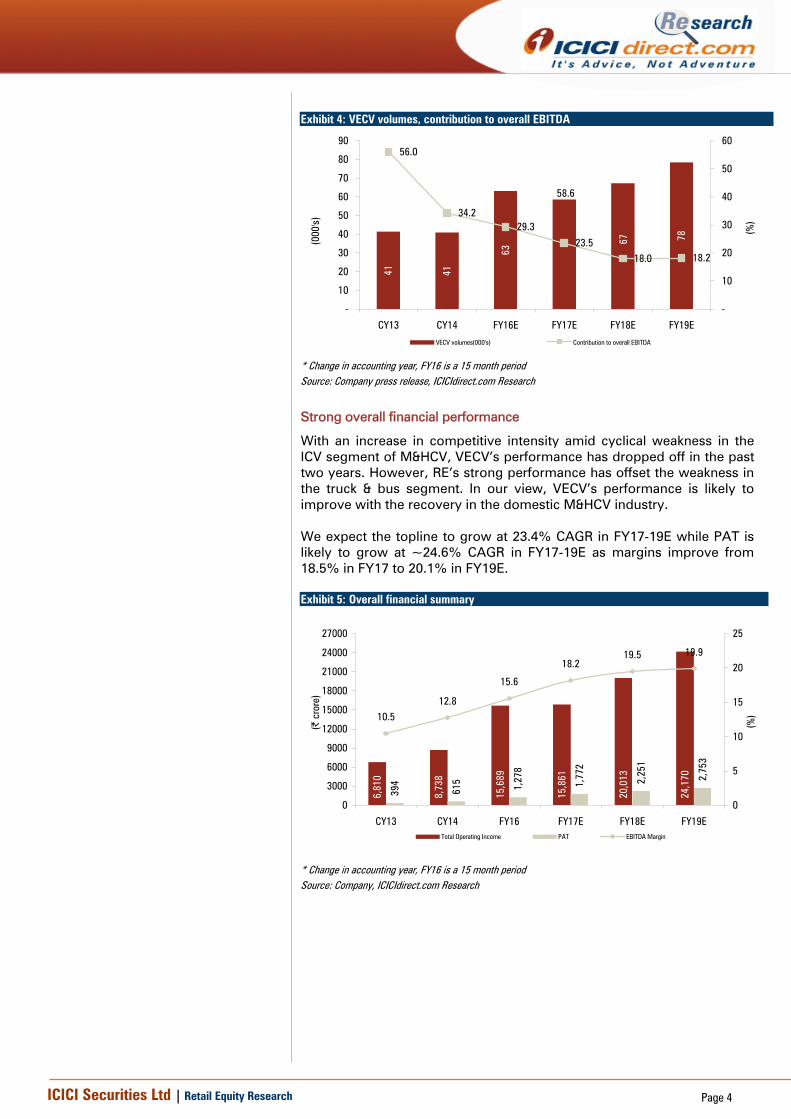
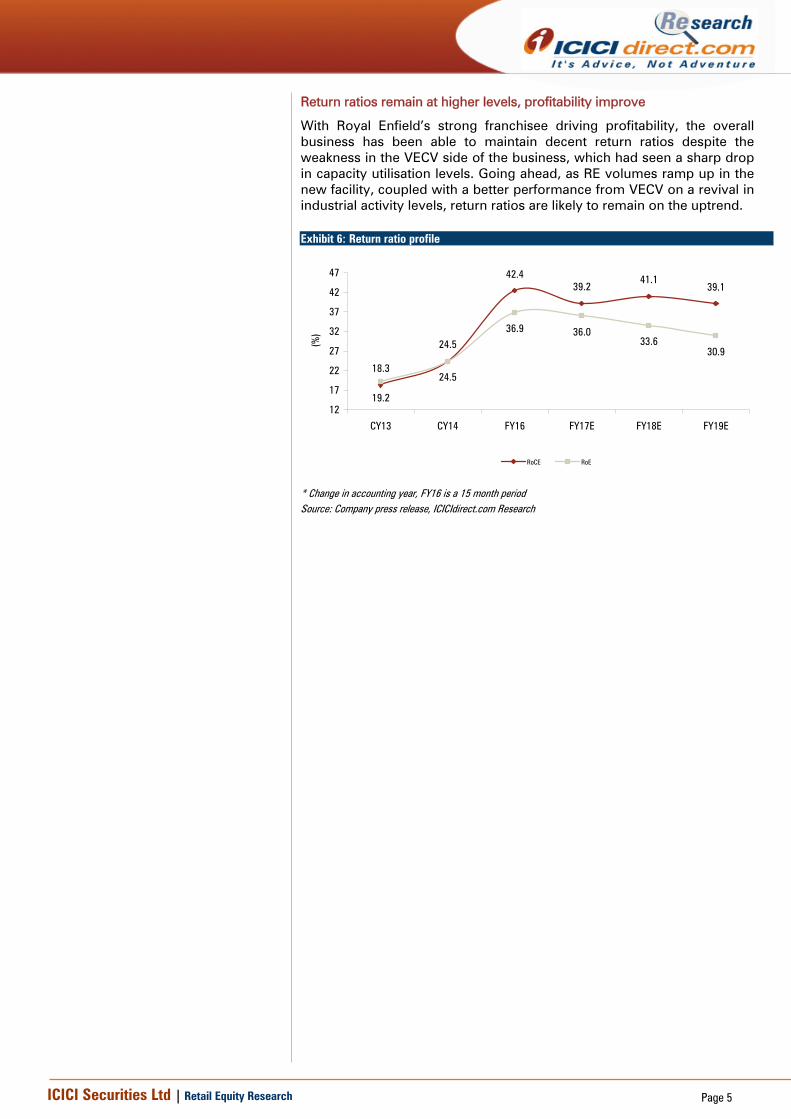
With an increase in competitive intensity amid cyclical weakness in the ICV segment of M&HCV, VECV’s performance has dropped off in the past two years. However, RE’s strong performance has offset the weakness in the truck & bus segment. In our view, VECV’s performance is likely to improve with the recovery in the domestic M&HCV industry. We expect the topline to grow at 23.4% CAGR in FY17-19E while PAT is likely to grow at ~24.6% CAGR in FY17-19E as margins improve from 18.5% in FY17 to 20.1% in FY19E. Exhibit 5: Overall financial summary
6,81
0
8,73
8
15,6
89
15,8
61
20,0
13
24,1
70
394
615 1,27
8
1,77
2
2,25
1
2,75
310.5
12.8
15.6
18.219.5 19.9
0
3000
6000
9000
12000
15000
18000
21000
24000
27000
CY13 CY14 FY16 FY17E FY18E FY19E
(| c
rore
)
0
5
10
15
20
25
(%)
Total Operating Income PAT EBITDA Margin
* Change in accounting year, FY16 is a 15 month period Source: Company, ICICIdirect.com Research
Exhibit 4: VECV volumes, contribution to overall EBITDA
41 41
63
78
58.6
67
56.0
34.229.3
23.518.0 18.2
-
10
20
30
40
50
60
70
80
90
CY13 CY14 FY16E FY17E FY18E FY19E(0
00's)
-
10
20
30
40
50
60
(%)
VECV volumes(000's) Contribution to overall EBITDA
* Change in accounting year, FY16 is a 15 month period Source: Company press release, ICICIdirect.com Research
ICICI Securities Ltd | Retail Equity Research Page 5
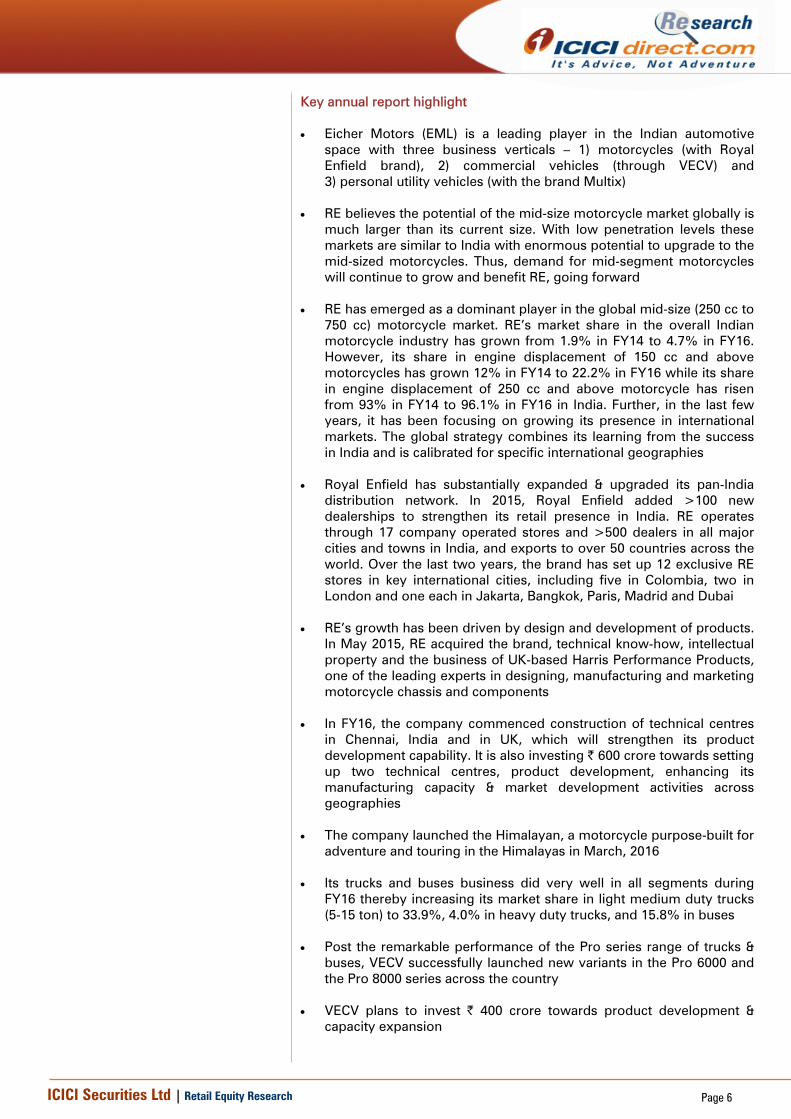
Return ratios remain at higher levels, profitability improve
With Royal Enfield’s strong franchisee driving profitability, the overall business has been able to maintain decent return ratios despite the weakness in the VECV side of the business, which had seen a sharp drop in capacity utilisation levels. Going ahead, as RE volumes ramp up in the new facility, coupled with a better performance from VECV on a revival in industrial activity levels, return ratios are likely to remain on the uptrend.
Exhibit 6: Return ratio profile
18.3
19.2
24.5
42.439.2
41.139.1
24.5
36.9 36.033.6
30.9
12
17
22
27
32
37
42
47
CY13 CY14 FY16 FY17E FY18E FY19E
(%)
RoCE RoE
* Change in accounting year, FY16 is a 15 month period Source: Company press release, ICICIdirect.com Research
ICICI Securities Ltd | Retail Equity Research Page 6
Key annual report highlight • Eicher Motors (EML) is a leading player in the Indian automotive
space with three business verticals – 1) motorcycles (with Royal Enfield brand), 2) commercial vehicles (through VECV) and 3) personal utility vehicles (with the brand Multix)
• RE believes the potential of the mid-size motorcycle market globally is
much larger than its current size. With low penetration levels these markets are similar to India with enormous potential to upgrade to the mid-sized motorcycles. Thus, demand for mid-segment motorcycles will continue to grow and benefit RE, going forward
• RE has emerged as a dominant player in the global mid-size (250 cc to
750 cc) motorcycle market. RE’s market share in the overall Indian motorcycle industry has grown from 1.9% in FY14 to 4.7% in FY16. However, its share in engine displacement of 150 cc and above motorcycles has grown 12% in FY14 to 22.2% in FY16 while its share in engine displacement of 250 cc and above motorcycle has risen from 93% in FY14 to 96.1% in FY16 in India. Further, in the last few years, it has been focusing on growing its presence in international markets. The global strategy combines its learning from the success in India and is calibrated for specific international geographies
• Royal Enfield has substantially expanded & upgraded its pan-India
distribution network. In 2015, Royal Enfield added >100 new dealerships to strengthen its retail presence in India. RE operates through 17 company operated stores and >500 dealers in all major cities and towns in India, and exports to over 50 countries across the world. Over the last two years, the brand has set up 12 exclusive RE stores in key international cities, including five in Colombia, two in London and one each in Jakarta, Bangkok, Paris, Madrid and Dubai
• RE’s growth has been driven by design and development of products.
In May 2015, RE acquired the brand, technical know-how, intellectual property and the business of UK-based Harris Performance Products, one of the leading experts in designing, manufacturing and marketing motorcycle chassis and components
• In FY16, the company commenced construction of technical centres
in Chennai, India and in UK, which will strengthen its product development capability. It is also investing | 600 crore towards setting up two technical centres, product development, enhancing its manufacturing capacity & market development activities across geographies
• The company launched the Himalayan, a motorcycle purpose-built for
adventure and touring in the Himalayas in March, 2016 • Its trucks and buses business did very well in all segments during
FY16 thereby increasing its market share in light medium duty trucks (5-15 ton) to 33.9%, 4.0% in heavy duty trucks, and 15.8% in buses
• Post the remarkable performance of the Pro series range of trucks &
buses, VECV successfully launched new variants in the Pro 6000 and the Pro 8000 series across the country
• VECV plans to invest | 400 crore towards product development &
capacity expansion
ICICI Securities Ltd | Retail Equity Research Page 7
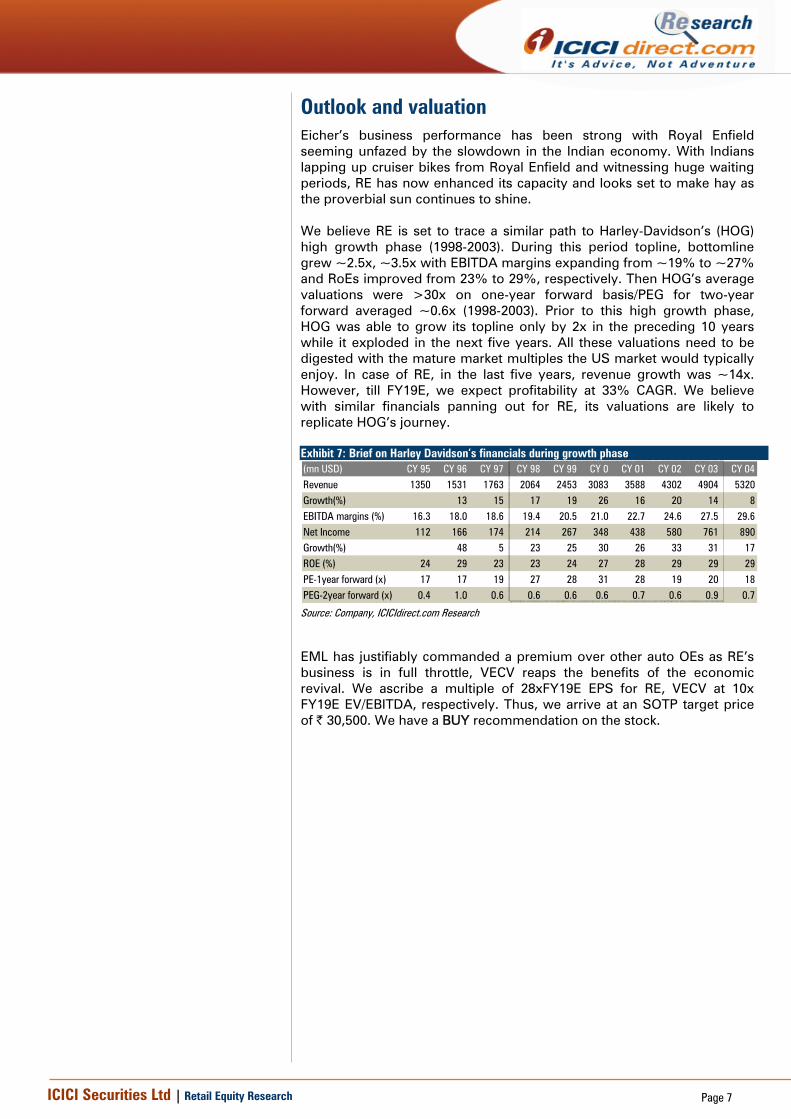
Outlook and valuation Eicher’s business performance has been strong with Royal Enfield seeming unfazed by the slowdown in the Indian economy. With Indians lapping up cruiser bikes from Royal Enfield and witnessing huge waiting periods, RE has now enhanced its capacity and looks set to make hay as the proverbial sun continues to shine. We believe RE is set to trace a similar path to Harley-Davidson’s (HOG) high growth phase (1998-2003). During this period topline, bottomline grew ~2.5x, ~3.5x with EBITDA margins expanding from ~19% to ~27% and RoEs improved from 23% to 29%, respectively. Then HOG’s average valuations were >30x on one-year forward basis/PEG for two-year forward averaged ~0.6x (1998-2003). Prior to this high growth phase, HOG was able to grow its topline only by 2x in the preceding 10 years while it exploded in the next five years. All these valuations need to be digested with the mature market multiples the US market would typically enjoy. In case of RE, in the last five years, revenue growth was ~14x. However, till FY19E, we expect profitability at 33% CAGR. We believe with similar financials panning out for RE, its valuations are likely to replicate HOG’s journey. Exhibit 7: Brief on Harley Davidson’s financials during growth phase (mn USD) CY 95 CY 96 CY 97 CY 98 CY 99 CY 0 CY 01 CY 02 CY 03 CY 04Revenue 1350 1531 1763 2064 2453 3083 3588 4302 4904 5320Growth(%) 13 15 17 19 26 16 20 14 8EBITDA margins (%) 16.3 18.0 18.6 19.4 20.5 21.0 22.7 24.6 27.5 29.6Net Income 112 166 174 214 267 348 438 580 761 890Growth(%) 48 5 23 25 30 26 33 31 17ROE (%) 24 29 23 23 24 27 28 29 29 29PE-1year forward (x) 17 17 19 27 28 31 28 19 20 18PEG-2year forward (x) 0.4 1.0 0.6 0.6 0.6 0.6 0.7 0.6 0.9 0.7
Source: Company, ICICIdirect.com Research
EML has justifiably commanded a premium over other auto OEs as RE’s business is in full throttle, VECV reaps the benefits of the economic revival. We ascribe a multiple of 28xFY19E EPS for RE, VECV at 10x FY19E EV/EBITDA, respectively. Thus, we arrive at an SOTP target price of | 30,500. We have a BUY recommendation on the stock.
ICICI Securities Ltd | Retail Equity Research Page 8
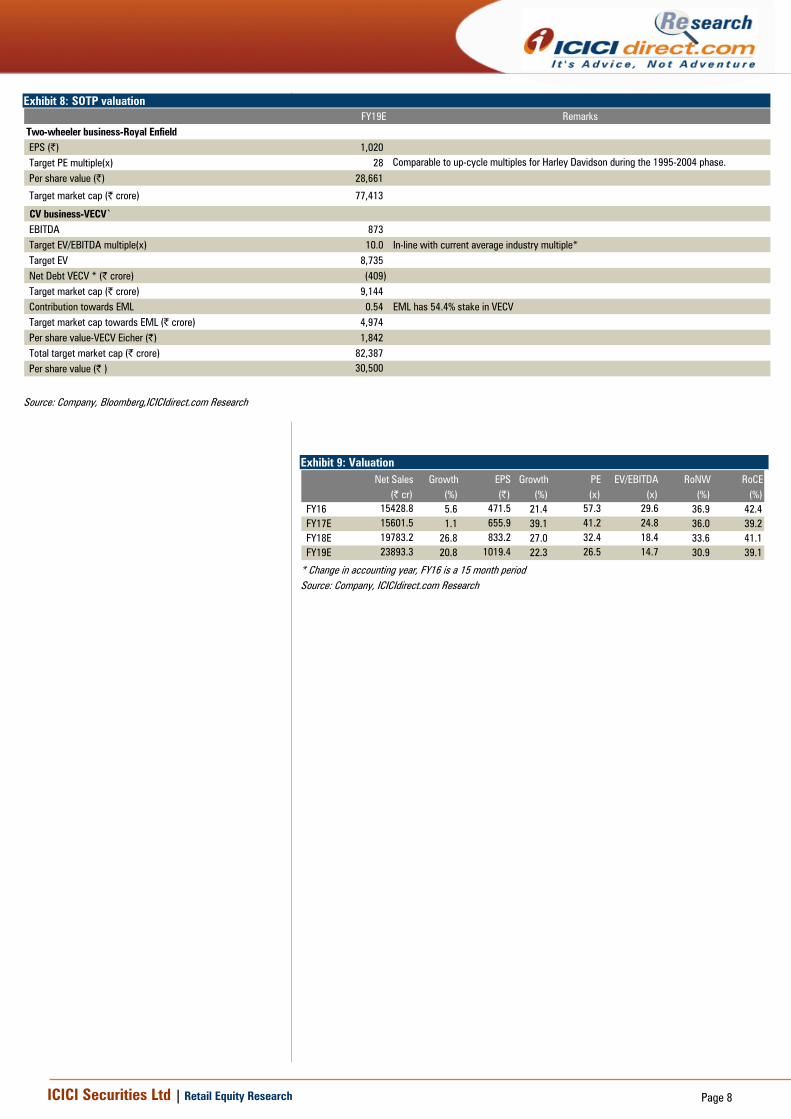
Exhibit 8: SOTP valuation FY19E Remarks
Two-wheeler business-Royal EnfieldEPS (|) 1,020 Target PE multiple(x) 28 Comparable to up-cycle multiples for Harley Davidson during the 1995-2004 phase.
Per share value (|) 28,661
Target market cap (| crore) 77,413
CV business-VECV`EBITDA 873 Target EV/EBITDA multiple(x) 10.0 In-line with current average industry multiple*Target EV 8,735 Net Debt VECV * (| crore) (409) Target market cap (| crore) 9,144 Contribution towards EML 0.54 EML has 54.4% stake in VECVTarget market cap towards EML (| crore) 4,974 Per share value-VECV Eicher (|) 1,842 Total target market cap (| crore) 82,387 Per share value (| ) 30,500
Source: Company, Bloomberg,ICICIdirect.com Research
Exhibit 9: Valuation
Net Sales Growth EPS Growth PE EV/EBITDA RoNW RoCE (| cr) (%) (|) (%) (x) (x) (%) (%)
FY16 15428.8 5.6 471.5 21.4 57.3 29.6 36.9 42.4FY17E 15601.5 1.1 655.9 39.1 41.2 24.8 36.0 39.2FY18E 19783.2 26.8 833.2 27.0 32.4 18.4 33.6 41.1FY19E 23893.3 20.8 1019.4 22.3 26.5 14.7 30.9 39.1
* Change in accounting year, FY16 is a 15 month period Source: Company, ICICIdirect.com Research
ICICI Securities Ltd | Retail Equity Research Page 9
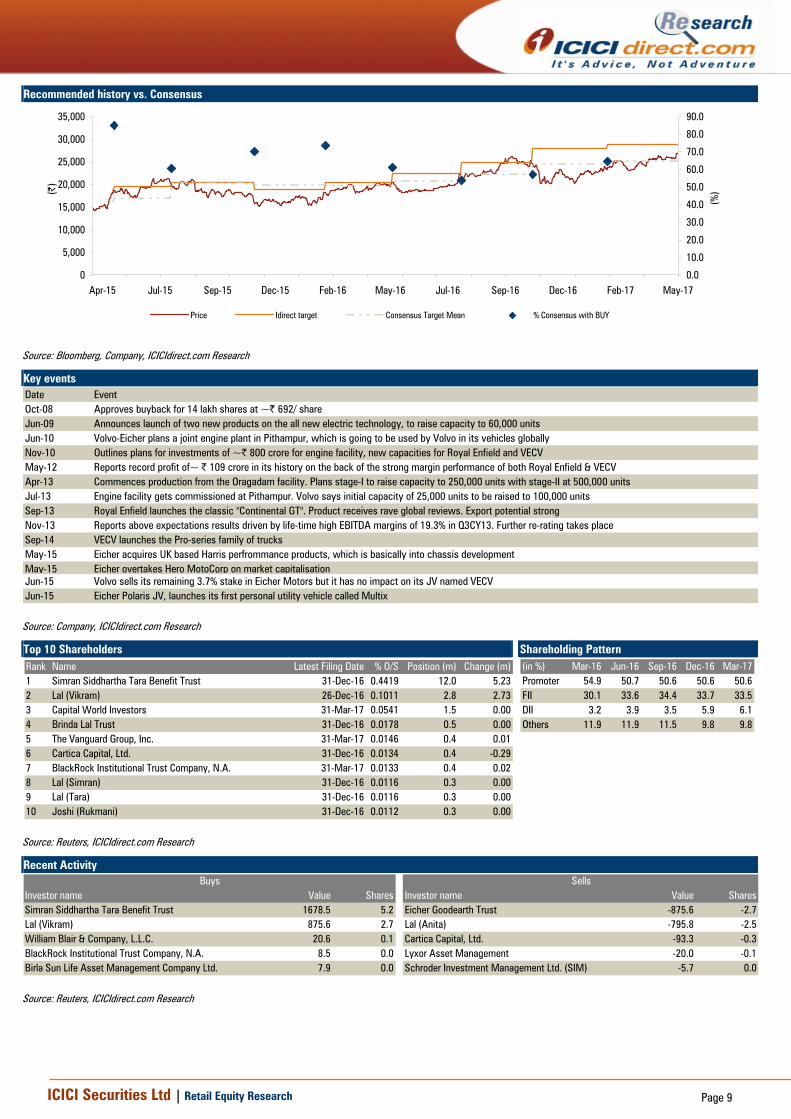
Recommended history vs. Consensus
0
5,000
10,000
15,000
20,000
25,000
30,000
35,000
May-17Feb-17Dec-16Sep-16Jul-16May-16Feb-16Dec-15Sep-15Jul-15Apr-15
(|)
0.0
10.0
20.0
30.0
40.0
50.0
60.0
70.0
80.0
90.0
(%)
Price Idirect target Consensus Target Mean % Consensus with BUY
Source: Bloomberg, Company, ICICIdirect.com Research
Key events Date EventOct-08 Approves buyback for 14 lakh shares at ~| 692/ shareJun-09 Announces launch of two new products on the all new electric technology, to raise capacity to 60,000 unitsJun-10 Volvo-Eicher plans a joint engine plant in Pithampur, which is going to be used by Volvo in its vehicles globallyNov-10 Outlines plans for investments of ~| 800 crore for engine facility, new capacities for Royal Enfield and VECVMay-12 Reports record profit of~ | 109 crore in its history on the back of the strong margin performance of both Royal Enfield & VECVApr-13 Commences production from the Oragadam facility. Plans stage-I to raise capacity to 250,000 units with stage-II at 500,000 unitsJul-13 Engine facility gets commissioned at Pithampur. Volvo says initial capacity of 25,000 units to be raised to 100,000 unitsSep-13 Royal Enfield launches the classic "Continental GT". Product receives rave global reviews. Export potential strongNov-13 Reports above expectations results driven by life-time high EBITDA margins of 19.3% in Q3CY13. Further re-rating takes placeSep-14 VECV launches the Pro-series family of trucksMay-15 Eicher acquires UK based Harris perfrommance products, which is basically into chassis developmentMay-15 Eicher overtakes Hero MotoCorp on market capitalisationJun-15 Volvo sells its remaining 3.7% stake in Eicher Motors but it has no impact on its JV named VECVJun-15 Eicher Polaris JV, launches its first personal utility vehicle called Multix
Source: Company, ICICIdirect.com Research
Top 10 Shareholders Shareholding Pattern Rank Name Latest Filing Date % O/S Position (m) Change (m)1 Simran Siddhartha Tara Benefit Trust 31-Dec-16 0.4419 12.0 5.232 Lal (Vikram) 26-Dec-16 0.1011 2.8 2.733 Capital World Investors 31-Mar-17 0.0541 1.5 0.004 Brinda Lal Trust 31-Dec-16 0.0178 0.5 0.005 The Vanguard Group, Inc. 31-Mar-17 0.0146 0.4 0.016 Cartica Capital, Ltd. 31-Dec-16 0.0134 0.4 -0.297 BlackRock Institutional Trust Company, N.A. 31-Mar-17 0.0133 0.4 0.028 Lal (Simran) 31-Dec-16 0.0116 0.3 0.009 Lal (Tara) 31-Dec-16 0.0116 0.3 0.0010 Joshi (Rukmani) 31-Dec-16 0.0112 0.3 0.00
(in %) Mar-16 Jun-16 Sep-16 Dec-16 Mar-17Promoter 54.9 50.7 50.6 50.6 50.6FII 30.1 33.6 34.4 33.7 33.5DII 3.2 3.9 3.5 5.9 6.1Others 11.9 11.9 11.5 9.8 9.8
Source: Reuters, ICICIdirect.com Research
Recent Activity
Investor name Value Shares Investor name Value SharesSimran Siddhartha Tara Benefit Trust 1678.5 5.2 Eicher Goodearth Trust -875.6 -2.7Lal (Vikram) 875.6 2.7 Lal (Anita) -795.8 -2.5William Blair & Company, L.L.C. 20.6 0.1 Cartica Capital, Ltd. -93.3 -0.3BlackRock Institutional Trust Company, N.A. 8.5 0.0 Lyxor Asset Management -20.0 -0.1Birla Sun Life Asset Management Company Ltd. 7.9 0.0 Schroder Investment Management Ltd. (SIM) -5.7 0.0
Buys Sells
Source: Reuters, ICICIdirect.com Research
ICICI Securities Ltd | Retail Equity Research Page 10
.
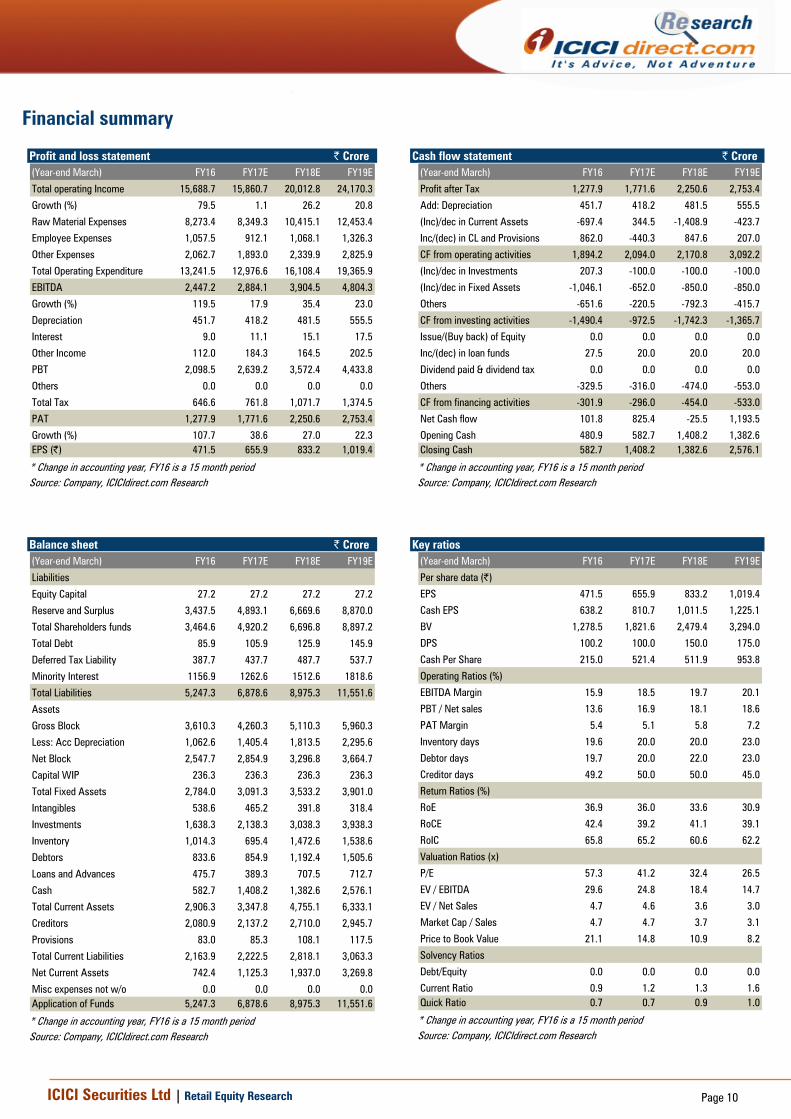
Financial summary
Profit and loss statement | Crore (Year-end March) FY16 FY17E FY18E FY19E
Total operating Income 15,688.7 15,860.7 20,012.8 24,170.3
Growth (%) 79.5 1.1 26.2 20.8
Raw Material Expenses 8,273.4 8,349.3 10,415.1 12,453.4
Employee Expenses 1,057.5 912.1 1,068.1 1,326.3
Other Expenses 2,062.7 1,893.0 2,339.9 2,825.9
Total Operating Expenditure 13,241.5 12,976.6 16,108.4 19,365.9
EBITDA 2,447.2 2,884.1 3,904.5 4,804.3
Growth (%) 119.5 17.9 35.4 23.0
Depreciation 451.7 418.2 481.5 555.5
Interest 9.0 11.1 15.1 17.5
Other Income 112.0 184.3 164.5 202.5
PBT 2,098.5 2,639.2 3,572.4 4,433.8
Others 0.0 0.0 0.0 0.0
Total Tax 646.6 761.8 1,071.7 1,374.5
PAT 1,277.9 1,771.6 2,250.6 2,753.4
Growth (%) 107.7 38.6 27.0 22.3EPS (|) 471.5 655.9 833.2 1,019.4
* Change in accounting year, FY16 is a 15 month period Source: Company, ICICIdirect.com Research
Cash flow statement | Crore(Year-end March) FY16 FY17E FY18E FY19E
Profit after Tax 1,277.9 1,771.6 2,250.6 2,753.4
Add: Depreciation 451.7 418.2 481.5 555.5
(Inc)/dec in Current Assets -697.4 344.5 -1,408.9 -423.7
Inc/(dec) in CL and Provisions 862.0 -440.3 847.6 207.0
CF from operating activities 1,894.2 2,094.0 2,170.8 3,092.2
(Inc)/dec in Investments 207.3 -100.0 -100.0 -100.0
(Inc)/dec in Fixed Assets -1,046.1 -652.0 -850.0 -850.0
Others -651.6 -220.5 -792.3 -415.7
CF from investing activities -1,490.4 -972.5 -1,742.3 -1,365.7
Issue/(Buy back) of Equity 0.0 0.0 0.0 0.0
Inc/(dec) in loan funds 27.5 20.0 20.0 20.0
Dividend paid & dividend tax 0.0 0.0 0.0 0.0
Others -329.5 -316.0 -474.0 -553.0
CF from financing activities -301.9 -296.0 -454.0 -533.0
Net Cash flow 101.8 825.4 -25.5 1,193.5
Opening Cash 480.9 582.7 1,408.2 1,382.6Closing Cash 582.7 1,408.2 1,382.6 2,576.1
* Change in accounting year, FY16 is a 15 month period Source: Company, ICICIdirect.com Research
Balance sheet | Crore (Year-end March) FY16 FY17E FY18E FY19E
Liabilities
Equity Capital 27.2 27.2 27.2 27.2
Reserve and Surplus 3,437.5 4,893.1 6,669.6 8,870.0
Total Shareholders funds 3,464.6 4,920.2 6,696.8 8,897.2
Total Debt 85.9 105.9 125.9 145.9
Deferred Tax Liability 387.7 437.7 487.7 537.7
Minority Interest 1156.9 1262.6 1512.6 1818.6
Total Liabilities 5,247.3 6,878.6 8,975.3 11,551.6
Assets
Gross Block 3,610.3 4,260.3 5,110.3 5,960.3
Less: Acc Depreciation 1,062.6 1,405.4 1,813.5 2,295.6
Net Block 2,547.7 2,854.9 3,296.8 3,664.7
Capital WIP 236.3 236.3 236.3 236.3
Total Fixed Assets 2,784.0 3,091.3 3,533.2 3,901.0
Intangibles 538.6 465.2 391.8 318.4
Investments 1,638.3 2,138.3 3,038.3 3,938.3
Inventory 1,014.3 695.4 1,472.6 1,538.6
Debtors 833.6 854.9 1,192.4 1,505.6
Loans and Advances 475.7 389.3 707.5 712.7
Cash 582.7 1,408.2 1,382.6 2,576.1
Total Current Assets 2,906.3 3,347.8 4,755.1 6,333.1
Creditors 2,080.9 2,137.2 2,710.0 2,945.7
Provisions 83.0 85.3 108.1 117.5
Total Current Liabilities 2,163.9 2,222.5 2,818.1 3,063.3
Net Current Assets 742.4 1,125.3 1,937.0 3,269.8
Misc expenses not w/o 0.0 0.0 0.0 0.0Application of Funds 5,247.3 6,878.6 8,975.3 11,551.6
* Change in accounting year, FY16 is a 15 month period Source: Company, ICICIdirect.com Research
Key ratios (Year-end March) FY16 FY17E FY18E FY19E
Per share data (|)
EPS 471.5 655.9 833.2 1,019.4
Cash EPS 638.2 810.7 1,011.5 1,225.1
BV 1,278.5 1,821.6 2,479.4 3,294.0
DPS 100.2 100.0 150.0 175.0
Cash Per Share 215.0 521.4 511.9 953.8
Operating Ratios (%)
EBITDA Margin 15.9 18.5 19.7 20.1
PBT / Net sales 13.6 16.9 18.1 18.6
PAT Margin 5.4 5.1 5.8 7.2
Inventory days 19.6 20.0 20.0 23.0
Debtor days 19.7 20.0 22.0 23.0
Creditor days 49.2 50.0 50.0 45.0
Return Ratios (%)
RoE 36.9 36.0 33.6 30.9
RoCE 42.4 39.2 41.1 39.1
RoIC 65.8 65.2 60.6 62.2
Valuation Ratios (x)
P/E 57.3 41.2 32.4 26.5
EV / EBITDA 29.6 24.8 18.4 14.7
EV / Net Sales 4.7 4.6 3.6 3.0
Market Cap / Sales 4.7 4.7 3.7 3.1
Price to Book Value 21.1 14.8 10.9 8.2
Solvency Ratios
Debt/Equity 0.0 0.0 0.0 0.0
Current Ratio 0.9 1.2 1.3 1.6Quick Ratio 0.7 0.7 0.9 1.0
* Change in accounting year, FY16 is a 15 month period Source: Company, ICICIdirect.com Research
ICICI Securities Ltd | Retail Equity Research Page 11
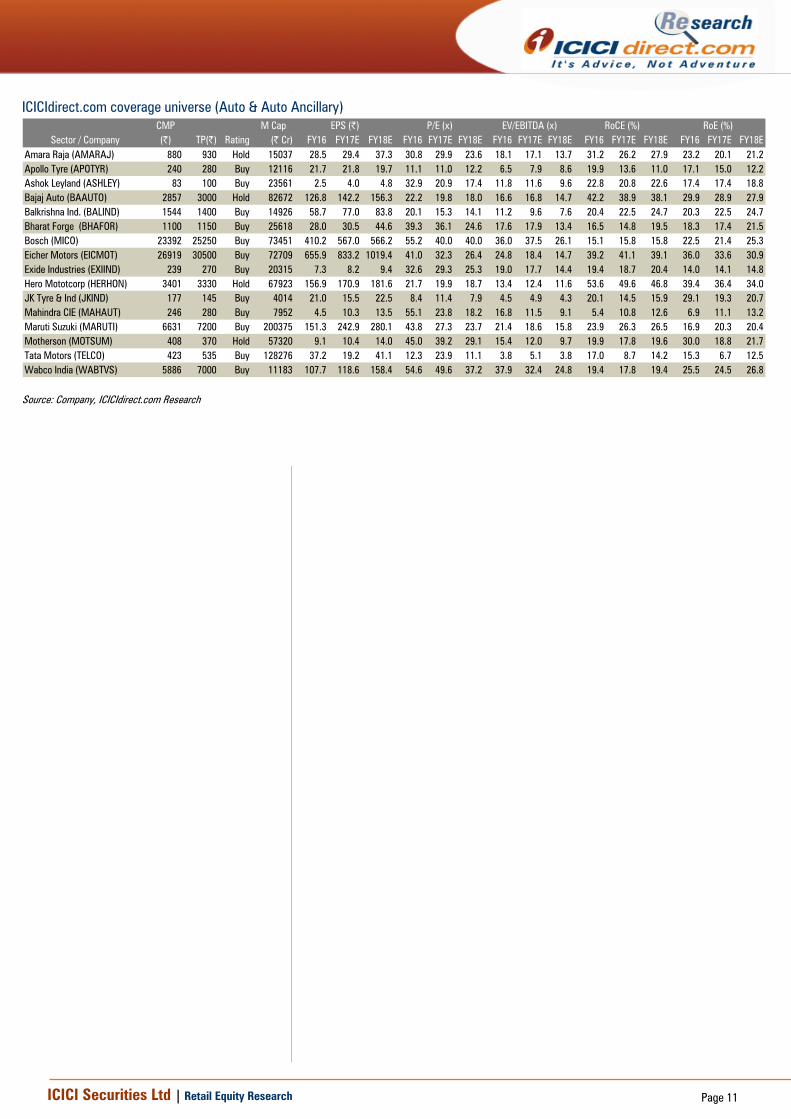
ICICIdirect.com coverage universe (Auto & Auto Ancillary) CMP M Cap(|) TP(|) Rating (| Cr) FY16 FY17E FY18E FY16 FY17E FY18E FY16 FY17E FY18E FY16 FY17E FY18E FY16 FY17E FY18E
Amara Raja (AMARAJ) 880 930 Hold 15037 28.5 29.4 37.3 30.8 29.9 23.6 18.1 17.1 13.7 31.2 26.2 27.9 23.2 20.1 21.2Apollo Tyre (APOTYR) 240 280 Buy 12116 21.7 21.8 19.7 11.1 11.0 12.2 6.5 7.9 8.6 19.9 13.6 11.0 17.1 15.0 12.2Ashok Leyland (ASHLEY) 83 100 Buy 23561 2.5 4.0 4.8 32.9 20.9 17.4 11.8 11.6 9.6 22.8 20.8 22.6 17.4 17.4 18.8Bajaj Auto (BAAUTO) 2857 3000 Hold 82672 126.8 142.2 156.3 22.2 19.8 18.0 16.6 16.8 14.7 42.2 38.9 38.1 29.9 28.9 27.9Balkrishna Ind. (BALIND) 1544 1400 Buy 14926 58.7 77.0 83.8 20.1 15.3 14.1 11.2 9.6 7.6 20.4 22.5 24.7 20.3 22.5 24.7Bharat Forge (BHAFOR) 1100 1150 Buy 25618 28.0 30.5 44.6 39.3 36.1 24.6 17.6 17.9 13.4 16.5 14.8 19.5 18.3 17.4 21.5Bosch (MICO) 23392 25250 Buy 73451 410.2 567.0 566.2 55.2 40.0 40.0 36.0 37.5 26.1 15.1 15.8 15.8 22.5 21.4 25.3Eicher Motors (EICMOT) 26919 30500 Buy 72709 655.9 833.2 1019.4 41.0 32.3 26.4 24.8 18.4 14.7 39.2 41.1 39.1 36.0 33.6 30.9Exide Industries (EXIIND) 239 270 Buy 20315 7.3 8.2 9.4 32.6 29.3 25.3 19.0 17.7 14.4 19.4 18.7 20.4 14.0 14.1 14.8Hero Mototcorp (HERHON) 3401 3330 Hold 67923 156.9 170.9 181.6 21.7 19.9 18.7 13.4 12.4 11.6 53.6 49.6 46.8 39.4 36.4 34.0JK Tyre & Ind (JKIND) 177 145 Buy 4014 21.0 15.5 22.5 8.4 11.4 7.9 4.5 4.9 4.3 20.1 14.5 15.9 29.1 19.3 20.7Mahindra CIE (MAHAUT) 246 280 Buy 7952 4.5 10.3 13.5 55.1 23.8 18.2 16.8 11.5 9.1 5.4 10.8 12.6 6.9 11.1 13.2Maruti Suzuki (MARUTI) 6631 7200 Buy 200375 151.3 242.9 280.1 43.8 27.3 23.7 21.4 18.6 15.8 23.9 26.3 26.5 16.9 20.3 20.4Motherson (MOTSUM) 408 370 Hold 57320 9.1 10.4 14.0 45.0 39.2 29.1 15.4 12.0 9.7 19.9 17.8 19.6 30.0 18.8 21.7Tata Motors (TELCO) 423 535 Buy 128276 37.2 19.2 41.1 12.3 23.9 11.1 3.8 5.1 3.8 17.0 8.7 14.2 15.3 6.7 12.5Wabco India (WABTVS) 5886 7000 Buy 11183 107.7 118.6 158.4 54.6 49.6 37.2 37.9 32.4 24.8 19.4 17.8 19.4 25.5 24.5 26.8
Sector / CompanyRoE (%)EPS (|) P/E (x) EV/EBITDA (x) RoCE (%)
Source: Company, ICICIdirect.com Research
ICICI Securities Ltd | Retail Equity Research Page 12
RATING RATIONALE ICICIdirect.com endeavours to provide objective opinions and recommendations. ICICIdirect.com assigns ratings to its stocks according to their notional target price vs. current market price and then categorises them as Strong Buy, Buy, Hold and Sell. The performance horizon is two years unless specified and the notional target price is defined as the analysts' valuation for a stock. Strong Buy: >15%/20% for large caps/midcaps, respectively, with high conviction; Buy: >10%/15% for large caps/midcaps, respectively; Hold: Up to +/-10%; Sell: -10% or more;
Pankaj Pandey Head – Research [email protected]
ICICIdirect.com Research Desk, ICICI Securities Limited, 1st Floor, Akruti Trade Centre, Road No 7, MIDC, Andheri (East) Mumbai – 400 093
ICICI Securities Ltd | Retail Equity Research Page 13
ANALYST CERTIFICATION We /I, Nishit Zota, MBA & Vidrum Mehta, MBA Research Analyst, authors and the names subscribed to this report, hereby certify that all of the views expressed in this research report accurately reflect our views about the subject issuer(s) or securities. We also certify that no part of our compensation was, is, or will be directly or indirectly related to the specific recommendation(s) or view(s) in this report.
Terms & conditions and other disclosures: ICICI Securities Limited (ICICI Securities) is a full-service, integrated investment banking and is, inter alia, engaged in the business of stock brokering and distribution of financial products. ICICI Securities Limited is a Sebi registered Research Analyst with Sebi Registration Number – INH000000990. ICICI Securities is a wholly-owned subsidiary of ICICI Bank which is India’s largest private sector bank and has its various subsidiaries engaged in businesses of housing finance, asset management, life insurance, general insurance, venture capital fund management, etc. (“associates”), the details in respect of which are available on www.icicibank.com. ICICI Securities is one of the leading merchant bankers/ underwriters of securities and participate in virtually all securities trading markets in India. We and our associates might have investment banking and other business relationship with a significant percentage of companies covered by our Investment Research Department. ICICI Securities generally prohibits its analysts, persons reporting to analysts and their relatives from maintaining a financial interest in the securities or derivatives of any companies that the analysts cover. The information and opinions in this report have been prepared by ICICI Securities and are subject to change without any notice. The report and information contained herein is strictly confidential and meant solely for the selected recipient and may not be altered in any way, transmitted to, copied or distributed, in part or in whole, to any other person or to the media or reproduced in any form, without prior written consent of ICICI Securities. While we would endeavour to update the information herein on a reasonable basis, ICICI Securities is under no obligation to update or keep the information current. Also, there may be regulatory, compliance or other reasons that may prevent ICICI Securities from doing so. Non-rated securities indicate that rating on a particular security has been suspended temporarily and such suspension is in compliance with applicable regulations and/or ICICI Securities policies, in circumstances where ICICI Securities might be acting in an advisory capacity to this company, or in certain other circumstances. This report is based on information obtained from public sources and sources believed to be reliable, but no independent verification has been made nor is its accuracy or completeness guaranteed. This report and information herein is solely for informational purpose and shall not be used or considered as an offer document or solicitation of offer to buy or sell or subscribe for securities or other financial instruments. Though disseminated to all the customers simultaneously, not all customers may receive this report at the same time. ICICI Securities will not treat recipients as customers by virtue of their receiving this report. Nothing in this report constitutes investment, legal, accounting and tax advice or a representation that any investment or strategy is suitable or appropriate to your specific circumstances. The securities discussed and opinions expressed in this report may not be suitable for all investors, who must make their own investment decisions, based on their own investment objectives, financial positions and needs of specific recipient. This may not be taken in substitution for the exercise of independent judgment by any recipient. The recipient should independently evaluate the investment risks. The value and return on investment may vary because of changes in interest rates, foreign exchange rates or any other reason. ICICI Securities accepts no liabilities whatsoever for any loss or damage of any kind arising out of the use of this report. Past performance is not necessarily a guide to future performance. Investors are advised to see Risk Disclosure Document to understand the risks associated before investing in the securities markets. Actual results may differ materially from those set forth in projections. Forward-looking statements are not predictions and may be subject to change without notice. ICICI Securities or its associates might have managed or co-managed public offering of securities for the subject company or might have been mandated by the subject company for any other assignment in the past twelve months.
ICICI Securities or its associates might have received any compensation from the companies mentioned in the report during the period preceding twelve months from the date of this report for services in respect of managing or co-managing public offerings, corporate finance, investment banking or merchant banking, brokerage services or other advisory service in a merger or specific transaction. ICICI Securities or its associates might have received any compensation for products or services other than investment banking or merchant banking or brokerage services from the companies mentioned in the report in the past twelve months. ICICI Securities encourages independence in research report preparation and strives to minimize conflict in preparation of research report. ICICI Securities or its associates or its analysts did not receive any compensation or other benefits from the companies mentioned in the report or third party in connection with preparation of the research report. Accordingly, neither ICICI Securities nor Research Analysts and their relatives have any material conflict of interest at the time of publication of this report. It is confirmed that Nishit Zota, MBA & Vidrum Mehta, MBA Research Analyst, of this report have not received any compensation from the companies mentioned in the report in the preceding twelve months. Compensation of our Research Analysts is not based on any specific merchant banking, investment banking or brokerage service transactions. ICICI Securities or its subsidiaries collectively or Research Analysts or their relatives do not own 1% or more of the equity securities of the Company mentioned in the report as of the last day of the month preceding the publication of the research report. Since associates of ICICI Securities are engaged in various financial service businesses, they might have financial interests or beneficial ownership in various companies including the subject company/companies mentioned in this report. It is confirmed that Nishit Zota, MBA & Vidrum Mehta, MBA Research Analyst, do not serve as an officer, director or employee of the companies mentioned in the report. ICICI Securities may have issued other reports that are inconsistent with and reach different conclusion from the information presented in this report. Neither the Research Analysts nor ICICI Securities have been engaged in market making activity for the companies mentioned in the report. We submit that no material disciplinary action has been taken on ICICI Securities by any Regulatory Authority impacting Equity Research Analysis activities. This report is not directed or intended for distribution to, or use by, any person or entity who is a citizen or resident of or located in any locality, state, country or other jurisdiction, where such distribution, publication, availability or use would be contrary to law, regulation or which would subject ICICI Securities and affiliates to any registration or licensing requirement within such jurisdiction. The securities described herein may or may not be eligible for sale in all jurisdictions or to certain category of investors. Persons in whose possession this document may come are required to inform themselves of and to observe such restriction.