Embed Size (px)
DESCRIPTION
working capital management
Citation preview

A STUDY ON WORKING CAPITAL MANAGEMENT
Page 1
INTRODUCTION TO THE STUDY
“FINANCE” is the lifeblood and nerve system of any business organization. just as
circulation of blood is necessary in human body to maintain life, finance is very essential
to the organization for smooth running of the business.
Kenneth midgely and Ronald bums define financing as “a process of organizing the flow
of funds so that a business can carry out its objectives in the most efficient manner and
meet its obligations as they fall due”
“FINANCE”, thus, can be considered to be set of activities dealing with the management
of funds. More specifically, it is the decision of the collection and use of funds. It is a
branch of economics that studies the management of money and other assets.
Financial management involves managerial activities concerned with the acquisition of
fund for business purposes. The finance function does with procurement of money taking
into consideration today as well as future needs and finance is required to purchase a
machinery and raw materials to pay salaries and wages and also for day-to-day expenses.
Management of working capital refers to the management of current assets as well as
current liabilities. The major trust is of course, on the management of current assets. This
is understandable because current liabilities arise in the context of current assets. Its
importance stems from two reasons.
► Investment in current assets represents a substantial portion of total investment.
► Investment in current assets and level of current liabilities has to be geared quickly
to changes in sales.

A STUDY ON WORKING CAPITAL MANAGEMENT
Page 2
The importance in working capital management is reflected in the fact that financial
managers spend a great deal of time in managing the current assets and current liabilities.
Arranging short term financing, negotiating favorable credit terms, controlling the
movement of cash, administering the accounts receivable and monitoring the investment
in inventories consumes a great deal of time of financial managers liabilities.
The study is carried out at Eicher Motors which manufactures a range of reliable,
fuel-efficient commercial vehicles of cotemporary technology. The unit manufactures and
markets commercial vehicle with Gross Vehicle Weight (GVW) ranging from 5-25 tons.
The study was conducted in Eicher Motors, to assess the financial position and also was
aimed at the application of theoretical knowledge to the practical working of finance
department in the company.

A STUDY ON WORKING CAPITAL MANAGEMENT
Page 3
INDUSTRY PROFILE
Eicher Motor is one of the prominent commercial vehicle manufacturers in India. The
companies origins date back to 1948, when Goodearth Company was established for the
distribution and service of imported tractors.
In 1959 the Eicher Tractor Corporation of India Private Ltd. was established, Jointly
with the Gebr. Eicher company, a German tractor manufacturer. In 1960 the first tractor
ever produced in India was put on the market.
Since 1965 Eicher In India has been completely owned by Indian shareholders. The
German Eicher tractor being part of Massey-Ferguson from 1970 when they bought 30%
before buying the German company out in 1973.
In 2005, Eicher Motors Ltd sold the Tractors & Engines business to TAFE, (Tractors And
Farm Equipment Ltd), of Chennai, India, the Indian licencee of Massey Ferguson
tractors.
German car manufacturer Daimler holds a 20% stake in Eicher Motors.
Eicher Motors began its business operations in 1959 in India with the roll out of India’s
first tractor. Today the Eicher Group is a significant player in the Indian auto mobile
industry with a gross sales turnover of over INR 19,000 million ($424 million (US)) in
the year 2005-06.
GROUP STRUCTURE
The Eicher Group has diversified business interests in design & development,
manufacturing and local/ international marketing of Trucks & Buses, Motorcycles,
Automotive Gears and components. In addition to this, Eicher has also invested in the

A STUDY ON WORKING CAPITAL MANAGEMENT
Page 4
potential growth areas of Management Consultancy Services, Customised Engineering
Solutions, City Maps & Travel Guides.
The activities of the Group are divided into the following business units covering all the
business interests.
• Eicher Goodearth Limited
• Eicher Motors Limited
o Eicher Motors - Commercial Vehicles
o Royal Enfield - Motorcycles
o Eicher Engineering Components - Gears
• Eicher Limited - Investments in Group companies
• Eicher Engineering Solutions - Customised Engineering Solutions
• Good Earth Publications - City Maps & Travel Guides
• ECS Limited - Management Consulting
The Eicher company has around 2500 employees located in 4 manufacturing facilities
and 49 marketing & area offices all around India. The Group has around 600 suppliers of
components and sub-assemblies. The Group’s products are supplied by a network of
around 381 dealers distributed across India. Eicher is present in over 40 other countries
across the world

A STUDY ON WORKING CAPITAL MANAGEMENT
Page 5
Introduction to working capital
Working Capital means the amount of funds necessary to cover the cost of operating the
enterprise. Working Capital is the amount of capital required for the smooth and
uninterrupted functioning of normal business operations of a company ranging from the
procurement of the raw-material, converting the same into finished products for sale and
realizing cash along with the profit from the accounts receivable that arise from the sale
of finished goods on credit.
Capital required for a business can be classified under two categories:
1) Fixed Capital
2) Working Capital
Every business needs funds for two purposes – for its establishments and to carry out its
day-to-day operations. Long term funds are required to create production facilities
through the purchase of fixed assets. Funds are also needed for short term purposes for
the purchase of raw materials and other day-to-day expenses. These funds are known as
Working Capital

A STUDY ON WORKING CAPITAL MANAGEMENT
Page 6
Concepts of Working Capital:-
There are two concepts of working capital:
1. Gross Working Capital:
The Gross Working Capital is a capital invested in total current asset of an enterprise.
2. Net Working Capital:
Net Working Capital is the excess of current assets over current liabilities.
Net Working Capital = Current Assets – Current Liabilities
Types of Working Capital:-
1) Permanent Working Capital:
It means the minimum amount of investment in all current assets, which is regarded as
necessary at all times to carry out minimum level of business. The operating cycle is a
continuous process and thus the maintenance of current assets is needed. Current Assets
increases and decreases over time. This minimum level of current assets is known as
Permanent Working Capital or Fixed Working Capital.
2) Temporary Working Capital:
This is called as Fluctuating or Variable working capital. The amount of working capital
keeps on changing depending upon the changes in production and sales. The extra
working capital required to support the changing production and sales activities is known
as Temporary Working Capital.

A STUDY ON WORKING CAPITAL MANAGEMENT
Page 7
3) Gross Working Capital:
It is the amount of working capital invested in the various components of current assets.
4) Net Working Capital:
It is the difference between the current assets and current liabilities. The concept of net
working capital enables the firm to determine the exact amount available as its disposal
for operational requirements.
5) Negative Working Capital:
When the current liabilities exceed current assets, negative working capital emerges.
Such a situation occurs when a firm is nearing crisis of some magnitude.
Working Capital Cycle:
The duration of the time required to complete the following cycle of events in a firm is
called the working capital cycle.
1. Conversion of cash into raw materials.
2. Conversion of raw materials into work in process.
3. Conversion of work in process into finished goods.
4. Conversion of finished goods into bills receivables through sales.
5. Conversion of debtors and bills receivables into cash.
Management of Working Capital:
Management of working capital is concerned with the problems arising in attempting to
manage the current assets/current liabilities and the interrelationships existing between
them.

A STUDY ON WORKING CAPITAL MANAGEMENT
Page 8
Principles of Working Capital Management Policy:
The following are the principles of a sound working capital management policy:
Principles of risk variation.
Principles of cost of capital.
Principles of equity position.
Principles of maturity of payments.
The working capital requirements of concern can be classified as:
► Permanent or Fixed working capital.
► Temporary or Variable working capital.
The fixed proportion of working capital should be generally financed from fixed capital
sources while the temporary or variable working capital requirements of a concern may
be from the short term sources of capital.
Financing of Permanent or Fixed Working Capital:
Shares:
Issue of shares is the most important source of raising long term capital. A company can
issue various types of shares such as equity, preference and deferred shares. A company
should try to raise the maximum amount by issue of shares.
Debentures:
A debenture is an instrument issued by a company acknowledging its debt to its holders.
The firm issuing debentures enjoys a number of benefits such as trading on equity,
retention of benefits, tax controls, etc.

A STUDY ON WORKING CAPITAL MANAGEMENT
Page 9
Public Deposits:
Public Deposits are the fixed deposits by a business enterprise directly from the public.
According to The Reserve Bank of India, a non-banking concern cannot borrow by the
way of public deposits more than 25% of the paid up capital and free reserves.
Ploughing back of profits:
It means the reinvestment by a concern of its surplus earnings in the business. It is an
internal source of finance and is more suitable for an established firm for its expansions.
Loans:
Financing Institutions like commercial banks, Life Insurance Corporation provide short
term, long term loans. This source of finance is more suitable to meet the medium term
demands of the working capital.
Financing of Temporary or Variable Working Capital:
Commercial banks:
The different forms of loans provided by commercial banks are as follows:
1. Loans
2. Cash Credit
3. Over Drafts
4. Purchasing and Discounting of bills.
Indigenous Bankers:
It refers to private money lenders and other country bankers. The interest rates are very
high in such cases.

A STUDY ON WORKING CAPITAL MANAGEMENT
Page 10
Trade Creditors:
It refers to the credit extended by the suppliers of goods in the normal course of business.
When a firm delays payment beyond the due date, it is called “Stretching”.
Installment Credit:
It is a method by which assets are purchased and the possession of goods is taken
immediately but the payment is made in installment over a period of time.
Factoring:
A commercial bank may provide finance by discounting the bills or invoice to its
customers. Thus a firm gets immediate payment for sale made on credit. A factor is a
financial institution, which offers services relating to management and financial debts
arising out of credit sales.
Commercial Papers:
It represents unsecured promissory notes issued by the firms to raise short term funds.
The Reserve Bank of India introduced commercial paper India on recommendations from
VAGHUL COMMITTEE.
Security Required In Bank Finance:
Following are the most important modes of security requirements –
1. Hypothecation:
Under this agreement, bank provides working capital against the security of moveable
property usually inventories. The borrower does not give the possession of the property to
the bank.

A STUDY ON WORKING CAPITAL MANAGEMENT
Page 11
2. Pledge:
Under this agreement the borrower is required to transfer the possession of the property
or goods to the bank as security.
3. Mortgage:
It is a transfer of a legal or equitable interest in a specific immovable property for the
payment of debt. The possession of the property remains with the borrower but the total
legal title is transferred to the lender.
Importance of Working Capital:
Working Capital is the life blood and nerve system of any business organization. Just as
circulation of blood is necessary in human body to maintain life, working capital is very
essential to the business organization for smooth running of the business. No business can
run successfully without and adequate working capital. The main advantage of
maintaining adequate amount of working capital is as follows:-
1. Solvency of the business:
Adequate working capital helps in maintaining solvency of the business by providing
uninterrupted flow of production.
2. Goodwill:
Sufficient working capital enables a business concern to make prompt payments and
hence helps in creating and marinating goodwill.
3. Easy Loans:
A concern having adequate working capital, high solvency and good credit standing
can arrange loans from banks and other financial institutions on easy and favorable
terms.

A STUDY ON WORKING CAPITAL MANAGEMENT
Page 12
4. Cash Discounts:
Adequate working capital also enables a concern to avail cash discounts on the
purchase and hence it reduces cost.
5. Regular Supply of Raw Materials:
Sufficient working capital ensures regular supply of raw materials and continuous
production.
6. Regular Payment of Salaries, Wages And Day-to-Day Commitments:
A company which had ample working capital can make regular payment of salaries,
increase their efficiency, reduces wastage costs and enhances production and profile.
7. Exploitation of Favorable Market Conditions:
Only concerns with adequate working capital can exploit favorable market condition
such as purchasing its requirements in bulk when the prices are lower and by holding
its inventories for higher prices.
8. Ability to Face Crises:
Adequate working capital enables a concern to face business crisis in emergencies
such as depreciation because during such periods, generally, there is much presence
on working capital.
9. Quick and Regular Return On Investment:
Every investor wants a quick and regular return on his investments. Sufficient
working capital enables a concern to pay quick dividends to its investors as there may
not be much pressure to plough back profit. This gains the confidence of its investors
and creates favorable markets to raise additional markets to raise additional funds in
future.

A STUDY ON WORKING CAPITAL MANAGEMENT
Page 13
10. High Morale:
Adequacy of working capital creates an environment of securities, confidence and
high morale and creates overall efficiency in business.
Need or Objectives of Working Capital:
The need for working capital arises to run day-to-day business activities of production
and sales. Firms differ in their requirement of the working capital. To maximize
shareholders wealth, a firm should earn sufficient returns from its operations. Earnings a
steady amount of profit require successful sales activity. Current assets are needed
because sales do not convert into cash immediately. There is always an Operating Cycle
involved in the conversion of sales into cash.
Thus working capital is needed for the following purposes:
1. For the purchase of raw materials, components and spares.
2. To pay wages, salaries, etc...
3. To incur day-to-day expenses and overhead costs such as fuel, power, office
expenses, etc…
4. To meet the selling cost such as packaging, transport, advertising, etc.
5. To provide credit facilities to customers.
For studying the need of working capital in business, one has to study the business under
varying circumstances such as new concern, as a growing concern and as one, which has
attained maturity. A new concern requires a lot of livid funds to meet initial expenses like
promotion, formation, etc. these expenses are called “Preliminary Expenses” and
are capitalized. The amount needed as working in a new concern depends primarily upon
its size and ambitions of its promoters. Generally, the working capital needed goes on

A STUDY ON WORKING CAPITAL MANAGEMENT
Page 14
increasing with the growth and expansion business till it attains maturity. At maturity, the
amount of working capital needed is called “Normal Working Capital”.
ESTIMATION OF WORKING CAPITAL REQUIREMENTS:
The working capital requirements of a concern depend upon a number of factors such as
size of the business unit, the length of production cycles the character of their operation,
the rate of stock turnover and the state of economic situation. It is not possible to rank
them because all such factors generally influence the working capital requirements.
1. Nature of the business:
The nature of the business affects the working capital requirements of a concern to a
great extent. For instance, public utilities like railways, electricity companies, etc
need very little working capital, because they need not hold inventories and their
operations are mostly on cash basis. On the other hand, ordinary manufacturing and
trading firms requires large working capital as they have to invest substantially.
2. Scale of operations:
The scale of operations affects the working capital requirements of a concern.
Concern carrying on small activities needs less working capital. On the other hand, a
concern undertaking activities on large scale needs large amount of working capital.
3. Growth and expansion of business:
The growth and expansion of business also affects the working capital requirements.
When there is growth and expansion in the business of a firm, the working capital
needs of the firm increases.

A STUDY ON WORKING CAPITAL MANAGEMENT
Page 15
4. Manufacturing Process:
In manufacturing business the requirement of working capital increases in proportion
to length of manufacturing process. Longer the process period of manufacturer, larger
the amount of working capital required. The longer the manufacturing time, the raw
material and other supplies have to be carried out for a longer period in the process
with progressive increment of labor and service cost before the finished product
finally obtained. Therefore the process with the shortest production period should be
chosen.
5. Production Policies:
The production policies followed by a firm will also affect the working capital
requirement. For example, a capital intensive industry requires more of fixed capital
and vice versa.
6. Rapidity of turnover:
There is a high degree of co-relation between rapidity of turnover and the amount of
working capital requirements. Generally firms having a high rate of turnover need
lower amount of working capital than the firm having a low rate turnover.
7. Seasonal fluctuations in demand:
Seasonal fluctuations in demand for the products affect the amount of working capital
requirements of a concern. For instance, the demand of goods for woolen cloths
increases during winter and decreases in summer. As a result its working capital need
will increase during winter and decrease during summer. Similarly, cyclical factors
also affect the amount of working capital of a concern.

A STUDY ON WORKING CAPITAL MANAGEMENT
Page 16
8. Fluctuation in supplies:
Fluctuation on supplies affects the working capital requirement of a firm. For
instance, certain raw materials may be available only during certain seasons. Such
materials have to be necessarily be obtained and stored in large quantities to provide
for periods when supplies will not be available. This will cause fluctuation in the
working capital requirements.
9. Operating efficiency:
The operating efficiency of a firm affects its working capital requirements. A firm
enjoying operating efficiency has reduced working capital needs. On the other hand,
the firm which does not enjoy operating efficiency has more wastage and thus, needs
more working capital.
10. Credit Policy:
The credit policy of a firm affects its working capital requirements. A firm, which
allows more credit to its customer, requires more working capital compared to a firm
which allows less credit. The credit facilities enjoyed by a firm from its creditors also
affect the working capital requirement of a firm. A firm enjoying liberal credit
facilities from its suppliers or creditors will need lower working capital than a firm
that does not enjoy liberal credit facilities from its suppliers.
Management of Working Capital
Working Capital is essentially the difference between current assets and current
liabilities. There are two broad sources of capital – fixed capital represented by
investments made in fixed assets like plant, machinery, land, buildings, furniture, etc.
working capital, on the other hand, is for short term and is used for meeting regular
operating expenditures or commitments to suppliers, government dues and other short
term liabilities. Efficiency of working capital is judged using following ratios-

A STUDY ON WORKING CAPITAL MANAGEMENT
Page 17
1) Current Ratio
2) Liquid Ratio (Acid Test Ratio)
3) Sales to Working Capital Ratio
4) Finished Goods Turnover
5) Cash to Average Daily Cost Of Sales
6) Bank Finance as % of Working Capital
Management of working capital is concerned with the problems that arise in attempting
to manage the current assets, current liabilities and the inter-relationship that exits
between them. It sees to it that there is neither excess nor inadequate working capital.
Working Capital management is the most critical issue in any company. Companies have
seasonality in their sales or revenues find it much more challenging to meet liquidity
requirements compared to firms have non-seasonal businesses.
Financing working capital is yet another aspect of working capital management. There
are various ways of financing it-trade credit, bank finance, cash credit, overdraft, export
financing (letter of credit), bank guarantees. As per RBI guidelines, working capital loans
are granted on the basis of certain calculations/ analysis submitted by companies to
banks/ financial institutions. The formats in which these reports are given are as per –
CMA format, and the financing methodology is known as Maximum Permissible Bank
Finance (MPBF).

A STUDY ON WORKING CAPITAL MANAGEMENT
Page 18
Principles Working Capital Management
The following are the principle of a sound working capital management policy:
Principle of Risk Variation:
There is an inverse relationship between the degree of risk and profitability. A
consecutive management prefers less risk by maintaining a high level of current assets,
while a liberal management assumes greater risk by having low working capital.
Principle of Cost of Capital:
The various source of raising working capital have different cost of capital and risk
involved. Generally, higher the risk lower is the cost of capital and lower the risk higher
the cost of capital.

A STUDY ON WORKING CAPITAL MANAGEMENT
Page 19
Principle of Equity Position:
According to this principle, the amount of working capital invested in each component
should be adequately justified by a firm’s equity position. Every rupee invested in current
assets should contribute to the net worth of the firm.
Principle of Maturity Payment:
According to this principle, a firm should make every effort to relate maturities of
payment to its flow of internally generated funds.
Importance of working capital
Even though the skill of maintaining the working capital are somewhat unique, the goal
are the same-viz.to make an efficient use of funds for minimizing the risk of loss to attain
profit objectives.
Firstly, the adequate of working capital contributes a lot in raising the credit standing of a
corporation in terms of favorable rates of interest on bank loan, better terms on goods
purchased, reduced cost of production on account of the receipt of cash discount etc.
Secondly, a company with sufficient working capital is always in a position to take
advantage of any favorable opportunity either to purchase raw material or to execute a
special order or to wait for better market position.
In the third place, the ability to meet all reasonable demands for cash without inordinate
delay is a great psychological factor to improve the all rounds efficiency of the business.

A STUDY ON WORKING CAPITAL MANAGEMENT
Page 20
Lastly, during slump the demand for working capital, instead of coming down, shoots up.
A good amount of working capital is locked up in the inventories and book debts.
Concern having ample resources can tide over that period of depression.
Thus, working capital is regarded as one of the conditioning factors in the long run
operations of the firm, which is often inclined to treat it is an issue of short-run analysis
and decision making.
A STUDY ON WORKING CAPITAL MANAGEMENT
Page 21
Working Capital Measurement
The analysis of working capital can be conducted through a number of devices such as:
RATIO ANALYSIS:
A ratio is a simple arithmetical expression of the relationship of one number to another.
The technique of ratio analysis can be employed for measuring short-term liquidity or
working capital position of a firm. The following ratio’s may be calculated for this
purpose:
Current Ratio.
Acid Test Ratio.
Absolute Liquid Ratio or Cash Position Ratio.
Inventory Turnover Ratio.
Receivables Turnover Ratio.
Payables Turnover Ratio.
Working Capital Ratio.
Ratio of Current Liabilities to Tangible Net Worth.
FUND FLOW ANALYSIS:
Fund flow analysis is a technical device designated to study the resources from which
additional funds were derived and the use to which these resources were put. It is an
effective management tool to study changes in the financial position (working capital) of
a business enterprise between beginning and ending financial statement dates. It consists
of preparing schedule of changes of working capital, statement of sources and
application of funds.

A STUDY ON WORKING CAPITAL MANAGEMENT
Page 22
WORKING CAPITAL BUDGET:
Working capital budget is a part of total budgeting process of a business, is prepared
estimating future long term and short term working capital needs and the sources of
finance them, and then comparing the budgeted figures with the actual performance for
calculating the variances, if any, so the corrective actions may be taken in the future.
CASH MANANGEMENT
In United States banking, cash management, or treasury management, is a marketing
term for certain services offered primarily to larger business customers. It may be used to
describe all bank accounts (such as checking accounts) provided to businesses of a
certain size, but it is more of an used to describe specific services such as cash
concentration, zero balance
Accounting and automated clearing house facilities. Sometimes, private banking
customers are given cash management services.
Cash management deals with the following:
Cash inflows and outflows.
Cash flows within the firm.
Cash balances held by the firm at a point of time.
RECEIVABLES MANAGEMENT
Accounts receivable are unpaid customer invoices, and any other money owed to the
organization by customers. The sum of all customer accounts receivable is listed as a
current assets on balance sheet.

A STUDY ON WORKING CAPITAL MANAGEMENT
Page 23
RESEARCH DESIGN

A STUDY ON WORKING CAPITAL MANAGEMENT
Page 24
Introduction to Design:
What is Research Design?
Research design can be thought of as the structure of research – it is the “glue” that holds
all the elements in a research project together. We often describe a design using a concise
notation that enables us to summarize a complex design structure efficiently. What are
the “elements” that a design includes? They are:
Title of the study
A study of Working Capital Management at, EICHER MOTORS Ltd, using ratio
analysis.
Statement of the Problem
The study is done to review the Working Capital Management at EICHER MOTORS
Ltd. Working Capital is considered as the life blood of the business. The firm should
maintain a sound working capital position and should have an adequate working capital
to run its business operations.
An appropriate level of working capital is to be maintained to run the business smoothly
as excessive working capital interrupts the smooth flow of the business.

A STUDY ON WORKING CAPITAL MANAGEMENT
Page 25
Objectives of the Study
The following are the objectives of the study conducted:
1) To compare the financial position of the company for the past 3 years with the
help of ratios concerned with the working capital and turnover.
2) To identify liquidity, turnover in terms of stock and working capital.
3) To study the method of financing of working capital and to find the flow of
funds.
4) To identify, understand and interpret the problem and put forward suggestions.
5) To make a proper analysis of the gross and net working capital through proper
scrutiny.
Research Methodology
3 years of Balance Sheet and Profit and Loss a/c were used stated in the Annual Reports
for analysis.
Working Capital and concerned ratios used as a tool of analysis. Based on the
computation, the financial position and performance of the business was evaluated and
suggestions were made. Regarding the financing of working capital, both the methods
were evaluated by extracting information from the Balance Sheet for 3 years, then the
best alternative was chosen and based on the company’s position regarding the financing
of working capital was known.
A STUDY ON WORKING CAPITAL MANAGEMENT
Page 26
Reference Period
The study period in this case study is for 3 financial years i.e., from 2008 to 2010.
Scope of the Study
The study of analysis of working capital management is limited to the specific bank,
EICHER MOTORS Ltd.
Data collection
The required data has been collected from secondary sources of information such as the
Balance Sheet and Profit and Loss a/c. the secondary data has also been collected from
business journals, magazines, internet, and other published information. The analysis has
been made by referring to the secondary data and also under the guidance of my guide
and the manager of EICHER MOTORS Ltd. There was a use of primary data in the case
of financing of working capital through the use paper work and discussion held with the
senior financial management.
Tools of Analysis
Working capital cycles, schedule of changes in working capital, composition of current
assets & liabilities, gross & net working capital and ratio analysis were used as a tool of
analysis. The data analyzed is presented in the form of tables and charts. Further, ratio’s
and percentages are used to interpret the data.

A STUDY ON WORKING CAPITAL MANAGEMENT
Page 27
Limitations of the Study
The study was subjected to following limitations:
1).The information is availed from the statements, annual reports and records of the
company.
2).One of the constraints of the study was that of the time factor, which was very short.
3). The focus is only on working capital of the company
4). The data’s are randomly selected from the annual reports.

A STUDY ON WORKING CAPITAL MANAGEMENT
Page 28
COMPANY PROFILE
A STUDY ON WORKING CAPITAL MANAGEMENT
Page 29
EICHER MOTORS: Eicher Motor is one of the prominent commercial vehicle manufacturers in India. The
success and growth of this unit is a result of various customer-driven strategies. The
manufacturing facility is situated in Central India – Pithampur, Madhya Pradesh. Eicher
Motors has stepped into the Heavy Commercial Vehicle segment with its state-of-the-art
HCV, the "Eicher 20.16", the first commercial vehicle designed and developed
indigenously. Recently, Eicher Motors has emerged with Volvo to form another HCV.
Eicher Motors functions through a strong three-tier service network consisting of
authorized distributors, service centers and company trained private mechanics. The
vehicles are sold and serviced through a network of over 576 Authorized Contact Points
all over India, supported by service centers and over 4500 company trained private
mechanics, which are close at hand on all major highways throughout India to
provide initial "first aid" to the vehicles if required.
Eicher Motors has acquired formidable expertise in designing and developing
commercial vehicles. It has a world-class R&D centre manned by a team of brilliant
engineers and equipped with latest Computer Aided Design (CAD) and Computer Aided
Engineering facilities like NASTRAN, FEM analysis packages. Leveraging its in-house
expertise, this unit has successfully developed a wide range of commercial vehicles to
meet varying customer needs. The product range includes Trucks : Eicher 10.50, Eicher
10.75, Eicher 10.90, Eicher 11.10, Eicher 20.16 & 30.25; Buses: Eicher Skyline, Eicher
Cruiser and Eicher School Bus range of buses. Besides the basic models, it offers over 85
models of ready-to-use custom-built vehicles for various specialized applications. Eicher
Motors’ products have been well accepted in the market. This is also demonstrated by
significant sales of its commercial vehicles in export markets where the company
competes with reputed international brands.

A STUDY ON WORKING CAPITAL MANAGEMENT
Page 30
EICHER MOTORS: COMPANY HISTORY
1948 The Company, Goodearth was set up to sell and service imported tractors.
1959 First indigenous Eicher tractor built.
1952 - 1957 Goodearth imported and sold about 1500 tractors in India.
1958 Incorporation of Eicher Tractor Corporation of India Ltd.
Apr. 24, 1959 Eicher launched the first indigenously built tractor from its Faridabad factory.
Sept.3, 1960 Changed name to Eicher Tractors India Ltd.
1965 - 1975 100% indigenization achieved in Eicher Tractors.
1980 Eicher Goodearth Limited name given to Eicher.
1982 Collaboration with Mitsubishi.
Oct. 4, 1982 Collaboration agreement for the manufacture of Light Commercial Vehicles
signed with Mitsubishi in Tokyo.
Oct. 14, 1982 Eicher Motors Limited was incorporated.
1985 Silver Jubilee Year for Eicher.
1986 Eicher Motors Limited springs into operation.
Dec., 1987 Eicher Tractors went public.
Feb. 2, 1990 Eicher Goodearth buys 26% equity stake in Enfield India Ltd.
1991 ECS launched
1991 Eicher takes over Ramon & Demm
Apr.1, 1991 Formal launch of Management Consulting division of Eicher - ECS
Aug.24, 1993 Eicher acquires majority stake in Enfield India (60% equity shareholding)
Mar. 1994 End of the technical assistance Agreement with Mitsubishi after successful
transfer of technology and achieving total indigenization.
Jun. 23, 1994 Enfield India Limited changed its name to Royal Enfield Motors Limited
Dec.20, 1995 Eicher City Map - Delhi launched
1996 Eicher Tractors Limited amalgamated with Royal Enfield Motors to form Eicher
Limited on Jun. 1, 2005.

A STUDY ON WORKING CAPITAL MANAGEMENT
Page 31
Jun. 1, 2005 Eicher Motors Limited disinvested the businesses of Tractors & Engines to TAFE
Motors and Tractors Limited (TMTL)
Apart from the above table:
The company has entered into a technical collaboration agreement with the FINLAND
based VALTRA Inc. for the manufacture of 61 and higher to HP tractors.
The company has been awarded Certificate of Merit for improving the overall
productivity in the Automobile sector by the National Productivity Council of
Government of India.
Eicher has tied up with Volkswagen to enter the passenger car segment.
In 2003, UBI tied up with Eicher and L&T for financing equipments and farm vehicles.
In 2005, Eicher acquired DESIGN, USA. Eicher buys US Design company for $2.5m.
In 2006, Eicher joined hands with WIPRO to source Hydraulic Kits.
Board of Directors:
S Sandilya – Chairman
Siddhartha Lal – Managing Director & Chief Executive Officer
P N Vijay – Director
Priya Brat – Director
M J Subbaiah – Director

A STUDY ON WORKING CAPITAL MANAGEMENT
Page 32
PRODUCT RANGE:
Leveraging its in house expertise, Eicher Motors has successfully developed a wide range
of commercial vehicles to meet the varying customer needs. These vehicles deliver value
by providing low cost of ownership and increased profitability to our customers. The
range offered include fully built up trucks – ranging from 6T to 25T, buses and chassis.
All these products can be offered in BSII compatible options. Eicher Motors arguably
have the best CNG technology in the world.

A STUDY ON WORKING CAPITAL MANAGEMENT
Page 33
SERVICE AND MAINTAINANCE:
Eicher has an extensive service reach and no matter the problem is, Eicher service is
never too far away. Eicher provides its customer the benefit of an extensive sale and
service network, customized solutions and an efficient cost of ownership. Our
manufacturing capabilities are backed by a sales and service network of our 950 contact
points across India and over 8000 private mechanics trained Eicher ensuring that your
vehicle is in safe hands.
SERVICE INITIATIVES:
Eicher Genuine Spares – available across all Eicher authorized representatives, service
centers, spares distributors, satellite service outlets and retail outlets.
Fully equipped modern workshops for quick and quality service.
Driver training for drivers to impart safe driving skills and to enhance fuel efficiency.
Regular free check up and service camps.
Regular customer needs and contacts.
A comprehensive service Audit System, which oversees the physical infrastructure and
service quality of Eicher service network.
Highway check up campaigns.
Eicher Motors is the first company in the Commercial Vehicle industry to introduce
warranty operation through Electronic Media.

A STUDY ON WORKING CAPITAL MANAGEMENT
Page 34
MANUFATURING FACILITIES:
The manufacturing facility of Eicher Motors is located in PITAMPUR, MADHYA
PRADESH. This is a state – of – the – art plant which has a total area of 72 acres with
18000 sq.mts as the covered area. The plant houses some top of the line equipment, a
robust infrastructure and has an annual production capacity of 30000 vehicles.

A STUDY ON WORKING CAPITAL MANAGEMENT
Page 35
SPARES:
Eicher products are engineered to perfections, incorporating the best of technology and
the state of the art manufacturing facilities. It is thus a privilege itself to maintain any
product in a perfect condition. This can be done by using specified Eicher Genuine Parts,
which meets the required engineering precision standards.
The most important element of this new light blue color packaging is the bright hologram
which glitters. When viewed from angles, the hologram reflects different colors
providing a 3-dimensional feel, thus giving it a more professional and user-satisfactory
results.

A STUDY ON WORKING CAPITAL MANAGEMENT
Page 36
DATA ANALYSIS AND
INTERPRETATION

A STUDY ON WORKING CAPITAL MANAGEMENT
Page 37
RATIO ANALYSIS
FINANCIAL ANALYSIS
Financial analysis is the process of identifying the financial strengths and weaknesses of
the firm and establishing relationship between the items of the balance sheet and profit &
loss account.
Financial ratio analysis is the calculation and comparison of ratios, which are derived
from the information in a company’s financial statements. The level and historical trends
of these ratios can be used to make inferences about a company’s financial condition, its
operations and attractiveness as an investment. The information in the statements is used
by
• Trade creditors, to identify the firm’s ability to meet their claims i.e. liquidity
position of the company.
• Investors, to know about the present and future profitability of the company and
its financial structure.
• Management, in every aspect of the financial analysis. It is the responsibility of
the management to maintain sound financial condition in the company.
RATIO ANALYSIS
The term “Ratio” refers to the numerical and quantitative relationship between two items
or variables. This relationship can be exposed as
• Percentages
• Fractions
• Proportion of numbers
Ratio analysis is defined as the systematic use of the ratio to interpret the financial
statements. So that the strengths and weaknesses of a firm, as well as its historical

A STUDY ON WORKING CAPITAL MANAGEMENT
Page 38
performance and current financial condition can be determined, Ratio reflects a
quantitative relationship helps to form a quantitative judgment
STEPS IN RATIO ANALYSIS
• The first task of the financial analysis is to select the information relevant to the
decision under consideration from the statements and calculates appropriate
ratios.
• To compare the calculated ratios with the ratios of the same firm relating to the
pas6t or with the industry ratios. It facilitates in assessing success or failure of the
firm.
• Third step is to interpretation, drawing of inferences and report writing
conclusions are drawn after comparison in the shape of report or recommended
courses of action.
BASIS OR STANDARDS OF COMPARISON
Ratios are relative figures reflecting the relation between variables. They enable analyst
to draw conclusions regarding financial operations. They use of ratios as a tool of
financial analysis involves the comparison with related facts. This is the basis of ratio
analysis. The basis of ratio analysis is of four types.
• Past ratios, calculated from past financial statements of the firm.
• Competitor’s ratio, of the some most progressive and successful competitor firm
at the same point of time.
• Industry ratio, the industry ratios to which the firm belongs to.
• Projected ratios, ratios of the future developed from the projected or pro forma
financial statements

A STUDY ON WORKING CAPITAL MANAGEMENT
Page 39
INTERPRETATION OF THE RATIOS
The interpretation of ratios is an important factor. The inherent limitations of ratio
analysis should be kept in mind while interpreting them. The impact of factors such as
price level changes, change in accounting policies, window dressing etc., should also be
kept in mind when attempting to interpret ratios. The interpretation of ratios can be made
in the following ways.
• Single absolute ratio
• Group of ratios
• Historical comparison
• Projected ratios
Inter-firm comparison
GUIDELINES OR PRECAUTIONS FOR USE OF RATIOS
The calculation of ratios may not be a difficult task but their use is not easy. Following
guidelines or factors may be kept in mind while interpreting various ratios are:
• Accuracy of financial statements
• Objective or purpose of analysis
• Selection of ratios
• Use of standards

A STUDY ON WORKING CAPITAL MANAGEMENT
Page 40
IMPORTANCE OF RATIO ANALYSIS
• Aid to measure general efficiency
• Aid to measure financial solvency
• Aid in forecasting and planning
• Facilitate decision making
• Aid in corrective action
• Aid in intra-firm comparison
• Act as a good communication
• Evaluation of efficiency
• Effective tool
LIMITATIONS OF RATIO ANALYSIS
• Differences in definitions
• Limitations of accounting records
• Lack of proper standards
• No allowances for price level changes
• Changes in accounting procedures
• Quantitative factors are ignored
• Limited use of single ratio
• Background is over looked
• Limited use

A STUDY ON WORKING CAPITAL MANAGEMENT
Page 41
CLASSIFICATIONS OF RATIOS
The use of ratio analysis is not confined to financial manager only. There are different
parties interested in the ratio analysis for knowing the financial position of a firm for
different purposes. Various accounting ratios can be classified as follows:
1. Traditional Classification
2. Functional Classification
3. Significance ratios
1. Traditional Classification
It includes the following.
• Balance sheet (or) position statement ratio: They deal with the relationship
between two balance sheet items, e.g. the ratio of current assets to current
liabilities etc., both the items must, however, pertain to the same balance sheet.
• Profit & loss account (or) revenue statement ratios: These ratios deal with the
relationship between two profit & loss account items, e.g. the ratio of gross profit
to sales etc.,
• Composite (or) inter statement ratios: These ratios exhibit the relation between a
profit & loss account or income statement item and a balance sheet items, e.g.
stock turnover ratio, or the ratio of total assets to sales.

A STUDY ON WORKING CAPITAL MANAGEMENT
Page 42
2. Functional Classification
These include liquidity ratios, long term solvency and leverage ratios, activity ratios and
profitability ratios.
3. Significance ratios
Some ratios are important than others and the firm may classify them as primary and
secondary ratios. The primary ratio is one, which is of the prime importance to a concern.
The other ratios that support the primary ratio are called secondary ratios.
IN THE VIEW OF FUNCTIONAL CLASSIFICATION THE RATIOS
ARE:
1. Liquidity ratio
2. Leverage ratio
3. Activity ratio
4. Profitability ratio

A STUDY ON WORKING CAPITAL MANAGEMENT
Page 43
TABLE REPRESENTING COMPOSITION OF CURRENT ASSETS (Rs. In millions) Table – 4.1
ELEMENTS MAR
2010
% MAR
2009
% MAR
2008
%
INVENTORIES 1612.3 33.28 1612.5 31.15 1262.5 29.06
DEBTORS 1176 27.28 1580.8 30.53 1549.3 35.6
CASH & BANK
BALANCE
261 5.39 310.4 6.00 331.5 7.63
OTHER
CURRENT
ASSETS
77 1.59 - - - -
LOAN
ADVANCES
1718.1 35.47 1547.1 32.32 1014 27.65
TOTAL 4844.4 100 5050.8 100 4157.3 100

A STUDY ON WORKING CAPITAL MANAGEMENT
Page 44
GRAPHICAL REPRESENTATION OF COMPOSITION OF
CURRENT ASSETS
Graph – 4.1
0
200
400
600
800
1000
1200
1400
1600
1800
2010 2009 2008
inventories
debtors
cash&bankbalanceother currentassetsloans andadvances
A STUDY ON WORKING CAPITAL MANAGEMENT
Page 45
TABLE REPRESENTING COMPOSITION OF CURRENT
LIABILITIES
(Rs. In millions)
Table 4.2
ELEMENTS MARCH
2010
% MARCH
2009
% MARCH
2008
%
CURRENT
LIABILITIES
2902.3 74.11 3666.4 80.41 2689.8 80.47
PROVISIONS 1014.1 25.89 893.1 19.59 652.9 19.53
TOTAL 3916.4 100 4559.5 100 3342.7 100

A STUDY ON WORKING CAPITAL MANAGEMENT
Page 46
GRAPHICAL REPRESENTATION OF COMPOSITION OF
CURRENT LIABILITIES
Graph – 4.2
2008 20092010
0
500
1000
1500
2000
2500
3000
3500
4000

A STUDY ON WORKING CAPITAL MANAGEMENT
Page 47
TABLE REPRESENTING WORKING CAPITAL CYCLE FOR 2010
WORKING CAPITAL CYCLE (2010)
TABLE – 4.3
ELEMENTS DAYS
Raw Materials Storage Period 49
Conversion Period 3
Finished Goods Storage Period 14
Average Collection Period 27
Average Payment Period 73
ANALYSIS
From the above table it can be observed that the company stores its raw material for 49
days before it is converted into finished goods, and then the company takes 3 days for
conversion of raw material into finished products, it takes 14 days to store the finished
goods before it is delivered to the final consumer. Next it shows the average collection
period from debtors was 27 days and average payment period to creditors was 73 days.

A STUDY ON WORKING CAPITAL MANAGEMENT
Page 48
GRAPHICAL REPRESENTATION OF WORKING CAPITAL
CYCLE FOR 2010(in days)
GRAPH – 4.3
0
10
20
30
40
50
60
70
80
R.M.S.P C.P F.G.S.P A.C.P A.P.P
Working CapitalCycle(2010)
49
3
14
27
73

A STUDY ON WORKING CAPITAL MANAGEMENT
Page 49
TABLE REPRESENTING WORKING CAPITAL CYCLES
TABLE – 4.4
YEAR 2010 2009 2008
Raw materials
storage period (days
– A)
49 37 32
Conversion period
(days – B)
3 3 3
Finished goods
storage period (days
– C)
14 9 7
Average collection
period (days – D)
27 26 24
Gross working
capital cycle (days –
A+B+C+D = X)
93 75 66
Average payment
period (days – E)
73 64 62

A STUDY ON WORKING CAPITAL MANAGEMENT
Page 50
ANAYLSIS
The proper analysis of the working capital management can be made through the proper
study of working capital cycles which help to ascertain the no of days the company takes
to complete once such cycle.
It can be observed from the table and the chart that the Gross working capital cycle has
been increasing every year for the years 2007 – 2010. Thus it has an increasing trend.
Also, from the table it can be noticed that the raw materials storage period have been
increasing for the years 2008 – 2010. It can also be observed from the table and the chart
that the Net Working Capital Cycle has been increasing every year for the years 2007 –
2010. Thus it has an increasing trend. Moreover, from the table we can see that the
average payment period have been increasing for the years 2008 – 2010.

A STUDY ON WORKING CAPITAL MANAGEMENT
Page 51
GRAPHICAL REPRESENTATION OF GROSS WORKING
CAPITAL CYCLE (in days)
Graph – 4.4
2010 20092008
0102030405060708090
100 93
7566

A STUDY ON WORKING CAPITAL MANAGEMENT
Page 52
GRAPHICAL REPRESENTATION OF NET WORKING CAPITAL (in days) Graph – 4.5
20102009
2008
02468
1012
14
16
18
2020
11
4
INFERENCE From the table and the charts, it can be seen that the Gross Working Capital cycles as
well as raw material storage period have been increasing over the financial years, thus
showing an increasing trend. This is not good from the company’s point of view because
more is being blocked in the storage of raw materials rather than the finished goods
storage period. When compared among the three financial years, it can be observed that
the Net Working Capital cycle as well as the average payment period shows an increase
in trend. This proves that good for the company, but not from the creditors point of view.

A STUDY ON WORKING CAPITAL MANAGEMENT
Page 53
TABLE REPRESENTING VARIOUS TRENDS (Rs. In millions) Table – 4.5 PARTICULARS 2010 2009 2008
Inventories 1612.3 1612.5 1262.5
Sundry Debtors 1176 1580.8 1549.3
Cash & Bank Balances
261 310.3 331.5
Creditors 2350.5 2846.9 2446.3
ANALYSIS It can be observed from the table and the chart that the trends for inventories, sundry
debtors and creditors has been increasing and decreasing alternatively for the years
2008 – 2010, whereas, cash and bank balance has a decreasing trend. The proper scrutiny
of this trend is of at most important because this constitute the working capital of the
company and have a direct bearing on its level.

A STUDY ON WORKING CAPITAL MANAGEMENT
Page 54
GRAPHICAL REPRESENTATION OF VARIOUS TRENDS Graph – 4.6
0
500
1000
1500
2000
2500
3000
Inventories Sundry Debtors Cash & BankBalances
Creditors
2010
2009
2008
INFERENCE
From the data above i.e. the table and the chart, it’s seen the inventories, sundry debtors
and creditors fluctuate over the financial years, whereas cash and bank balance shows a
decreasing trend. An appropriate inspection should be done as the entire result shows
upon the working capital of the company.
A STUDY ON WORKING CAPITAL MANAGEMENT
Page 55
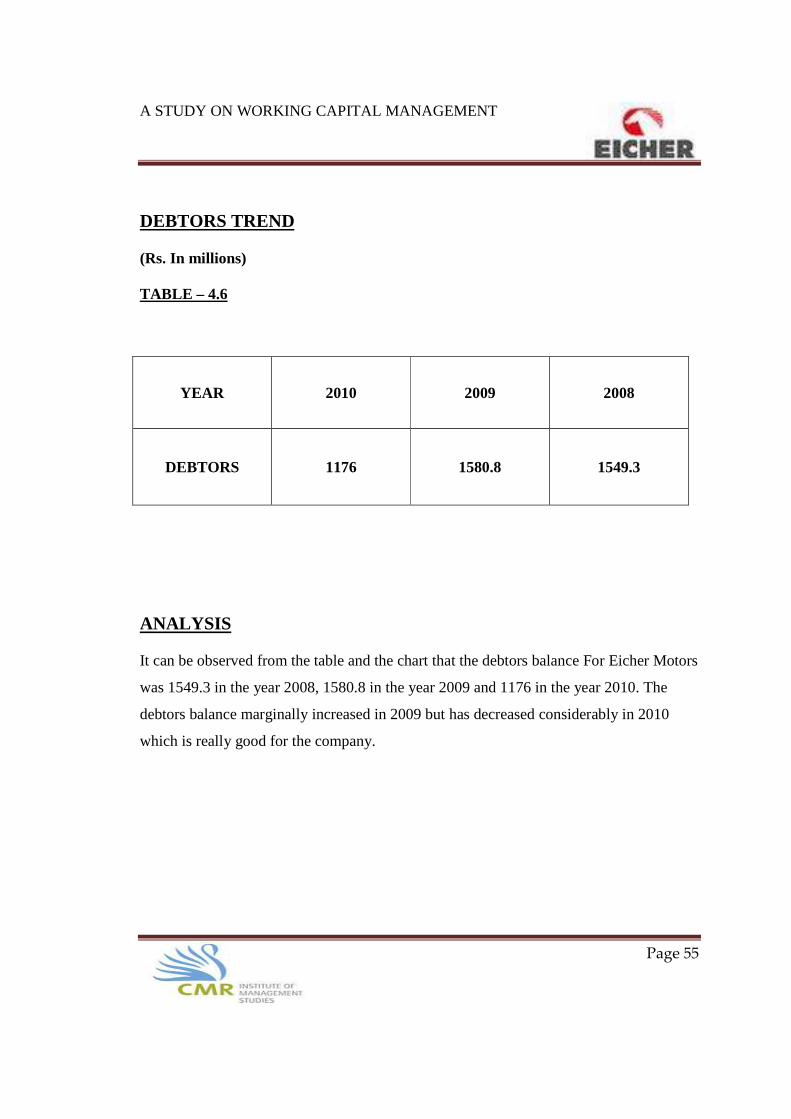
DEBTORS TREND (Rs. In millions) TABLE – 4.6
YEAR 2010 2009 2008
DEBTORS 1176 1580.8 1549.3
ANALYSIS It can be observed from the table and the chart that the debtors balance For Eicher Motors
was 1549.3 in the year 2008, 1580.8 in the year 2009 and 1176 in the year 2010. The
debtors balance marginally increased in 2009 but has decreased considerably in 2010
which is really good for the company.

A STUDY ON WORKING CAPITAL MANAGEMENT
Page 56
GRAPH – 4.7
20102009
2008
0
500
1000
1500
2000
AMOUNT
1176
1580.81549.3
INFERENCE It can be observed here, that in the last financial year the debtors balance is showing a
decreasing trend. This gives a positive note to the company as the debtors or receivables
imply credit sales and the decrease in debtors balance shows that the company has now
shifted its focus on making more of cash sales which helps it to recover its money in a
lesser period of time.

A STUDY ON WORKING CAPITAL MANAGEMENT
Page 57
INVENTORIES TREND (Rs. In million) TABLE – 4.7
YEAR 2010 2009 2008
INVENTORIES 1612.3 1612.5 1262.5
ANALYSIS It can be observed from the table and the chart that the inventories of Eicher Motors was
1262.5 in 2008, 1612.5 in 2009 and 1612.3 in 2010. the inventories balance has increased
remarkably from 2008 to 2010, which does not prove to be good as the operation of the
company might show problems in functioning.

A STUDY ON WORKING CAPITAL MANAGEMENT
Page 58
GRAPH – 4.8
20102009
2008
0
500
1000
1500
2000
INVENTORIES
1612.3 1612.5
1262.5
INFERENCE Although inventories involve blocking of a firm’s funds and the costs of storage and
handling but every business enterprise has to maintain certain level of inventories to
facilitate uninterrupted production and smooth running of business. Here the data shows
the rapid increase in 2009 as compared to 2008 and the stability of inventories between
2009 and 2010, which is not good for the company as more funds are now blocked in
inventories in the form of raw materials and work in progress.

A STUDY ON WORKING CAPITAL MANAGEMENT
Page 59
CASH AND BANK BALANCE TREND (Rs. In million) TABLE – 4.8
YEAR 2010 2009 2008
CASH AND BANK BALANCE 261 310.4 331.5
ANALYSIS From the table and the chart it can be seen that the trend of cash and bank balances of
Eicher Motors shows a decrease trend. It was 331.5 in the year 2008, 310.4 in 2009 and
261 in 2010. In a more optimistic way, this shows a significant mindset of the company
as the money is not being kept idle, but instead they are invested in areas such as
production, etc for incurring profit.

A STUDY ON WORKING CAPITAL MANAGEMENT
Page 60
GRAPH – 4.9
2010 20092008
0
100
200
300
400
CASH AND BANKBALANCE
261 310.4 331.5
INFERENCE Cash and bank balances are important assets to the company because they are the best
form of liquid assets and thus, play an important role in fulfilling the working capital
requirements of the company. It further helps to smoothen the functioning of the
company. Moreover, it shows a decreasing trend which is again good for the company
since they are utilizing more of their funds for the production.

A STUDY ON WORKING CAPITAL MANAGEMENT
Page 61
CREDITORS TREND (Rs. In million) TABLE – 4.9
YEAR 2010 2009 2008
CREDITORS 2350.5 2846.9 2446.3
ANALYSIS It can be observed from the table and the chart that the creditors balance for Eicher
Motors was 2446.3 in 2008, 2846.9 in 2009 and 2350.5 in 2010. This is not a good sign
as it cannot afford to block its capital by making cash purchases.

A STUDY ON WORKING CAPITAL MANAGEMENT
Page 62
GRAPH – 5.0
20102009
2008
0
500
1000
1500
2000
2500
3000
CREDITORS
2350.5
2846.9
2446.3
INFERENCE Creditors form one of the most important components of liabilities of the company. The
creditors balance has been increasing and decreasing over the past years. The creditors
balance imply credit purchase and has decreased in 2010 which is not good for the
company and thus, needs to revamp its purchase policy because it cannot afford to block
up its capital by making cash purchases. But for creditor’s point of view, it is good for the
company since it is dealing more in cash which is obviously more viable for the creditors
as they would like to deal with the company.

A STUDY ON WORKING CAPITAL MANAGEMENT
Page 63
WORKING CAPITAL RATIOS CURRENT RATIO This ratio is a rough indication of a firm’s liability to service its current obligations.
Generally, the higher is the current ratio, the greater the “cushion” between current
obligations and a firm’s ability to pay them. The stronger ratio reflects a numerical
superiority of current assets over current liabilities. However, the composition and quality
of current assets is a crucial factor in the analysis of an individual firm’s liquidity.
Current Ratio = Total Current Assets Total Current Liabilities TABLE REPRESENTING CURRENT RATIO (Rs. In million) TABLE – 5.0
YEAR 2010 2009 2008
Current Assets 4844.4 5050.8 4157.3
Current Liabilities 3916.4 4559.5 3342.7
Current Ratio 1.237 1.108 1.244
ANALYSIS It can be observed from the table and the chart that the current ratio for Eicher Motors
was 1.237 in 2010, 1.108 in 2009 and 1.244 in 2008. The current ratio has been
decreasing and increasing alternatively for the period 2008 – 2010.

A STUDY ON WORKING CAPITAL MANAGEMENT
Page 64
Graphical Representation of Current Ratio
GRAPH – 5.1
20102009
2008
1
1.05
1.1
1.15
1.2
1.25 1.237
1.108
1.244
INFERENCE The ideal current ratio for the company is 2: 1. Eicher Motors has not been able to reach
this value from 2008 to 2010. Though there has been increase in the ratio in 2008
compared to previous year but still the company has not been able to maintain its current
assets and liabilities.

A STUDY ON WORKING CAPITAL MANAGEMENT
Page 65
QUICK RATIO
Quick Ratio is also known as “ACID RATIO”. It is a more severe conservative measure
of liquidity. The ratio expresses the degree to which a company’s quick liabilities are
covered by the quick assets. The quick ratio is a form of derivative. It excludes
inventories from the current assets, considering only assets which are most swiftly
realizable. Quick Liabilities refer to all the current liabilities except for bank overdraft.
Quick Ratio = Quick Assets Quick Liabilities TABLE REPRESENTING QUICK RATIO (Rs. In million) TABLE – 5.1
YEAR 2010 2009 2008
QUICK ASSETS 3232.5 3438.3 2894.8
QUICK LIABILITIES
3916.4 4559.5 3342.7
QUICK RATIO 0.83 0.75 0.87 ANALYSIS It can be observed from the table and the chart that the quick ratio for Eicher Motors was
0.87 in 2008, 0.75 in 2009 and 0.83 in 2010. The quick ratio has increased and decreased
alternatively for the period 2008 – 2010.

A STUDY ON WORKING CAPITAL MANAGEMENT
Page 66
GRAPHICAL REPRESENTATION OF QUICK RATIO GRAPH – 5.2
2010 2009 2008
0.65
0.7
0.75
0.8
0.85
0.9
Quick Ratio
0.83
0.75
0.87
INFERENCE The ideal quick ratio for any company is 1:1. Eicher Motors has never been able this
value during the past three years. In all the three years the company hasn’t managed to
reach the ideal level. Thus, it becomes important for the company to maintain more liquid
assets as any further decline in the years to come may prove detrimental to the growth for
the company.

A STUDY ON WORKING CAPITAL MANAGEMENT
Page 67
ABSOLUTE LIQUID RATIO The ratio is also known as super quick ratio or cash ratio. In calculating this ratio, both
inventories and receivables are deducted from current assets to arrive at absolute liquid
assets such as cash and easily marketable securities.
Absolute Liquid Ratio = Cash & its Equivalent Current Liabilities TABLE REPRESENTING ABSOLUTE LIQUID RATIO (Rs. In millions) TABLE – 5.2
YEAR 2010 2009 2008
Cash & its equivalent 261 310.4 331.5
Current Liabilities 3916.4 4559.5 3342.7
Absolute Liquid Ratio 0.067 0.068 0.099
ANALYSIS It cab be observed from the table and the chart the absolute quick ratio for Eicher Motors
was 0.099 for the year 2008, 0.068 fir the year 2009 and 0.067 for the year 2010. The
quick ratio has decreased steadily over the past three years.

A STUDY ON WORKING CAPITAL MANAGEMENT
Page 68
GRAPHICAL REPRESENTATION OF ABSOLUTE LIQUID RATIO GRAPH – 5.3
2010 20092008
0
0.02
0.04
0.06
0.08
0.1
Absolute Liquid Ratio
0.067 0.068
0.099
INFERENCE
Higher the absolute quick ratio, higher is the cash liquidity. A low ratio is not a serious
matter because the company can always borrow from the bank for short term
requirements.

A STUDY ON WORKING CAPITAL MANAGEMENT
Page 69
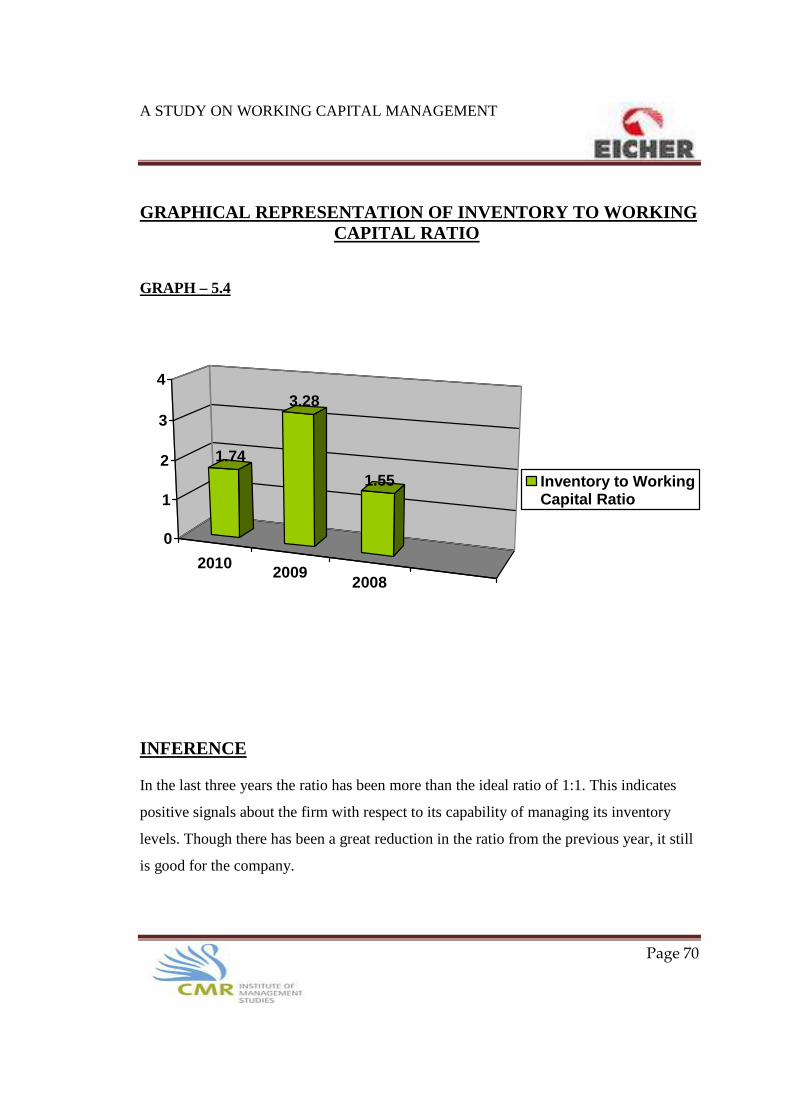
INVENTORY TO WORKING CAPITAL RATIO This ratio is calculated to prevent over stocking. Increase in volume of sales results in
increase in size of inventories. But from a sound financial point of view, inventory should
not exceed amount of working capital.
Inventory to Working Capital Ratio = Inventories Net Working Capital TABLE REPRESENTING INVENTORY TO WORKING CAPITAL RATIO (Rs .In million) TABLE – 5.3
YEAR 2010 2009 2008
Inventories 1612.3 1612.5 1262.5
Net Working Capital 928 491.3 814.6
Inventory to Working Capital
Ratio 1.74 3.28 1.55
ANALYSIS It can be observed from the table and chart that the Inventory to Working Capital
Turnover Ratio for Eicher Motors was 1.55 in 2008, 3.28 in 2009 and 1.74 in 2010. The
inventory to stock turnover ratio has been increasing and decreasing alternatively
between the periods 2008 to 2010.
A STUDY ON WORKING CAPITAL MANAGEMENT
Page 70
GRAPHICAL REPRESENTATION OF INVENTORY TO WORKING CAPITAL RATIO GRAPH – 5.4
20102009
2008
0
1
2
3
4
Inventory to WorkingCapital Ratio
1.74
3.28
1.55
INFERENCE In the last three years the ratio has been more than the ideal ratio of 1:1. This indicates
positive signals about the firm with respect to its capability of managing its inventory
levels. Though there has been a great reduction in the ratio from the previous year, it still
is good for the company.

A STUDY ON WORKING CAPITAL MANAGEMENT
Page 71
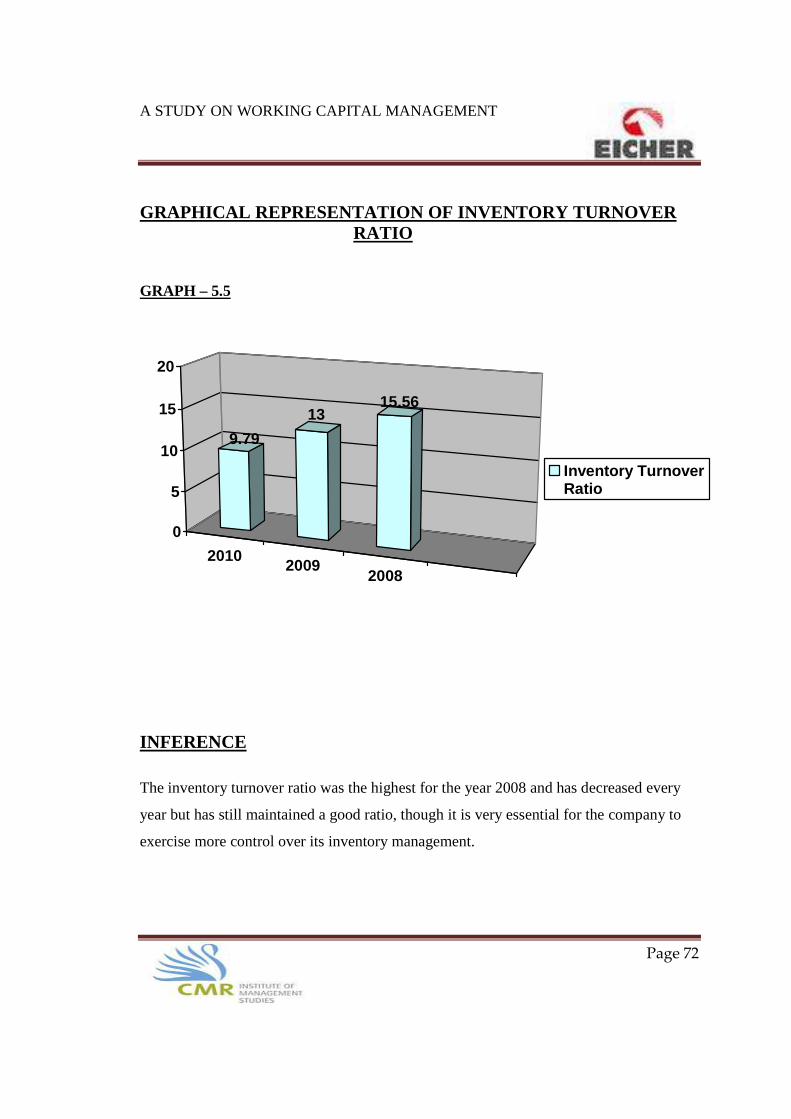
INVENTORY TURNOVER RATIO This ratio measures the number of times inventory is turned over during the year. High
inventory turnover can indicate a shortage of needed inventory for sales. Low inventory
turnover can indicate poor liquidity, possible overstocking and obsolescence or in
contrast to these negative interpretations, a planned inventory buildup in the case of
material shortages.
Inventory Turnover Ratio = Cost of Sales Inventory TABLE REPRESENTING INVENTORY TURNOVER RATIO (Rs.In millions) TABLE – 5.4
YEAR 2010 2009 2008
Cost of Goods Sold 15779.6 18684.8 12627.1
Average Stock 1612.4 1437.5 811.5
Inventory Turnover Ratio 9.79 13 15.56
ANALYSIS It can be observed from the table and the chart that the inventory turnover ratio for Eicher
Motors was 15.56 in 2008, 13 in 2009 and 9.79 in 2010. The inventory turnover ratio has
shown a decreasing trend for the period 2008 to 2010 which does not prove good for the
company.
A STUDY ON WORKING CAPITAL MANAGEMENT
Page 72
GRAPHICAL REPRESENTATION OF INVENTORY TURNOVER RATIO GRAPH – 5.5
20102009
2008
0
5
10
15
20
Inventory TurnoverRatio
9.79
1315.56
INFERENCE
The inventory turnover ratio was the highest for the year 2008 and has decreased every
year but has still maintained a good ratio, though it is very essential for the company to
exercise more control over its inventory management.
A STUDY ON WORKING CAPITAL MANAGEMENT
Page 73
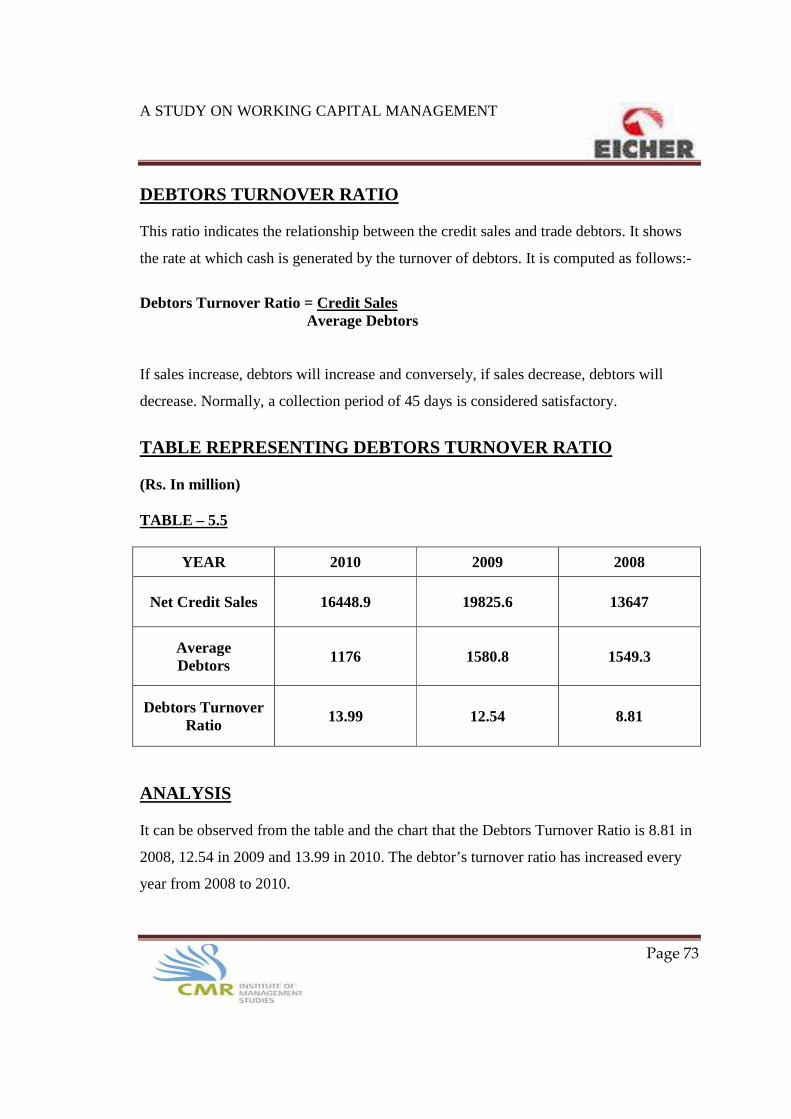
DEBTORS TURNOVER RATIO This ratio indicates the relationship between the credit sales and trade debtors. It shows
the rate at which cash is generated by the turnover of debtors. It is computed as follows:-
Debtors Turnover Ratio = Credit Sales Average Debtors If sales increase, debtors will increase and conversely, if sales decrease, debtors will
decrease. Normally, a collection period of 45 days is considered satisfactory.
TABLE REPRESENTING DEBTORS TURNOVER RATIO (Rs. In million) TABLE – 5.5
YEAR 2010 2009 2008
Net Credit Sales 16448.9 19825.6 13647
Average Debtors 1176 1580.8 1549.3
Debtors Turnover Ratio 13.99 12.54 8.81
ANALYSIS It can be observed from the table and the chart that the Debtors Turnover Ratio is 8.81 in
2008, 12.54 in 2009 and 13.99 in 2010. The debtor’s turnover ratio has increased every
year from 2008 to 2010.

A STUDY ON WORKING CAPITAL MANAGEMENT
Page 74
GRAPHICAL REPRESENTATION OF DEBTORS TURNOVER RATIO GRAPH – 5.6
20102009
2008
02468
10
12
14
Debtors TurnoverRatio
13.99
12.54
8.81
INFERENCE
There is a big increase in Debtors Turnover Ratio in 2009 compared to 2008 and a steady
increase in 2010 as compared to 2009, which proves to be very effective. Thus it can be
seen that the management of debtors has been good for the company and has been
improving over the period of time.

A STUDY ON WORKING CAPITAL MANAGEMENT
Page 75
CREDITORS TURNOVER RATIO This ratio expresses the relationship between credit purchase and the liability as creditors.
It can be stated as the number of days the credit purchases are carried on in the books.
Credit Turnover Ratio = Credit Purchases Average Creditors Note that non-credit purchases (salaries) and non cash expenses (depreciation) need to be
excluded from the credit purchases and any provisions need to be excluded from
creditors.
There is no need to pay the creditors before payment is due. The department’s objective
should be to make effective use of this source of free credit, while maintaining a good
relationship with the creditors.
Credit purchases should not be carried on the books for more than an average of 45 days.
If payment is withheld within 60 days or more it is likely that the creditors will become
impatient and impose stricter and less convenient trading terms, for example, cash on
delivery, etc.
The public finance act 1989 (section 49) places a legal constraint on the amount of credit
allowed to a department. It restricts to a maximum of 90 days the purchase of goods and
services through the use of credit card or supplier’s credit.

A STUDY ON WORKING CAPITAL MANAGEMENT
Page 76
TABLE REPRESENTING CREDITORS TURNOVER RATIO (Rs. In million) TABLE – 5.6
YEAR 2010 2009 2008
Credit Purchases 12662.8 14924.8 9585.3
Average Creditors 2350.5 2846 2446.3
Credit Turnover Ratio 4.87 5.64 5.77
ANALYSIS It can be observed from the table and the chart that the Creditors Turnover Ratio for
Eicher Motors was 5.77 in 2008, 5.64 in 2009 and 4.87 in 2010. The credit turnover ratio
has been showing a decreasing trend for the time period between 2008 – 2010.

A STUDY ON WORKING CAPITAL MANAGEMENT
Page 77
GRAPHICAL REPRESENTATION OF CREDIT TURNOVER RATIO GRAPH – 5.7
20102009
2008
4
4.5
5
5.5
6
Credit Turnover Ratio
4.87
5.64 5.77
INFERENCE
There has been a steady decrease in the Creditors Turnover Ratio in the period
2008 – 2010 which is not quite good for the company. Thus it is seen that the
management has not been improving the company for the year 2008 – 2010.

A STUDY ON WORKING CAPITAL MANAGEMENT
Page 78
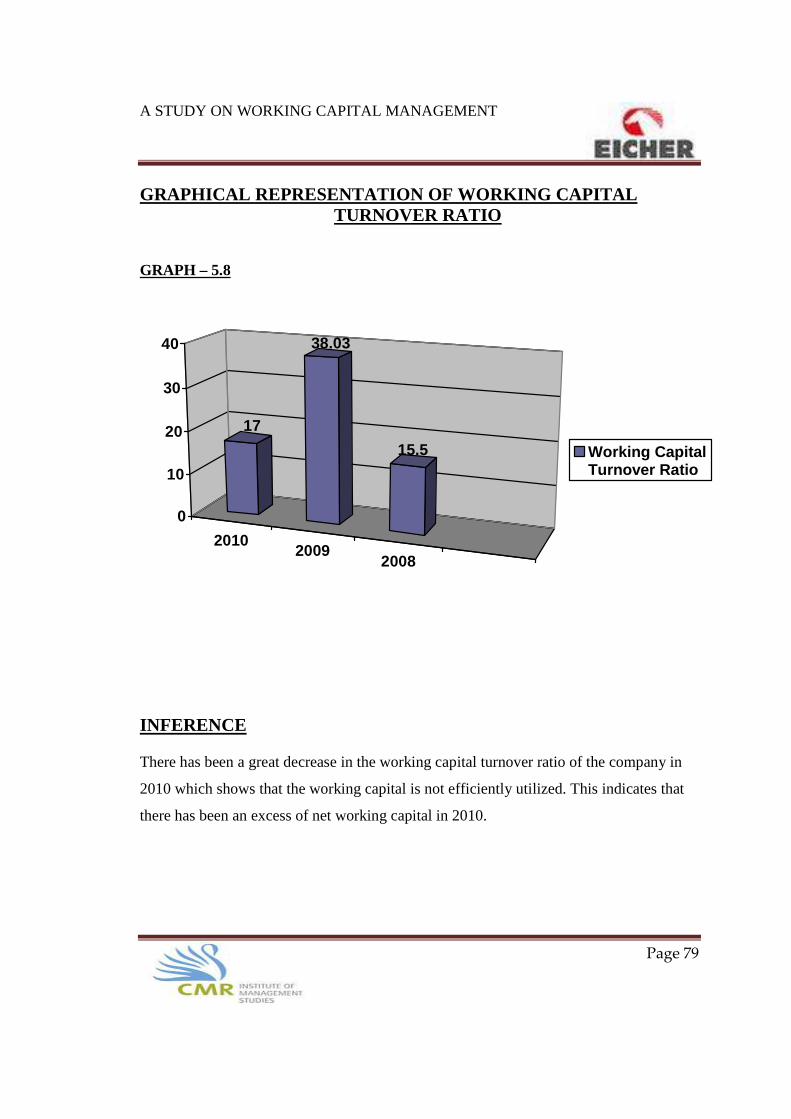
WORKING CAPITAL TURNOVER RATIO This ratio indicates the efficiency or inefficiency in the utilization of working capital in
making sales. A high working capital turnover ratio shows the effective utilization of
working capital in generating sales. A low ratio, on the other hand, may indicate excess
of net working capital. This ratio, thus, shows whether the working capital is efficiently
utilized or not.
Working Capital Turnover Ratio = Cost of Sales Net Working Capital TABLE REPRESENTING WORKING CAPITAL TURNOVER RATIO (Rs. In million) TABLE – 5.7
YEAR 2010 2009 2008
Cost of Goods Sold 15779.6 18684.8 12627.1
Net Working Capital 928 491.3 814.6
Working Capital Turnover Ratio 17 38.03 15.5
ANALYSIS It can be observed from the table and the chart that the Working Capital Turnover Ratio
was 15.5 in 2008, 38.03 in 2009 and 17 in the year 2010. The working capital turnover
ratio has shown an increasing and decreasing trend over the period between 2008 and
2010.
A STUDY ON WORKING CAPITAL MANAGEMENT
Page 79
GRAPHICAL REPRESENTATION OF WORKING CAPITAL TURNOVER RATIO GRAPH – 5.8
20102009
2008
0
10
20
30
40
Working CapitalTurnover Ratio
17
38.03
15.5
INFERENCE There has been a great decrease in the working capital turnover ratio of the company in
2010 which shows that the working capital is not efficiently utilized. This indicates that
there has been an excess of net working capital in 2010.
A STUDY ON WORKING CAPITAL MANAGEMENT
Page 80
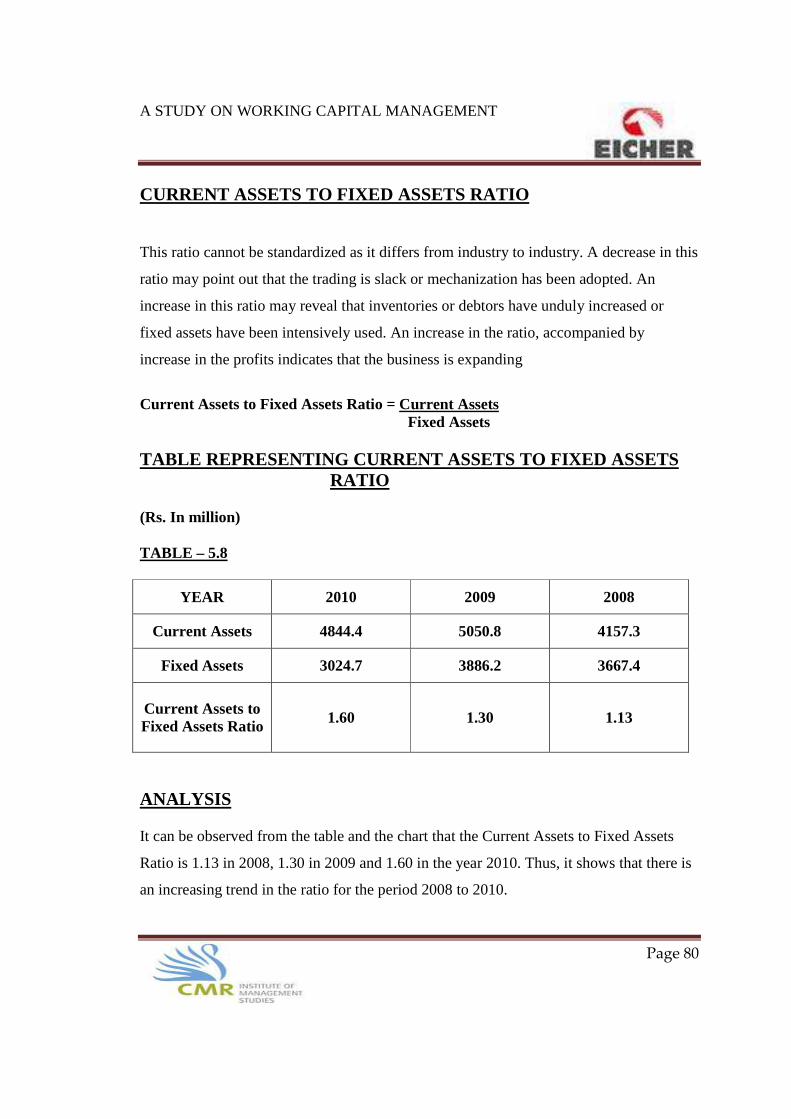
CURRENT ASSETS TO FIXED ASSETS RATIO This ratio cannot be standardized as it differs from industry to industry. A decrease in this
ratio may point out that the trading is slack or mechanization has been adopted. An
increase in this ratio may reveal that inventories or debtors have unduly increased or
fixed assets have been intensively used. An increase in the ratio, accompanied by
increase in the profits indicates that the business is expanding
Current Assets to Fixed Assets Ratio = Current Assets Fixed Assets TABLE REPRESENTING CURRENT ASSETS TO FIXED ASSETS RATIO (Rs. In million) TABLE – 5.8
YEAR 2010 2009 2008
Current Assets 4844.4 5050.8 4157.3
Fixed Assets 3024.7 3886.2 3667.4
Current Assets to Fixed Assets Ratio 1.60 1.30 1.13
ANALYSIS It can be observed from the table and the chart that the Current Assets to Fixed Assets
Ratio is 1.13 in 2008, 1.30 in 2009 and 1.60 in the year 2010. Thus, it shows that there is
an increasing trend in the ratio for the period 2008 to 2010.

A STUDY ON WORKING CAPITAL MANAGEMENT
Page 81
GRAPHICAL REPRESENTATION OF CURRENT ASSETS TO FIXED ASSETS RATIO GRAPH – 5.9
20102009
2008
0
0.5
1
1.5
2
Current Assets to FixedAssets Ratio
1.6
1.31.13
INFERENCE The ratio has been on a continuous uptrend over the past three years indicating that there
is a continuous increase in current assets but not proportionate increase in fixed assets.
This indicates that the firm has used its funds more towards carrying out its day-to-day
operations and not so much on its fixed assets.

A STUDY ON WORKING CAPITAL MANAGEMENT
Page 82
STATEMENT SHOWING CHANGES IN WORKING CAPITAL OF EICHER MOTORS FOR THE YEAR
2009 – 2010 (Rs. In millions)
PARTCULARS 2009 2010 Changes in Working
Capital CURRENT ASSETS
Inventories
Sundry Debtors
Cash & Bank
Other Current Assets
Loans & Advances
Total Current Assets (A)
1612.5
1580.8
310.4 -
1547.1
5050.8
1612.3
1176
261
77
1718.1
4844.4
Increase - - -
77
171
Decrease
0.2
404.8
49.4 - -
CURRENT LIABILITIES
Current Liabilities
Provisions
Total Current Liabilities (B)
3666.4
893.1
4559.5
2902.3
1014.1
3916.4
764.1 -
-
121
Net Working Capital (A-B)
Increase in Net Working Capital
491.3
436.7
928 -
-
436.7
TOTAL 928 928 1012.1 1012.1

A STUDY ON WORKING CAPITAL MANAGEMENT
Page 83
ANALYSIS
It can be observed from the table that Net Working Capital was 491.3 million in 2009 and
928 in 2010. Thus there has been an increase in the Net Working Capital of 436.7 in 2010
compared to 2009. This is good for the company as it has more surplus funds for carrying
out its operations and it can invest its surplus funds for new operations.
INFERENCE From the table it can be observed that the debtors balance has decreased which is good
for the company as it shows that it is able to get all its payment on time. Cash & Bank
balance has decreased which is again good for the company as it shows that the cash is
not being kept idle. Loans and Advances have increased which also proves to be good as
extra cash has been utilized and since it bears interest, it adds to extra revenue to the
company. Current Liabilities have decreased which is good for the company as it shows
that the company pays its dues on time, thus, enhancing the goodwill of the company.
A STUDY ON WORKING CAPITAL MANAGEMENT
Page 84
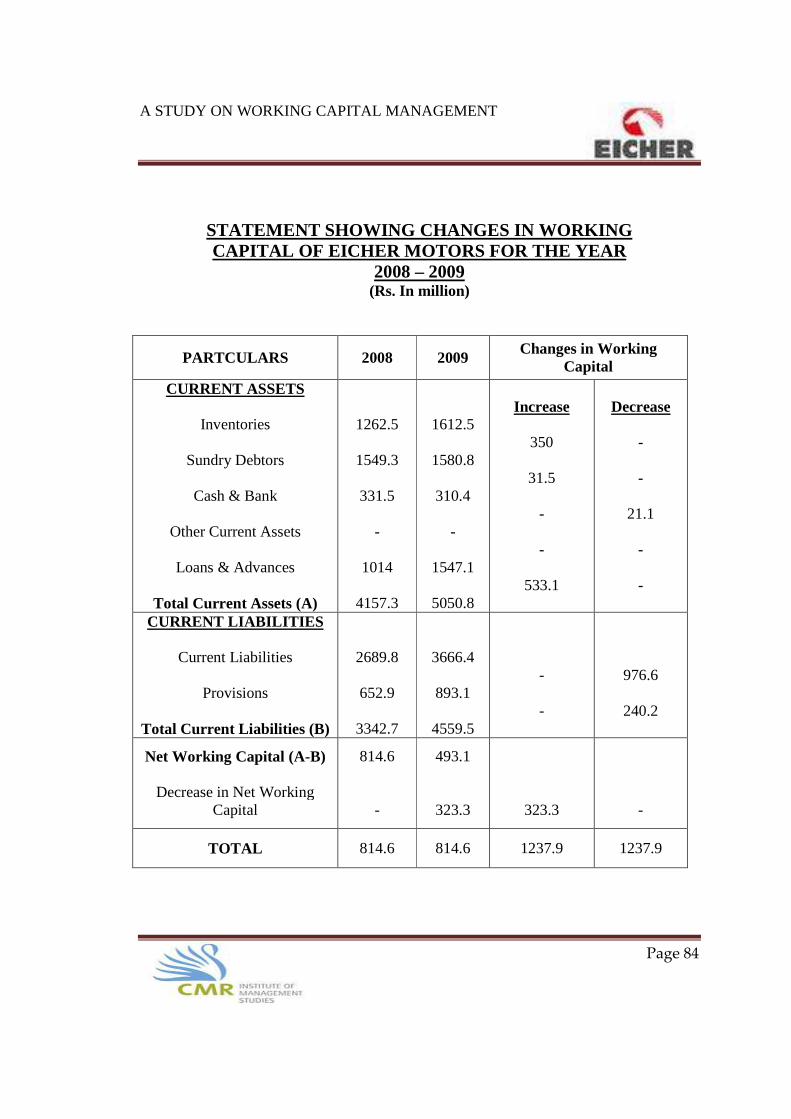
STATEMENT SHOWING CHANGES IN WORKING CAPITAL OF EICHER MOTORS FOR THE YEAR
2008 – 2009 (Rs. In million)
PARTCULARS 2008 2009 Changes in Working
Capital CURRENT ASSETS
Inventories
Sundry Debtors
Cash & Bank
Other Current Assets
Loans & Advances
Total Current Assets (A)
1262.5
1549.3
331.5 -
1014
4157.3
1612.5
1580.8
310.4 -
1547.1
5050.8
Increase
350
31.5 - -
533.1
Decrease - -
21.1 - -
CURRENT LIABILITIES
Current Liabilities
Provisions
Total Current Liabilities (B)
2689.8
652.9
3342.7
3666.4
893.1
4559.5
- -
976.6
240.2
Net Working Capital (A-B)
Decrease in Net Working Capital
814.6 -
493.1
323.3
323.3
-
TOTAL 814.6 814.6 1237.9 1237.9

A STUDY ON WORKING CAPITAL MANAGEMENT
Page 85
ANALYSIS It can be observed from the table that Net Working Capital was 814.6 million in 2008 and
491.3 million in 2009. Thus, there has been a decrease in Net Working Capital of 323.3
in 2009 when compared to 2008. This is bad for the company as it has fewer funds for
carrying out its operations.
INFERENCE From the table it can be observed that the inventories has increased which is bad for the
company as more of its funds are blocked in raw materials and work-in-progress which
does not have any output for the company. Debtor’s balances have marginally increased
which does not bear any effect, though it is high in both the years. Cash & Bank balance
have decreased which is good for the company as it is not keeping its cash idle. Loans &
Advances have increased which is good as extra cash is utilized and since it bears
interest, thus it adds extra revenue for the company as it affects the goodwill of the
company as the company fails to pay within the timeframe.

A STUDY ON WORKING CAPITAL MANAGEMENT
Page 86
STATEMENT SHOWING CHANGES IN WORKING CAPITAL OF EICHER MOTORS FOR THE YEAR
2007 – 2008 (Rs. In million)
PARTCULARS 2007 2008 Changes in Working
Capital CURRENT ASSETS
Inventories
Sundry Debtors
Cash & Bank
Other Current Assets
Loans & Advances
Total Current Assets (A)
360.5
518.7
9.2 -
269.1
1157.5
1262.5
1549.3
331.5 -
1014
4157.3
Increase
902
1030.6
322.3 -
744.9
Decrease - - - - -
CURRENT LIABILITIES
Current Liabilities
Provisions
Total Current Liabilities (B)
940.8
149.2
1090
2689.8
652.9
3342.7
- -
1749
503.7
Net Working Capital (A-B)
Decrease in Net Working Capital
67.5
747.1
814.6 -
-
747.1
TOTAL 814.6 814.6 2999.8 2999.8

A STUDY ON WORKING CAPITAL MANAGEMENT
Page 87
ANALYSIS It can be observed from the table that Net Working Capital was 67.5 million in 2007 and
814.6 in 2008. Thus there has been an increase in the Net Working Capital of 747.1 in
2008 as compared to 2007. This is good for the company as it has more surplus funds for
carrying out its operation and can invest its surplus funds for new operations.
INFERENCE From the table it can be observed that all balances have increased in 2008 which shows
that there has been an expansion in the company and thus the working capital
requirements has also increased. Both, the current asset and current liabilities has
increased up to a large extent showing the larger use of funds for production.

A STUDY ON WORKING CAPITAL MANAGEMENT
Page 88
SUMMARY

A STUDY ON WORKING CAPITAL MANAGEMENT
Page 89
SUMMARY This chapter covers the summary and findings from the balance sheet of the company for
three financial years.
Succeeding the analysis, the following was found using various data analysis tools:
FINANCIAL RATIO:
� It can be observed that the current ratio for the last three financial years is less
than the conventional 2:1 ratio which is not good for the company. The
investment in current assets has increased in the year 2009 but again decreased in
the 2010. Moreover, the current liabilities increased in 2009, but decreased in
2008. But this decrease is not in proportion to the decrease in current assets.
Moreover, the decrease in current assets is a lot higher than the decrease in
current liabilities and thus, brings the ratio further down. This might have a bad
impact on the liquidity and to the goodwill of the company.
� But analyzing the quick ratio it is found that the ratio for all three years has not
been satisfactory and has been less than the standard norm of 1:1. There has been
a considerable fall in the quick assets. On the account of such low ratios, the
business may find itself in serious financial difficulties.
� As observed from the absolute liquid ratio calculated, it is clear the absolute liquid
ratio has decreased from the financial year 2008 – 2010. This indicates that less
cash is available for discharging the current liabilities. This is possible only
because of substantial decrease in cash and bank balance over the three years.

A STUDY ON WORKING CAPITAL MANAGEMENT
Page 90
� The desirable ratio of inventory to working capital is 1:1. The ratio has been more
than the desirable ratio in all the three financial years. In the year 2009, it has
shown a ratio of 3.28 which is very good for the company, thus, showing the
efficiency in the functioning of the company.
� From the current asset to fixed ratio it has been observed that the company is
using more of its funds in current assets instead of fixed assets, which shows the
company uses most of its funds in day-to-day operations.
ACTIVITY RATIO:
� From the inventory turnover ratio it has been observed that the company has a
higher turnover ratio which indicates that more sales are being produced by
each rupee of investment in stock. Though the inventory turnover ratio has
been decreasing, still it is maintaining a good ratio which is good for the
company.
� From the debtors turnover ratio it has been observed that, debtors turnover
ratio has shown an increasing trend which is very good for the company. This
is due to increase in sales and decrease in average debtors. As per analysis
done, it has found that the company has efficiently managed its debtors and
thus it shows that they have a stringent debt collection policy. On the analysis
of trend, it can be inferred that the company collects its payment in 27days on
an average.

A STUDY ON WORKING CAPITAL MANAGEMENT
Page 91
� From the creditors turnover ratio it has been observed that creditor’s turnover
ratio has been steadily decreasing which is good for the company. On the
analysis of trend, it can be inferred that the company pays after 73 days on an
average which might prove bad with respect to the credit worthiness of the
company.
� From the working capital turnover ratio it has been observed that the ratio has
decreased greatly in 2010 as compared to 2009, though it is still good for the
company. In 2009, the ratio was very high which shows very efficient
utilization of working capital ingenerating sales in that year. The ratio
decreased in 2008 which shows that there has been an excess of net working
capital.
STATEMENT OF CHANGES IN WORKING CAPITAL:
� The year 2007 – 2008 shows a increase in the working capital, which
means the total fund invested in working capital has increased in the
year. Increase of Rs.747.1 million in the year has been possible because
of increase in both current assets and current liabilities. This increase
shows that there has been a great deal of expansion in the company.
� The year 2008 – 2009 shows a decrease in working capital, which
means the total fund invested in working capital, has decreased in the

A STUDY ON WORKING CAPITAL MANAGEMENT
Page 92
� Year. Decrease of Rs.323.3 million in the year has been possible
because of decrease in current asset except cash and bank and increase
in all current liability. This bad for the company as it has fewer funds
for carrying out its operations and the increase in current liabilities
shows that it is liable to pay more creditors which prove detrimental in
future for the company.
� The year 2009 - 2010 shows an increase in working capital by Rs.436.7
million, which means the total fund invested in working capital, has
increased in the year. This has been possible because of increase in the
current asset. The total increase in working capital has been less
because of increase in current liability. This is good for the company as
it has more surplus funds for carrying out its operations and it can
invest its surplus funds for new operations.

A STUDY ON WORKING CAPITAL MANAGEMENT
Page 93
RECOMMENDATIONS AND SUGGESTIONS

A STUDY ON WORKING CAPITAL MANAGEMENT
Page 94
RECOMMENDATIONS AND SUGGESTIONS
� Concentrating more on technical expertise and using its present resources on a
wider scale can improve the yield of the company.
� Proactively identifying the indirect cost and minimizing it can reduce these costs.
Further adopting Zero Based Budgeting can also reduce these costs. ZBB helps in
controlling expenses which are not directly related to a companies output such as
legal staff, personal office, etc. In ZBB, by delinking the budget from the past, the
past mistakes are not repeated.
� Optimum use of banking facilities by the company and also proper mix of short –
term and long - term investment will help the company to reduce its interest cost.
� The company can adopt ABC analysis more effectively for better control on its
inventories. This will in turn help to minimize the cost and help to generate more
cash.
� Better realization of debtors by reducing the number of days for the collection of
debt will help the company to generate more cash. This could be used to pay off
debts as well as create funds for growth expansion, diversification, capital
expenditure, etc.
� The company should reduce its average payment period because in the long run it
will affect its goodwill and the creditors will become impatient and may adopt
less credit policy for the company.

A STUDY ON WORKING CAPITAL MANAGEMENT
Page 95

A STUDY ON WORKING CAPITAL MANAGEMENT
Page 96
CONCLUSION
From the findings, it can be summarized that the company should focus on their level of
inventories. Having a regular sales forecast to determine the amount of raw materials
required will help avoid overstocking of raw materials. Techniques of inventory
management such as EOQ will optimize the order quantity. This would in turn ensure
liquidity of the company as funds don’t blocked up in company’s operations and
reduction of raw materials storage costs. Company’s working capital is a vital component
of day-to-day running of the business, without which the company will find it difficult to
survive in this competitive market. It is there for important to keep sufficient reserves to
cash to ensure timely payment to all the creditors and to meet the operational costs.
Owning to the volatility of the prices due to the nature of the commodity, speculative
transaction for the raw materials might take place to hedge the risk for the future. This
should be done taking into consideration the inventory requirement to avoid
overstocking.
The working capital of the company has been efficiently utilized. Even with a dip in the
working capital the company has managed to increase the sales in 2008 – 2009. A proper
check on the working capital requirements keeping in mind the above mentioned points
will maximize the company’s return on working capital.

A STUDY ON WORKING CAPITAL MANAGEMENT
Page 97
BIBLIOGRAPHY
A STUDY ON WORKING CAPITAL MANAGEMENT
Page 98
BIBLIOGRAPHY
1. Annual report of Eicher Motors (2008 – 2010)
2. Records and journals of Eicher Motors
3. Financial Management by I.M.Pandey
4. Financial Management by Himalaya Publishing House
5. www.economictimes.com
6. www. Eicherworld.com
7. www.moneycontrol.com
8. www.Investopedia .com
9. www.wikipedia .com
10. www.corbis.com

A STUDY ON WORKING CAPITAL MANAGEMENT
Page 99
ANNEXURE

A STUDY ON WORKING CAPITAL MANAGEMENT
Page 100
BALANCE SHEET FOR THREE FINANCIAL YEARS:
(Rs.In crore)
PARTICULARS MAR ‘10 MAR ‘ 09 MAR ‘ 08
Liabilities 12 Months 12 Months 12 Months
Share Capital 26.94 26.69 28.09
Reserves & Surplus 429.73 375.81 452.80
Net Worth 456.67 402.50 480.89
Secured Loans 14.36 8.75 3.37
Unsecured Loans 3.11 2.05 3.14
TOTAL LIABILITIES 474.14 413.30 487.40
Assets
Gross Block 159.27 145.93 135.73
(-) Acc. Depreciation 87.52 82.16 73.86
Net Block 71.75 63.77 61.87
Capital Work in Progress. 3.06 1.70 1.95
Investments. 463.98 299.55 11.68
Inventories 28.23 22.03 19.37
Sundry Debtors 3.64 5.19 5.08
Cash And Bank 11.10 114.00 482.81
Loans And Advances 57.65 50.67 22.96
Total Current Assets 100.62 191.89 530.22
Current Liabilities 124.19 112.77 91.54
Provisions 41.08 30.84 26.78
Total Current Liabilities 165.27 143.61 118.32
NET CURRENT ASSETS -64.65 48.28 411.90
Misc. Expenses 0.00 0.00 0.00
TOTAL ASSETS (A+B+C+D+E) 474.14 413.30 487.40

A STUDY ON WORKING CAPITAL MANAGEMENT
Page 101
PROFIT AND LOSS ACCOUNT FOR THREE FINANCIAL YEARS:
(Rs.In Crore) PARTICULARS MAR ‘10 MAR ‘09 MAR ‘08
12 Months 12 Months 12 Months
INCOME:
Sales Turnover 488.32 411.42 2,533.19 Excise Duty 46.34 32.92 314.36 NET SALES 441.98 378.50 2,218.83 Other Income 0.00 0.00 0.00 TOTAL INCOME 479.32 408.22 2,236.91
EXPENDITURE:
Manufacturing Expenses 7.66 7.30 26.24 Material Consumed 298.47 243.20 1,629.97 Personal Expenses 39.37 31.74 128.47 Selling Expenses 24.60 31.95 204.11 Administrative Expenses 27.07 36.67 100.39 Expenses Capitalized 0.00 0.00 -0.3 Provisions Made 0.00 0.00 0.00 TOTAL EXPENDITURE 397.17 350.86 2,088.82 Operating Profit 44.81 27.64 130.01 EBITDA 82.15 57.36 148.09 Depreciation 10.79 10.10 43.07 Other Write-offs 0.00 0.00 0.63 EBIT 71.36 47.26 104.39 Interest 2.57 0.42 17.77 EBT 68.79 46.84 86.62 Taxes 11.17 9.10 22.56 Profit and Loss for the Year 57.62 37.74 64.06 Non Recurring Items 17.53 -0.2 -1.90 Other Non Cash Adjustments 0.29 -95.19 0.89 Other Adjustments 0.00 95.23 0.00 REPORTED PAT 75.44 37.53 63.05
KEY ITEMS
Preference Dividend 0.00 0.00 0.00 Equity Dividend 29.63 18.69 14.05 Equity Dividend (%) 109.98 147.63 50.01 Shares in Issue (Lakhs) 269.38 126.60 280.94 EPS - Annualized (Rs) 28.01 29.64 22.44