Embed Size (px)
Citation preview
EnSys Energy EnSys Energy -- NavigisticsNavigistics -- RTIRTI
Outlook for Marine Fuels Demand & Regulation:
Implications for Refining and Are We Getting Global Oil Demand Forecasting Wrong?
Martin R Tallett, EnSys Energy & Systems, Inc
David St Amand, Navigistics Consulting Martin T Ross, RTI International
USAEE/IAEE Ann Arbor Conference September 2006

EnSys Energy EnSys Energy -- NavigisticsNavigistics -- RTIRTI
DisclaimerOutlook for Marine Fuels Demand & Regulation: Implications for Refining and Are We Getting
Global Oil Demand Forecasting Wrong?
The authors would like to acknowledge that, although partial funding for the research and WORLD modeling underpinning this paper was provided by the US EPA, the views expressed herein are solely those of the authors

EnSys Energy EnSys Energy -- NavigisticsNavigistics -- RTIRTI
AbstractOutlook for Marine Fuels Demand & Regulation: Implications for Refining and Are We Getting
Global Oil Demand Forecasting Wrong?
With progressively advancing quality regulations for domestic transport fuels, international marine bunkers are becoming increasingly visible – and unacceptable –contributors to global pollution New MARPOL regulations and the advent of SOx Emission Control Areas (SECAs) are but the first steps in a potentially long road ahead for extensive clean-up of these fuels Recent work by the authors has focused on projecting bunker fuel demands and then simulating, using the EnSys WORLD model, the impacts of SECAs and other regulations on the global downstream and refining industries
• Compared to the widely-used IEA estimate of around 150 mmtpa for international bunkers demand (marine diesel plus residual fuels), rigorous analysis of shipping fleets, engines, fuel consumption characteristics, trade patterns and volumes has led to the conclusion that actual bunker consumption is more like twice the IEA figure, ie, in today’s oil statistics, there is a misallocation of fuel uses Further, based on the authors’ estimate that bunker fuel demand will grow at close to 3% pa, compared to flat growth in inland residual fuel demand, the implication is that current forecasts understate future global oil – and especially residual - demand, by potentially 17 mmbpd gross in 2020 (This is partially offset by reductions in by-products) Such a significant shift in future product demand levels and patterns (ie, more residual fuel) would have important implications for refining investments and margins These changes have been evaluated and quantified for 2020 using the EnSys WORLD model

EnSys Energy EnSys Energy -- NavigisticsNavigistics -- RTIRTI
AbstractOutlook for Marine Fuels Demand & Regulation: Implications for Refining and Are We Getting
Global Oil Demand Forecasting Wrong?
Superimposed on this scenario are potential major new regulations to reduce emissions of SOx, NOx and probably particulates from marine fuels While bunker fuel desulfurization represents one primary means for compliance, regulations in place and under consideration actively encourage other methods, notably on-board scrubbing and emissions trading These present a range of plausible compliance scenarios, from a potential need to incur widespread costly desulfurization of residual streams to an outlook where (through scrubbing and emissions trading) marine fuels sulfur levels could increase and emissions targets still be met The potential for substantially higher bunkers demand than are conventionally considered further raises the costs – and the stakes –for the global downstream industry
• The implications of this work for projecting global oil demand and impacts on the downstream are far reaching This paper examines the issues and presents quantitative projections

EnSys Energy EnSys Energy -- NavigisticsNavigistics -- RTIRTI
Summary of Presentation
• Marine fuels emissions becoming unacceptable• Will be increasingly regulated (IMO/MARPOL)• Current statistical sources understate bunkers demand• Means future bunkers and total oil demand is being
under-estimated• Under-estimates & regulatory outlooks impact on the
refining industry & add uncertainty

EnSys Energy EnSys Energy -- NavigisticsNavigistics -- RTIRTI
Marine Fuels Emissions & Regulationmarine is energy efficient form of transport
Source: Canadian Shipowners’ Association, MARPOL Annex VI Consultation Meeting, Washington, DC, February, 2006
EnSys Energy EnSys Energy -- NavigisticsNavigistics -- RTIRTI
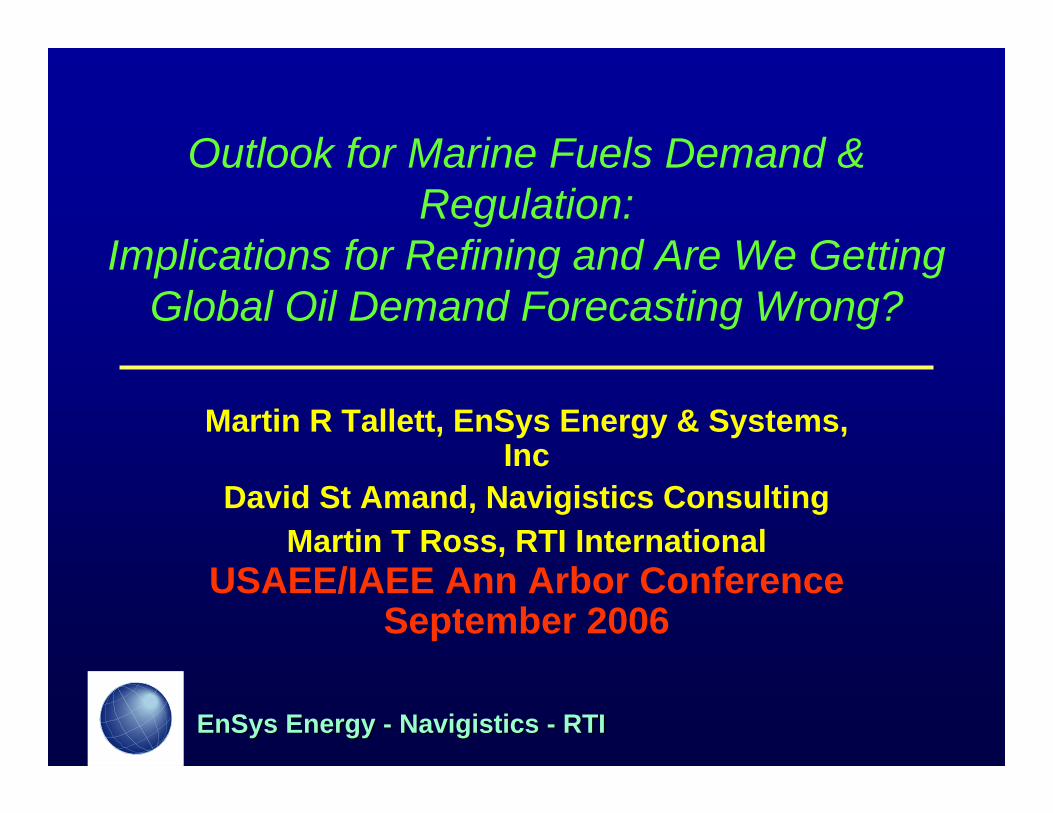
Marine Fuels Emissions & Regulation3 main classes of marine fuel
several grades within each classshift to higher IFO viscosities (500/700)
Marine Bunker Fuel Types
MGO Marine Gasoil "No 2" middle distillate / diesel
MDO Marine Diesel "No 4" heavy distillate / some resid content
IFO 180/380/500/700 Residual/Intermediate "No 6"
primarily resid fractions / cracked stocks

EnSys Energy EnSys Energy -- NavigisticsNavigistics -- RTIRTI
Marine Fuels Emissions & Regulation
Approx 75% of bunkers is residual (IFO grades)Marine Bunker Fuel Make up (2003) mmtpa
202.7
31.6
61.3
9.4
IFO380+
IFO180
MDO
MGO

EnSys Energy EnSys Energy -- NavigisticsNavigistics -- RTIRTI
Marine Fuels Emissions & Regulation
• With advancing regulation of gasoline, diesel, marine fuels emissions stand out – and are unacceptable– Ships generate
• 30% of global NOx• 10% global SOx
– 1 ship’s emissions = 350,000 cars– People near ports are claimed to experience more cancer,
asthma, respiratory illness– Image as “dumping ground”– High sulfur and also high metals, used lubes, catalyst fines,
petrochemicals by-products

EnSys Energy EnSys Energy -- NavigisticsNavigistics -- RTIRTI
Marine Fuels Emissions & Regulation
• Regulations geared to SOx, NOx, VOC, PM potentially CO2 controls
• Multiple regulatory levels– international UN /IMO / MARPOL – Regional/national “SECA’s” SOx Emission
Control Areas– State/port e.g. CA, Los Angeles, Houston

EnSys Energy EnSys Energy -- NavigisticsNavigistics -- RTIRTI
Marine Fuels Emissions & Regulation
Possible Timeline IMO & SECA's2004 ratification of Annex VI2005 global 4.5% cap2006 EU SECA Baltic & ferries2007 EU SECA North Sea2007 CA MDO max 0.5%2008 global PM, NOx ??2010 global 3% ??2010 CA MDO max 0.1% + ??
2010 - 2015 additional SECA's- EU Med- USA, Canada, Mexico- Japan, Korea, Singapore- other?tighter standards in SECA'sglobal 1.5% ??
• We have set off down a long, continuing, complex regulatory path
• Multiple stages continuing to/beyond 2015

EnSys Energy EnSys Energy -- NavigisticsNavigistics -- RTIRTI
Marine Fuels Emissions & Regulation

EnSys Energy EnSys Energy -- NavigisticsNavigistics -- RTIRTI
Marine Fuels Emissions & Regulation
– Establishes standards in form of emissions
– Limits used lube oils catalyst fines
– Recognizes on-board abatement
– Recognizes SECA’s(SOx Emission Control Areas)
• Latest international standard (basis Annex VI) is ISO 8217 2005
Emissions Controls
SOx gm/kWh
equivalent S standard
SOx gm/kWh
equivalent S standard
Sulfur 18 4.5% 6 1.5%NOx
MARPOL / ISO 8217 SECA (initial standard)
9.8 - 17 gm/kWh depending on engine type

EnSys Energy EnSys Energy -- NavigisticsNavigistics -- RTIRTI
Marine Fuels Emissions & Regulation• Sulfur cap has been 5% (now 4.5%) on IFO but• Global average is 2.7%
• Some 60 ports supply <1.5%

EnSys Energy EnSys Energy -- NavigisticsNavigistics -- RTIRTI
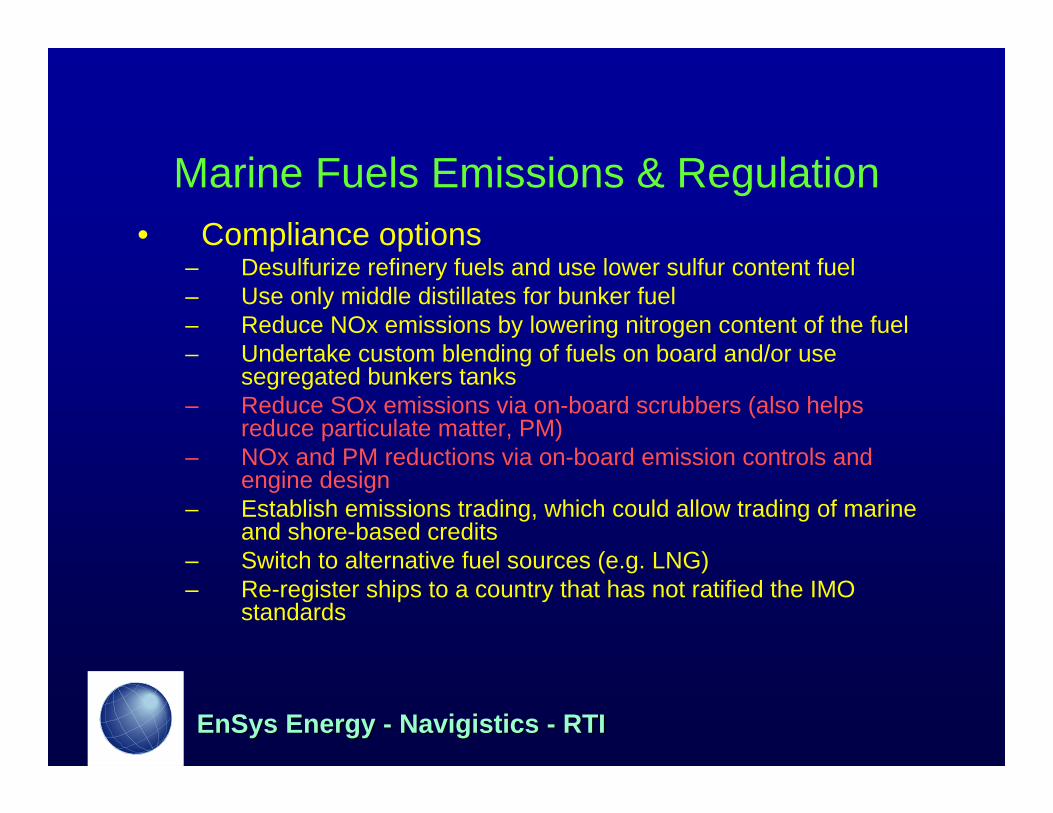
Marine fuel regulations• Compliance options
– Desulfurize refinery fuels and use lower sulfur content fuel– Use only middle distillates for bunker fuel– Reduce NOx emissions by lowering nitrogen content of the fuel– Undertake custom blending of fuels on board and/or use
segregated bunkers tanks– Reduce SOx emissions via on-board scrubbers (also helps
reduce particulate matter, PM)– NOx and PM reductions via on-board emission controls and
engine design– Establish emissions trading, which could allow trading of marine
and shore-based credits– Switch to alternative fuel sources (eg, LNG)– Re-register ships to a country that has not ratified the IMO
standards

EnSys Energy EnSys Energy -- NavigisticsNavigistics -- RTIRTI
Marine Fuels Emissions & Regulation
• Resid upgrading costly• Coking upgrading too• But coking offers bigger
value upgrade
Product Product Value as a % of Crude
WTI Cushing Crude (1) 100Premium Gasoline (2) 150Regular Gasoline (2) 137LS Diesel (2) 141Regular Diesel (2) 136Home Heating Oil (2) 134Butane (1) 87No. 6 HFO 1% S (1) 76No. 6 HFO 3% S (1) 67
(1) Platts Cargoes(2) Toronto RackAvg of 2000 to 2005Source: Gerry Ertel, Shell Canada
Capital Costs for ProcessingArab Light Vacuum Resid
HDS $450-600 mmCoking project $750-900 mm
Source: Andrew Madden, ExxonMobil Refining & Supply
EnSys Energy EnSys Energy -- NavigisticsNavigistics -- RTIRTI
Marine Fuels Emissions & Regulation• Compliance options
– Desulfurize refinery fuels and use lower sulfur content fuel– Use only middle distillates for bunker fuel– Reduce NOx emissions by lowering nitrogen content of the fuel– Undertake custom blending of fuels on board and/or use
segregated bunkers tanks– Reduce SOx emissions via on-board scrubbers (also helps
reduce particulate matter, PM)– NOx and PM reductions via on-board emission controls and
engine design– Establish emissions trading, which could allow trading of marine
and shore-based credits– Switch to alternative fuel sources (e.g. LNG)– Re-register ships to a country that has not ratified the IMO
standards

EnSys Energy EnSys Energy -- NavigisticsNavigistics -- RTIRTI
Marine Fuels Emissions & Regulation initial scrubber trials looking successful
opens possibility to maintain even raise S level
• P&O Ferries mv Pride of Kent– SOx reduction > 99%– NOx reduction < 5%– Particulate reduction ~
80%
but issues of retrofitting ($0.5 – 4 mm), waste disposal, use in harbor
1 MW Krystallon Sea Water Scrubber
Installed 18th December 2006

EnSys Energy EnSys Energy -- NavigisticsNavigistics -- RTIRTI
Marine Fuels Emissions & Regulation• Compliance options
– Desulfurize refinery fuels and use lower sulfur content fuel– Use only middle distillates for bunker fuel– Reduce NOx emissions by lowering nitrogen content of the fuel– Undertake custom blending of fuels on board and/or use
segregated bunkers tanks– Reduce SOx emissions via on-board scrubbers (also helps
reduce particulate matter, PM)– NOx and PM reductions via on-board emission controls and
engine design – Establish emissions trading, which could allow trading of marine
and shore-based credits– Switch to alternative fuel sources (e.g. LNG)– Re-register ships to a country that has not ratified the IMO
standards

EnSys Energy EnSys Energy -- NavigisticsNavigistics -- RTIRTI
Bunkers Demand Analysisrigorous “activity” based approach
Data/modeling system comprises several activity components / sub-models
• major trade routes• estimated volumes of cargo of various types on
each route• types of ship serving those routes and carrying
those cargoes • types/characteristics of engines used by those
ships• types and estimated quantities of fuels used by
those engines

EnSys Energy EnSys Energy -- NavigisticsNavigistics -- RTIRTI
Bunkers Demand Analysisrigorous “activity” based approach
Employs multiple data sources / projections• Shipping fleet data
» Clarksons• Engine characteristics
» Industry sources / marine engine manufacturers» Prior research
• Fleet turnover» Ship efficiency trends
• International cargo trade flows historical & projected» Global Insight Global Trade Service 23 regions» Basis??? In terms of world economic growth
• Port / other data

EnSys Energy EnSys Energy -- NavigisticsNavigistics -- RTIRTI
Bunkers Demand Analysisrigorous “activity” based approach
Disaggregates international cargo categories• liquid bulk – crude oil• liquid bulk – refined petroleum products• liquid bulk – residual petroleum products• liquid bulk – chemicals (organic and inorganic)• liquid bulk –gas (including LNG and LPG)• dry bulk (e.g. grain, coal, steel, ores and scrap)• general cargo (including neobulk, lumber/forest
products)• containerizable cargo

EnSys Energy EnSys Energy -- NavigisticsNavigistics -- RTIRTI
Bunkers Demand Analysisrigorous “activity” based approach
Defines U.S. domestic traffic• liquid bulk – crude oil (Alaska)• liquid bulk – petroleum products• dry bulk – Great Lakes• container tradeCharacterizes non – cargo shipping• Passenger ships – cruise / ferry• Fishing (blue water)• Military

EnSys Energy EnSys Energy -- NavigisticsNavigistics -- RTIRTI
Bunkers Demand Analysis
Modeling System
– validated on 2003
- projections to 2020

EnSys Energy EnSys Energy -- NavigisticsNavigistics -- RTIRTI
Bunkers Demand AnalysisHistorical / Current Demand
Major statistical sources understate bunkers demand
IEA acknowledges there is an issue
Reported / Estimated World Bunkers Consumption
050
100150200250300350
mill
ion
tpa
DistillateResidTotal
Distillate 79 71
Resid 133 234
Total 140 212 305 281 289 255
IEA (2003) EIA (2003)RTI/Navigistic
s/EnSys (2003)
Koehler (2003)
Corbett & Koehler (2004)
Meech (2004)
EnSys Energy EnSys Energy -- NavigisticsNavigistics -- RTIRTI
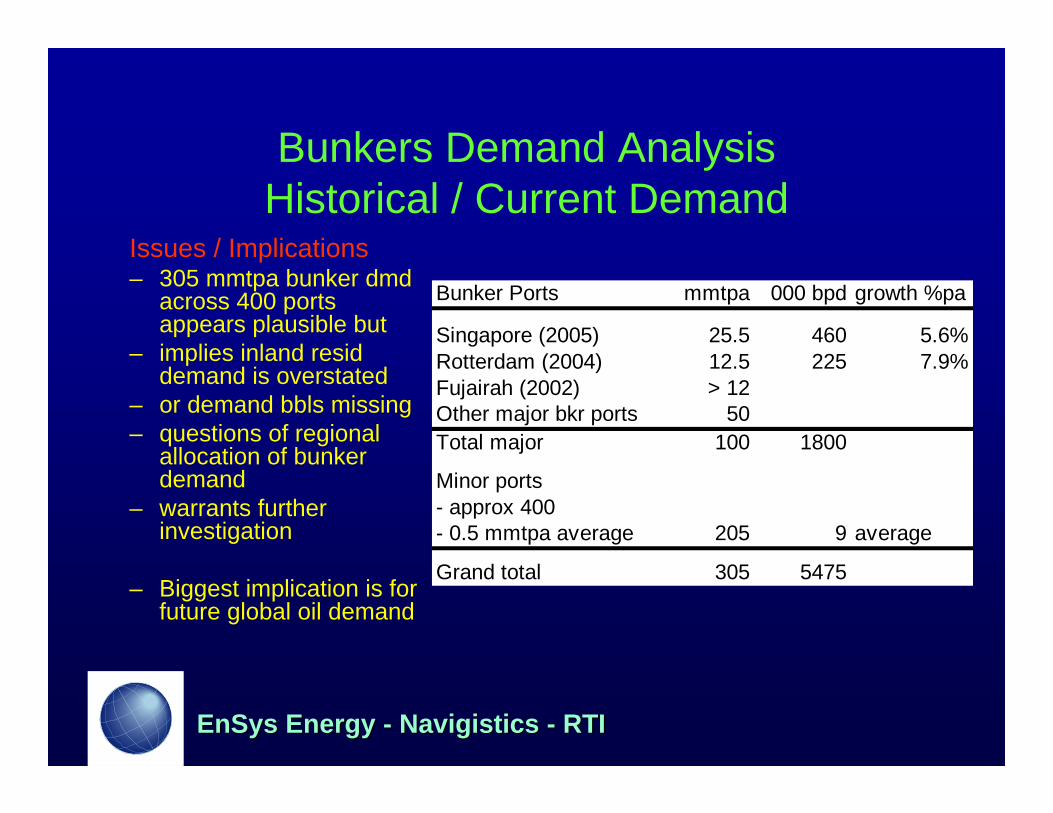
Bunkers Demand AnalysisHistorical / Current Demand
Issues / Implications– 305 mmtpa bunker dmd
across 400 ports appears plausible but
– implies inland resid demand is overstated
– or demand bbls missing– questions of regional
allocation of bunker demand
– warrants further investigation
– Biggest implication is for future global oil demand
Bunker Ports mmtpa 000 bpd growth %pa
Singapore (2005) 25.5 460 5.6%Rotterdam (2004) 12.5 225 7.9%Fujairah (2002) > 12Other major bkr ports 50Total major 100 1800
Minor ports- approx 400- 0.5 mmtpa average 205 9 average
Grand total 305 5475
EnSys Energy EnSys Energy -- NavigisticsNavigistics -- RTIRTI
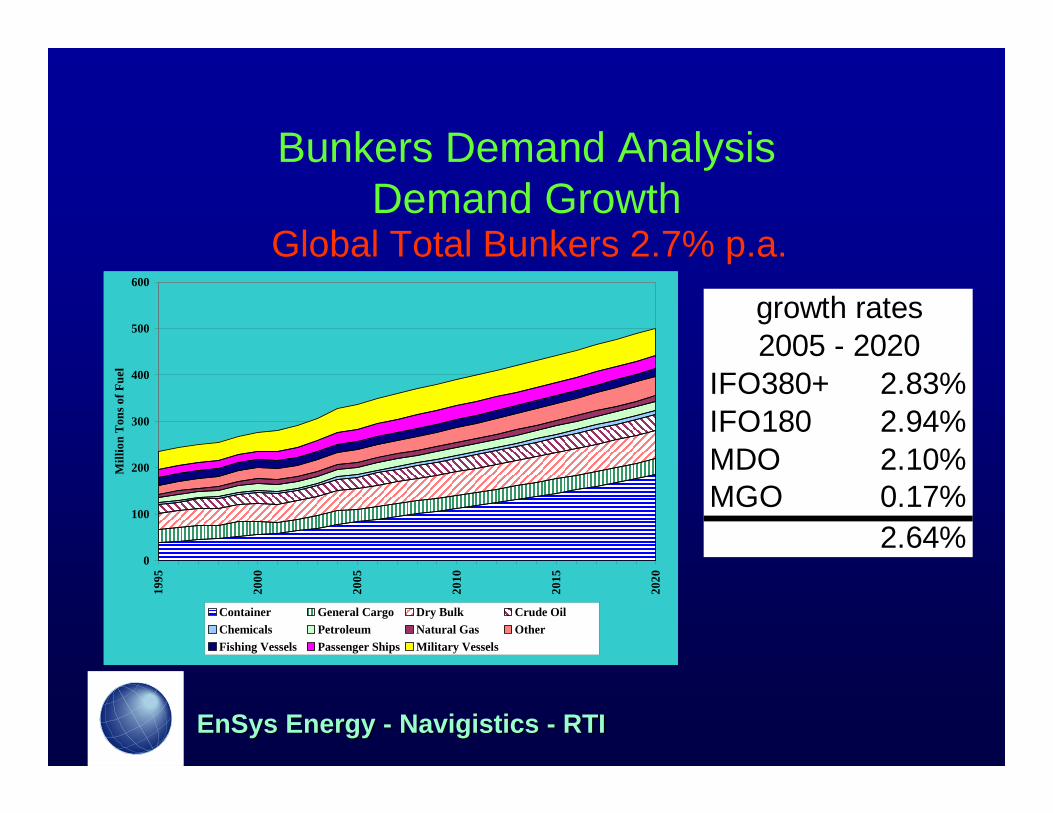
Bunkers Demand AnalysisDemand Growth
Global Total Bunkers 2.7% p.a.
0
100
200
300
400
500
600
1995
2000
2005
2010
2015
2020
Mill
ion
Ton
s of F
uel
Container General Cargo Dry Bulk Crude OilChemicals Petroleum Natural Gas OtherFishing Vessels Passenger Ships Military Vessels
IFO380+ 2.83%IFO180 2.94%MDO 2.10%MGO 0.17%
2.64%
growth rates2005 - 2020

EnSys Energy EnSys Energy -- NavigisticsNavigistics -- RTIRTI
Bunkers Demand AnalysisDemand Growth
System Gives Breakdown by Fuel Type
0
50
100
150
200
250
300
350
400
1995
2000
2005
2010
2015
2020
Mill
ion
Ton
s of F
uel
Container General Cargo Dry Bulk Crude OilChemicals Petroleum Natural Gas OtherFishing Vessels Passenger Ships Military Vessels
0
10
20
30
40
50
60
1995
2000
2005
2010
2015
2020
Mill
ion
Ton
s of F
uel
Container General Cargo Dry Bulk Crude OilChemicals Petroleum Natural Gas OtherFishing Vessels Passenger Ships Military Vessels
0
20
40
60
80
100
120
1995
2000
2005
2010
2015
2020
Mill
ion
Ton
s of F
uel
Container General Cargo Dry Bulk Crude OilChemicals Petroleum Natural Gas OtherFishing Vessels Passenger Ships Military Vessels
IFO 380IFO 380IFO 180IFO 180
MGO/MDOMGO/MDO

EnSys Energy EnSys Energy -- NavigisticsNavigistics -- RTIRTI
Bunkers Demand AnalysisDemand Growth
Switching resid demand from inland (0% growth rate) to bunkers (2.7%) alters the outlook for total oil demand – volume and mix
Impact of RTI Bunkers Projections on Global Oil Demand 2020
(2.00)
(1.50)
(1.00)
(0.50)
0.00
0.50
1.00
1.50
2.00
2.50
3.00
mm
bpd
GASOIL/DSLBKRS - MGOBKRS - MDORESIDUAL - INLANDBKRS - IFO180BKRS - IFO380
TOTAL OIL TOTAL DISTILLATESTOTAL RESIDUAL
Series1 (1.44) 0.17 1.12 (1.33) 0.48 2.69 1.68 (0.15) 1.84
GASOIL/DSL
BKRS - MGO
BKRS - MDO
RESIDUAL -
INLAND
BKRS - IFO180
BKRS - IFO380
TOTAL OIL
TOTAL DISTILLATES
TOTAL RESIDU
AL

EnSys Energy EnSys Energy -- NavigisticsNavigistics -- RTIRTI
Bunkers Demand AnalysisDemand Growth
Switching resid demand from inland (0% growth rate) to bunkers (2.7%) alters the outlook for total oil demand
– volume and mix• 2020
– Total oil demand + 1.68 mmbpd– Total resid demand + 1.84 mmbpd– Shifts in allocation of demand from inland to marine – Resulting quality (sulfur) shifts depend on status of
MARPOL/SECA regs

EnSys Energy EnSys Energy -- NavigisticsNavigistics -- RTIRTI
Global Refining / Market AnalysisWORLD Model
• Integrated LP model of the global downstream:– Crudes & non-crudes supply– Refining and “non-refinery” processing & investments– Product demand & quality– Transportation of crudes, non-crudes, intermediate and finished
products• Not a price/supply/demand forecasting tool• Captures the activities and economics of the downstream under
user-defined short/medium/long term scenarios• Valuable for analysis of the combined impacts of sector
developments on refining activities, investments, crude and product trade, associated economics
• Used by and for: DOE, EIA, EPA, API, OPEC, major oil companies

EnSys Energy EnSys Energy -- NavigisticsNavigistics -- RTIRTI
Global Refining / Market AnalysisWORLD Model
• Integrated LP model of the global downstream:– Crudes & non-crudes supply– Refining and “non-refinery” processing & investments– Product demand & quality– Transportation of crudes, non-crudes, intermediate and
finished products• Not a price/supply/demand forecasting tool• Captures the activities and economics of the downstream under
user-defined short/medium/long term scenarios• Valuable for analysis of the combined impacts of sector
developments on refining activities, investments, crude and product trade, associated economics
• Used by and for: DOE, EIA, EPA, API, OPEC, major oil companies
EnSys Energy EnSys Energy -- NavigisticsNavigistics -- RTIRTI
Global Refining / Market AnalysisWORLD Model
• Integrated LP model of the global downstream:– Crudes & non-crudes supply– Refining and “non-refinery” processing & investments– Product demand & quality– Transportation of crudes, non-crudes, intermediate and
finished products• Not a price/supply/demand forecasting tool• Captures the activities and economics of the downstream under
user-defined short/medium/long term scenarios• Valuable for analysis of the combined impacts of sector
developments on refining activities, investments, crude and product trade, markets, associated economics
• Used by and for: DOE, EIA, EPA, API, OPEC, major oil companies

EnSys Energy EnSys Energy -- NavigisticsNavigistics -- RTIRTI
Global Refining / Market Analysis WORLD Model
• Study undertaken using 18 region global version
Rest of AsiaChina
Pacific High Growth – non OECD IndustrialisingEast/South Africa
Pacific High Growth – OECDNorth Africa/Eastern MediterraneanMiddle East West Africa Russia & Other FSURest of South AmericaCaspian RegionGreater CaribbeanEastern Europe US West Coast & Canada WestSouth Europe
US Gulf Coast, Interior & Canada East
North Europe US East Coast

EnSys Energy EnSys Energy -- NavigisticsNavigistics -- RTIRTI
Global Refining / Market Analysis WORLD Inputs & Outputs
• Inputs– Supply, demand, world oil price scenario– “Bottom up” detail of supply, demand, quality, refining,
transport
• Outputs US and global:– refinery throughputs, capacity additions & investments– crudes & products market pricing / differentials– crude & product trade flows

EnSys Energy EnSys Energy -- NavigisticsNavigistics -- RTIRTI
Global Refining / Market Analysis WORLD Results 2020 – Effects of RTI Projection
• 2020– Total oil demand
+ 1.68 mmbpd– Total resid
demand + 1.84 mmbpd
– Shifts in allocation of demand from inland to marine
GLOBAL OIL DEMAND BY PRODUCT CATEGORY"IEA" and "RTI" Bases for Bunkersmillion bpd 2020 2020 2020Bunkers Basis IEA RTI impact
of switchto RTI basis
DEMAND BY PRODUCT TYPELPG 8.56 8.56 0.00NAPHTHA 6.88 6.88 0.00GASOLINE 25.20 25.20 0.00KERO/JET 8.07 8.07 0.00GASOIL/DIESEL/NO2 30.59 29.15 (1.44)GASOIL/DIESEL - BKRS 0.63 1.92 1.29RESIDUAL - INLAND INCL RFO 8.17 6.84 (1.33)RESIDUAL - BKRS 3.70 6.87 3.17OTHER 11.88 11.88 0.00
TOTAL OIL DEMAND 103.70 105.38 1.68
Total Residual Demand 11.87 13.71 1.84Residual as % Total Demand 11.4% 13.0%

EnSys Energy EnSys Energy -- NavigisticsNavigistics -- RTIRTI
Global Refining / Market Analysis WORLD Results 2020 – Effects of RTI Projection
• Increased crude run (n.b. 50% light stream content) & increased proportion of resid demand– Raise crude capacity but– Reduce upgrading– Reduce desulfurization
(only Baltic SECA in 2020 base case)
– Cut refining investments
Investments $bn ($10)(before replacements)
Process Capacity mmbpcdcrude distillation 1.30coking / visbreaking (0.10)cat - cracking (0.14)hydro - cracking (0.63)HDS - distillate (0.37)HDS - VGO/resid (0.60)H2 (mm bfoed) (0.11)Sulfur tpd (5170)

EnSys Energy EnSys Energy -- NavigisticsNavigistics -- RTIRTI
Global Refining / Market Analysis WORLD Results 2020 – Effects of RTI Projection
• Cut:– Crude
differentials– Light / heavy
product differentials
– Refining margins
Crude Price Differentials (FOB)Saudi Light Marker Price = $45.50/bbl
$-
$1.00
$2.00
$3.00
$4.00
$5.00
$6.00
$7.00
$8.00
$9.00
WTI - Maya Brent - Dubai Minas - Saudi Heavy
"IEA"
"RTI"

EnSys Energy EnSys Energy -- NavigisticsNavigistics -- RTIRTI
Global Refining / Market Analysis WORLD Results 2020 – Effects of RTI Projection
• Cut:– Crude
differentials– Light / heavy
product differentials
– Refining margins
ULSD - Resid (IFO380 HS)
$-
$2.00
$4.00
$6.00
$8.00
$10.00
$12.00
$14.00
$16.00
$18.00
USGC NW E Singapore
$/bb
l "IEA"
"RTI"
Gasoline - Resid (IFO380 HS)
$-
$2.00
$4.00
$6.00
$8.00
$10.00
$12.00
$14.00
$16.00
$18.00
USGC NW E Singapore
$/bb
l "IEA"
"RTI"

EnSys Energy EnSys Energy -- NavigisticsNavigistics -- RTIRTI
Implications
• Marine Fuels Quality– Marine bunker fuels will join gasoline and diesel
and be increasingly regulated– Goals are emissions reduction
• SOx, NOx, PM, VOC, CO2
– Responsibility and mechanisms for compliance highly uncertain
• Shippers?, refiners / blenders?• Processing?, replace resid with diesel? Scrubbing?,
emissions trading?

EnSys Energy EnSys Energy -- NavigisticsNavigistics -- RTIRTI
Implications
• Marine Fuels Demand– Global shipping cannot function on the amount of
bunkers reported to / estimated by IEA / EIA– Future global bunkers / resid / total oil demand
being under-estimated• Impacts crude production / call on OPEC, refining
– Rigorous projections need further assessment• Bunker port throughputs / reporting data• Bunkers regional demand make-up• Mis-allocation / mis-reporting vs. missed demand

EnSys Energy EnSys Energy -- NavigisticsNavigistics -- RTIRTI
Implications• Refining
– Marine fuels outlook adds yet another layer of uncertainty to the future of refining
• Growing alternative fuels supplies» Ethanol, biodiesel, GTL, CTL, NGL – light clean
• Transport efficiencies cut into gasoline/diesel demand• Global shift to distillates alters refining economics• High oil prices shift economics from carbon rejection
(coking) to H addition (hydro-cracking) • Technology
– mostly evolutionary but some processes e.g. Sonocrackingcould revolutionize
• Capacity additions insufficient through 2008/9 but major post 2010
– 11+ mmbpd announced projects» (not all will be built)
EnSys Energy EnSys Energy -- NavigisticsNavigistics -- RTIRTI
Implications• Refining
– Marine fuels outlook adds yet another layer of uncertainty to the future of refining
• Continuing need to invest in environmental / regulatory compliance notably: fuels quality, emissions
• GHG / CO2 growing regulation / cap & trade
– Uncertainties likely to continue to curb refining investments in most regions
– But could 2004 to 2009 have been the “golden age” of refining?!


![Fossil fuels are harming our brains: identifying key ... · the health implications of climate change can strengthen efforts to increase personal involvement with the issue [13]](https://img.pdfslide.us/doc/110x75/5f4c514c0b2f551cbb72497e/fossil-fuels-are-harming-our-brains-identifying-key-the-health-implications.jpg)