Embed Size (px)
Citation preview

Efforts in Monitoring SDG with Disaggregation
in the Philippines
Bernadette B. Balamban
Chief Statistical Specialist
Philippine Statistics Authority
International Workshop on Data Disaggregation for the SDGs
Bangkok, Thailand
28 – 30 January 2019

Outline of Presentation
• Alignment of SDGs with national development
priorities
• SDG indicators monitored in the Philippines (with
status of disaggregation)
• Existing efforts on small area estimation (SAE)
• Policy uses of SAE (including lessons learned)
• Limitations of SAE derived from conventional data
sources
• Ongoing efforts to incorporate innovative data
sources (e.g., big data) to address the requirement
of disaggregation in the SDGs
Philippine Development Plan, 2017-2022
• Translates priorities into policy
and strategy framework, and
programs and projects
• Guides the national budget
appropriations
• Reflects the 17 SDGs and
Ambisyon Natin 2040
Alignment of SDGs with national development targets

The Philippine Development Plan and the 2030 Agenda
“MALASAKIT”ENHANCING THE SOCIAL FABRIC
“PAGBABAGO”INEQUALITY-REDUCING TRANSFORMATION
“PATULOY NA PAG-UNLAD”INCREASING GROWTH POTENTIAL
Expandeconomic
opportunities
Increase accessto economic
opportunities
TO LAY DOWN THE FOUNDATION FOR INCLUSIVE GROWTH, A HIGH-TRUST AND RESILIENT SOCIETY, AND A GLOBALLY-COMPETITIVE KNOWLEDGE ECONOMY
Advancetechnologyadoption
Stimulateinnovation
IMPLEMENT STRATEGIC TRADE AND FISCAL POLICY, MAINTAIN MACROECONOMIC STABILITY, AND PROMOTE COMPETITION
Ensure people-centered, clean, and efficient governance
Pursue swift and fair administration of justice
Promote Philippine culture and awareness
Reduce vulnerability of individuals
Reach for demographicdividend
Acceleratehuman capitaldevelopment
Ensure peace and security Accelerate strategic infrastructure development
Ensure safety and build resilience
Ensure ecological integrity, clean and healthy
environment
2022
2040FILIPINOS ENJOY STRONG BONDS WITH FAMILY AND FRIENDS, A COMFORTABLE LIFESTYLE AND SECURE FUTURE
Alignment of SDGs with national development targets
5
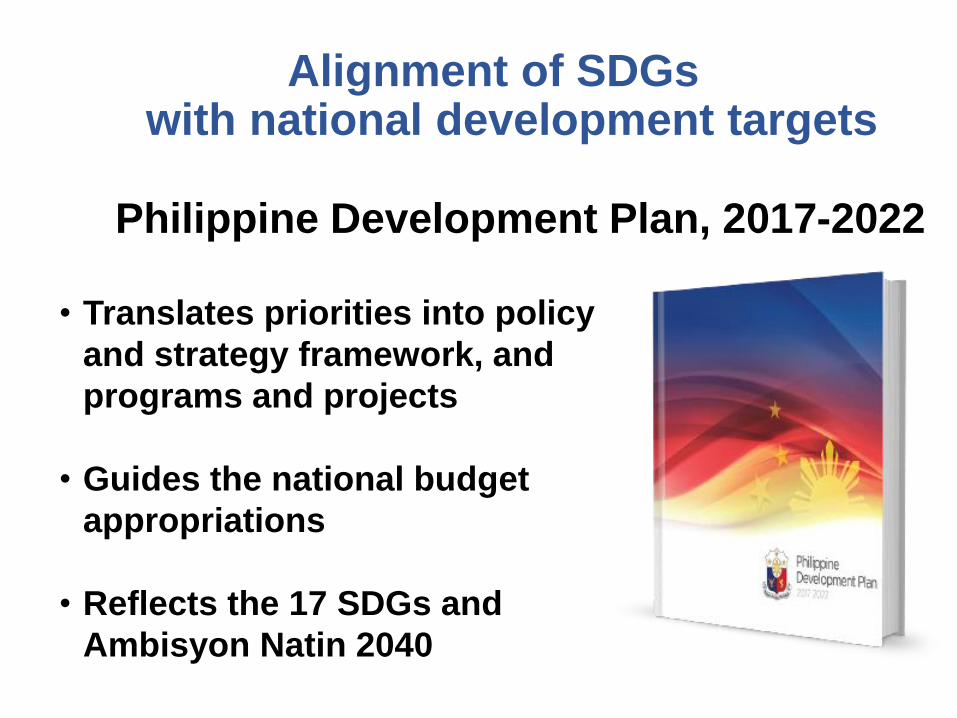
Multi-Sectoral Workshop
Identify relevant SDG indicators to be monitored in the Philippines
Initially identify relevant SDG indicators and provide inputs to the global indicator framework
Technical Workshop
Initial identification of data needed for the monitoring of the initial 17 SDGs.
Technical Workshop
Review and discuss the zero-draft of the outcome document for the UN
Summit
Technical Workshop
Conduct of National Consultation/Assessment
June2015
Sept 2014
9-12 Oct 2015
22 Oct 2015
Multi-Sectoral Workshop• Conduct data assessment of the Global SDG Indicators by
accomplishing the SDG matrix based on the Philippine context• Provide initial proxy and supplemental indicators
11-12 May 2016
Review and discuss the initial global post-2015 development agenda goals and target
Technical WorkshopSept 2013
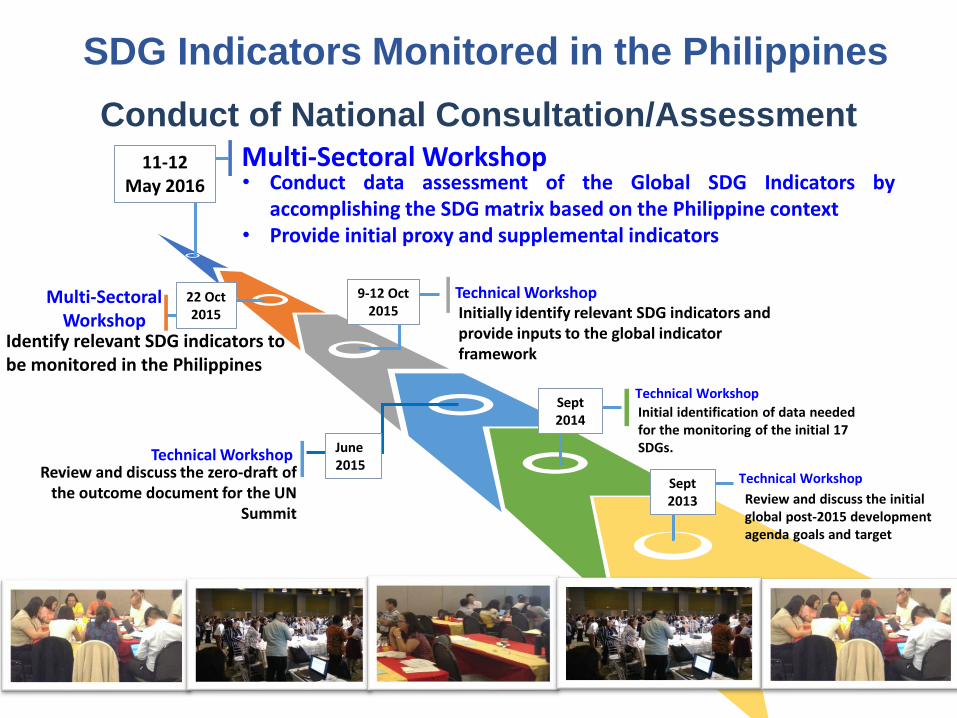
SDG Indicators Monitored in the Philippines
Initial List of Philippine SDG Indicators
GOALS
17TARGETS
97INDICATORS
155
“Approving and Adopting the Initial List of Sustainable Development Goals for Monitoring
in the Philippines” - PSA Board Resolution no. 09, Series of 2017
SDG Indicators Monitored in the Philippines
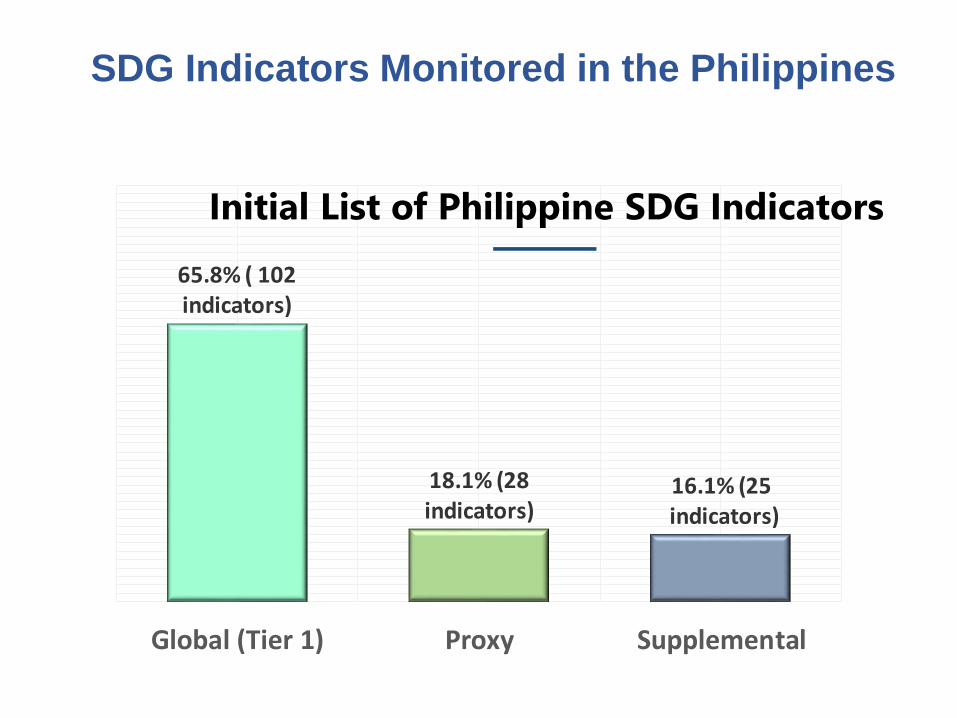
65.8% ( 102 indicators)
18.1% (28 indicators)
16.1% (25indicators)
Global (Tier 1) Proxy Supplemental
SDG Indicators Monitored in the Philippines
Initial List of Philippine SDG Indicators
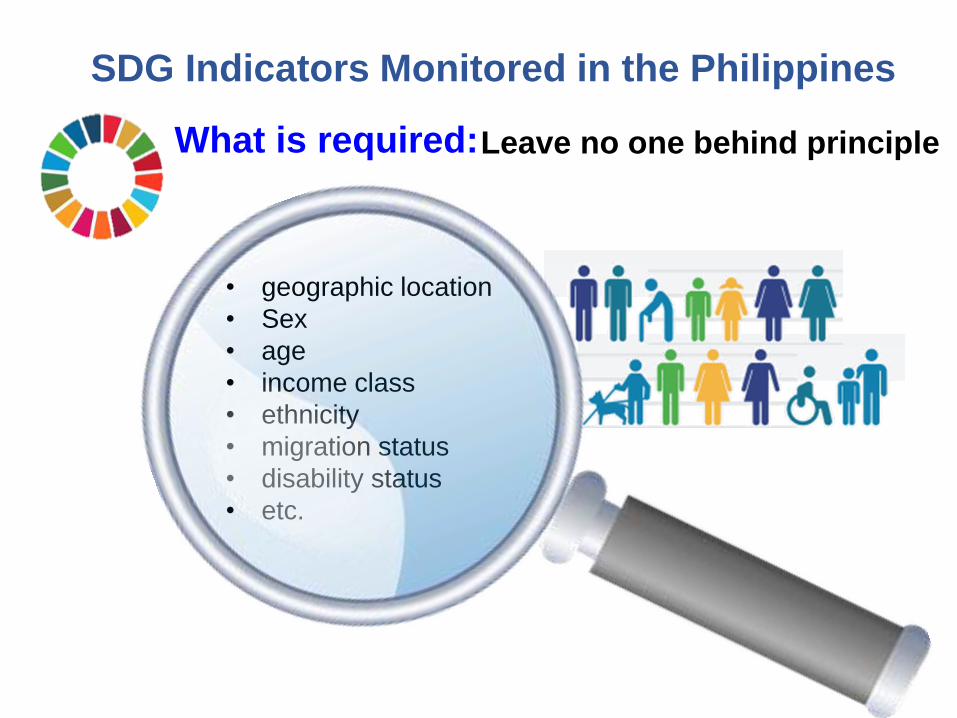
Leave no one behind principle
• geographic location
• Sex
• age
• income class
• ethnicity
• migration status
• disability status
• etc.
What is required:
SDG Indicators Monitored in the Philippines
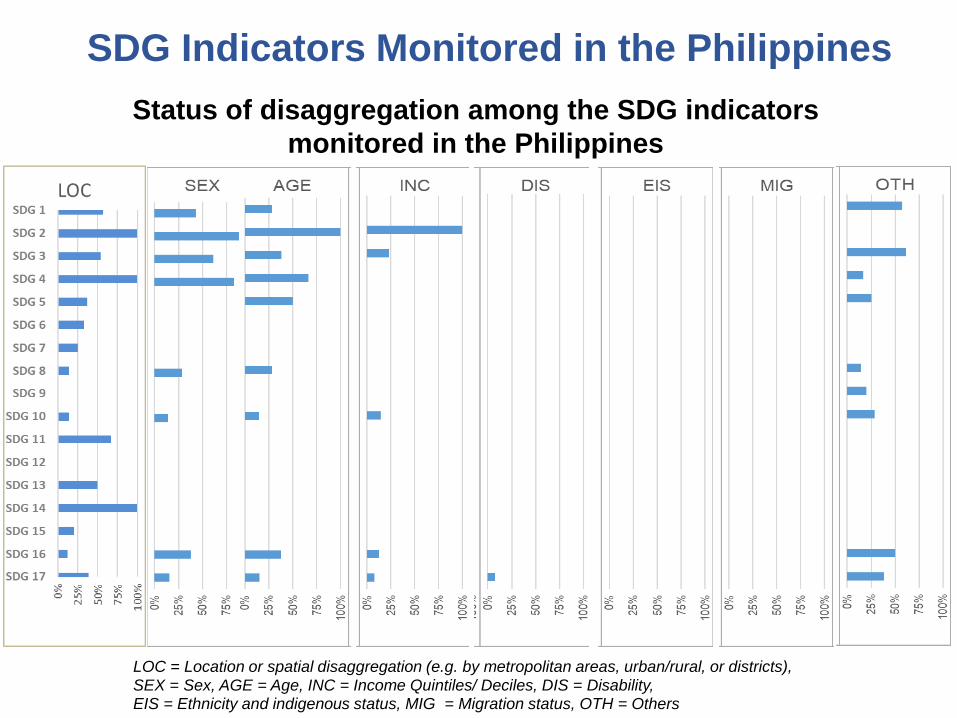
Status of disaggregation among the SDG indicators
monitored in the Philippines
LOC = Location or spatial disaggregation (e.g. by metropolitan areas, urban/rural, or districts), SEX = Sex, AGE = Age, INC = Income Quintiles/ Deciles, DIS = Disability, EIS = Ethnicity and indigenous status, MIG = Migration status, OTH = Others
SDG Indicators Monitored in the Philippines

SDG Indicators Monitored in the Philippines
• Efforts in support of disaggregation
a. PSA Resolution No. 1, Series of 2017-031,
Enjoining Different Agencies to Promote Gender
Concerns in the Generation of Statistics
b. Adoption of the 2013 Master Sample* in PSA
household surveys with province as domains
c. Civil Registration and Vital Statistics Decade
(2015-2024)
d. Exploring unconventional sources
e. Small area estimation

Existing Efforts on Small Area Estimation

Project OutputYear
ReleasedFunding Source
Methodology/Data Sets Used
Poverty Mapping in the Philippines
2000 city/ municipalpoverty estimates
2005 World Bank Elbers, Lanjouw & Lanjouw (ELL);National Model
2000 CPH, 2000 FIES/ Labor Force Survey (LFS)*
IntercensalUpdating of Small Area Estimates (SAE)
2003 city/ municipal level poverty estimates
2008 World Bank Modified ELL;Regional Model
2000 CPH, 2003 FIES/LFSBarangay Listing
Updating of SAE on Poverty
2006 city/ municipal level poverty estimates
2013 World Bank, AusAid, Gov’t. of
the Philippines (GOP)
Modified ELL;Regional Model
2000 CPH, 2006 FIES/LFSBarangay Listing
Updating of SAE on Poverty
2009 city/ municipal level poverty estimates
2012 World Bank, AusAid, GOP
Modified ELL;Regional Model
2007 CP, 2009 FIES/LFSBarangay Listing
Updating of SAE on Poverty
2012 city/ municipal level poverty
2014 GOP Modified ELL;Regional Model
2010 CPH, 2012 FIES/LFSBarangay Listing
SAE on Poverty in the Philippines
2015 city/ municipal level poverty estimates
2018 GOP ELL;Regional Model
2015 CPH, Merged 2015 FIES & January 2016 LFS, 2015 CPH
Form 5 (Barangay Data)
Existing Efforts on Small Area Estimation
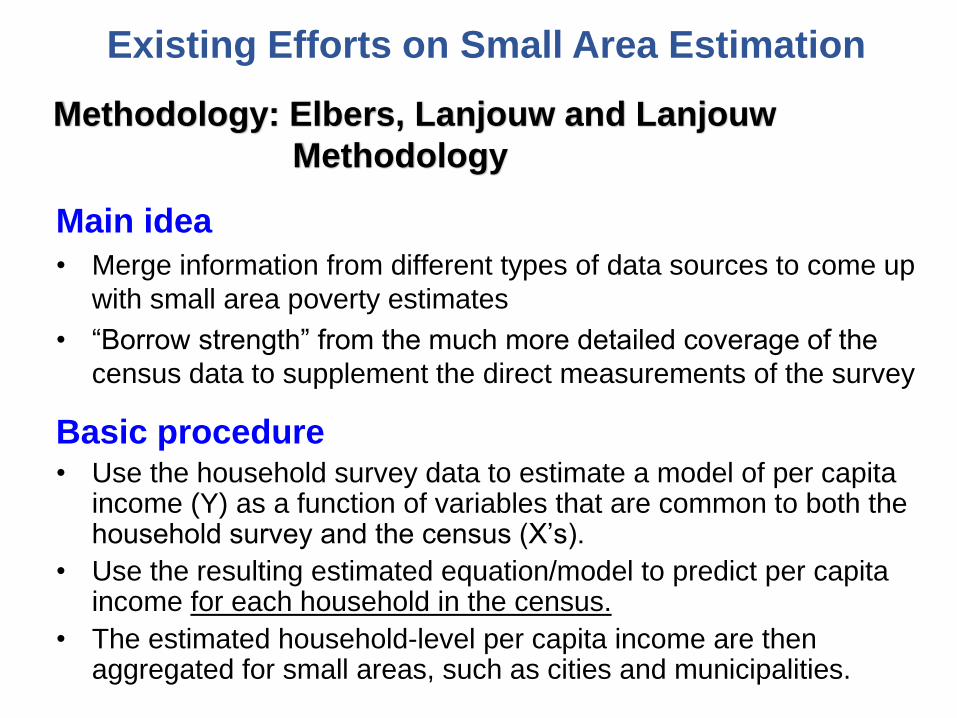
Main idea
• Merge information from different types of data sources to come up
with small area poverty estimates
• “Borrow strength” from the much more detailed coverage of the
census data to supplement the direct measurements of the survey
Basic procedure• Use the household survey data to estimate a model of per capita
income (Y) as a function of variables that are common to both the household survey and the census (X’s).
• Use the resulting estimated equation/model to predict per capita income for each household in the census.
• The estimated household-level per capita income are then aggregated for small areas, such as cities and municipalities.
Methodology: Elbers, Lanjouw and Lanjouw
Methodology
Existing Efforts on Small Area Estimation
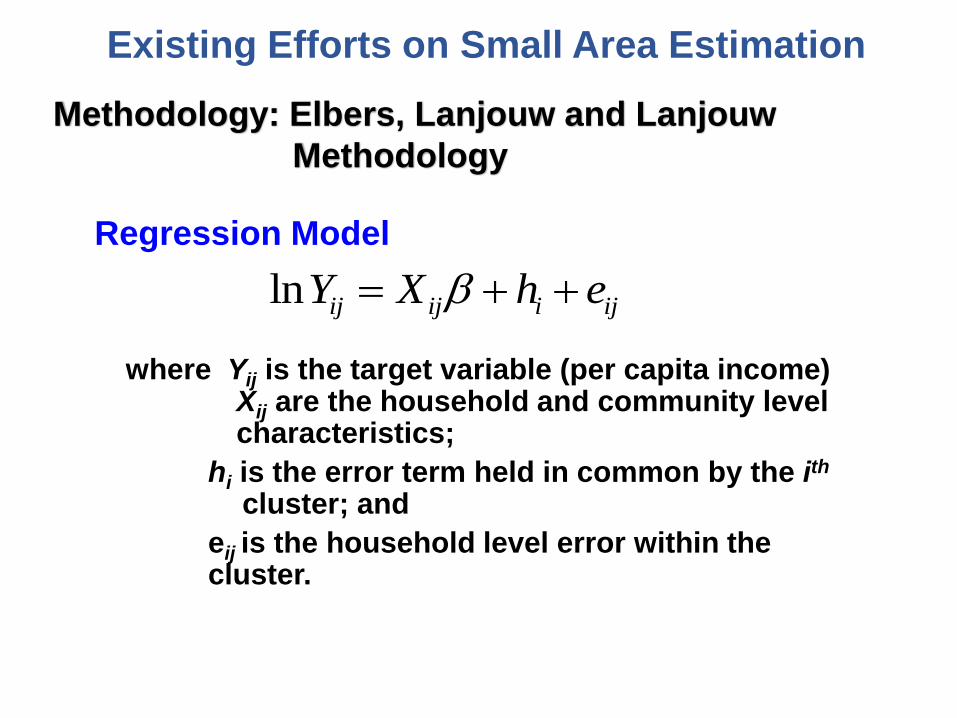
Regression Model
ln = + +ij ij i ijY X h e
where Yij is the target variable (per capita income) Xij are the household and community level characteristics;
hi is the error term held in common by the ith
cluster; and
eij is the household level error within the cluster.
Existing Efforts on Small Area Estimation
Methodology: Elbers, Lanjouw and Lanjouw
Methodology
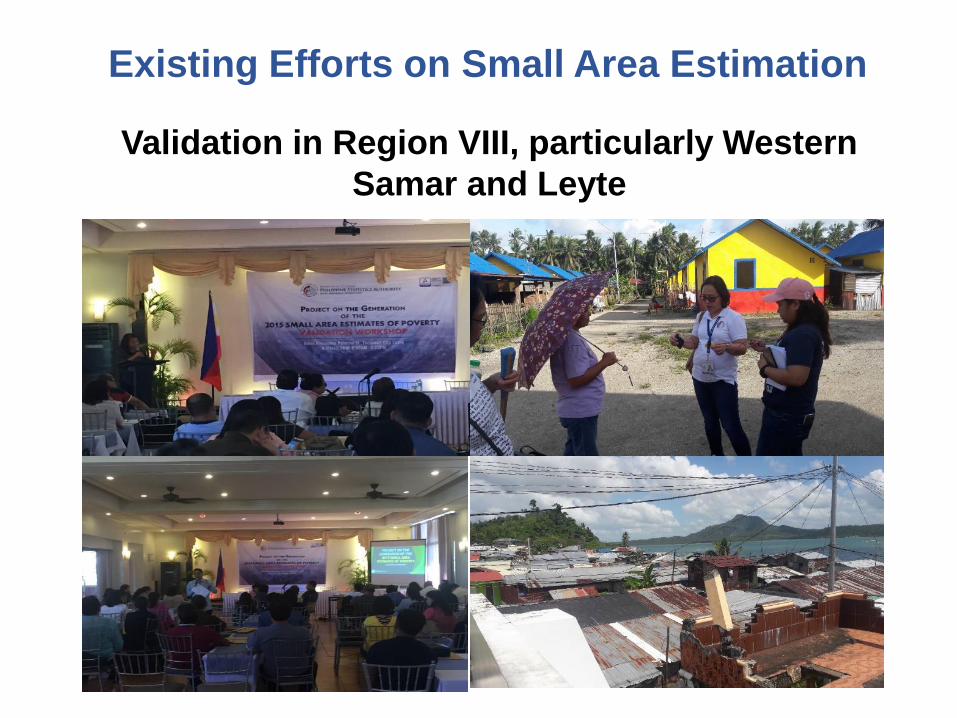
Validation in Region VIII, particularly Western
Samar and Leyte
Existing Efforts on Small Area Estimation

A. In policy formulation, planning and monitoring
National/Local
Government Unit
Actual Policy Uses
Provincial Government
of La Union
• used the 2006, 2009 and 2012 estimates in
the assessment of the progress of
municipalities in the implementation of
poverty reduction programs
• used the estimates to identify the
causative factors behind the poverty
situation in the province as basis for the
formulation of a more focused 5-Year
Anti-Poverty Plan
National Economic and
Development Authority
(NEDA) Regional Office
I
• used the 2006, 2009 and 2012 estimates
as inputs of the Regional Development
Council in the annual selection of the
Best LGU Poverty Program Implementer
at the municipal level
Policy Uses of SAE on Poverty

A. In policy formulation, planning and monitoring
National/Local
Government Unit
Actual Policy Uses
NEDA/Regional
Development Council
in CAR
• used SAE in preparing the profile and
situationer of the BLISTT areas (Baguio,
La Trinidad, Itogon, Sablan, Tuba and
Tublay) during the BLISTT master
planning activity
• In the presentation and analysis of the
region's poverty and macro-economy
situationer, the SAE is used in identifying
areas needing poverty reduction
programs.
Policy Uses of SAE on Poverty
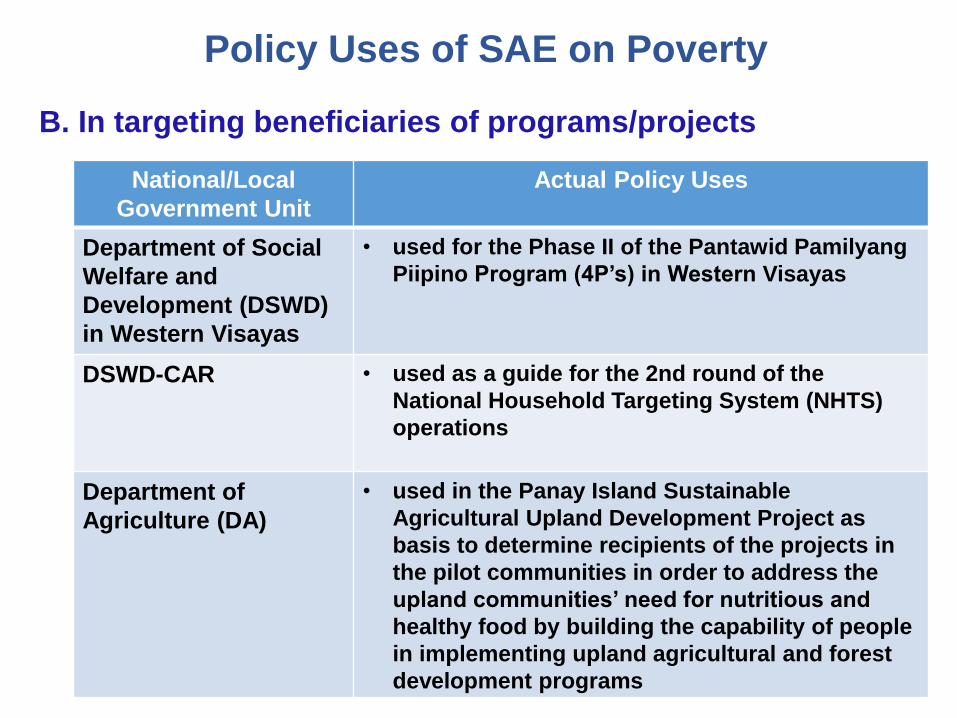
B. In targeting beneficiaries of programs/projects
National/Local
Government Unit
Actual Policy Uses
Department of Social
Welfare and
Development (DSWD)
in Western Visayas
• used for the Phase II of the Pantawid Pamilyang
Piipino Program (4P’s) in Western Visayas
DSWD-CAR • used as a guide for the 2nd round of the
National Household Targeting System (NHTS)
operations
Department of
Agriculture (DA)
• used in the Panay Island Sustainable
Agricultural Upland Development Project as
basis to determine recipients of the projects in
the pilot communities in order to address the
upland communities’ need for nutritious and
healthy food by building the capability of people
in implementing upland agricultural and forest
development programs
Policy Uses of SAE on Poverty

B. In targeting beneficiaries of programs/projects
National/Local
Government Unit
Actual Policy Uses
DA • used the SAE on Poverty for determining
top priority LGUs in Region VI as recipients
of the Philippine Rural Development Project
(PRDP) funded by World Bank in
partnership with the LGUs and the private
sector
Policy Uses of SAE on Poverty
• Capacity building of staff from the statistical office is essential to ensure sustainability of the initiative.
• Validation workshops are useful to provide better appreciation of the model developed and statistics produced.
• It is useful to know your target users so that statistics are disseminated/packaged in a manner that users will have good appreciation of the story
Lessons Learned

• For years when census and household survey are not conducted at the same time, variables that can be used for the development of models are limited to time invariant variables.
• Availability of results can take some time (taking into consideration the encoding and processing of the census and household survey plus the data preparation and model building for the SAE).
Limitations of SAE Using Conventional Sources

Ongoing Efforts to Incorporate Innovative Data Sources
• Current initiative between Asian Development Bank
and PSA is to explore possibility of improving the
availability of the following SDG indicators by
considering innovative data sources:
a. Proportion of population living below the poverty
line
b. Proportion of the rural population who live within
2 km of an all-season road
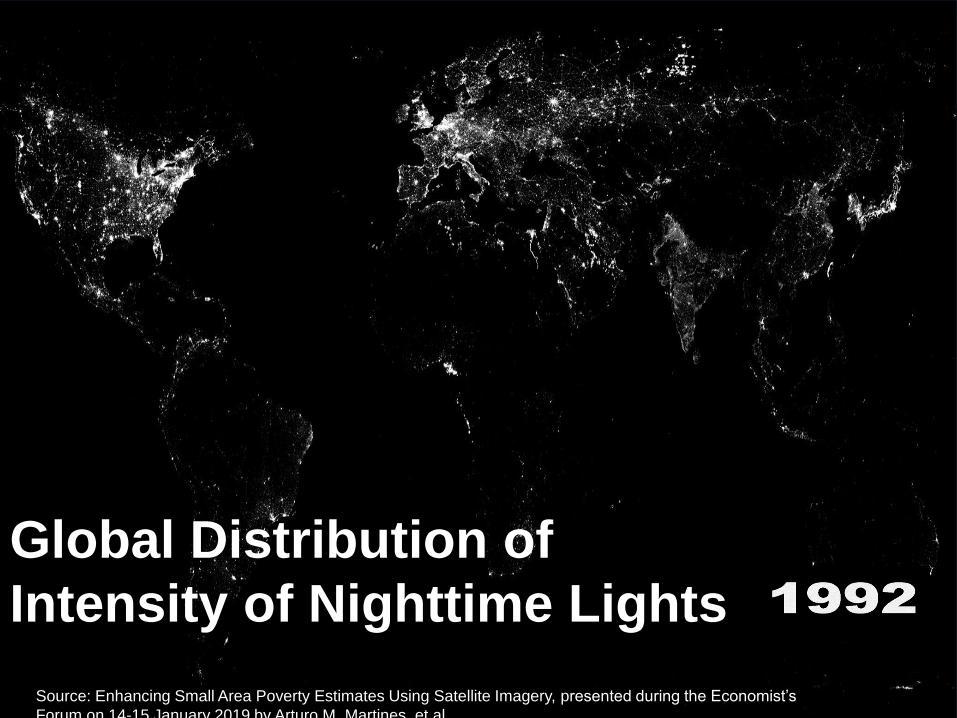
Global Distribution of
Intensity of Nighttime Lights
Source: Enhancing Small Area Poverty Estimates Using Satellite Imagery, presented during the Economist’s
Forum on 14-15 January 2019 by Arturo M. Martines, et.al.
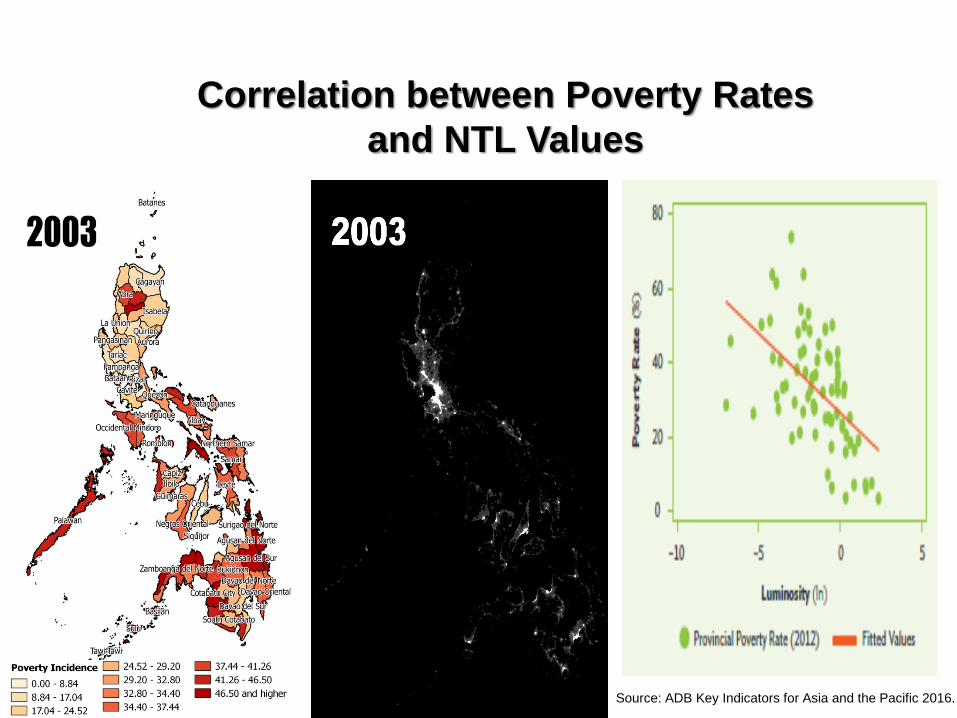
Correlation between Poverty Rates
and NTL Values
Source: ADB Key Indicators for Asia and the Pacific 2016.
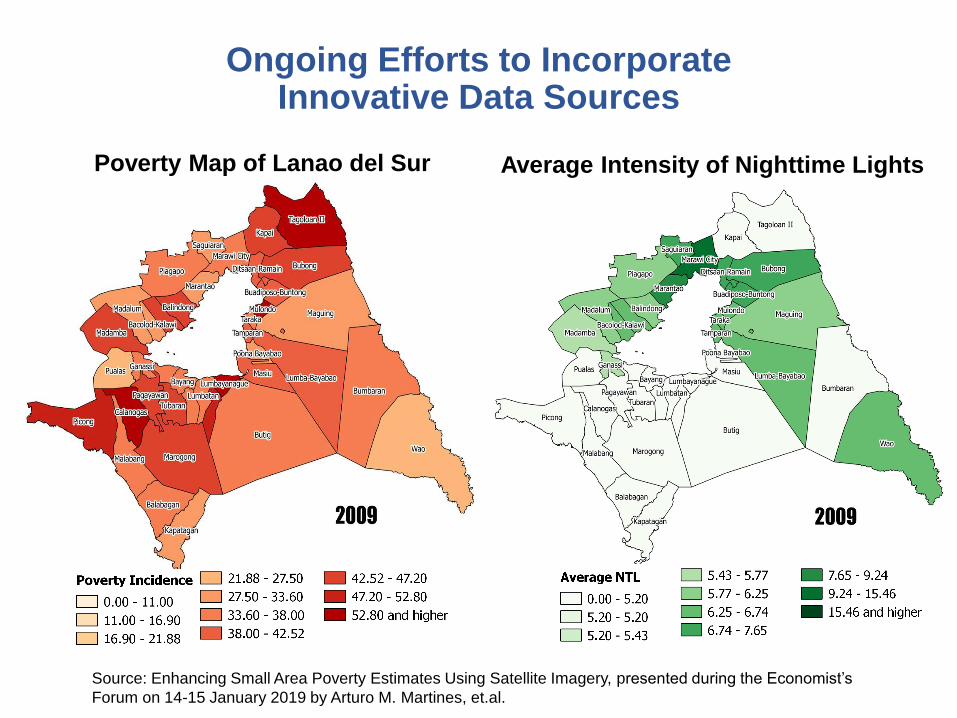
Poverty Map of Lanao del Sur Average Intensity of Nighttime Lights
Ongoing Efforts to Incorporate Innovative Data Sources
Source: Enhancing Small Area Poverty Estimates Using Satellite Imagery, presented during the Economist’s
Forum on 14-15 January 2019 by Arturo M. Martines, et.al.
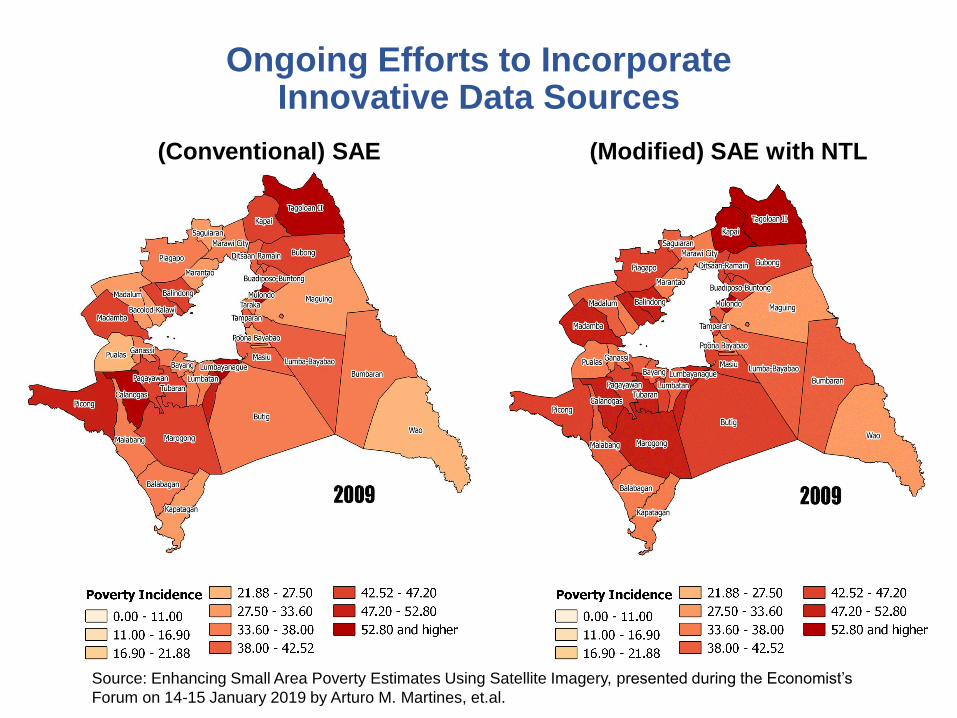
(Conventional) SAE (Modified) SAE with NTL
Ongoing Efforts to Incorporate Innovative Data Sources
Source: Enhancing Small Area Poverty Estimates Using Satellite Imagery, presented during the Economist’s
Forum on 14-15 January 2019 by Arturo M. Martines, et.al.

Thank you