Embed Size (px)
Citation preview
TS 58 – Deformation Measurements of Bridges Thomas Schäfer, Erwin Penka, Thomas Wunderlich, Konrad Zilch Efficient Local Deformation Recognition on Highway Bridges Shaping the Change XXIII FIG Congress Munich, Germany, October 8-13, 2006
1/11
Efficient Local Deformation Recognition on Highway Bridges
Thomas SCHÄFER, Erwin PENKA, Thomas WUNDERLICH and Konrad ZILCH, Germany
Key words: Bridge Monitoring, Reflectorless EDM, Tacheometric Scanning, Finite Elements Simulation SUMMARY This paper provides an economical geodetic method for damage recognition on a pre-stressed concrete bridge built in the sixties. Numerical models based on Finite Elements (FE) analyses have shown that for the affected object a complete surveying of the bottom surface is necessary. Based on reflectorless electronic distance measurement (R-EDM) and a combination of a self-developed software application and motorized tacheometry a highway bridge with a length of 600 m is therefore scanned with 2800 points with a precision of 1-2 mm twice a year. Numerical simulations are used to minimize temperature and other environmental effects on the deformations of the bridge. Tests concerning accuracy and error estimations of R-EDM are discussed. Afterwards the technical realisation of the fully automated measuring process is explained in detail. Apart from the prismless measurements more than 60 prisms placed on the structure are surveyed as well in order to determine the horizontal movement of the bridge which are considered in the post-processing.
TS 58 – Deformation Measurements of Bridges Thomas Schäfer, Erwin Penka, Thomas Wunderlich, Konrad Zilch Efficient Local Deformation Recognition on Highway Bridges Shaping the Change XXIII FIG Congress Munich, Germany, October 8-13, 2006
2/11
Efficient Local Deformation Recognition on Highway Bridges
Thomas SCHÄFER, Erwin PENKA, Thomas WUNDERLICH and Konrad ZILCH, Germany
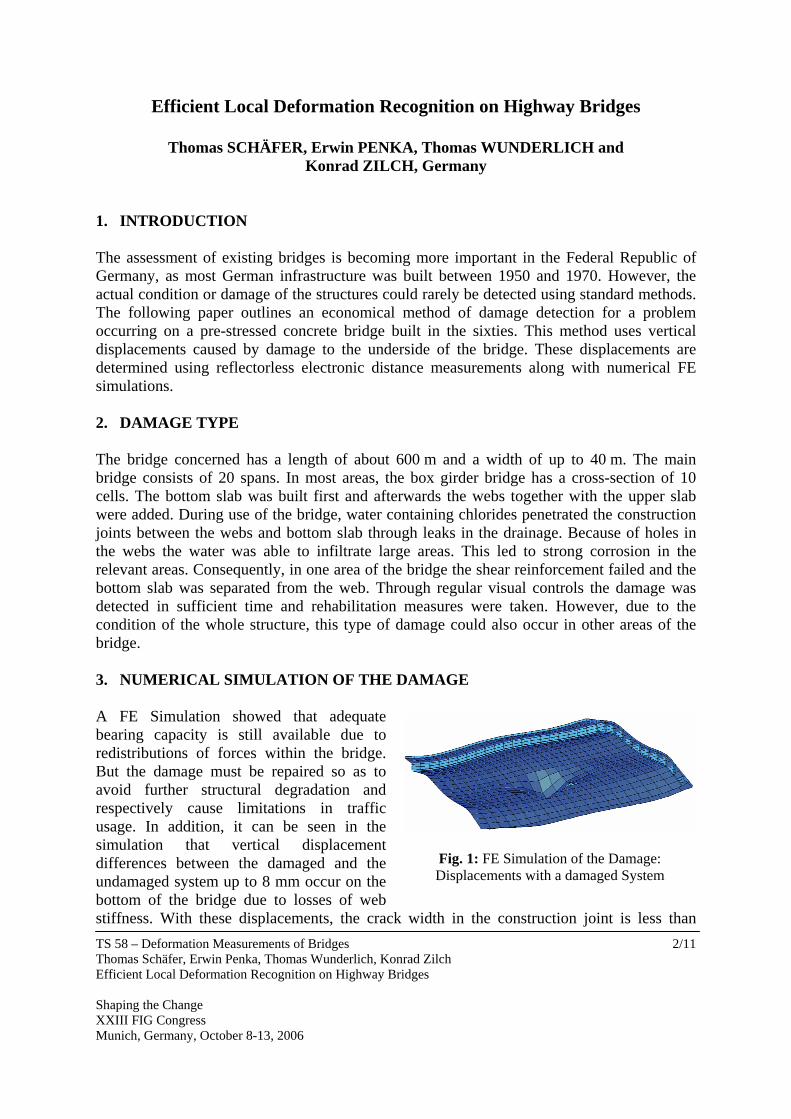
1. INTRODUCTION The assessment of existing bridges is becoming more important in the Federal Republic of Germany, as most German infrastructure was built between 1950 and 1970. However, the actual condition or damage of the structures could rarely be detected using standard methods. The following paper outlines an economical method of damage detection for a problem occurring on a pre-stressed concrete bridge built in the sixties. This method uses vertical displacements caused by damage to the underside of the bridge. These displacements are determined using reflectorless electronic distance measurements along with numerical FE simulations. 2. DAMAGE TYPE The bridge concerned has a length of about 600 m and a width of up to 40 m. The main bridge consists of 20 spans. In most areas, the box girder bridge has a cross-section of 10 cells. The bottom slab was built first and afterwards the webs together with the upper slab were added. During use of the bridge, water containing chlorides penetrated the construction joints between the webs and bottom slab through leaks in the drainage. Because of holes in the webs the water was able to infiltrate large areas. This led to strong corrosion in the relevant areas. Consequently, in one area of the bridge the shear reinforcement failed and the bottom slab was separated from the web. Through regular visual controls the damage was detected in sufficient time and rehabilitation measures were taken. However, due to the condition of the whole structure, this type of damage could also occur in other areas of the bridge. 3. NUMERICAL SIMULATION OF THE DAMAGE A FE Simulation showed that adequate bearing capacity is still available due to redistributions of forces within the bridge. But the damage must be repaired so as to avoid further structural degradation and respectively cause limitations in traffic usage. In addition, it can be seen in the simulation that vertical displacement differences between the damaged and the undamaged system up to 8 mm occur on the bottom of the bridge due to losses of web stiffness. With these displacements, the crack width in the construction joint is less than
Fig. 1: FE Simulation of the Damage: Displacements with a damaged System

TS 58 – Deformation Measurements of Bridges Thomas Schäfer, Erwin Penka, Thomas Wunderlich, Konrad Zilch Efficient Local Deformation Recognition on Highway Bridges Shaping the Change XXIII FIG Congress Munich, Germany, October 8-13, 2006
3/11
1 mm. This crack width could not be easily observed. The following figure shows the calculated displacements for a failure of the shear reinforcement on two webs over a length of 10 m. These FE simulated displacements should be used for the assessment of the current bridge to enable continuous usage during the planning and construction of a new bridge. 4. GEODETIC SURVEYING CONCEPT 4.1 Overview Together with the Zilch + Müller Ingenieure Ltd. a concept for the measurement of the vertical displacements has been developed at the Chair of Geodesy of the Technische Universität München (TUM). It enables the determination of vertical displacements with a standard deviation less than 1 mm (Wunderlich, 2004). The method is based on reflectorless electronic distance measurements (R-EDM) and motorized tacheometry using self-developed measuring applications and analysis strategies. For this task two total stations Leica TCRA1101+ were used. According to their specifications these instruments provide distances in R-EDM mode with an accuracy of 3 mm + 2 ppm. But investigations have shown that this assumption is too pessimistic (see section 4.2). Figure 2 shows the arrangement for this monitoring problem. The system scans the bottom side of the bridge with a grid of about 2 m × 2 m containing 2800 reflectorless measured object points. In addition, at least four prisms per bridge span (altogether 72 prisms) were installed directly underneath the ceiling in order to detect horizontal deformations caused by temperature effects. After generating a digital model of the surface with this scan, the vertical displacements can be calculated using geometrical relationships.
Fig. 2: Arrangement of the surveying concept 4.2 Instrumental Calibration of the R-EDM Unit As high-precision surveying of control networks seems to be – adequate efforts and sophisticated instruments presumed – a standard task in engineering surveying, reflectorless
TS 58 – Deformation Measurements of Bridges Thomas Schäfer, Erwin Penka, Thomas Wunderlich, Konrad Zilch Efficient Local Deformation Recognition on Highway Bridges Shaping the Change XXIII FIG Congress Munich, Germany, October 8-13, 2006
4/11
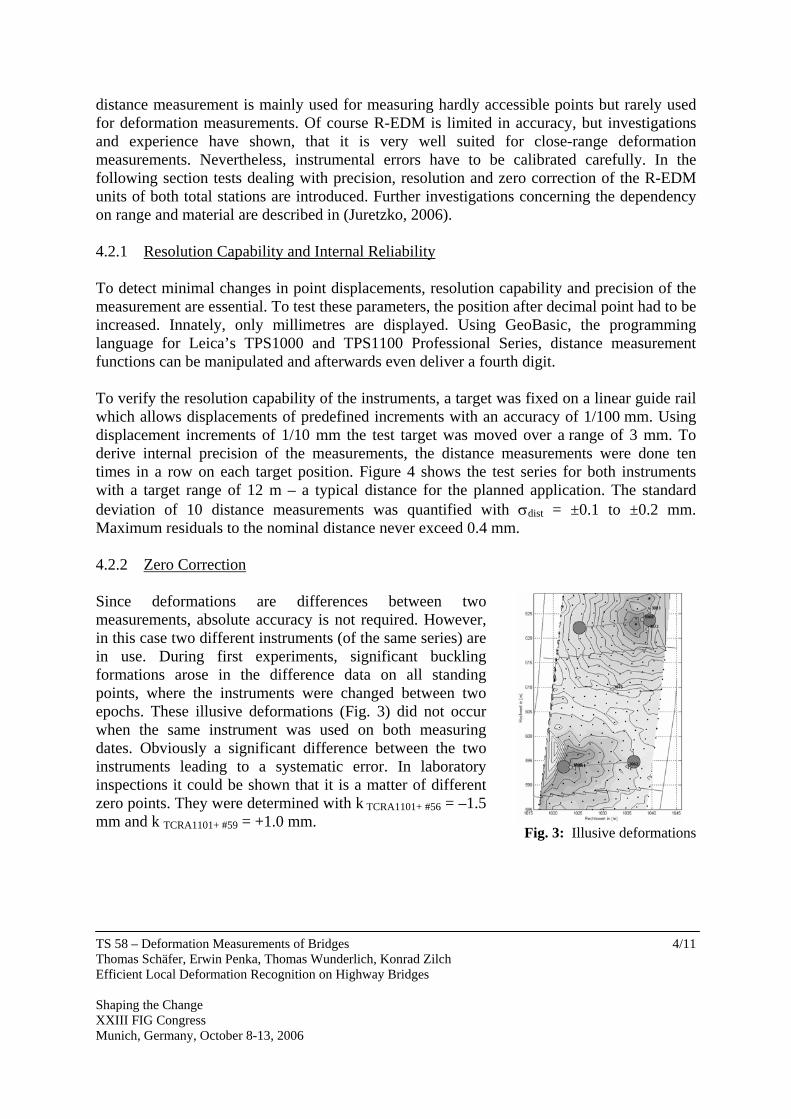
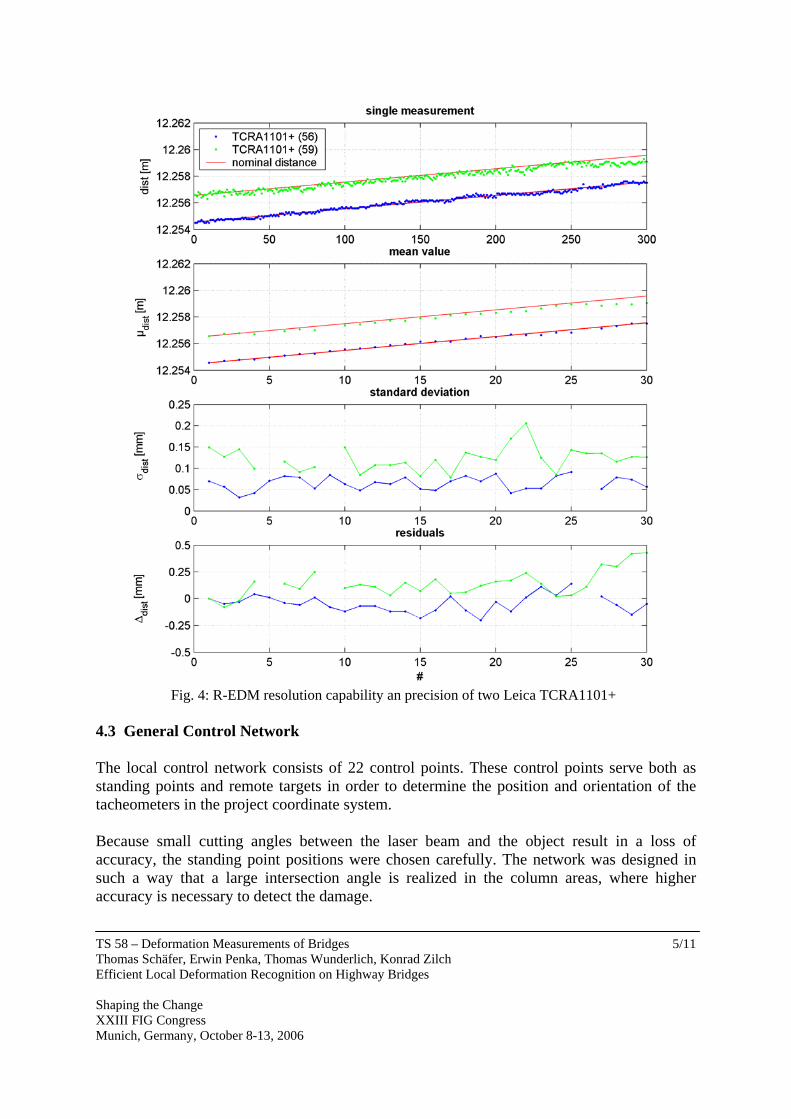
distance measurement is mainly used for measuring hardly accessible points but rarely used for deformation measurements. Of course R-EDM is limited in accuracy, but investigations and experience have shown, that it is very well suited for close-range deformation measurements. Nevertheless, instrumental errors have to be calibrated carefully. In the following section tests dealing with precision, resolution and zero correction of the R-EDM units of both total stations are introduced. Further investigations concerning the dependency on range and material are described in (Juretzko, 2006). 4.2.1 Resolution Capability and Internal Reliability To detect minimal changes in point displacements, resolution capability and precision of the measurement are essential. To test these parameters, the position after decimal point had to be increased. Innately, only millimetres are displayed. Using GeoBasic, the programming language for Leica’s TPS1000 and TPS1100 Professional Series, distance measurement functions can be manipulated and afterwards even deliver a fourth digit. To verify the resolution capability of the instruments, a target was fixed on a linear guide rail which allows displacements of predefined increments with an accuracy of 1/100 mm. Using displacement increments of 1/10 mm the test target was moved over a range of 3 mm. To derive internal precision of the measurements, the distance measurements were done ten times in a row on each target position. Figure 4 shows the test series for both instruments with a target range of 12 m – a typical distance for the planned application. The standard deviation of 10 distance measurements was quantified with σdist = ±0.1 to ±0.2 mm. Maximum residuals to the nominal distance never exceed 0.4 mm. 4.2.2 Zero Correction Since deformations are differences between two measurements, absolute accuracy is not required. However, in this case two different instruments (of the same series) are in use. During first experiments, significant buckling formations arose in the difference data on all standing points, where the instruments were changed between two epochs. These illusive deformations (Fig. 3) did not occur when the same instrument was used on both measuring dates. Obviously a significant difference between the two instruments leading to a systematic error. In laboratory inspections it could be shown that it is a matter of different zero points. They were determined with k TCRA1101+ #56 = –1.5 mm and k TCRA1101+ #59 = +1.0 mm.
Fig. 3: Illusive deformations
TS 58 – Deformation Measurements of Bridges Thomas Schäfer, Erwin Penka, Thomas Wunderlich, Konrad Zilch Efficient Local Deformation Recognition on Highway Bridges Shaping the Change XXIII FIG Congress Munich, Germany, October 8-13, 2006
5/11
Fig. 4: R-EDM resolution capability an precision of two Leica TCRA1101+
4.3 General Control Network The local control network consists of 22 control points. These control points serve both as standing points and remote targets in order to determine the position and orientation of the tacheometers in the project coordinate system. Because small cutting angles between the laser beam and the object result in a loss of accuracy, the standing point positions were chosen carefully. The network was designed in such a way that a large intersection angle is realized in the column areas, where higher accuracy is necessary to detect the damage.

TS 58 – Deformation Measurements of Bridges Thomas Schäfer, Erwin Penka, Thomas Wunderlich, Konrad Zilch Efficient Local Deformation Recognition on Highway Bridges Shaping the Change XXIII FIG Congress Munich, Germany, October 8-13, 2006
6/11
Since the bridge columns can be considered as stable, no special concrete pillars had to be installed. Instead, self-developed aluminium mounting panels (Fig. 5) were fixed directly on the columns. The risk of vandalism is reduced by using removable panels. Register pins guarantee a repeatable mounting at exactly the same position each epoch measurements are done. Special gadgets for setting up the instrument allow a repositioning within a few 1/10 mm. Since the instrument afterwards has to be levelled a simple plastic ring blocks on of the three tribrach screws. So levelling has to be done using two screws leading to only one possible set up at one specific instrumental height. The usage of these panels and forced centering devices also has the effect of avoiding extensive set-up preparations. After adjustment computations including precision levelling loops the net quality was estimated with standard deviations in position σx,y = ±0.6 mm and height σz = ±0.5 mm. Prisms mounted on the ceiling have an accuracy of σx,y = ± 1.3 mm and σz = ±0.8 mm.
Fig. 5: Control network’s core item: Mobile mounting panels with forced centering device
4.4 Measurement Procedure The fully automated measurement process is based on a self-developed GeoBASIC application running on the total stations. Generally, this software can easily be adapted to related monitoring tasks. To start a measurement cycle on one of the 22 standing points only Point ID’s have to be entered into the instruments panel. Now the user is called on pointing roughly on a specific remote target. The software then reads the control point data and begins to fine points the remote target using ATR (automatic target recognition). This measurement is required for sensor orientation. Afterwards, the results of the transformation into the project coordinate system is displayed and can be – if necessary – repeated using more tie points.

TS 58 – Deformation Measurements of Bridges Thomas Schäfer, Erwin Penka, Thomas Wunderlich, Konrad Zilch Efficient Local Deformation Recognition on Highway Bridges Shaping the Change XXIII FIG Congress Munich, Germany, October 8-13, 2006
7/11
Fig. 6: Impressions from under the bridge
Finally, the real observation of the prisms underneath the ceiling (Fig. 6.) and the R-EDM measurements to the object points starts. The telescope therefore automatically moves to a predefined horizontal and vertical angle and measures one target after the other. To raise accuracy and reliability three independent measurement cycles with five single measurements per point are performed. Doing so, a standing point (with an average of 130 points to measure) can be executed within 60 minutes. All in all the whole campaign takes 33 hours of field work. 5. RESULTS Meanwhile four epochs are processed. The reference measurement was performed in October 2004. This measurement serves as basis for the deformation recognition. The second epoch was performed in April 2005. The following results refer to these epochs. More results of the first measurement epoch are shown in (Hennecke, 2005) and (Penka, 2005). 5.1 Displacement of the Reflectors The displacement measurements of at least four reflectors per span are used to detect the horizontal movements of the bridge spans, because they can not be detected with reflectorless measurements. The displacements of the reflectors which occurred between the first and the second epoch are shown in Figure 7. 5.1.1 Horizontal Displacements It can be seen in the figure, that the horizontal displacements of the bridge spans are small because of the chosen measurement epochs. The horizontal displacements in the southern half of the bridge are less than 10 mm. In the northern half of the bridge the horizontal displacements are up to 25 mm.

TS 58 – Deformation Measurements of Bridges Thomas Schäfer, Erwin Penka, Thomas Wunderlich, Konrad Zilch Efficient Local Deformation Recognition on Highway Bridges Shaping the Change XXIII FIG Congress Munich, Germany, October 8-13, 2006
8/11
Example: Between the measurements of the first and second epoch an average temperature difference of ΔT = 3.1°C existed. With the assumption that the bridge moves in the direction of its own axis, a prism on the southern bridge end with a distance of 314.64 m to the fixed reference point (in the middle) of the bridge is supposed to move
mm8.964.31410101.3 6 =⋅⋅⋅=⋅⋅Δ=Δ −lTl Tα The measured displacement along the axis of the bridge is Δl = 8.6 mm. For these calculations the middle value of the temperature strain coefficient was used. This middle value can vary depending on an allowance of 6 to 15 · 10-6. Additionally, it is observed that a free deformation of the bearings is not completely given. Thus the calculated displacements due to temperature agree well with the measured temperatures and displacements. 5.1.2 Vertical Displacements The vertical displacement of the ceiling prisms lie with one exception under 2 mm (Fig. 7). Because of the order of magnitude of the measured displacements of the reflectors, it has to be assumed that only minor corrections are necessary due to the displacement of the total bridge structure and respectively of the individual bridge fields for the analysis of vertical displacement development of the reflectorless measuring points. 5.2 Vertical Displacement of the Object Points Figure 8 shows the result of one span how it is used for visual inspection. Each contour line indicates a change in altitude of 0.5 mm. The smoothness of the surface gives an impression on the internal accuracy of this method. Standard deviation of all 15 measurements per scan point is below 1 mm. In this field vertical displacements are up to 1 mm – however, in some spans a constant offset (2-3 mm) seems to be included (Fig. 9) but the deformation type which is expected from the damage type can not be seen in any span.

TS 58 – Deformation Measurements of Bridges Thomas Schäfer, Erwin Penka, Thomas Wunderlich, Konrad Zilch Efficient Local Deformation Recognition on Highway Bridges Shaping the Change XXIII FIG Congress Munich, Germany, October 8-13, 2006
9/11
Fig. 7: Displacement of the Reflectors
Fig. 8: Vertical Displacements in span 10 (epoch 2 – epoch 1).
Contour lines indicate a change in altitude of 0.5 mm.
TS 58 – Deformation Measurements of Bridges Thomas Schäfer, Erwin Penka, Thomas Wunderlich, Konrad Zilch Efficient Local Deformation Recognition on Highway Bridges Shaping the Change XXIII FIG Congress Munich, Germany, October 8-13, 2006
10/11
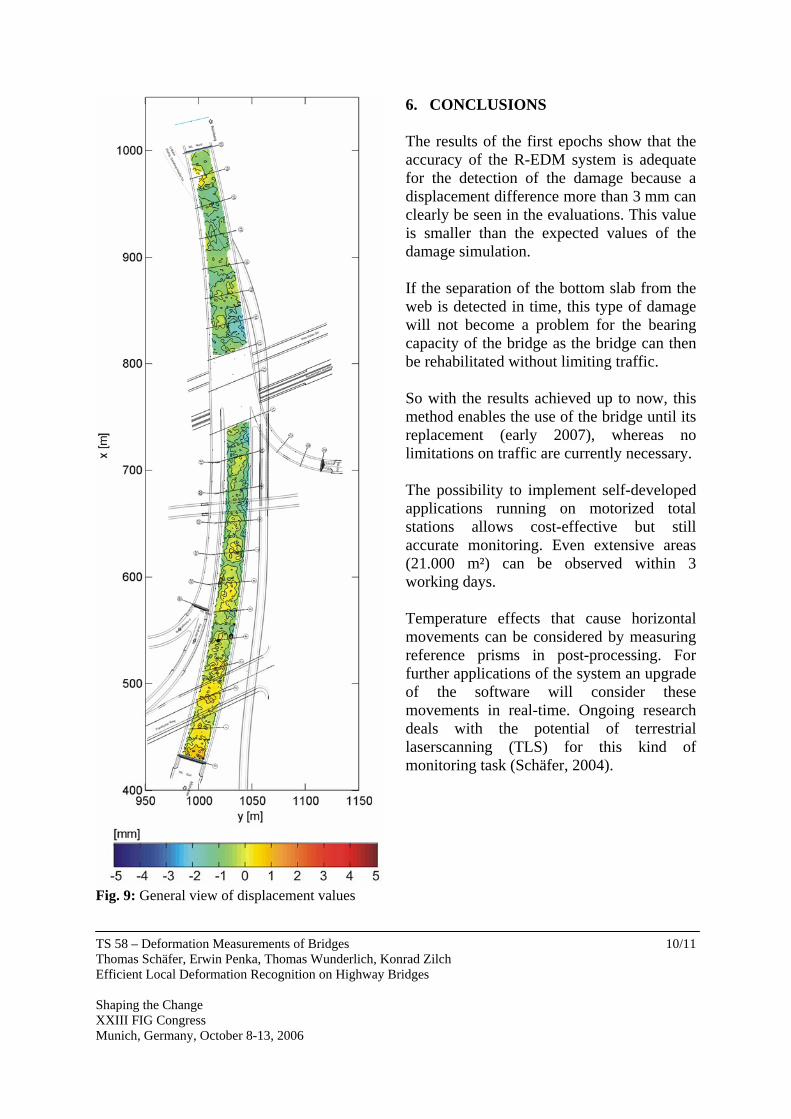
6. CONCLUSIONS The results of the first epochs show that the accuracy of the R-EDM system is adequate for the detection of the damage because a displacement difference more than 3 mm can clearly be seen in the evaluations. This value is smaller than the expected values of the damage simulation. If the separation of the bottom slab from the web is detected in time, this type of damage will not become a problem for the bearing capacity of the bridge as the bridge can then be rehabilitated without limiting traffic. So with the results achieved up to now, this method enables the use of the bridge until its replacement (early 2007), whereas no limitations on traffic are currently necessary. The possibility to implement self-developed applications running on motorized total stations allows cost-effective but still accurate monitoring. Even extensive areas (21.000 m²) can be observed within 3 working days. Temperature effects that cause horizontal movements can be considered by measuring reference prisms in post-processing. For further applications of the system an upgrade of the software will consider these movements in real-time. Ongoing research deals with the potential of terrestrial laserscanning (TLS) for this kind of monitoring task (Schäfer, 2004).
Fig. 9: General view of displacement values

TS 58 – Deformation Measurements of Bridges Thomas Schäfer, Erwin Penka, Thomas Wunderlich, Konrad Zilch Efficient Local Deformation Recognition on Highway Bridges Shaping the Change XXIII FIG Congress Munich, Germany, October 8-13, 2006
11/11
REFERENCES Hennecke, M., et. al,. 2005. Damage Detection using Reflectorless Electronic Distance
Measurements. Proceedings of the First Munich Bridge Assessment Conference (MBAC), Munich, 2005.
Juretzko, M., 2006. Leistungsfähigkeit des reflektorlosen Distanzmessmoduls R300 der Tachymeterserie TPS1200 von Leica. Flächenmanagement und Bodenordnung, Vol. 2, pp. 90-95, 2006
Penka, E., et. al. 2005, Schadenserkennung durch reflektorlose Deformationsmessungen. Beiträge zum Münchener Massivbau Seminar 2005, Hrsg. Zilch, K., Technische Universität München, Munich, 2005.
Schäfer, T. et. al., 2004. Deformation Measurement using Terrestrial Laser Scanning at the Hydropower Station of Gabcíkovo. In: Proceedings of INGEO 2004 and FIG Regional Central and Eastern European Conference on Engineering Surveying, Bratislava, 2004
Wunderlich, T., 2004. Geodetic Monitoring with Prismless Polar Methods. In: Proceedings of INGEO 2004 and FIG Regional Central and Eastern European Conference on Engineering Surveying, Bratislava, 2004.
BIOGRAPHICAL NOTES Dipl.-Ing. Thomas Schäfer Academic experience: Study Geodesy at TU München 1997-2003. Awarded Harber-Prize by the German Association DVW in 2003 Current position: Scientific employee at the Chair of Geodesy, TU München Research projects: BayFORREST (F248) on Laserscanning for CAFM (2003-2005), Interreg IIIB: Climate Change in Alpine Space (ClimChAlp) (2006-2008) CONTACT Dipl.-Ing. Thomas Schäfer Chair of Geodesy Technische Universität München Arcisstraße 21 80290 Munich GERMANY Tel. + 49 89 289 22976 Fax + 49 89 289 22976 Email: [email protected] Web site: http://www.geo.bv.tum.de