Embed Size (px)
Citation preview
1 / Agricultural Policy Review
The Agricultural Policy Review is primarily an online publication. This printed copy is produced in limited numbers as a convenience only. For more information please visit the Agricultural Policy Review website at: www.card.iastate.edu/ag_policy_review.
Ames, Iowa ● Fall 2017
InsIde thIs IssueEfficient Environmental Regulationin the Unconventional Oil Industry ............1
China’s New Nationwide E10 Ethanol Mandate and Its Global Implications .........3How Do Swine Producers and Veterinarians Expect the VFD to Affect Their Business? ................................4
The Importance of NAFTA for the Agricultural Sector ............................................6The Ebbs and Flows of International Trade ........................................ 10
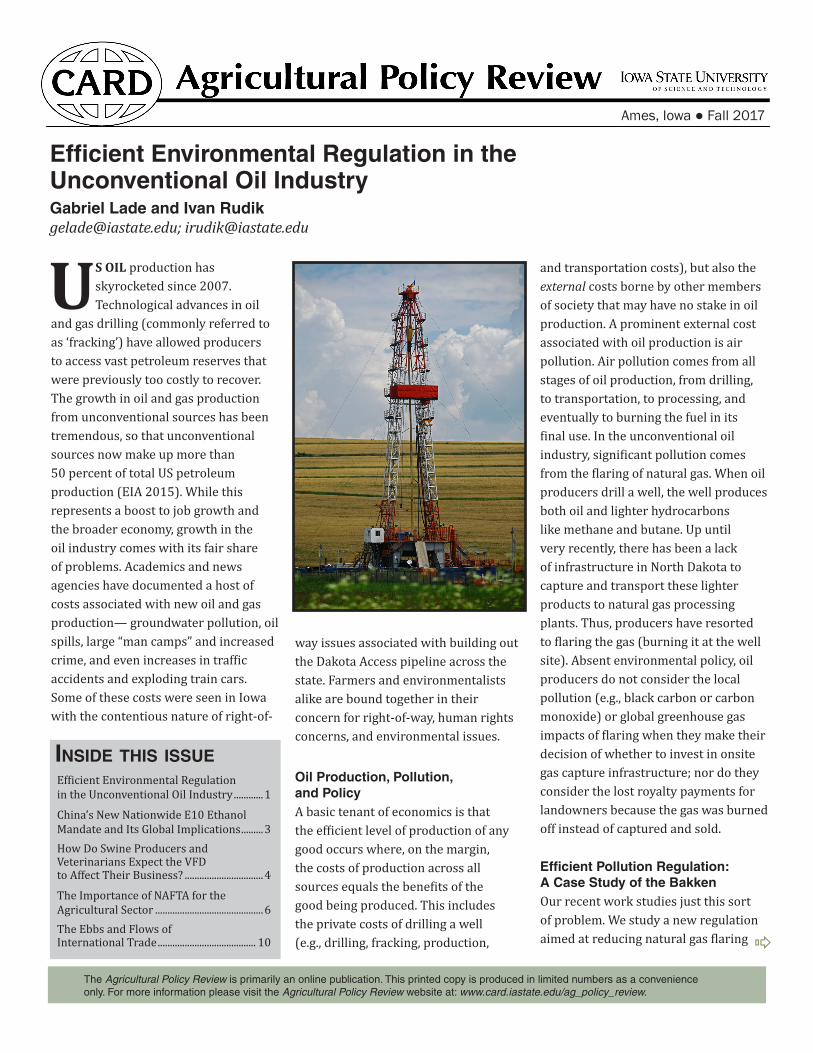
US OIL production has skyrocketed since 2007. Technological advances in oil
and gas drilling (commonly referred to as ‘fracking’) have allowed producers to access vast petroleum reserves that were previously too costly to recover. The growth in oil and gas production from unconventional sources has been tremendous, so that unconventional sources now make up more than 50 percent of total US petroleum production (EIA 2015). While this represents a boost to job growth and the broader economy, growth in the oil industry comes with its fair share of problems. Academics and news agencies have documented a host of costs associated with new oil and gas production— groundwater pollution, oil spills, large “man camps” and increased crime, and even increases in traffic accidents and exploding train cars. Some of these costs were seen in Iowa with the contentious nature of right-of-
Efficient Environmental Regulation in the Unconventional Oil IndustryGabriel Lade and Ivan [email protected]; [email protected]
way issues associated with building out the Dakota Access pipeline across the state. Farmers and environmentalists alike are bound together in their concern for right-of-way, human rights concerns, and environmental issues.
Oil Production, Pollution, and PolicyA basic tenant of economics is that the efficient level of production of any good occurs where, on the margin, the costs of production across all sources equals the benefits of the good being produced. This includes the private costs of drilling a well (e.g., drilling, fracking, production,
and transportation costs), but also the external costs borne by other members of society that may have no stake in oil production. A prominent external cost associated with oil production is air pollution. Air pollution comes from all stages of oil production, from drilling, to transportation, to processing, and eventually to burning the fuel in its final use. In the unconventional oil industry, significant pollution comes from the flaring of natural gas. When oil producers drill a well, the well produces both oil and lighter hydrocarbons like methane and butane. Up until very recently, there has been a lack of infrastructure in North Dakota to capture and transport these lighter products to natural gas processing plants. Thus, producers have resorted to flaring the gas (burning it at the well site). Absent environmental policy, oil producers do not consider the local pollution (e.g., black carbon or carbon monoxide) or global greenhouse gas impacts of flaring when they make their decision of whether to invest in onsite gas capture infrastructure; nor do they consider the lost royalty payments for landowners because the gas was burned off instead of captured and sold.
Efficient Pollution Regulation: A Case Study of the BakkenOur recent work studies just this sort of problem. We study a new regulation aimed at reducing natural gas flaring

2 / Agricultural Policy Review
continued on page 12
at wells in one of the most prolific oil producing regions in the country—the North Dakota Bakken Shale Formation. The Bakken has transformed North Dakota from a small oil state to among the most productive oil producing areas in the world. Figure 1(a) shows that oil produced from wells drilled since 2007 has risen to around one million barrels per day in under a decade. However, the figure shows that the oil wells in the Bakken also produce a lot of natural gas. In 2015 alone, the state produced just under 585 billion cubic feet of natural gas, enough to supply all Iowa residents for ten years. However, producers in the state flared over 30 percent of gases produced from 2007 to 2016 because of difficulties in building out gas pipelines and gas capturing and processing infrastructure. Flaring is so widespread in the state that the lights from the flares can be seen from space at night (Figure 2). These flared gases not only produce greenhouse gases and local pollutants harmful to human health, but they also represent significant royalty and tax revenue losses to landowners and local and state governments.
In 2014, regulators in North Dakota began discussing potential regulations to
reduce gas flaring in the state. In 2015, the North Dakota Industrial Commission instituted an ambitious regulation requiring producers to meet stringent flaring limits across all of their wells. In a new working paper, we study the impacts of this regulation on flaring rates at new wells drilled in the state since 2015. Overall, we find that the regulation has done its job. Firms have begun connecting wells to gas capture infrastructure more quickly since 2015, resulting in less flaring. As shown in Figures 1(a) and 1(b), average flaring rates are declining, and the number of wells not connected to gas pipelines has decreased precipitously. We attribute a large part of these changes to the regulation.
Good economics judges regulations by the benefits they deliver as well as the costs they impose. Our research goes beyond quantifying the benefits from the regulation, but also considers the costs of achieving the flaring reductions. The regulation has a particular feature that may make it less cost-effective than the ideal regulation: it is firm-specific. Regardless of where in North Dakota a firm operates its wells or how many wells a firm owns, they must all meet the same flaring
reduction targets. We show that this leads to inefficiencies in the policy. Some firms own a lot of wells that are close to gas pipelines. These firms are able to comply with the regulation at low cost, since building out pipelines is the expensive part of complying with the regulation. These firms may end up flaring at many of their new wells if they are already in compliance with the regulation. However, other firms may operate wells far from pipeline infrastructure and therefore may incur massive costs to comply with the policy (i.e., they must build out far longer pipelines than other firms). We show that if the regulation allowed firms with high compliance costs to pay firms with wells close to pipelines to connect their cheap wells and therefore over-comply with the policy, the same reductions in flaring could be achieved at a lower aggregate cost and both firms would be better off.
Does this mean the flaring regulation in the Bakken should be scrapped? Almost surely not. Some of the wells we see connecting to gas capture infrastructure do so at very low cost. Given the benefit to society
Figure 1: Oil and Gas Production, Flaring, and Well Connection in the Bakken (month 1 of 2007-2016)
Agricultural Policy Review / 3
IN SEPTEMBER 2017, the Chinese government announced a new nationwide ethanol mandate (NEA
2017) that expands the mandatory use of E10 fuel (gasoline containing 10 percent ethanol) from 11 trial provinces to the entire country by 2020. This measure would require ethanol consumption in China, the largest motor vehicle market in the world, to at least quadruple within the next three years. For US producers, this recent development fuels interest in whether China is going to import ethanol and/or corn (the main feedstock for ethanol production in China) to meet the mandate.
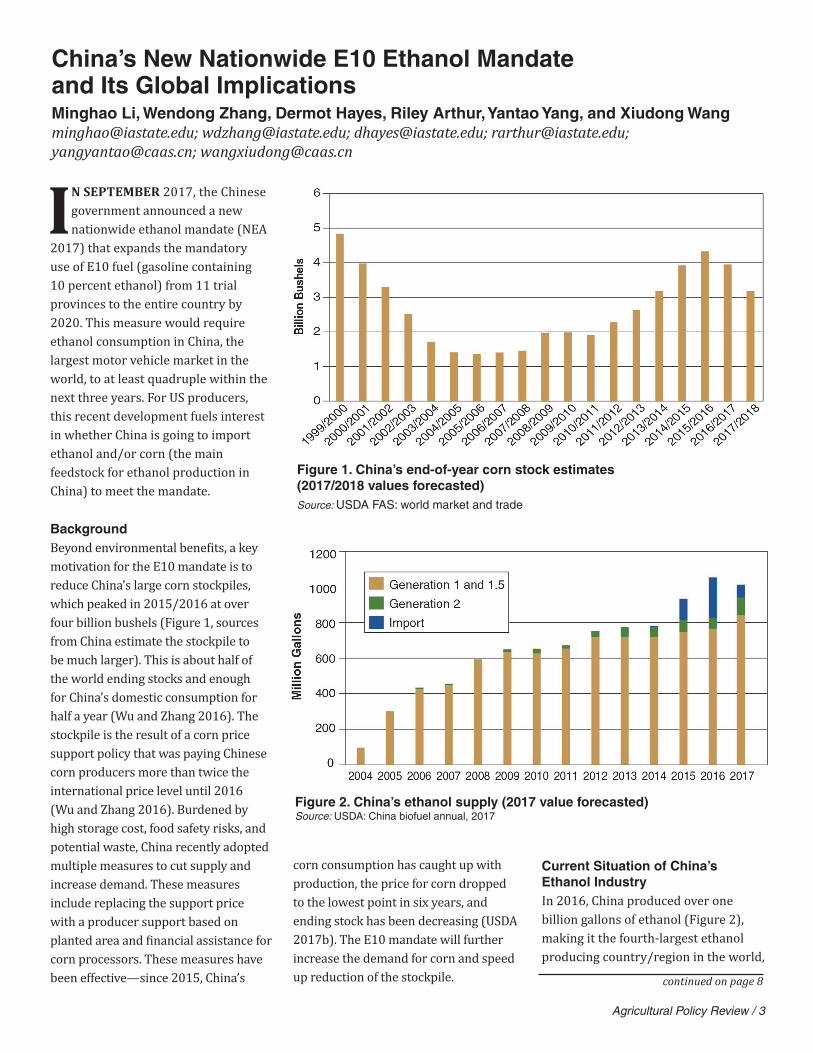
BackgroundBeyond environmental benefits, a key motivation for the E10 mandate is to reduce China’s large corn stockpiles, which peaked in 2015/2016 at over four billion bushels (Figure 1, sources from China estimate the stockpile to be much larger). This is about half of the world ending stocks and enough for China’s domestic consumption for half a year (Wu and Zhang 2016). The stockpile is the result of a corn price support policy that was paying Chinese corn producers more than twice the international price level until 2016 (Wu and Zhang 2016). Burdened by high storage cost, food safety risks, and potential waste, China recently adopted multiple measures to cut supply and increase demand. These measures include replacing the support price with a producer support based on planted area and financial assistance for corn processors. These measures have been effective—since 2015, China’s
China’s New Nationwide E10 Ethanol Mandate and Its Global ImplicationsMinghao Li, Wendong Zhang, Dermot Hayes, Riley Arthur, Yantao Yang, and Xiudong [email protected]; [email protected]; [email protected]; [email protected]; [email protected]; [email protected]
corn consumption has caught up with production, the price for corn dropped to the lowest point in six years, and ending stock has been decreasing (USDA 2017b). The E10 mandate will further increase the demand for corn and speed up reduction of the stockpile.
Current Situation of China’s Ethanol IndustryIn 2016, China produced over one billion gallons of ethanol (Figure 2), making it the fourth-largest ethanol producing country/region in the world,
Figure 1. China’s end-of-year corn stock estimates (2017/2018 values forecasted)Source: USDA FAS: world market and trade
Figure 2. China’s ethanol supply (2017 value forecasted)Source: USDA: China biofuel annual, 2017
continued on page 8
4 / Agricultural Policy Review
ANTIBIOTIC USE in livestock production is a controversial subject in the public eye.
Concerns over perceived over-use of antibiotics and antimicrobial resistance has prompted public policy debates. In response, the United States Food and Drug Administration has created new antibiotic-use guidelines in livestock. The new guidelines are: (a) Guidance 209: Judicious Use of Medically Important Antimicrobial Drugs in Food Producing Animals; (b) Guidance 213: Implementation Principles for Guidance 209; and, (c) Veterinary Feed Directive (VFD): Final Rule. The VFD final rule went into effect on October 1, 2015, and label changes requested in Guidance Documents 209 and 213 took effect on January 1, 2017 (US Department of Health and Human Services 2012, 2013; Federal Registrar 2015). These guidelines direct the use of medically important antibiotics (deemed to be important for human medicine) in livestock for therapeutic purposes (prevention, control, and treatment) only, thereby eliminating medically important antibiotics for growth promotion purposes. Medically important antibiotics can continue to be used for therapeutic purposes, but only under the guidance of a veterinarian with a valid veterinary-client-patient relationship (VCPR). These rules also eliminate over-the-counter purchases of medically important antibiotics for administration in feed and water.
To better understand the opinions of, and the plans for managing the new antibiotic use guidelines, interviews of independent, contracted, and
How Do Swine Producers and Veterinarians Expect the VFD to Affect Their Business?Gary Wynne, Georgeanne Artz, Lee Schulz, and Christopher Rademacher [email protected]; [email protected]; [email protected]; [email protected]
integrated swine producers and swine veterinarians and nutritionists from across the state of Iowa were conducted in the fall of 2016. The interviews focused on the ways swine industry participants were preparing for the implementation of these guidelines and the changes they anticipated needing to make in their business operations to comply. Twenty-six independent producers, 16 contracted producers, 3 integrated producers, 8 swine nutritionists, and 8 swine veterinarians participated in the interviews.
In many ways, the interviews were viewed as the first in a multi-step process towards evaluating the economic impacts of the new policy. To that end, an initial set of hypothesized causal relationships, or propositions, were developed to assess how well the interviews (cases) supported or refuted possible implications of the new antibiotic use guidelines. These
propositions included: • Complying with the VFD
requirements will be overly burdensome for veterinarians.
• Independent producers, compared to contract producers, will have more difficulties establishing and maintaining a VCPR.
• Independent producers, compared to contract producers, will incur more added costs due to the VFD requirements.Although it is impossible to capture
comments from every interviewee in this article, the following summaries reflect sentiments from a broad array of industry participants.
Veterinarians must have, or establish and maintain, a VCPR to write a VFD for a producer. A copy of each VFD must be kept by veterinarians, feed distributors, and producers for two years. The “timely visit” requirement of the VCPR and the added time it takes
Agricultural Policy Review / 5
for issuing a VFD and recording keeping is an added cost for veterinarians. Certainly, these costs will be passed on to producers in the form of charges for writing VFDs and site visits. Veterinary offices may need to hire more employees to assist in farm visits, recordkeeping, and daily appointments because of the added demand for a veterinarian’s time.
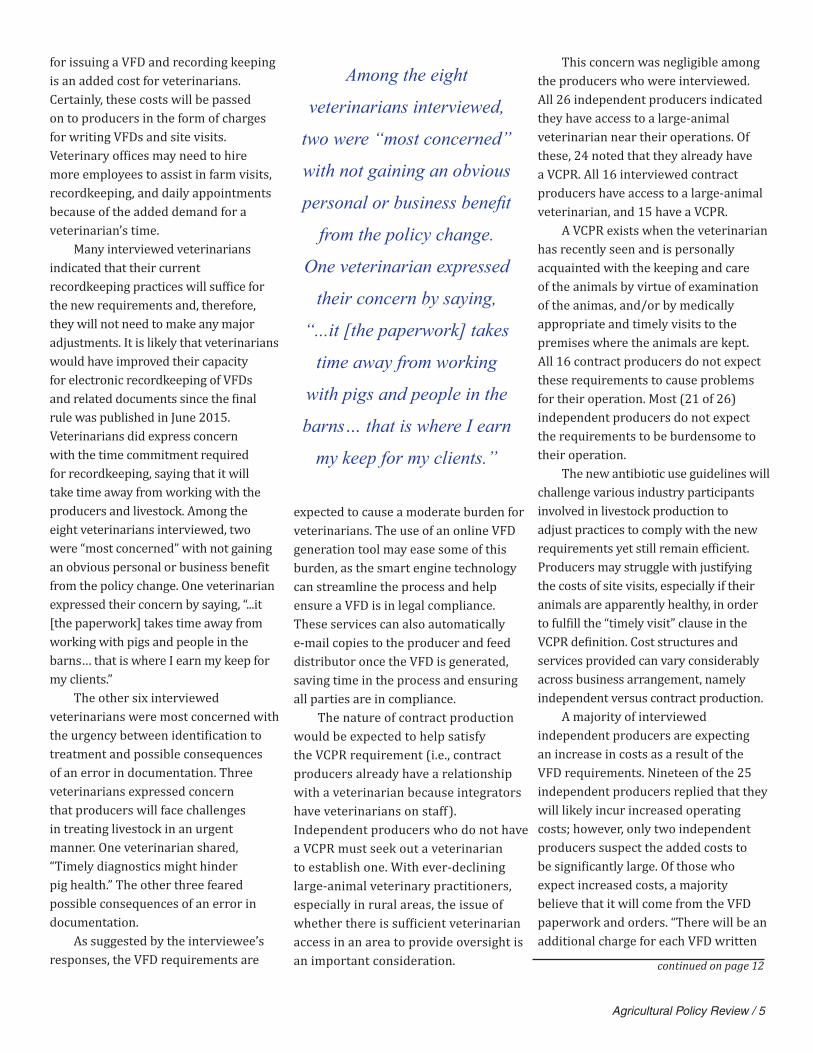
Many interviewed veterinarians indicated that their current recordkeeping practices will suffice for the new requirements and, therefore, they will not need to make any major adjustments. It is likely that veterinarians would have improved their capacity for electronic recordkeeping of VFDs and related documents since the final rule was published in June 2015. Veterinarians did express concern with the time commitment required for recordkeeping, saying that it will take time away from working with the producers and livestock. Among the eight veterinarians interviewed, two were “most concerned” with not gaining an obvious personal or business benefit from the policy change. One veterinarian expressed their concern by saying, “...it [the paperwork] takes time away from working with pigs and people in the barns… that is where I earn my keep for my clients.”
The other six interviewed veterinarians were most concerned with the urgency between identification to treatment and possible consequences of an error in documentation. Three veterinarians expressed concern that producers will face challenges in treating livestock in an urgent manner. One veterinarian shared, “Timely diagnostics might hinder pig health.” The other three feared possible consequences of an error in documentation.
As suggested by the interviewee’s responses, the VFD requirements are
expected to cause a moderate burden for veterinarians. The use of an online VFD generation tool may ease some of this burden, as the smart engine technology can streamline the process and help ensure a VFD is in legal compliance. These services can also automatically e-mail copies to the producer and feed distributor once the VFD is generated, saving time in the process and ensuring all parties are in compliance.
The nature of contract production would be expected to help satisfy the VCPR requirement (i.e., contract producers already have a relationship with a veterinarian because integrators have veterinarians on staff). Independent producers who do not have a VCPR must seek out a veterinarian to establish one. With ever-declining large-animal veterinary practitioners, especially in rural areas, the issue of whether there is sufficient veterinarian access in an area to provide oversight is an important consideration.
This concern was negligible among the producers who were interviewed. All 26 independent producers indicated they have access to a large-animal veterinarian near their operations. Of these, 24 noted that they already have a VCPR. All 16 interviewed contract producers have access to a large-animal veterinarian, and 15 have a VCPR.
A VCPR exists when the veterinarian has recently seen and is personally acquainted with the keeping and care of the animals by virtue of examination of the animas, and/or by medically appropriate and timely visits to the premises where the animals are kept. All 16 contract producers do not expect these requirements to cause problems for their operation. Most (21 of 26) independent producers do not expect the requirements to be burdensome to their operation.
The new antibiotic use guidelines will challenge various industry participants involved in livestock production to adjust practices to comply with the new requirements yet still remain efficient. Producers may struggle with justifying the costs of site visits, especially if their animals are apparently healthy, in order to fulfill the “timely visit” clause in the VCPR definition. Cost structures and services provided can vary considerably across business arrangement, namely independent versus contract production.
A majority of interviewed independent producers are expecting an increase in costs as a result of the VFD requirements. Nineteen of the 25 independent producers replied that they will likely incur increased operating costs; however, only two independent producers suspect the added costs to be significantly large. Of those who expect increased costs, a majority believe that it will come from the VFD paperwork and orders. “There will be an additional charge for each VFD written
continued on page 12
Among the eight
veterinarians interviewed,
two were “most concerned”
with not gaining an obvious
personal or business benefit
from the policy change.
One veterinarian expressed
their concern by saying,
“...it [the paperwork] takes
time away from working
with pigs and people in the
barns… that is where I earn
my keep for my clients.”
6 / Agricultural Policy Review
THE IMPLEMENTATION of the North American Free Trade Agreement (NAFTA) in 1994
opened borders to trade between the United States, Canada, and Mexico. The agreement originated from the free trade agreement the United States and Canada signed in 1988. NAFTA eliminates almost all barriers to trade and investment between the three North American countries and includes provisions for the protection of intellectual property rights. Certain trade barriers for agricultural products remain under NAFTA—notably, products under supply management in Canada (dairy, eggs, and poultry).
President Trump pushed for the re-negotiation of NAFTA soon after his election. Canada and Mexico agreed and negotiations are currently ongoing. NAFTA has been effective for more than 20 years and the economies of the three North American countries have significantly changed since its inception. In agriculture, notable changes include the disappearance of the Canadian Wheat Board, the growth in the production of ethanol from corn, increased competition from the rest of the world, the signature of other trade agreements and the increased integration of the economies of the three countries.
NAFTA has facilitated the integration of the agricultural sectors of the three countries with the gradual elimination of almost all tariffs and improved cooperation for the application and enforcement of sanitary and phytosanitary measures. NAFTA is so central to trade in North America that it is easy to forget how important this trade agreement is to the
The Importance of NAFTA for the Agricultural SectorSebastien [email protected]
US economy and to the US agricultural sector. We briefly review in this article some statistics about agricultural trade between the United States, Canada, and Mexico and discuss key issues regarding agricultural trade.
Agricultural Trade Between Canada, Mexico and the United StatesTrade flows of agricultural commodities between the United States, Canada, and Mexico are very large. In 2016, US agricultural imports from Canada totaled $24.9 billion while US exports amounted to $25.3 billion. In the same year, US imports of agricultural products from Mexico reached $24.66 billion and US exports to Mexico were $17.68 billion.
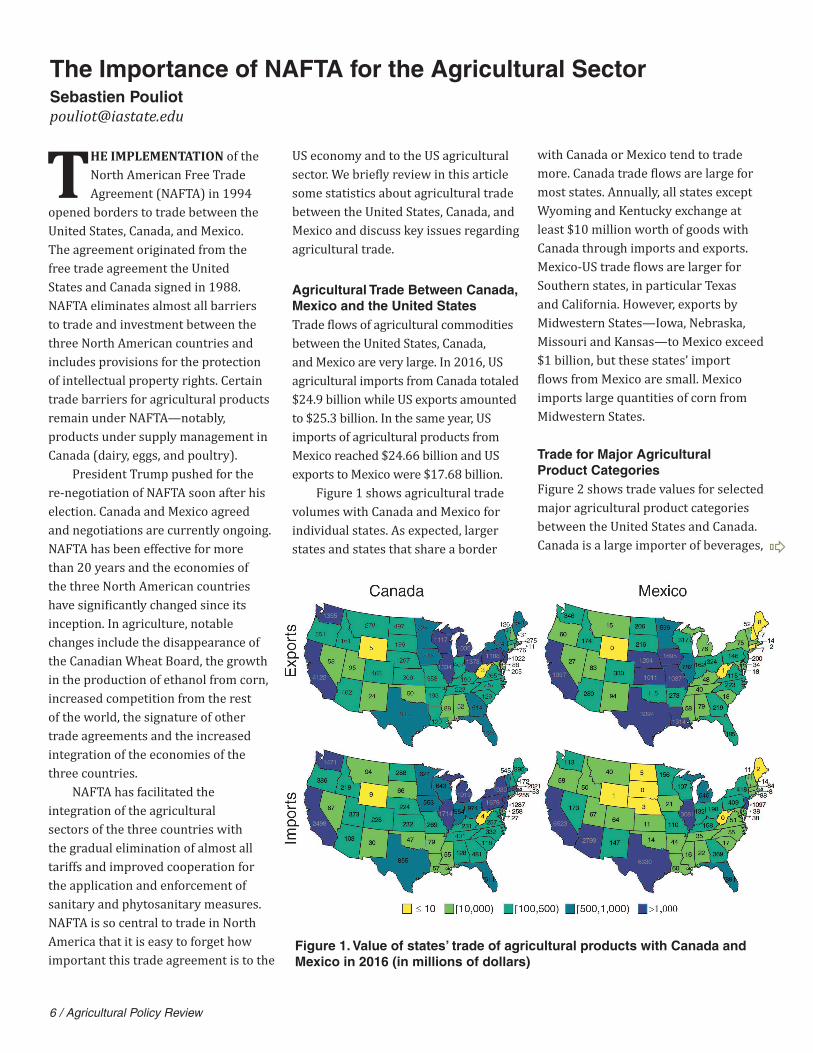
Figure 1 shows agricultural trade volumes with Canada and Mexico for individual states. As expected, larger states and states that share a border
with Canada or Mexico tend to trade more. Canada trade flows are large for most states. Annually, all states except Wyoming and Kentucky exchange at least $10 million worth of goods with Canada through imports and exports. Mexico-US trade flows are larger for Southern states, in particular Texas and California. However, exports by Midwestern States—Iowa, Nebraska, Missouri and Kansas—to Mexico exceed $1 billion, but these states’ import flows from Mexico are small. Mexico imports large quantities of corn from Midwestern States.
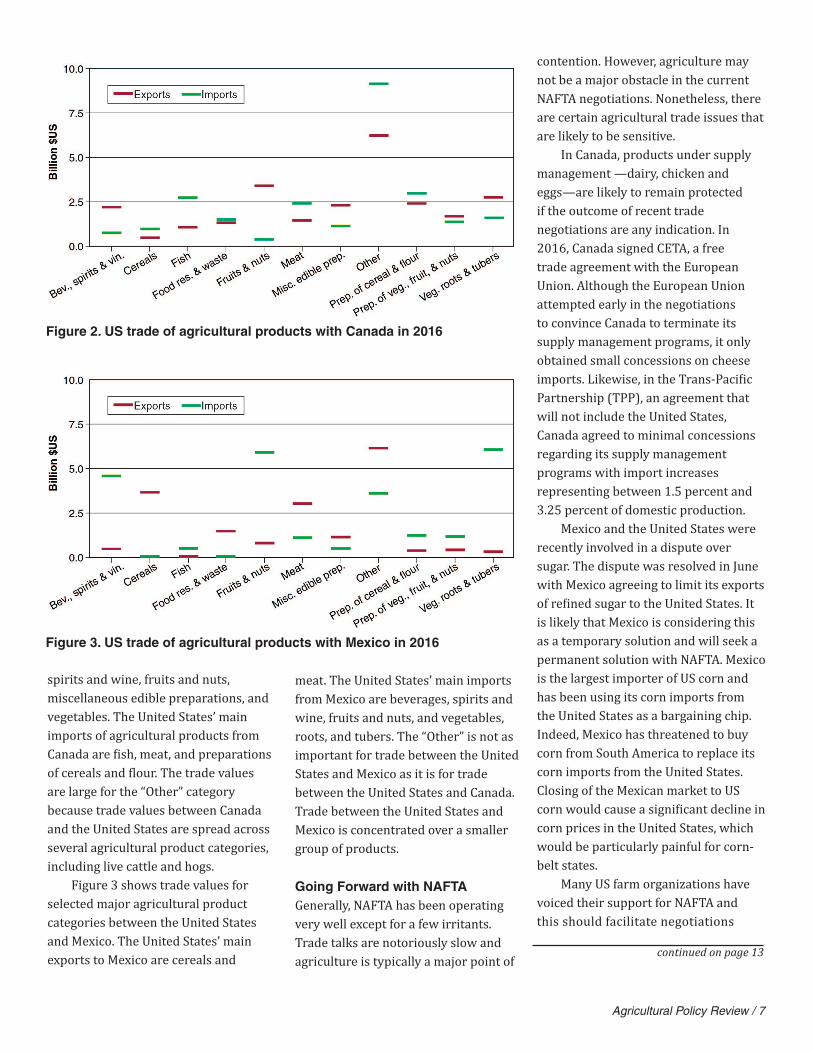
Trade for Major Agricultural Product CategoriesFigure 2 shows trade values for selected major agricultural product categories between the United States and Canada. Canada is a large importer of beverages,
Figure 1. Value of states’ trade of agricultural products with Canada and Mexico in 2016 (in millions of dollars)
Agricultural Policy Review / 7
spirits and wine, fruits and nuts, miscellaneous edible preparations, and vegetables. The United States’ main imports of agricultural products from Canada are fish, meat, and preparations of cereals and flour. The trade values are large for the “Other” category because trade values between Canada and the United States are spread across several agricultural product categories, including live cattle and hogs.
Figure 3 shows trade values for selected major agricultural product categories between the United States and Mexico. The United States’ main exports to Mexico are cereals and
meat. The United States’ main imports from Mexico are beverages, spirits and wine, fruits and nuts, and vegetables, roots, and tubers. The “Other” is not as important for trade between the United States and Mexico as it is for trade between the United States and Canada. Trade between the United States and Mexico is concentrated over a smaller group of products.
Going Forward with NAFTAGenerally, NAFTA has been operating very well except for a few irritants. Trade talks are notoriously slow and agriculture is typically a major point of
Figure 2. US trade of agricultural products with Canada in 2016
Figure 3. US trade of agricultural products with Mexico in 2016
contention. However, agriculture may not be a major obstacle in the current NAFTA negotiations. Nonetheless, there are certain agricultural trade issues that are likely to be sensitive.
In Canada, products under supply management —dairy, chicken and eggs—are likely to remain protected if the outcome of recent trade negotiations are any indication. In 2016, Canada signed CETA, a free trade agreement with the European Union. Although the European Union attempted early in the negotiations to convince Canada to terminate its supply management programs, it only obtained small concessions on cheese imports. Likewise, in the Trans-Pacific Partnership (TPP), an agreement that will not include the United States, Canada agreed to minimal concessions regarding its supply management programs with import increases representing between 1.5 percent and 3.25 percent of domestic production.
Mexico and the United States were recently involved in a dispute over sugar. The dispute was resolved in June with Mexico agreeing to limit its exports of refined sugar to the United States. It is likely that Mexico is considering this as a temporary solution and will seek a permanent solution with NAFTA. Mexico is the largest importer of US corn and has been using its corn imports from the United States as a bargaining chip. Indeed, Mexico has threatened to buy corn from South America to replace its corn imports from the United States. Closing of the Mexican market to US corn would cause a significant decline in corn prices in the United States, which would be particularly painful for corn-belt states.
Many US farm organizations have voiced their support for NAFTA and this should facilitate negotiations
continued on page 13
8 / Agricultural Policy Review
after the United States, Brazil, and the European Union. From 2004 to 2016, the average annual production growth rate was 16.8 percent.
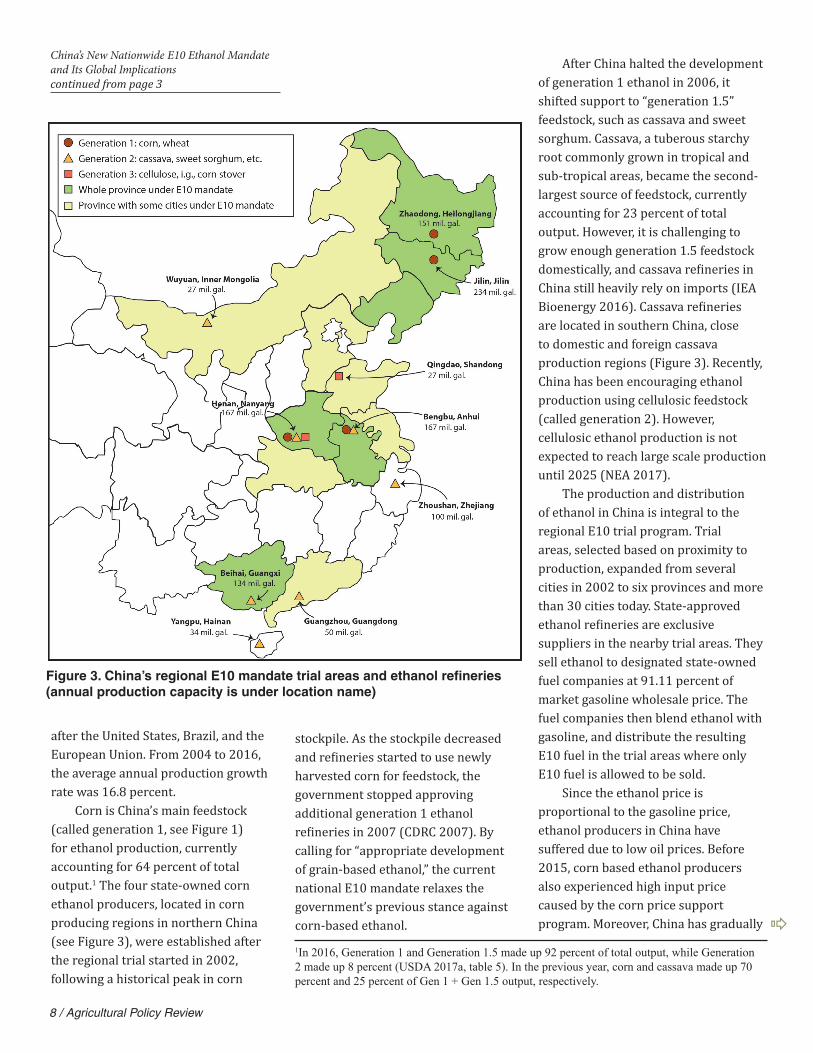
Corn is China’s main feedstock (called generation 1, see Figure 1) for ethanol production, currently accounting for 64 percent of total output.1 The four state-owned corn ethanol producers, located in corn producing regions in northern China (see Figure 3), were established after the regional trial started in 2002, following a historical peak in corn
stockpile. As the stockpile decreased and refineries started to use newly harvested corn for feedstock, the government stopped approving additional generation 1 ethanol refineries in 2007 (CDRC 2007). By calling for “appropriate development of grain-based ethanol,” the current national E10 mandate relaxes the government’s previous stance against corn-based ethanol.
1In 2016, Generation 1 and Generation 1.5 made up 92 percent of total output, while Generation 2 made up 8 percent (USDA 2017a, table 5). In the previous year, corn and cassava made up 70 percent and 25 percent of Gen 1 + Gen 1.5 output, respectively.
After China halted the development of generation 1 ethanol in 2006, it shifted support to “generation 1.5” feedstock, such as cassava and sweet sorghum. Cassava, a tuberous starchy root commonly grown in tropical and sub-tropical areas, became the second-largest source of feedstock, currently accounting for 23 percent of total output. However, it is challenging to grow enough generation 1.5 feedstock domestically, and cassava refineries in China still heavily rely on imports (IEA Bioenergy 2016). Cassava refineries are located in southern China, close to domestic and foreign cassava production regions (Figure 3). Recently, China has been encouraging ethanol production using cellulosic feedstock (called generation 2). However, cellulosic ethanol production is not expected to reach large scale production until 2025 (NEA 2017).
The production and distribution of ethanol in China is integral to the regional E10 trial program. Trial areas, selected based on proximity to production, expanded from several cities in 2002 to six provinces and more than 30 cities today. State-approved ethanol refineries are exclusive suppliers in the nearby trial areas. They sell ethanol to designated state-owned fuel companies at 91.11 percent of market gasoline wholesale price. The fuel companies then blend ethanol with gasoline, and distribute the resulting E10 fuel in the trial areas where only E10 fuel is allowed to be sold.
Since the ethanol price is proportional to the gasoline price, ethanol producers in China have suffered due to low oil prices. Before 2015, corn based ethanol producers also experienced high input price caused by the corn price support program. Moreover, China has gradually
Figure 3. China’s regional E10 mandate trial areas and ethanol refineries (annual production capacity is under location name)
China’s New Nationwide E10 Ethanol Mandate and Its Global Implicationscontinued from page 3

Agricultural Policy Review / 9
removed subsidies for ethanol refineries, especially those using first generation feed stocks. Although the policy details are not clear yet, the new national mandate is likely to good news for the embattled ethanol industry.
China has been importing substantial quantities of ethanol in the past two years. Before 2015, even though the imported ethanol was much cheaper than domestic ethanol, very little ethanol was imported. This is due to government forbidding distributors to handle imported ethanol in order to protect the domestic ethanol industry. Starting in 2015, imports rapidly increased and reached almost a quarter of total supply in 2016 (225 million gallons), with 95 percent from the United States (in that year, China was the third-largest export destination of US ethanol, encompassing 17 percent of total US ethanol exports). However, at the end of 2016, China increased the import tariff from 5 percent to the WTO bound rate of 30 percent, causing the 2017 import forecast to drop to only 35 percent of 2016 levels (USDA 2017a).
Potential implications of China’s National E10 MandateCurrently, China consumes 40 billion gallons of gasoline and one billion gallons of ethanol. Projections show that by 2020 gasoline consumption will reach 46 billion gallons (USDA 2017). Meeting the national E10 mandate would require an extra 3.6 billion gallons of ethanol, putting China ahead of the European Union to become the world’s third-largest ethanol consumer.
Since details of the mandate have not been disclosed, it is not yet clear how China will generate more than four-fold output growth within three years (assuming domestic production is to keep up with consumption). Currently, production capacity utilization rate is about 85 percent (USDA 2017), therefore a short-term production spur
can be achieved with existing facilities. Beyond that, a dramatic increase in capacity is needed. Since it takes one to two years to build a large scale generation 1 or 1.5 refinery in China, it is possible that China will be able to construct the physical facilities in time.
However, if the current trends in consumption and production continue, China’s corn stock will fall quickly, opening up potential opportunities for more imports. If we assume that consumption growth follows the same
Figure 5. Projected corn stockpile with ethanol mandate and import needed to maintain a minimum stockpile of 1.39 billion bushels
trend it has shown 2010, and that production decreases at its recent pace for one more year (to 2017/2018), and then stabilizes (Figure 4), the ending stock will be used by the end of the 2020/2021 crop year, even in the absence of the ethanol mandate.
The ethanol mandate will further speed up the stockpile reduction. It will require between roughly 0.65 billion and 1.35 billion bushels of corn per
Figure 4. China’s corn production and consumption, history and projectionsSource: USDA FAS data
continued on page 13
10 / Agricultural Policy Review
The Ebbs and Flows of International TradeLee Schulz and Chad [email protected]; [email protected]
AS WE have detailed in various articles in this and other ISU outreach publications,
international trade is a significant demand component for our agricultural markets. For the major US agricultural commodities, exports capture between 12 (cattle and corn) and 85 (cotton) percent of total use. Many factors shape international demand, from the growth, or lack thereof, in the general economy or the population to the agricultural and trade policies employed by various countries. At a time where the US agricultural sector is hoping to find the bottom of the economic downturn it is in, it is searching for growth in traditional markets and opening in new markets to bring about a financial resurgence; and, with 95 percent of the world’s customers outside of our borders, the potential for growth is sizable.
The 2017 marketing year is shaping up to be a mix for US agriculture on the export front. In general, there is export growth for most commodities, but a few are suffering a setback. That pattern holds for the major Iowa commodities. The trade policy uncertainty surrounding some of trade agreements has also seemed to have a mixed impact on trade flows. Despite the tension in the NAFTA renegotiations, agricultural export sales to Canada and Mexico have been higher for Iowa’s commodities. However, concerns about the KORUS agreement have coincided with some reversals in agricultural trade.
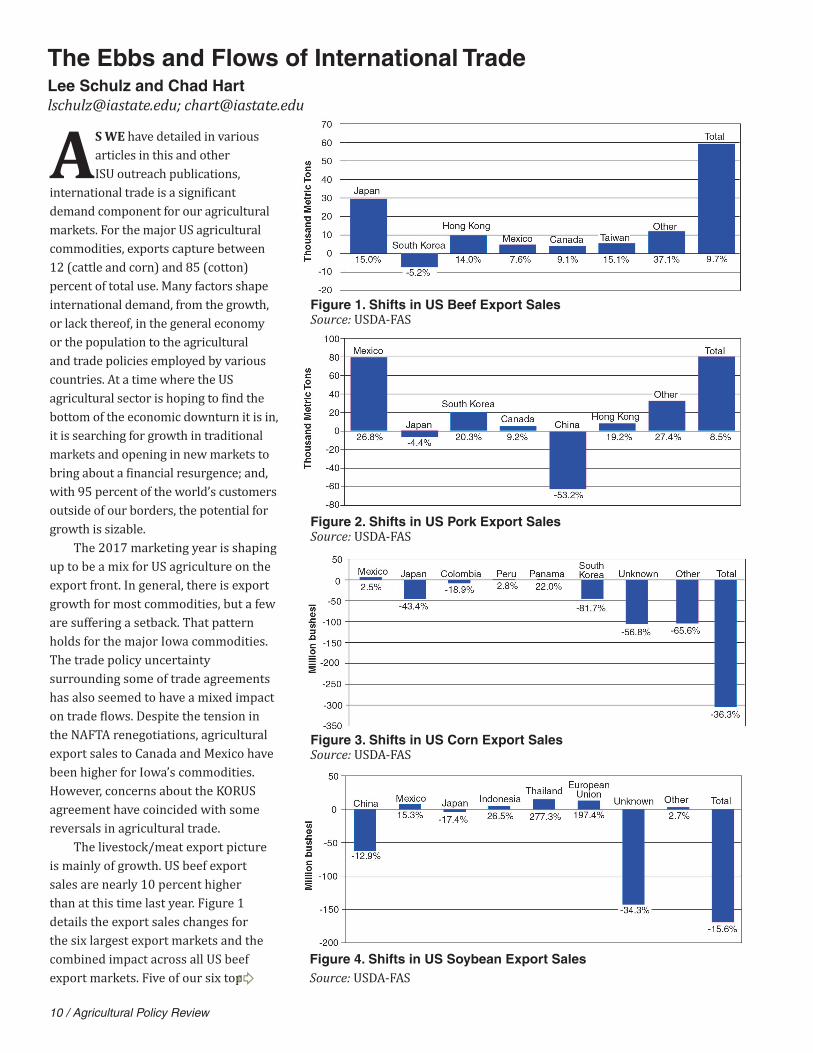
The livestock/meat export picture is mainly of growth. US beef export sales are nearly 10 percent higher than at this time last year. Figure 1 details the export sales changes for the six largest export markets and the combined impact across all US beef export markets. Five of our six top
Figure 1. Shifts in US Beef Export SalesSource: USDA-FAS
Figure 2. Shifts in US Pork Export SalesSource: USDA-FAS
Figure 3. Shifts in US Corn Export Sales Source: USDA-FAS
Figure 4. Shifts in US Soybean Export SalesSource: USDA-FAS

Agricultural Policy Review / 11
markets are higher, with the Japanese market leading the export charge as they represent roughly half of the total growth this year. South Korea is the only major market that has taken a step back. Our partners in NAFTA have expanded beef purchases 7–9 percent. While there has been a lot of chatter about the opening of China to US beef, the export impacts will take some time to develop. Currently, the entire direct Chinese pull in the beef market is four times less than just the growth in the Canadian market. Growth outside the major markets has been robust, up 37 percent for the year. So the trade situation for US beef is very positive at the moment.
The pork sector is experiencing much larger swings in trade flows, but the overall pattern is similar to beef. Total export sales are up 8.5 percent, compared to last year. Most of the major markets are higher, with the majority of that strength coming from countries where the United States has trade agreements (Mexico, Canada, and South Korea). In fact, the growth in the Mexican pork market is basically the growth in US pork exports. The Japanese and Chinese markets have been the areas where US pork has retreated this year. China tends to be a very volatile market for US pork, with substantial gains in one year offset by losses the next, which looks to be the case this
year, as Chinese imports are roughly half of what they were last year. Smaller pork markets are growing at a relatively strong rate, above 25 percent.
While the livestock markets are enjoying export growth, the crop markets are dealing with larger international competition and, thus far, smaller export sales. For corn, the downturn was expected. USDA has consistently projected lower corn exports for the 2017/18 marketing year. Three of our top six markets have increased purchases, but the growth in bushels is relatively small. Mexico has purchased a bit more corn, but the shrinkage in other markets overwhelms that growth. Japan is down over 40 percent, South Korea is 80 percent lower, and smaller markets are down an average of 66 percent. Sales to unspecified destinations, labeled as “Unknown,” are 57 percent lower. Overall, corn export sales are down 36 percent or 300 million bushels compared to last year. By the end of the marketing year (August 2018), USDA expects corn exports to be roughly 450 million bushels lower.
Soybean export sales so far this marketing year are also off to a disappointing start. Direct sales to China, the largest import market by far, are 13 percent lower. China is also the major destination for the “Unknown”
sales, which are off by 34 percent. While we are seeing soybean sales growth in other markets (Mexico, Indonesia, Thailand, and the European Union), the downturn in the Chinese market is driving the current numbers. However, while the current situation is weaker, USDA’s projections show a rebound in soybean exports and a continuation of record export sales. With current sales running 160 million bushels below last year’s pace, exports will have to surge to meet the 75 million bushel growth projected by August 2018.
On the whole, US agricultural exports remain very strong. Agricultural trade and the US agricultural trade surplus peaked in 2014. While there has been some retracement since then, the United States still exports roughly $140 billion of agricultural products and has maintained a positive agricultural trade balance since 1994. Current projections for 2017 and 2018 show export values holding firm and the agricultural trade balance staying in the $20–$30 billion range. Furthermore, while trade renegotiations could upset those flows, for most the part, US agricultural trade has been only seen minor disruptions thus far. Farmers and ranchers hope that continues to be the case.

12 / Agricultural Policy Review
How Do Swine Producers and Veterinarians Expect the VFD to Affect Their Business?continued from page 5
and any new prescriptions,” shared one independent producer. A second producer offered, “There will be a small charge for the VFD paperwork, but I’m not sure that it will be much over the course of the year.”
All 16 of the interviewed contract producers do not anticipate increases in their operating costs. Each shared that the integrators will cover any additional costs as a result of the policy. “The integrator would pay for product and supplies,” shared one contract producer.
Results from the case study analysis indicates swine industry participants are knowledgeable on the new antibiotic-use guidelines and have prepared themselves for changes to their business operations that may be needed. The VFD
is expected to cause a moderate burden for veterinarians. Overall, producers believe the VFD will not have a large impact on their business. Interview participants provided a number of anecdotes about impacts. Together, these comments suggest, impacts will be larger for independent producers than contract producers.
Follow-up interviews are currently being conducted to quantify/gauge the actual impact during the first year of the new antibiotic-use guidelines.
Funding for this research was provided by the
Economic Research Service through USDA/ERS
Cooperative Agreement # 58-6000-6-0064, entitled
Economic Effects of Changing Antibiotic Use
Preferences in US Livestock Production.
ReferencesU.S. Department of Health and Human
Services, Food and Drug Administration,
Center for Veterinary Medicine. 2012. #209 Guidance for Industry, The Judicious Use of Medically Important Antimicrobial Drugs in Food Producing Animals. April 13, 2012. Available at http://www.fda.gov/downloads/AnimalVeterinary/GuidanceComplianceEnforcement/GuidanceforIndustry/UCM216936.pdf.
U.S. Department of Health and Human Services, Food and Drug Administration, Center for Veterinary Medicine. 2013. #213 Guidance for Industry, New Animal Drugs and New Animal Drug Combination Products Administered in or on Medicated Feed or Drinking Water of Food-Producing Animals: Recommendations for Drug Sponsors for Voluntarily Aligning Product Use Conditions with GFI #209. December 2013. Available at http://www.fda.gov/downloads/AnimalVeterinary/GuidanceComplianceEnforcement/GuidanceforIndustry/UCM299624.pdf.
Federal Registrar. 2015. Veterinary Feed Directive; Final Rule. Food and Drug Administration, Department of Health and Human Services. Vol. 80, No. 106. June 3, 2015. Available at https://www.gpo.gov/fdsys/pkg/FR-2015-06-03/
pdf/2015-13393.pdf.
of reducing pollution from flaring and from putting the natural gas to good use instead of simply burning it off, the regulation likely delivers substantive benefits to local populations and society more generally. Our research suggests that we can improve this regulation and make everyone better off, from producers to consumers. Firm-specific regulations leave opportunities for reducing flaring more cost effectively on the table. Reviewing and revisiting how the policy is implemented, therefore, could lead to substantially lower implementation costs while maintaining the benefits of this regulation.
ReferencesUS Energy Information Administration (EIA).
2016. “Hydraulic fracturing accounts for about half of US crude oil production.” https://www.eia.gov/todayinenergy/detail.php?id=25372.
Figure 2: Flaring in the Bakken at Night Source: NASA
Efficient Environmental Regulation in the Unconventional Oil Industrycontinued from page 2

Agricultural Policy Review / 13
year.2 If we assume 0.9 billion bushels, (Figure 4), then the stockpile will be depleted by the end of 2019/2020 crop year. If China wants to maintain a stockpile of 1.39 billion bushels, the lowest in recent history, it will need to import two billion bushels of corn by 2020/21 and much more after that. China may change its policies if it finds high levels of corn import unacceptable.
US corn exports to China resumed in 2017 after Syngenta’s Duracade trait (used in the United States against rootworms) got Chinese approval in July 2017. So it is possible that if China increases corn imports that the United States will be a dominant source.
In the past, China has imported large quantities of ethanol when domestic production has fallen short of demand. If imports surge as a result of the E10 mandate, the United States, the top ethanol exporter to China, will benefit. In fact, as this report is
being prepared, it is profitable for US producers to export to China, even with the 30 percent tariff (S&P Global Platts 2017).
Whether the ethanol mandate and other changes in China’s corn policy will result in additional corn imports or additional ethanol imports remains to be seen.
ReferencesChina Development and Reform Commission (CDRC).
2007. “Guidance Regarding the Healthy Growth of Corn Processing Industry.” (“关于促进玉米深加
工业健康发展的指导意见”). http://www.gov.cn/zwgk/2007-09/20/content_755790.htm
IEA Bioenergy. 2016. “The Potential of Biofuels in China” no. 39. http://www.ieabioenergy.com/publications/the-potential-of-biofuels-in-china/
National Energy Administration (NEA). 2002. “Plan for Fuel Ethanol Trial.” (“车用乙醇汽油使用
试点方案”). http://www.nea.gov.cn/2015-12/13/c_131051672.htm
National Energy Administration (NEA). 2017. “The Plan for Expanding Biofuel Ethanol Production and Promoting Ethanol Usage in Motor Vehicles.” (“关于扩大生物燃料乙醇生产和推广
使用车用乙醇汽油的实施方案”). http://www.nea.gov.cn/2017-09/13/c_136606035.htm
S&P Global Platts. 2017. “Ethanol Arbitrage Window from the US to China Open.” https://
www.platts.com/latest-news/agriculture/singapore/ethanol-arbitrage-window-from-the-us-to-china-26818462
Wu, Q. and W. Zhang. 2017. “Of Maize and Markets: China’s New Corn Policy.” Agricultural Policy Review, Center for Agricultural and Rural Development, Iowa State University. http://www.card.iastate.edu/ag_policy_review/display.aspx?id=59
USDA. 2015. China Biofuel Annual 2015, no. CH15030.
USDA. 2017a. China Biofuel Annual 2017, no. CH16067.
USDA. 2017b. China Grain and Feed Annual 2017, no. CH16001.
2Low estimate: assuming the current share of corn ethanol does not change. Currently, China’s technology can covert 0.376 bushels of corn to one gallon of ethanol, total in-crease in ethanol consumption * domestic% * corn%=3.6 * 75% * 65% * 0.376=0.65 billion bushels. High estimate, all increase in ethanol output comes from domestic corn-ethanol: 3.6*0.376=1.36
China’s New Nationwide E10 Ethanol Mandate and Its Global Implicationscontinued from page 9
on agriculture. There are sectors for which it might be harder to find common ground with Canada, like aircraft manufacturing and softwood lumber. An apparent concern for the current US administration is the trade deficit with Mexico. The United States imports a lot more from Mexico than it exports to Mexico. To trade experts, trade deficits and surpluses are normal outcomes of free trade, they reflect comparative advantages and certainly do not imply that a
country is losing from opening trade with another country. There are more pressing issues. First, the rules of origin, or the percentage of NAFTA content for a product to be traded duty free, should not be used as trade barriers. Second, NAFTA must have an efficient dispute resolution mechanism to quickly and fairly resolve trade disputes and prevent the abuse of countervailing and anti-dumping safeguards.
The current negotiations will follow a tight schedule because of the elections in July in Mexico next year and mid-term elections in the United States a few
months later. We should learn over the next six months what shape NAFTA 2.0 will take. A possible outcome to watch for is a bilateral agreement between Canada and the United States.
The Importance of NAFTA for the Agricultural Sectorcontinued from page 7

14 / Agricultural Policy Review
The Agricultural Policy Review (APR)
offers readers an easy way to stay up to
date on the latest research from CARD--
articles are brief, easy-to-read summaries
of recent CARD research
The APR is delivered to your inbox three
times a year. Readers from universities,
government organizations, and the private
sector have aready signed up and you
can too at:
http://bit.ly/APRsignup

Agricultural Policy Review / 15
www.card.iastate.edu
Editorial StaffNathan Cook Managing EditorCurtis Balmer Web ManagerRebecca Olson Publication Design
EditorCatherine L. Kling CARD Director
Iowa State University does not discriminate on the basis of race, color, age, ethnicity, religion, national origin, pregnancy, sexual orientation, gender identity, genetic information, sex, marital status, disability, or status as a U.S. veteran. Inquiries can be directed to the Interim Assistant Director of Equal Opportunity and Compliance, 3280 Beardshear Hall, (515) 294-7612.
The Agricultural Policy Review is a quarterly newsletter published by the Center for Agricultural and Rural Development (CARD). This publication presents summarized results that emphasize the implications of ongoing agricultural policy analysis of the near-term agricultural situation, and discussion of agricultural policies currently under consideration.
Georgeanne M. ArtzEdward J. BalistreriJohn CrespiGil DepaulaAmani ElobeidChad HartDermot HayesKeri L. JacobsHelen Jensen
David A. KeiserGabriel E. LadeGianCarlo MoschiniAlejandro PlastinaSebastien PouliotIvan J. RudikLee L. SchulzWendong Zhang
Advisory Committee Articles may be reprinted with permission and with appropriate attribution. Contact the managing editor at the above e-mail or call 515-294-3809.
Subscription is free and available on-line. To sign up for an electronic alert to the newsletter post, go to www. card.iastate.edu/ag_policy_review/subscribe and submit your information.