Embed Size (px)
Citation preview
18 September 2009
Efficiency Optimisation
Brief Summary of the A.P. Møller-Mærsk Energy Efficiency Initiatives
Ole Graa Jakobsen
Senior General Manager
Head of Machinery Section
Ship Engineering - Maersk Maritime Technology
18 September 2009Ole Graa Jakobsen
Efficiency Optimisation
Page 2
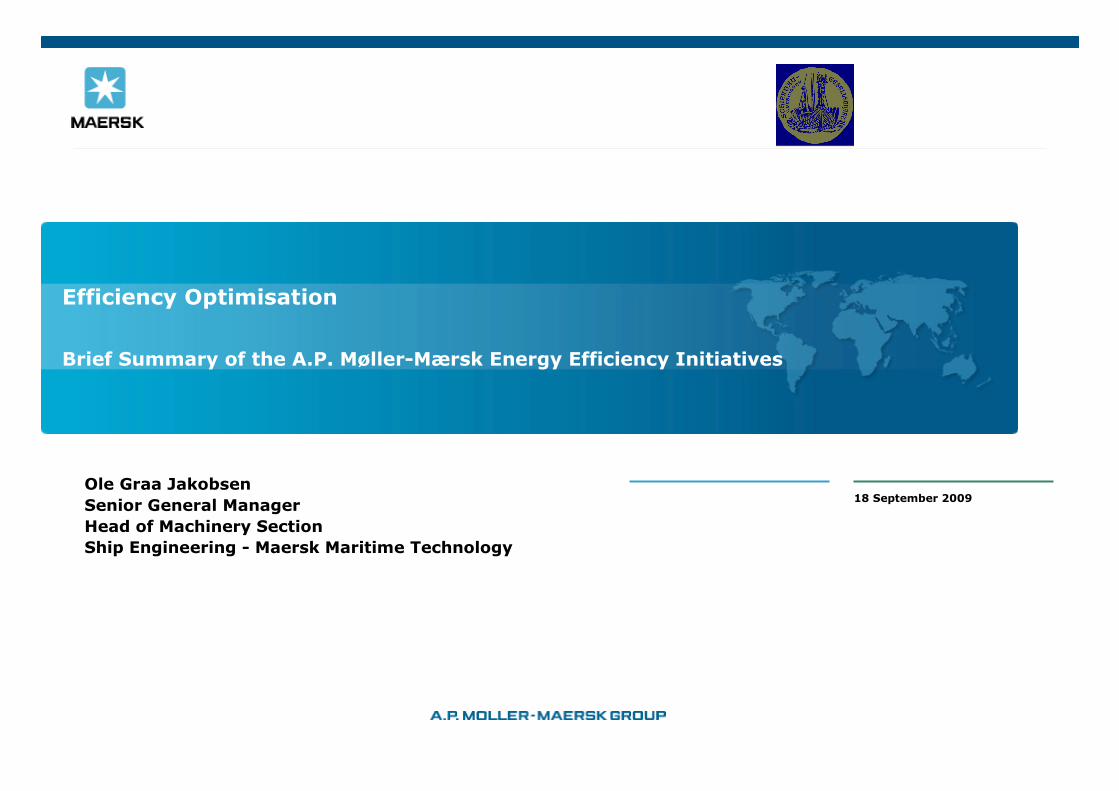
Who we are
The A.P. Moller - Maersk Group is a diversified conglomerate, founded in 1904 by Mr. A.P. Møller
110,000 employees and operations in over 130 countries
Headquarters in Copenhagen.
Business segments:Container shipping
Tankers
Offshore supply services, tugs, ferries
Oil and gas activities
Retail activities
Shipyards and other companies
18 September 2009Ole Graa Jakobsen
Efficiency Optimisation
Page 3
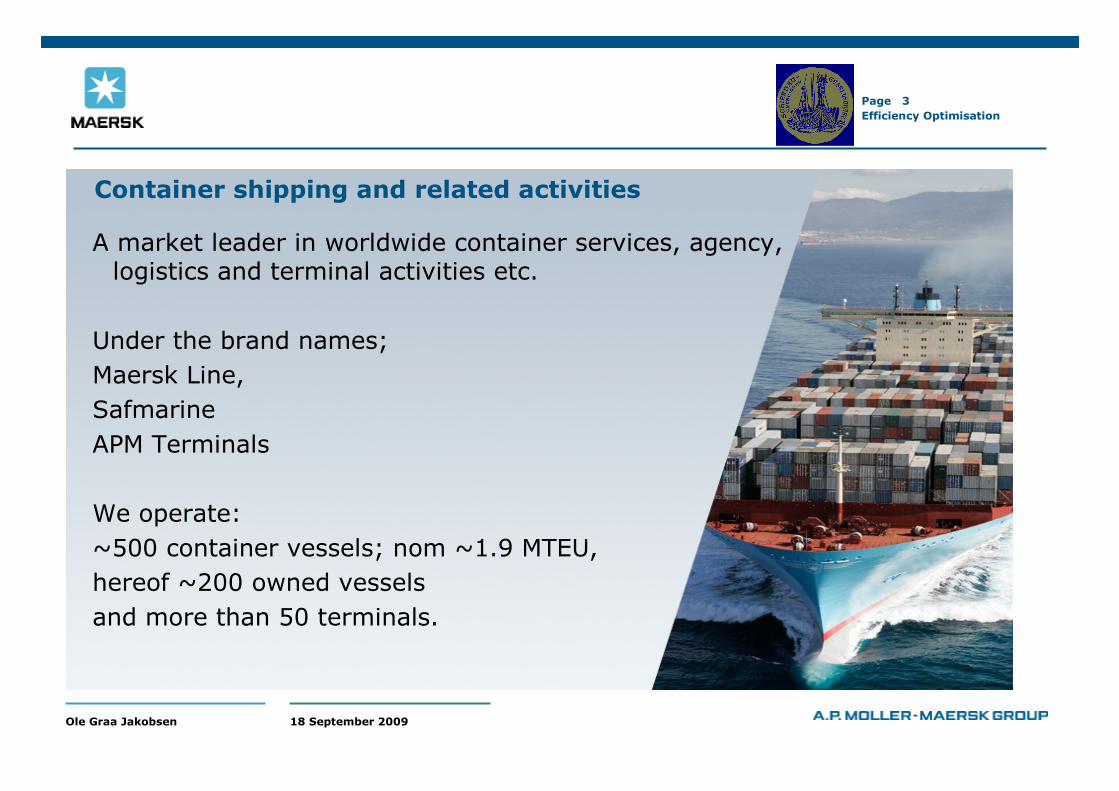
Container shipping and related activities
A market leader in worldwide container services, agency, logistics and terminal activities etc.
Under the brand names;
Maersk Line,
Safmarine
APM Terminals
We operate:
~500 container vessels; nom ~1.9 MTEU,
hereof ~200 owned vessels
and more than 50 terminals.
18 September 2009Ole Graa Jakobsen
Efficiency Optimisation
Page 4
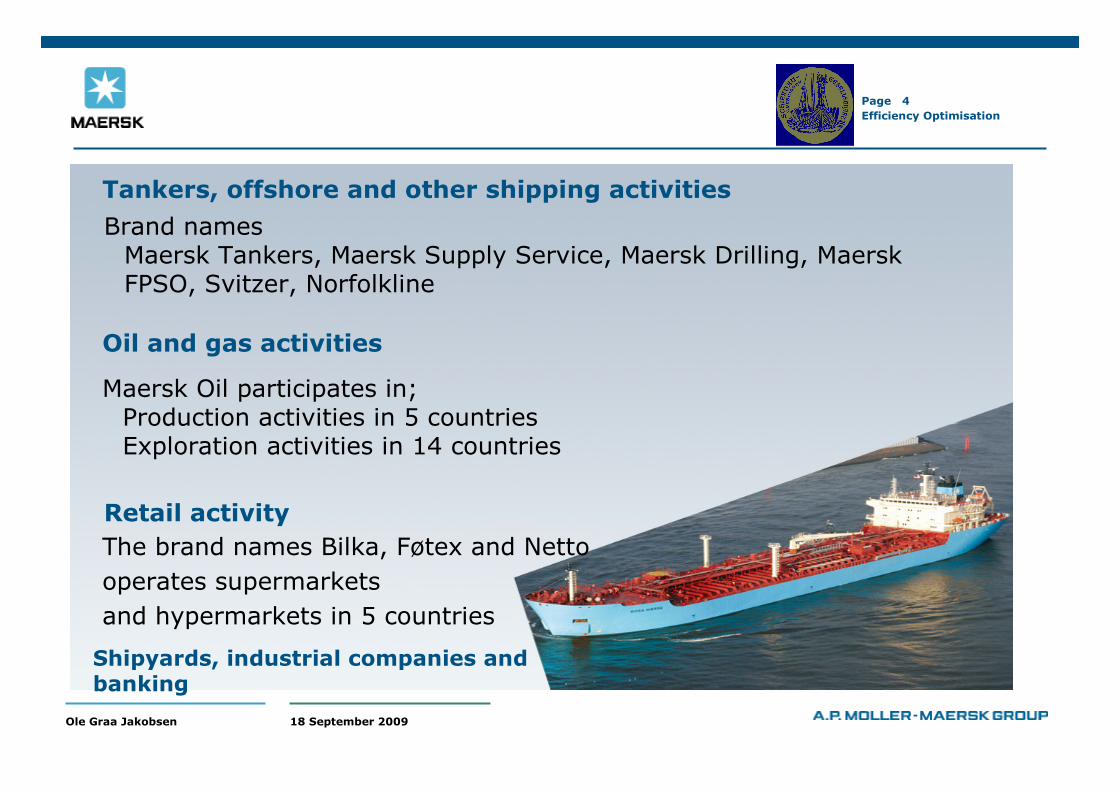
Tankers, offshore and other shipping activities
Brand names Maersk Tankers, Maersk Supply Service, Maersk Drilling, MaerskFPSO, Svitzer, Norfolkline
Oil and gas activities
Maersk Oil participates in; Production activities in 5 countriesExploration activities in 14 countries
Retail activity
The brand names Bilka, Føtex and Netto
operates supermarkets
and hypermarkets in 5 countries
Shipyards, industrial companies and banking
18 September 2009Ole Graa Jakobsen
Efficiency Optimisation
Page 5
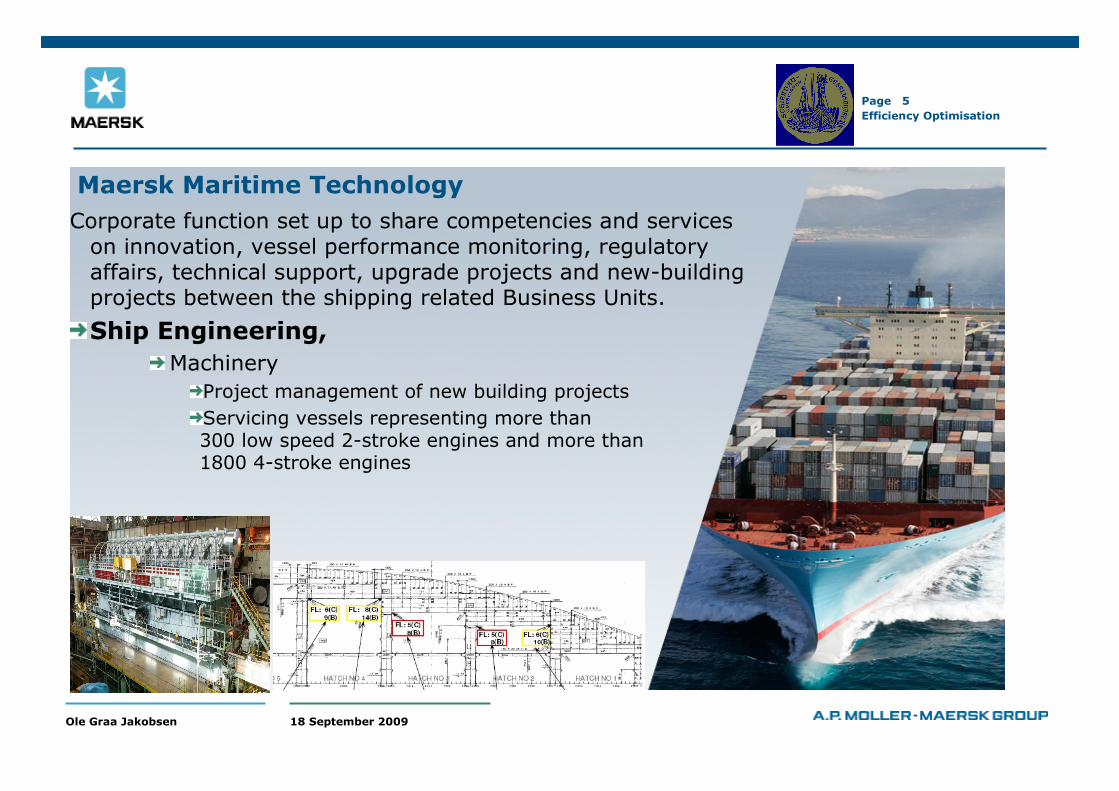
Maersk Maritime Technology
Corporate function set up to share competencies and services on innovation, vessel performance monitoring, regulatoryaffairs, technical support, upgrade projects and new-buildingprojects between the shipping related Business Units.
Ship Engineering,
Machinery
Project management of new building projects
Servicing vessels representing more than 300 low speed 2-stroke engines and more than 1800 4-stroke engines
18 September 2009Ole Graa Jakobsen
Efficiency Optimisation
Page 6
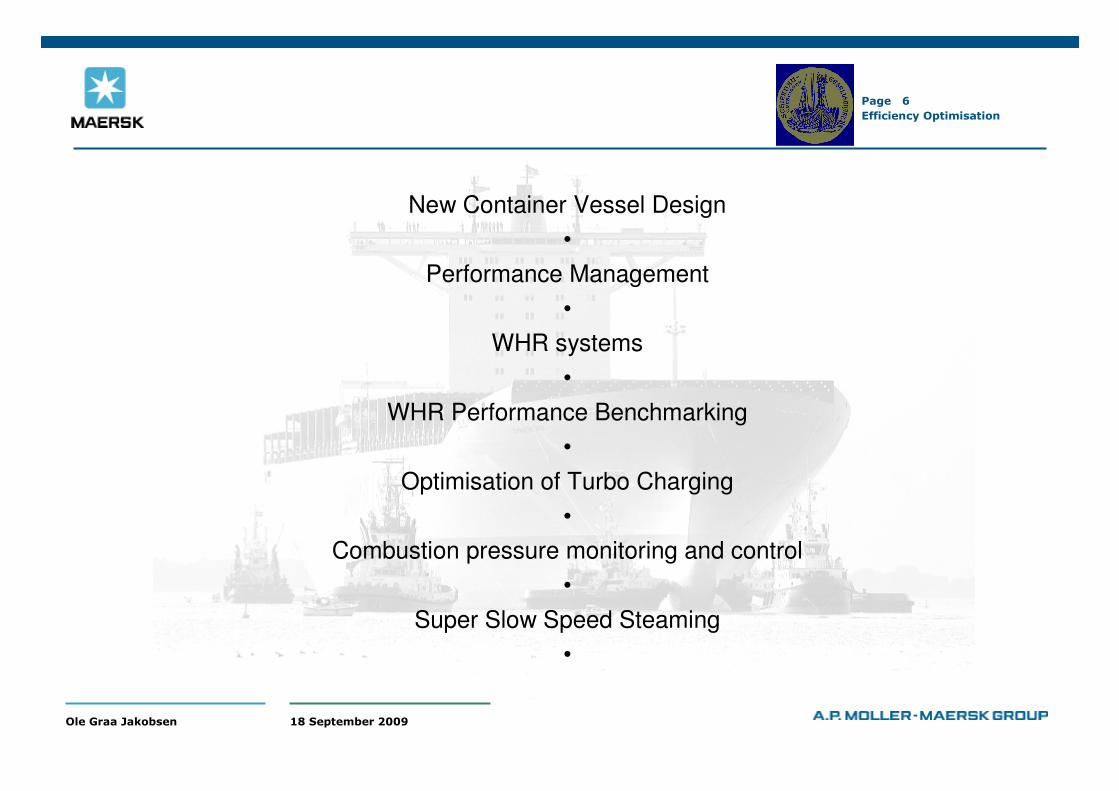
New Container Vessel Design
•
Performance Management
•
WHR systems
•
WHR Performance Benchmarking
•
Optimisation of Turbo Charging
•
Combustion pressure monitoring and control
•
Super Slow Speed Steaming
•
18 September 2009Ole Graa Jakobsen
Efficiency Optimisation
Page 7
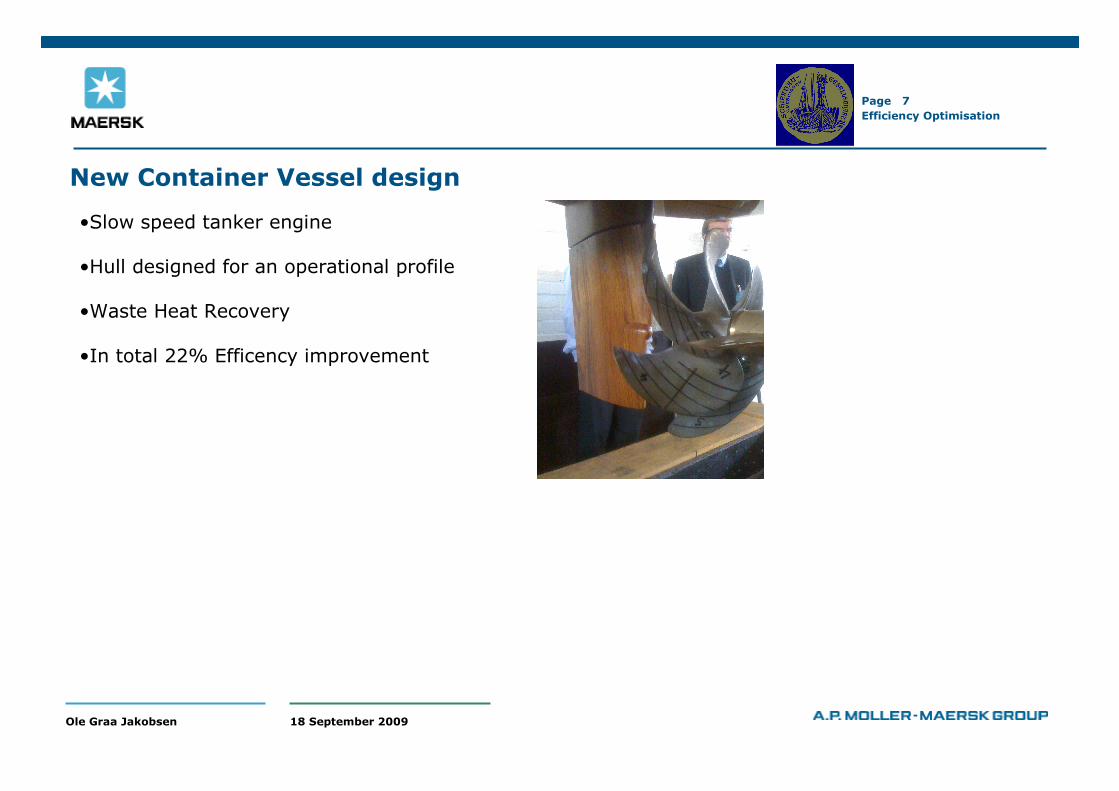
New Container Vessel design
•Slow speed tanker engine
•Hull designed for an operational profile
•Waste Heat Recovery
•In total 22% Efficency improvement
18 September 2009Ole Graa Jakobsen
Efficiency Optimisation
Page 8
Wärtsilä Graphics
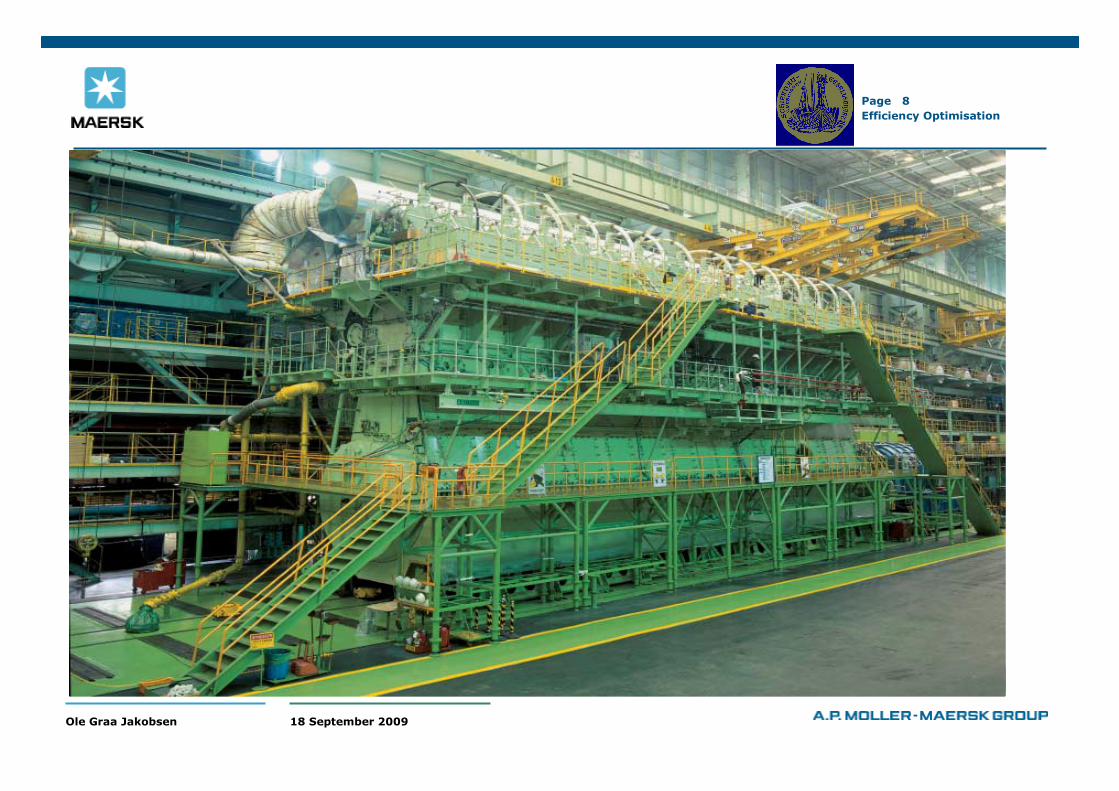
The Energy flow of a 2-stroke Main Engine
WHR
System
18 September 2009Ole Graa Jakobsen
Efficiency Optimisation
Page 9
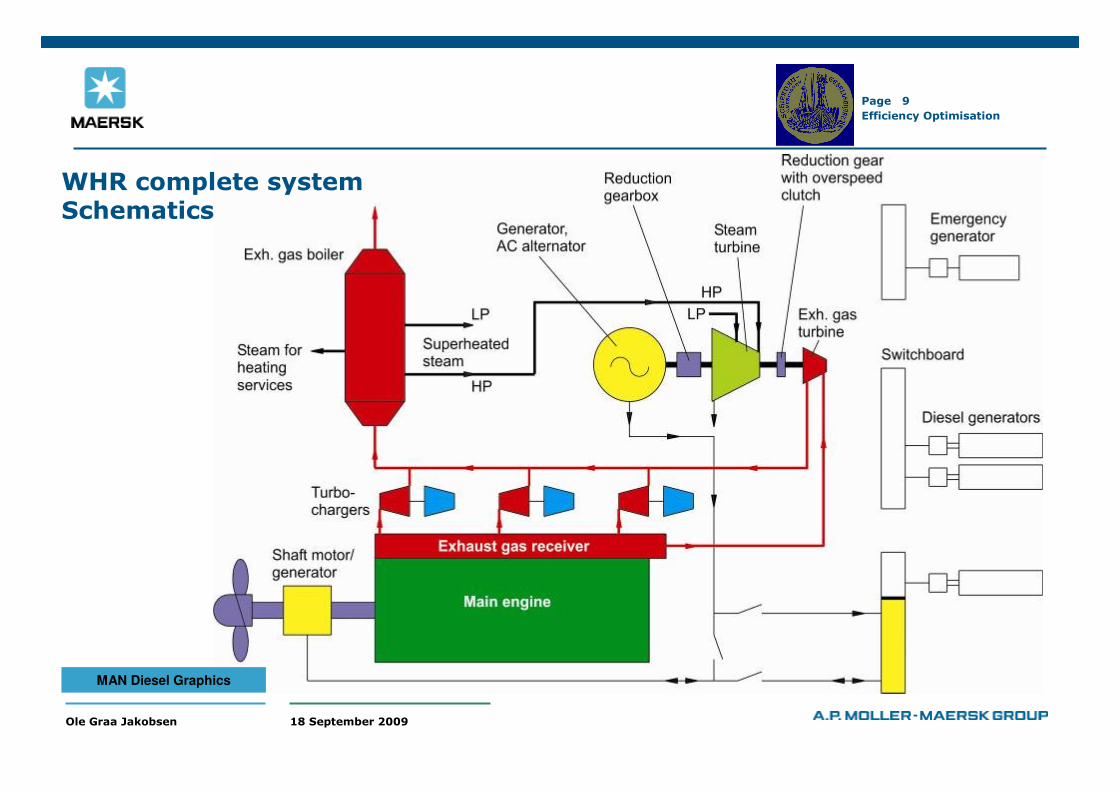
WHR complete system Schematics
MAN Diesel Graphics
18 September 2009Ole Graa Jakobsen
Efficiency Optimisation
Page 10
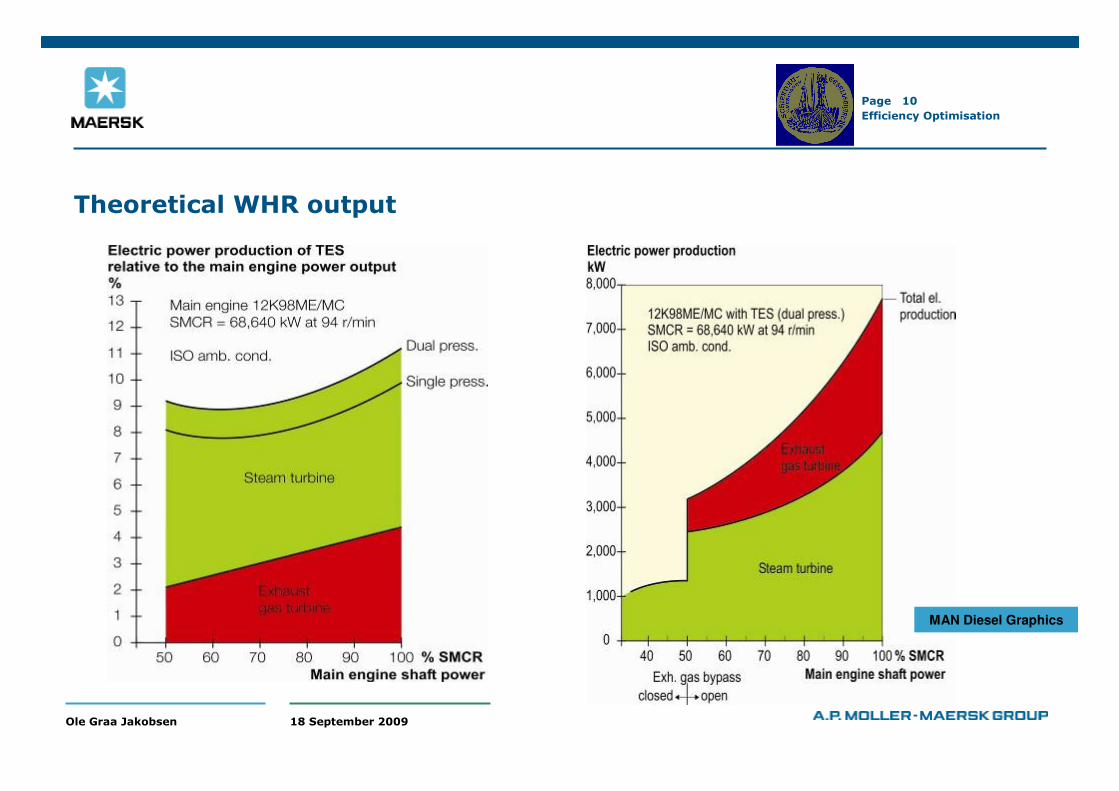
Theoretical WHR output
MAN Diesel Graphics
18 September 2009Ole Graa Jakobsen
Efficiency Optimisation
Page 11
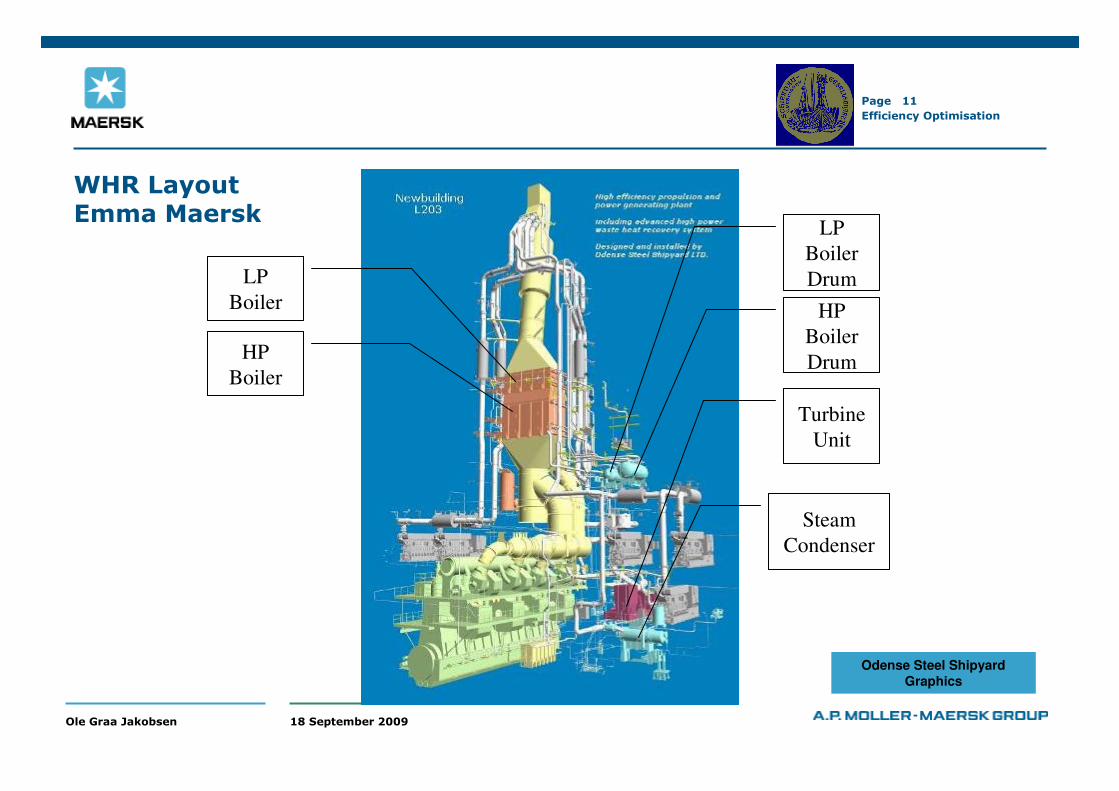
WHR LayoutEmma Maersk
LP
Boiler
HP
Boiler
LP
Boiler
Drum
HP
Boiler
Drum
Turbine
Unit
Steam
Condenser
Odense Steel Shipyard
Graphics
18 September 2009Ole Graa Jakobsen
Efficiency Optimisation
Page 12
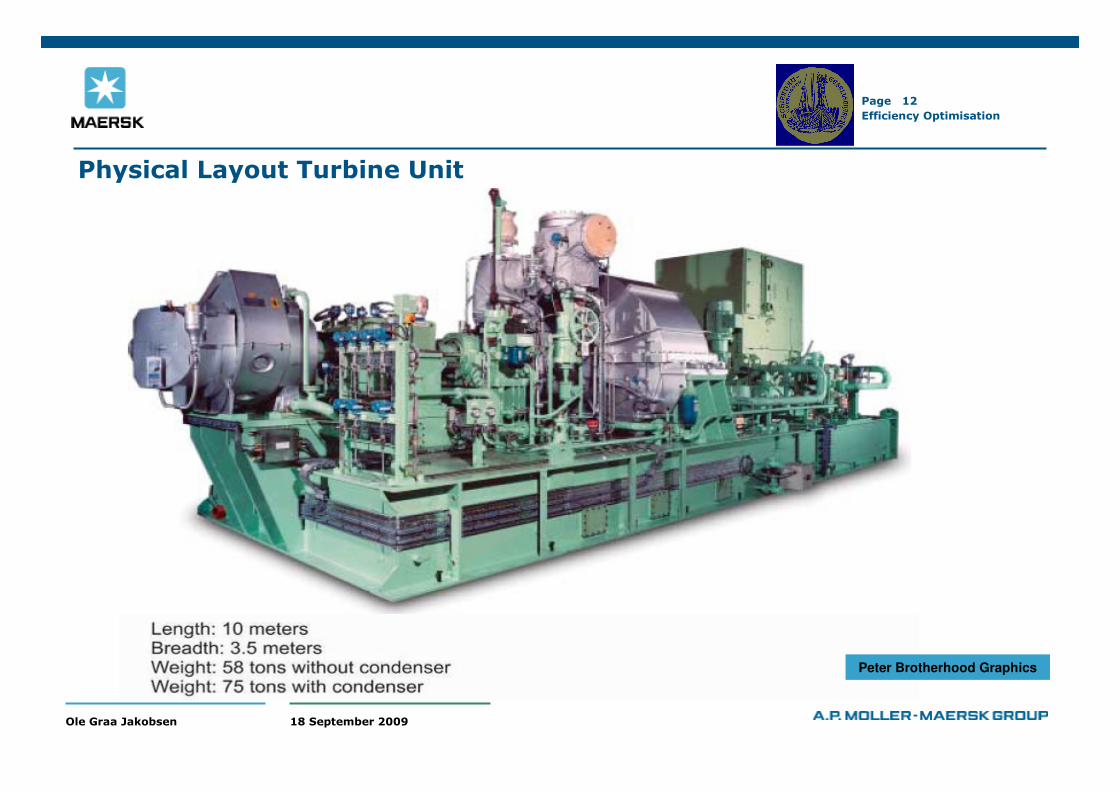
Physical Layout Turbine Unit
Peter Brotherhood Graphics
18 September 2009Ole Graa Jakobsen
Efficiency Optimisation
Page 13
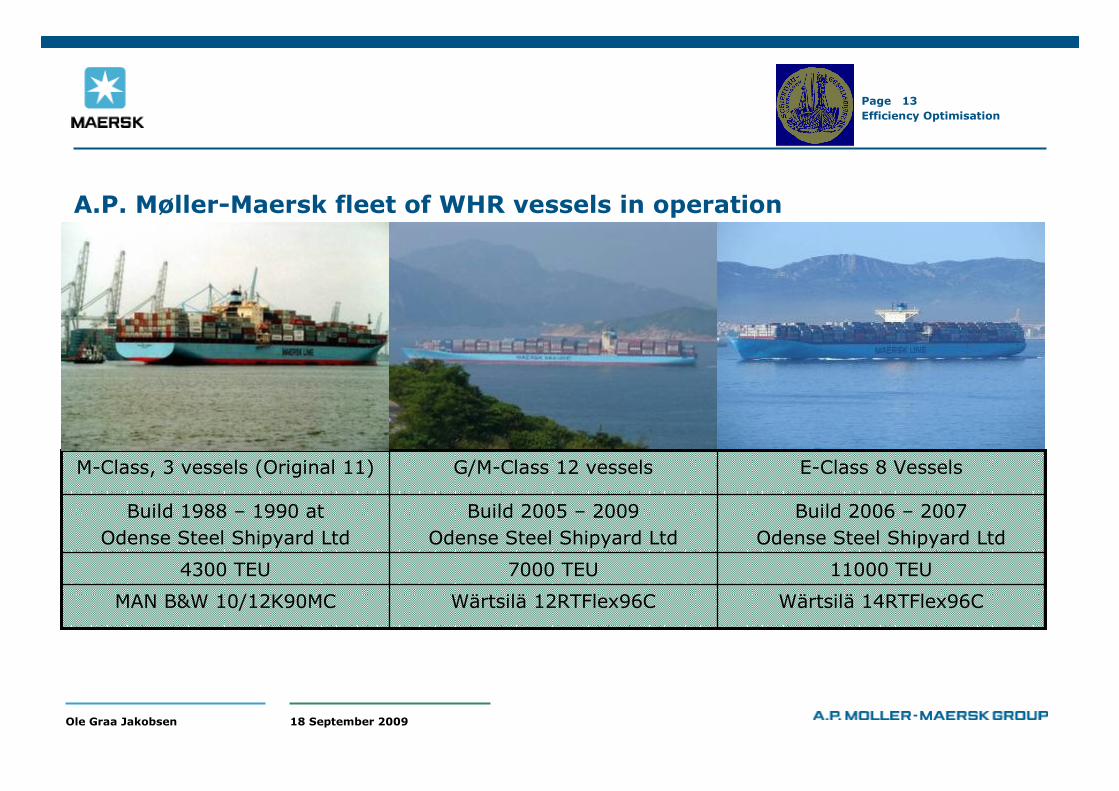
A.P. Møller-Maersk fleet of WHR vessels in operation
Wärtsilä 14RTFlex96CWärtsilä 12RTFlex96CMAN B&W 10/12K90MC
11000 TEU7000 TEU4300 TEU
Build 2006 – 2007
Odense Steel Shipyard Ltd
Build 2005 – 2009
Odense Steel Shipyard Ltd
Build 1988 – 1990 at
Odense Steel Shipyard Ltd
E-Class 8 VesselsG/M-Class 12 vesselsM-Class, 3 vessels (Original 11)
18 September 2009Ole Graa Jakobsen
Efficiency Optimisation
Page 14
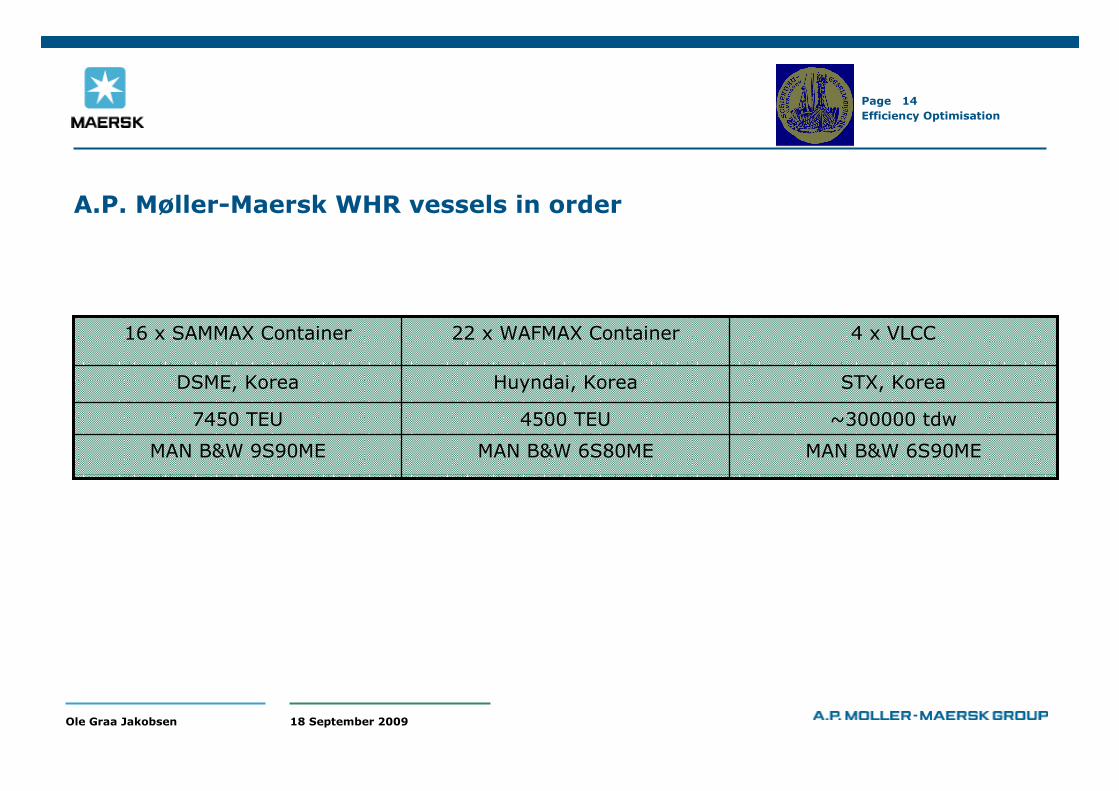
MAN B&W 6S90MEMAN B&W 6S80MEMAN B&W 9S90ME
~300000 tdw4500 TEU7450 TEU
STX, KoreaHuyndai, KoreaDSME, Korea
4 x VLCC22 x WAFMAX Container16 x SAMMAX Container
A.P. Møller-Maersk WHR vessels in order
18 September 2009Ole Graa Jakobsen
Efficiency Optimisation
Page 15
TC optimisation, internal parts
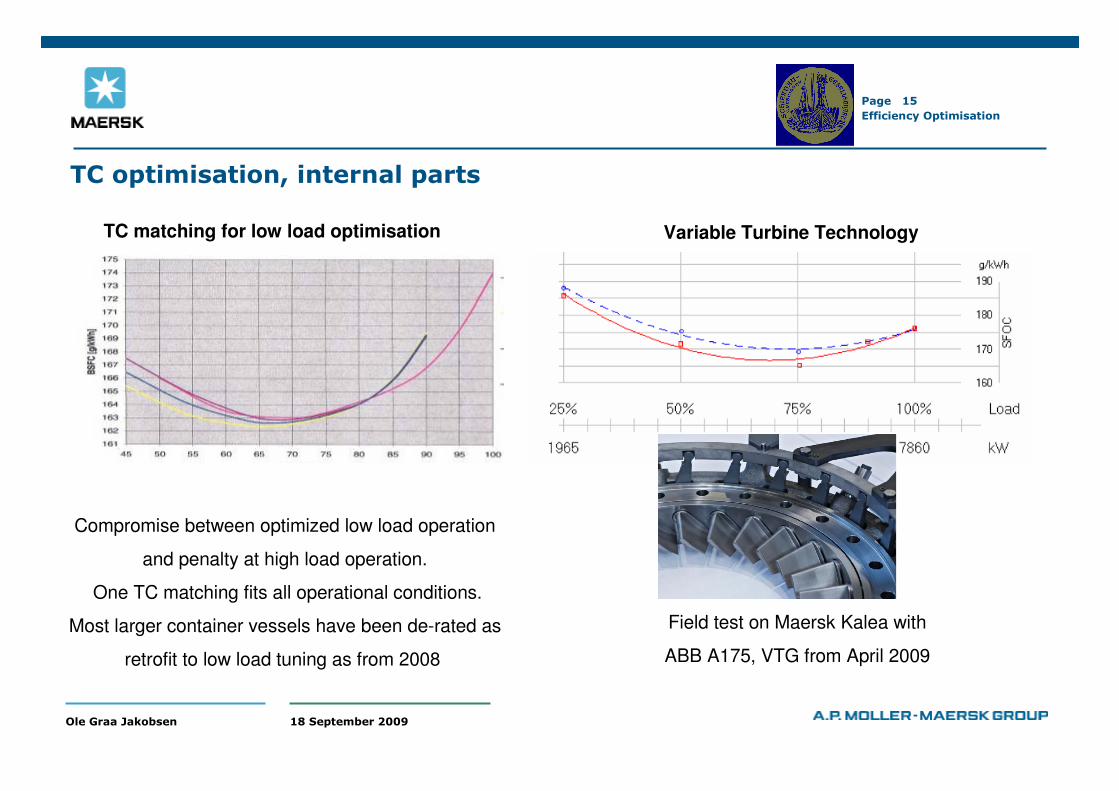
Variable Turbine TechnologyTC matching for low load optimisation
Field test on Maersk Kalea with
ABB A175, VTG from April 2009
Compromise between optimized low load operation
and penalty at high load operation.
One TC matching fits all operational conditions.
Most larger container vessels have been de-rated as
retrofit to low load tuning as from 2008
18 September 2009Ole Graa Jakobsen
Efficiency Optimisation
Page 16
TC optimisation, external parts
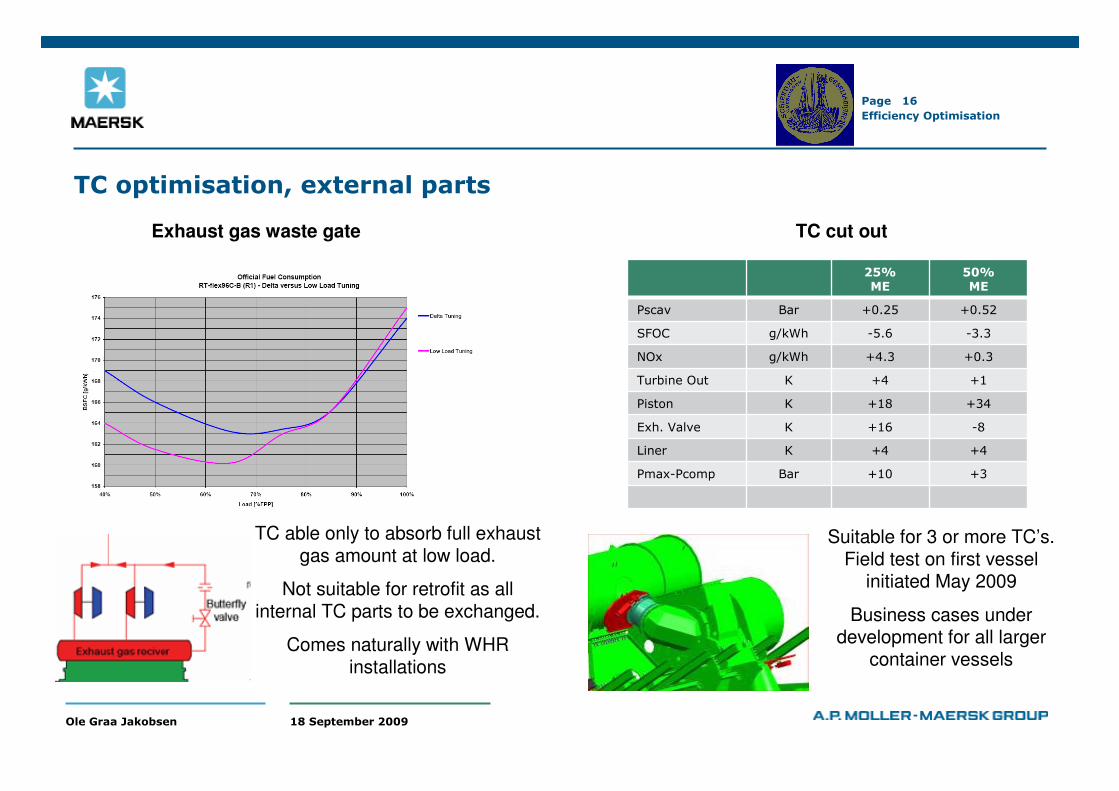
Exhaust gas waste gate
TC able only to absorb full exhaust gas amount at low load.
Not suitable for retrofit as all internal TC parts to be exchanged.
Comes naturally with WHR installations
TC cut out
Suitable for 3 or more TC’s. Field test on first vessel
initiated May 2009
Business cases under development for all larger
container vessels
25%ME
50%ME
Pscav Bar +0.25 +0.52
SFOC g/kWh -5.6 -3.3
NOx g/kWh +4.3 +0.3
Turbine Out K +4 +1
Piston K +18 +34
Exh. Valve K +16 -8
Liner K +4 +4
Pmax-Pcomp Bar +10 +3
18 September 2009Ole Graa Jakobsen
Efficiency Optimisation
Page 17
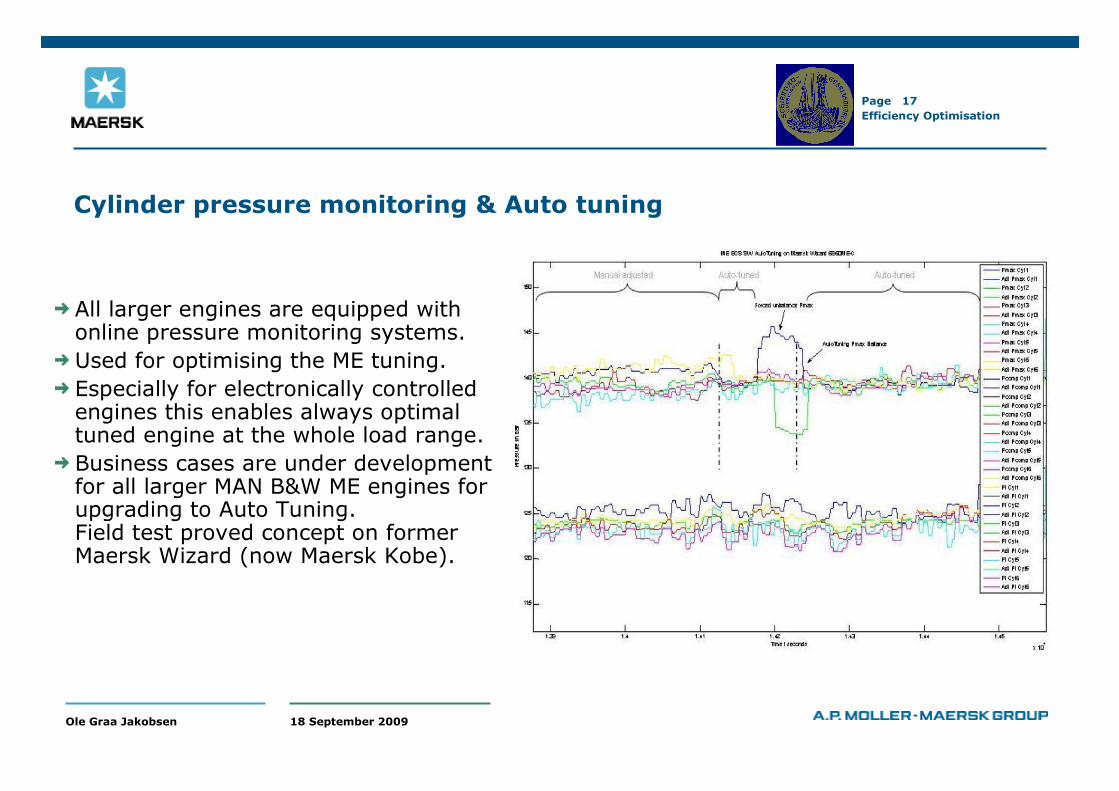
Cylinder pressure monitoring & Auto tuning
All larger engines are equipped with online pressure monitoring systems.
Used for optimising the ME tuning.
Especially for electronically controlled engines this enables always optimal tuned engine at the whole load range.
Business cases are under development for all larger MAN B&W ME engines for upgrading to Auto Tuning. Field test proved concept on former Maersk Wizard (now Maersk Kobe).
18 September 2009Ole Graa Jakobsen
Efficiency Optimisation
Page 18
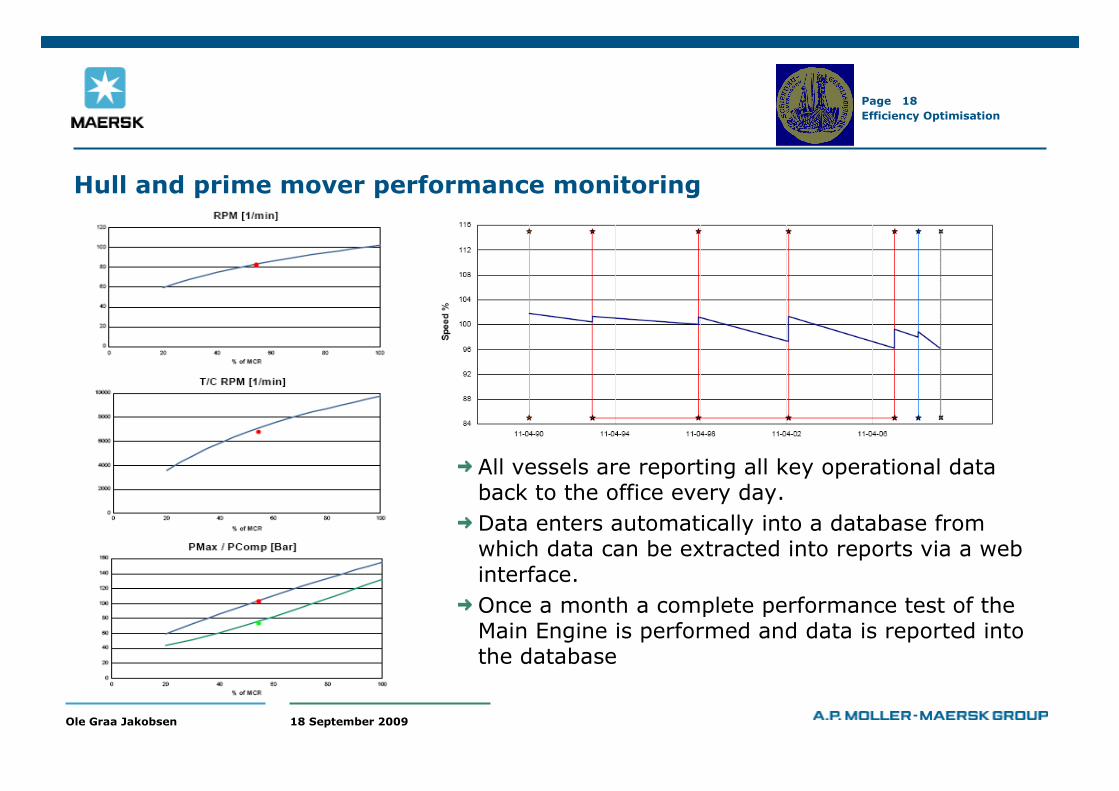
Hull and prime mover performance monitoring
All vessels are reporting all key operational data back to the office every day.
Data enters automatically into a database from which data can be extracted into reports via a web interface.
Once a month a complete performance test of the Main Engine is performed and data is reported into the database
18 September 2009Ole Graa Jakobsen
Efficiency Optimisation
Page 19
WHR Efficiency…effect of Benchmarking
0%
20%
40%
60%
80%
100%
V1 V2 V3 V4 V5 V6 Average
WH
R E
ffic
ien
cy
Before BM
After BM
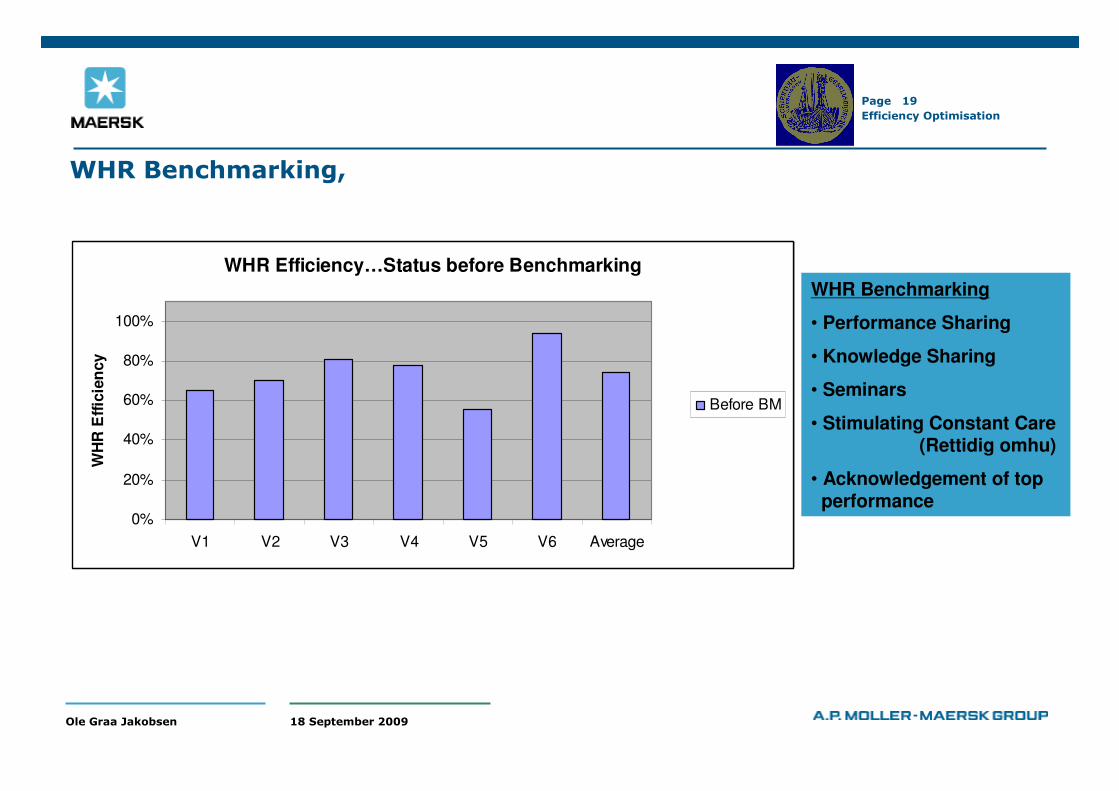
WHR Benchmarking,
WHR Efficiency…Status before Benchmarking
0%
20%
40%
60%
80%
100%
V1 V2 V3 V4 V5 V6 Average
WH
R E
ffic
ien
cy
Before BM
WHR Benchmarking
• Performance Sharing
• Knowledge Sharing
• Seminars
• Stimulating Constant Care(Rettidig omhu)
• Acknowledgement of top performance
18 September 2009Ole Graa Jakobsen
Efficiency Optimisation
Page 20
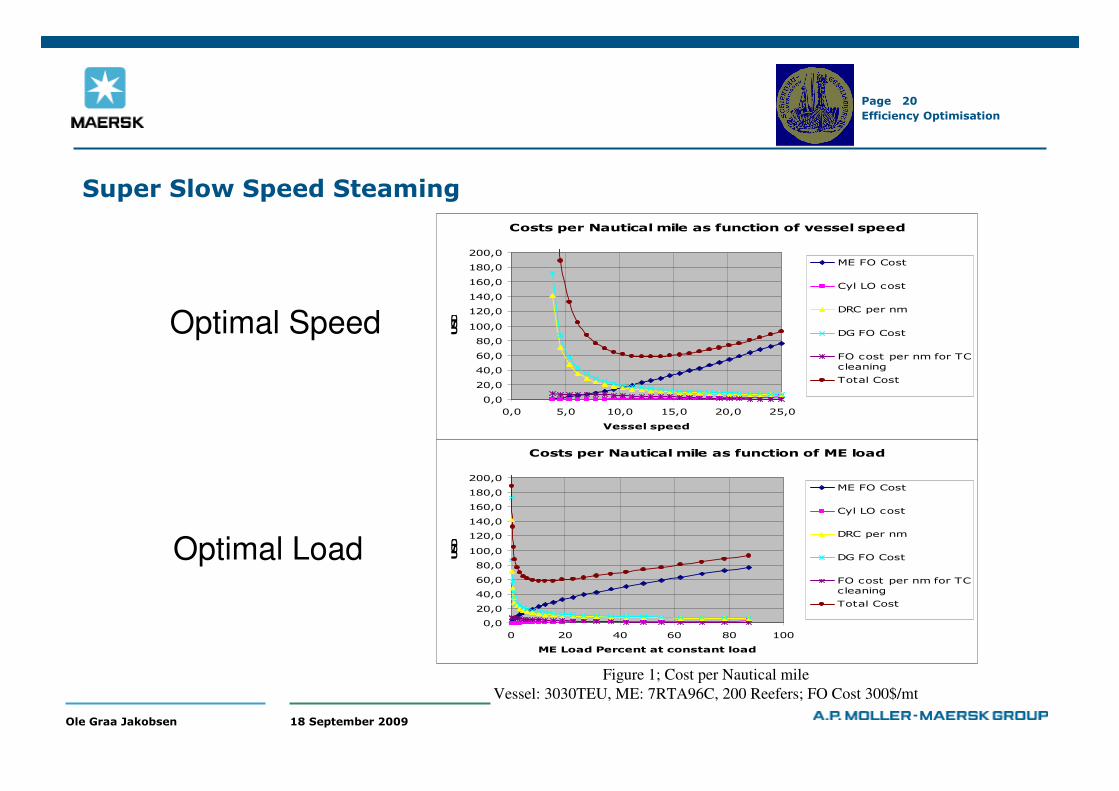
Super Slow Speed Steaming
Costs per Nautical mile as function of vessel speed
0,0
20,0
40,0
60,0
80,0
100,0
120,0
140,0
160,0
180,0
200,0
0,0 5,0 10,0 15,0 20,0 25,0
Vessel speed
USD
ME FO Cost
Cyl LO cost
DRC per nm
DG FO Cost
FO cost per nm for TC
cleaning
Total Cost
Costs per Nautical mile as function of ME load
0,0
20,0
40,0
60,0
80,0
100,0
120,0
140,0
160,0
180,0
200,0
0 20 40 60 80 100
ME Load Percent at constant load
USD
ME FO Cost
Cyl LO cost
DRC per nm
DG FO Cost
FO cost per nm for TC
cleaning
Total Cost
Figure 1; Cost per Nautical mile
Vessel: 3030TEU, ME: 7RTA96C, 200 Reefers; FO Cost 300$/mt
Optimal Speed
Optimal Load
18 September 2009Ole Graa Jakobsen
Efficiency Optimisation
Page 21
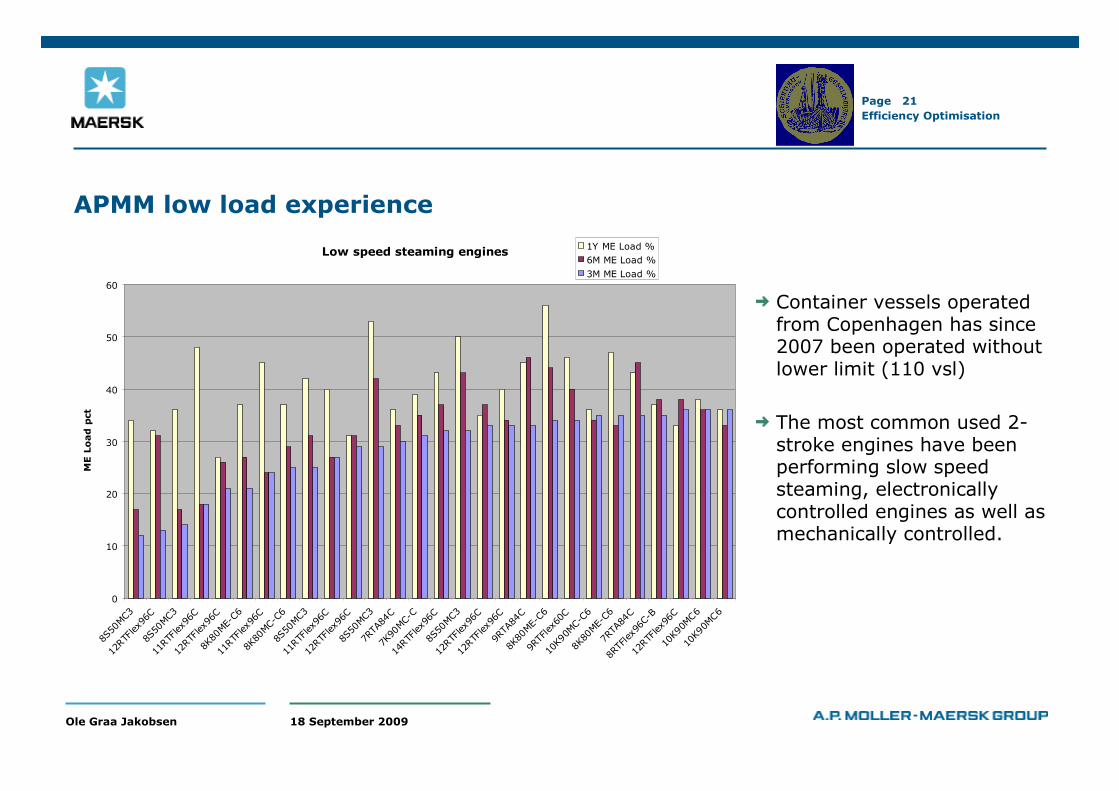
APMM low load experience
Container vessels operated from Copenhagen has since 2007 been operated without lower limit (110 vsl)
The most common used 2-stroke engines have been performing slow speed steaming, electronically controlled engines as well as mechanically controlled.
Low speed steaming engines
0
10
20
30
40
50
60
8S50
MC3
12RTF
lex9
6C8S
50MC3
11RTF
lex9
6C
12RTF
lex9
6C
8K80
ME-
C6
11RTF
lex9
6C
8K80
MC-C
68S
50MC3
11RTF
lex9
6C
12RTF
lex9
6C8S
50MC3
7RTA
84C
7K90
MC-C
14RTF
lex9
6C8S
50MC3
12RTF
lex9
6C
12RTF
lex9
6C9R
TA84
C
8K80
ME-
C6
9RTF
lex6
0C
10K90M
C-C
6
8K80
ME-
C6
7RTA
84C
8RTF
lex9
6C-B
12RTF
lex9
6C10
K90M
C6
10K90M
C6
ME L
oad
pct
1Y ME Load %
6M ME Load %
3M ME Load %
18 September 2009Ole Graa Jakobsen
Efficiency Optimisation
Page 22
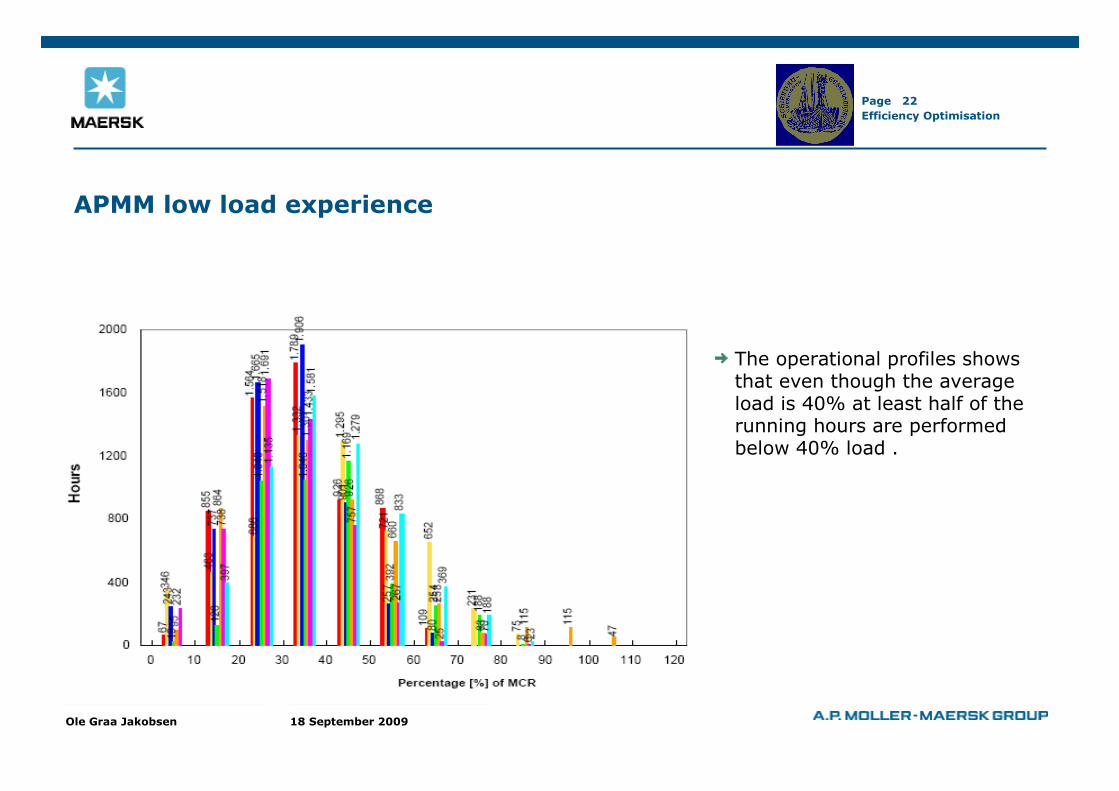
APMM low load experience
The operational profiles shows that even though the average load is 40% at least half of the running hours are performed below 40% load .
18 September 2009Ole Graa Jakobsen
Efficiency Optimisation
Page 23
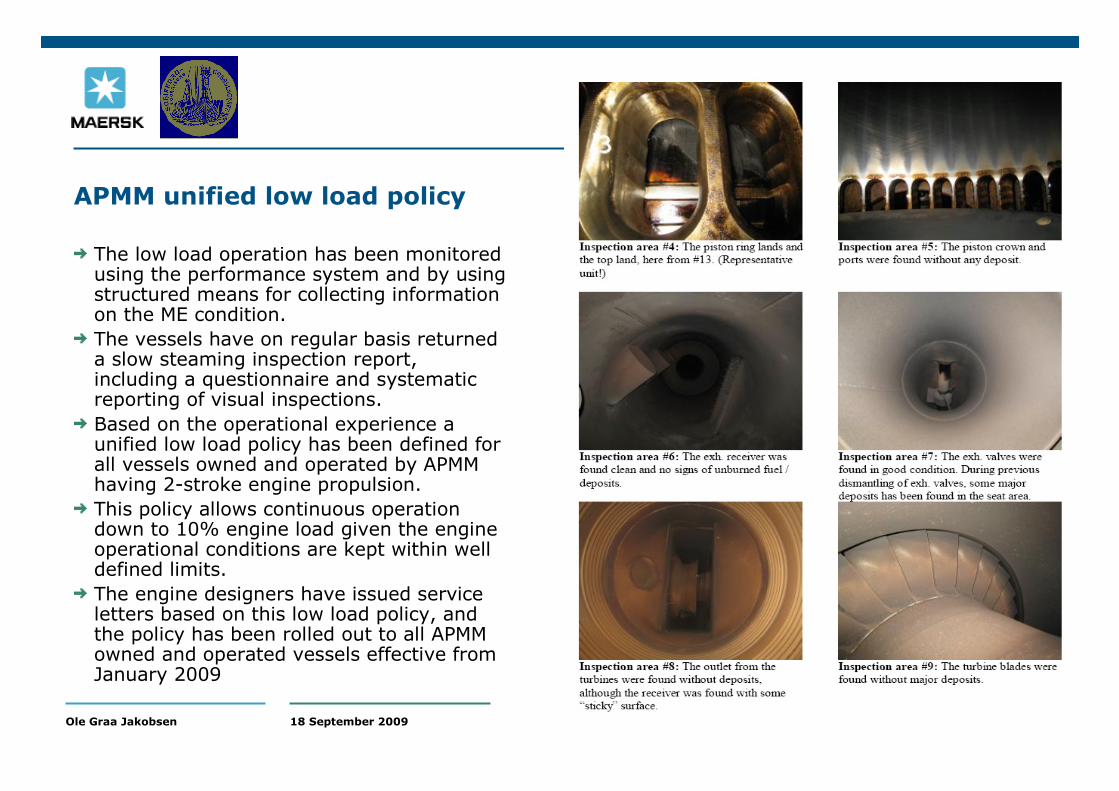
APMM unified low load policy
The low load operation has been monitored using the performance system and by using structured means for collecting information on the ME condition.
The vessels have on regular basis returned a slow steaming inspection report, including a questionnaire and systematic reporting of visual inspections.
Based on the operational experience a unified low load policy has been defined for all vessels owned and operated by APMM having 2-stroke engine propulsion.
This policy allows continuous operation down to 10% engine load given the engine operational conditions are kept within well defined limits.
The engine designers have issued service letters based on this low load policy, and the policy has been rolled out to all APMM owned and operated vessels effective from January 2009
18 September 2009Ole Graa Jakobsen
Efficiency Optimisation
Page 24
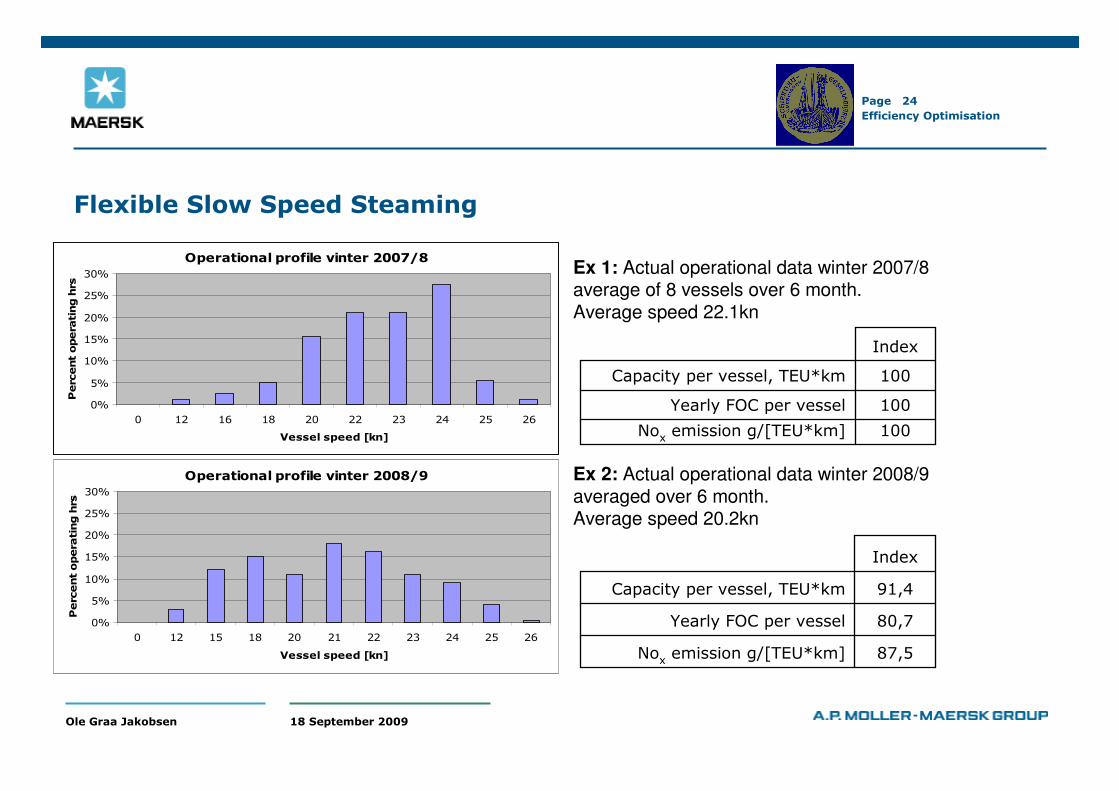
Flexible Slow Speed Steaming
Operational profile vinter 2007/8
0%
5%
10%
15%
20%
25%
30%
0 12 16 18 20 22 23 24 25 26
Vessel speed [kn]
Perc
ent
opera
ting h
rs
Operational profile vinter 2008/9
0%
5%
10%
15%
20%
25%
30%
0 12 15 18 20 21 22 23 24 25 26
Vessel speed [kn]
Perc
ent
opera
ting h
rs
100Noxemission g/[TEU*km]
100Yearly FOC per vessel
100Capacity per vessel, TEU*km
Index
87,5Noxemission g/[TEU*km]
80,7Yearly FOC per vessel
91,4Capacity per vessel, TEU*km
Index
Ex 1: Actual operational data winter 2007/8 average of 8 vessels over 6 month.Average speed 22.1kn
Ex 2: Actual operational data winter 2008/9 averaged over 6 month.Average speed 20.2kn
18 September 2009Ole Graa Jakobsen
Efficiency Optimisation
Page 25
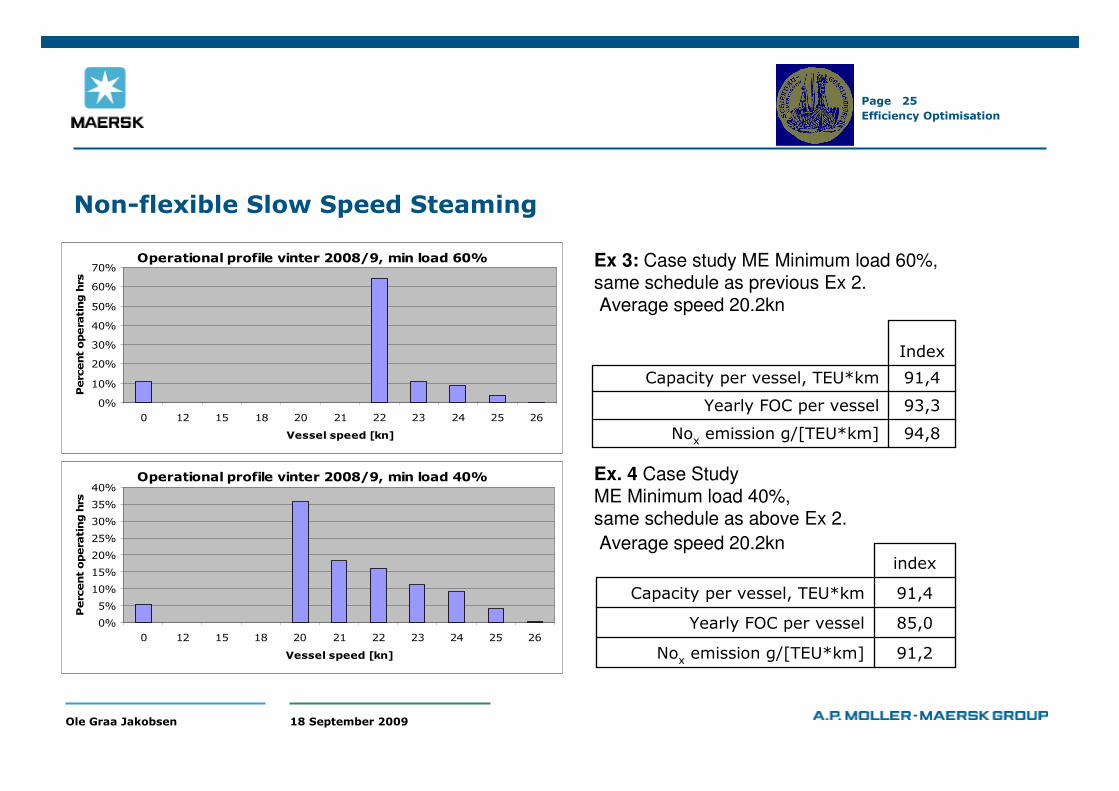
Non-flexible Slow Speed Steaming
Operational profile vinter 2008/9, min load 60%
0%
10%
20%
30%
40%
50%
60%
70%
0 12 15 18 20 21 22 23 24 25 26
Vessel speed [kn]
Perc
ent
opera
ting h
rs
Operational profile vinter 2008/9, min load 40%
0%
5%
10%
15%
20%
25%
30%
35%
40%
0 12 15 18 20 21 22 23 24 25 26
Vessel speed [kn]
Perc
ent
opera
ting h
rs
Ex 3: Case study ME Minimum load 60%, same schedule as previous Ex 2.Average speed 20.2kn
94,8Noxemission g/[TEU*km]
93,3Yearly FOC per vessel
91,4Capacity per vessel, TEU*km
Index
91,2Noxemission g/[TEU*km]
85,0Yearly FOC per vessel
91,4Capacity per vessel, TEU*km
index
Ex. 4 Case StudyME Minimum load 40%, same schedule as above Ex 2.
Average speed 20.2kn
18 September 2009Ole Graa Jakobsen
Efficiency Optimisation
Page 26
ThankThank youyou for for youryour attentionattention