Embed Size (px)
Citation preview

Journal of Asian Scientific Research, 2013, 3(4):381-395
381
EFFICIENCY OF SVM AND PCA TO ENHANCE INTRUSION DETECTION
SYSTEM
Soukaena Hassan Hashem
Computer Science Department, University of Technology, Baghdad-Iraq
ABSTRACT
Intrusion detection system (IDS) is a system that gathers and analyzes information from various
areas within a computer or a network to identify attacks made against these components. This
research proposed an Intrusion Detection Model (IDM) for detection intrusion attempts, the
proposal is a hybrid IDM because it considers both features of network packets and host features
that are sensitive to most intrusions. The dataset used to build the hybrid IDM is the proposed
HybD (Hybrid Dataset) dataset which composed of the 10% KDD '99 dataset features (41) and
suggested host-based features (3). Two Data Mining DM classifiers (Support Vector Machine
(SVM)) classifier and Naïve Bayesian (NB) Classifier) are used to build and verify the validity of
the proposed model in term of accuracy rate. The proposal trying to ensure the detection speed of
the hybrid IDM, that by reducing the HybD dataset features used by considering the most critical
features in the detection but with saving of high accuracy rate without degradation that may be
caused by that reduction. Two different measures are used for selecting and ranking HybD dataset
features; they are Principle Component Analysis (PCA) and Gain Ratio (GR). The sets of feat ures
that have been resulted from these two measures and the all features set will be the feeding of both
SVM and NB. The results obtained from executing the proposed model showing that SVM classifier
accuracy rate is generally higher than that of NB classifier with the three sets of features. With
SVM classifier the best accuracy rate resulted with set of features selected by PCA. The most
critical features obtained by PCA are ranging to (17) features from 44 features: three of the
suggested host features and (14) of the 10% KDD'99 features.
Keywords: SVM, NB, PCA, IDS, GR.
INTRODUCTION
An intrusion is a very common threat to computer systems. It is defined to be any unauthorized
access attempt to manipulate, modify, or destroy information, or to render a system unreliable or
unusable. With the increasing creativity of intrusions, the development of effective IDS is
Journal of Asian Scientific Research
journal homepage: http://aessweb.com/journal-detail.php?id=5003

Journal of Asian Scientific Research, 2013, 3(4):381-395
382
becoming a greater challenge. ID is a set of techniques and methods that are used to detect
suspicious activity in computer systems, both at network and host level. Therefore, the main goal of
IDS is to identify unauthorized use, misuse, and external penetrations (Mohammed, 2006).
DM-based ID techniques generally fall into two main categories: misuse detection and anomaly
detection. In misuse detection systems, use patterns of well-known attacks to match and identify
known intrusion. These techniques are able to automatically retrain ID models on different input
data that include new types of attacks, as long as they have been labeled appropriately. Unlike
signature-based IDSs, models of misuse are created automatically, and can be more sophisticated
and precise than manually created signatures. A base stone of misuse detection techniques strength
is their high degree of Precision in detecting known attacks and their variations. Misuse detection
techniques in general are not effective contra new attacks that have no matched ru les or models yet.
Anomaly detection, on the other hand, builds models of normal behavior, and flags observed
activities that deviate significantly from the established normal usage profiles as anomalies, that is,
possible intrusions. Anomaly detection techniques thus identify new types of intrusions as
diversions from usual usage. Anomaly detection techniques can be effective contra unknown or
new attacks since no a priori knowledge about fixed intrusions are required. However, anomaly -
based IDSs tend to generate more false alarms than misuse-based IDSs because an anomaly can
just be a new normal behavior. Some IDSs use both anomaly and misuse detection techniques
(Moses et al., 2008).
Related Works
In (Risto, 2009), Risto Vaarandi, proposed a novel unsupervised DM based approach for IDS alert
classification. With this strategy, knowledge is mined from IDS logs and processed in an automated
way, in order to build an caution classifier. The classifier is then used in real-time for discerning
important IDS warns from frequently occurring false positives and events of low significance. In
(Risto and Karlis, 2010), Risto Vaarandi, and Karlis Podinš. extended their previous work on IDS
alert classification, and present a novel unsupervised real time alert classification method which is
based on frequent itemset mining and data clustering techniques. Their method first applies a
frequent itemset mining algorithm to past IDS alert logs, in order to discover patterns that describe
redundant alerts. After that, data clustering methods are used for finding detailed subpatterns for
each detected pattern. Finally, the detected knowledge is explained and used for real time
classification of IDS alerts, in order to characterize critical alerts from irrelevant ones. In (Muamer
et al., 2011), Muamer N. Mohammad et al introduced an improved approach for IDS based on
combining DM and expert system that is presented and implemented in WEKA (Waikato
Environment for Knowledge Analysis). They aimed to design and develop intelligent DM IDS and
its core part a composite detection engine with anomaly detection and misuse detection features
and the two detection engines work serially to detect the user's activity in turn. The system collects
the data of DB audit system in real time, analyzes the audit data, judges that it is a normal behavior,
abnormal behavior or aggressive behavior and responds to the result obtained by the operation

Journal of Asian Scientific Research, 2013, 3(4):381-395
383
behavior and finally reports the result to the manager in a comprehensible form. In (Zhang et al.,
2011), the next generation Internet protocol IPv6 brings a new challenge to the information
security. Zhang Guojun et al presented a cooperative IDS based on IPv6 to address this challenge.
Such a system consists of four parts: data flow tracking and analysis, capturing packets and rules
matching, disaster recovery, and blocking. The technique of cooperative ID is introduced into the
system for realizing the coordination control among parts. The system has a perfect detection
rating. In (Sufyan and Hadeel, 2011), Sufyan T. Al-Janabi and Hadeel A. Saeed proposed an
anomaly based IDS that can promptly detect and classify various attacks. Anomaly -based IDSs
need to be able to learn the unstable behavior of users or systems. The proposed IDS experimenting
with packet behavior as parameters in anomaly ID. There are several methods to assist IDSs to
learn system's behavior, the proposed IDS uses a back propagation artificial neural network (ANN)
to learn system's behavior and uses the KDD CUP'99 dataset in its experiments and the obtained
results satisfy the work objective. In (Hassina Bensefia, 2011), Hassina Bensefia and Nacira
Ghoualmi proposed a new approach for IDS adaptability by oriented toward Evolving
COnnectionist Systems (ECOS) and Learning Classifier Systems (LCS). These two learning
machine approaches are actually suggested very suitable to build adaptive learning intelligent
systems in a dynamic changing environment. This integration puts in relief an adaptive hybrid ID
core that plants the adaptability as an intrinsic and native functionality in the IDS. In (Nur et al.,
2012), Haldar N. et al presented an IDS which employs usage of classification methods to model
the usage patterns of authenticated users and uses it to detect intrusions in wireless networks. Th e
key idea behind the proposed IDS is the identification of discriminative features from user's activity
data and using them to identify intrusions in wireless networks. The detection module uses
statistical methods to accumulate interested statistical variables and compares them with the
thresholds derived from users activities data. When the variables exceed the predestined thresholds,
an alarm is put forward to alert about a sensible intrusion in the network.
The Proposed Model of Intrusion Detection System
The proposed IDS is a "hybrid IDS" (NIDS and HIDS) that because it consider all features of data
network packets and consider critical features of host that are directly affected by all attacks. The
proposal is a DM-based IDS in which both the misuse and anomaly detection techniques depended
in the detection of intrusion, where each instance in a dataset is labeled as "normal" or "intrusion"
and a learning algorithm is trained over the labeled data. Misuse technique is able to automatically
retrain ID models on different input data that include new types of attacks, as long as they have
been labeled appropriately. While anomaly technique should first learn the characteristics of
normal activities and abnormal activities of the system, and then the IDS detect traffic that deviate
from normal activities.
For training and testing of the proposed IDS a proposed dataset, named "HybD", will be used.
HybD dataset composed of: 1) "KDD'99 dataset" which represents the most wildly used dataset for
the evaluation of ID methods since 1999. This dataset is intended by Stolfo et al. and is built based
Journal of Asian Scientific Research, 2013, 3(4):381-395
384
on the data captured in DARPA’98 IDS evaluation program (KDD, 1999) Host-based features
combined with the KDD'99 dataset. This HybD dataset could be used in researches for designing
NIDSs, HIDSs, and hybrid IDSs. This new features are related to host and are used in conjunction
with the 41 features in order to be able to detect intrusion in host level as well as in network level.
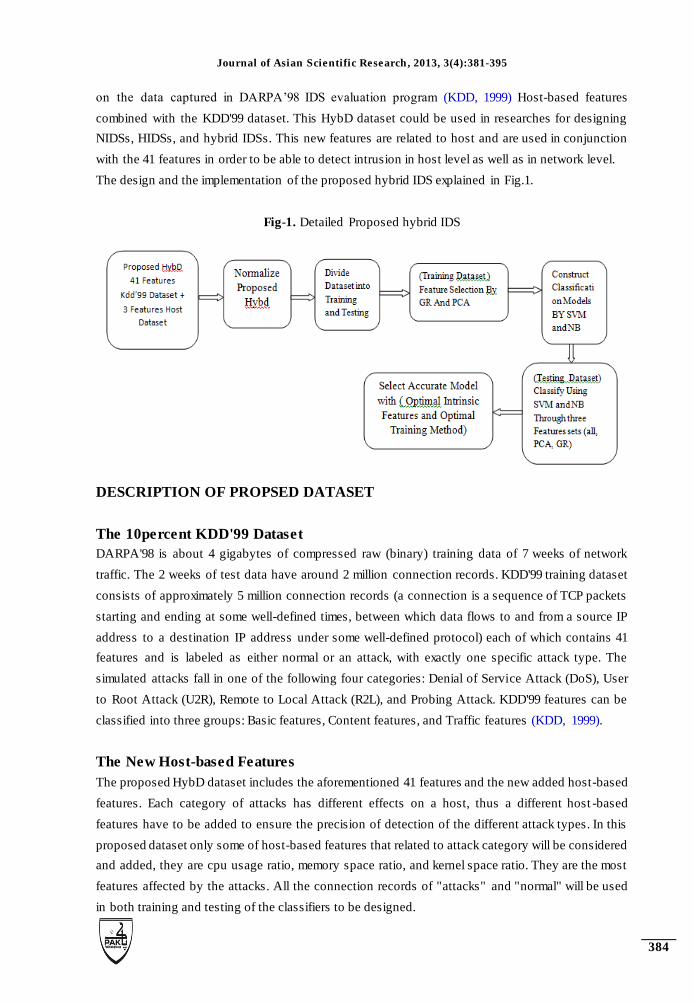
The design and the implementation of the proposed hybrid IDS explained in Fig.1.
Fig-1. Detailed Proposed hybrid IDS
DESCRIPTION OF PROPSED DATASET
The 10percent KDD'99 Dataset
DARPA'98 is about 4 gigabytes of compressed raw (binary) training data of 7 weeks of network
traffic. The 2 weeks of test data have around 2 million connection records. KDD'99 training dataset
consists of approximately 5 million connection records (a connection is a sequence of TCP packets
starting and ending at some well-defined times, between which data flows to and from a source IP
address to a destination IP address under some well-defined protocol) each of which contains 41
features and is labeled as either normal or an attack, with exactly one specific attack type. The
simulated attacks fall in one of the following four categories: Denial of Service Attack (DoS), User
to Root Attack (U2R), Remote to Local Attack (R2L), and Probing Attack. KDD'99 features can be
classified into three groups: Basic features, Content features, and Traffic features (KDD, 1999).
The New Host-based Features
The proposed HybD dataset includes the aforementioned 41 features and the new added host-based
features. Each category of attacks has different effects on a host, thus a different host -based
features have to be added to ensure the precision of detection of the different attack types. In this
proposed dataset only some of host-based features that related to attack category will be considered
and added, they are cpu usage ratio, memory space ratio, and kernel space ratio. They are the most
features affected by the attacks. All the connection records of "attacks" and "normal" will be used
in both training and testing of the classifiers to be designed.

Journal of Asian Scientific Research, 2013, 3(4):381-395
385
Preprocessing on the Proposed HybD Dataset
The following processes have been applied to the "proposed HybD dataset" before it being used in
design of the proposed system:
1. Converting the original KDD'99 10percent dataset from a text file to SQL server.
2. Adding of new host-based features to construct the proposed HybD dataset and adding
their values.
3. Since type of some of HybD dataset's features is continuous, t hus a process for
normalization these features have been done in order to become of categorical type so it becomes
more convenient with the used DM classification algorithms.
4. The resulted dataset from process three will be split into two distinct datase ts by using,
one for classifiers' training which equal of resulted dataset from process three and the other for
classifiers testing which equal of resulted dataset from process three.
Process of Feature Reduction
This is an essential process to reduce, if possible, number of features and select the most intrinsic
of these features in the classification decision, and hence to minimize the computation time of
implementing the classification algorithms and so of the proposed system. It has been
accomplished with two techniques from different fields: Principle Component Analysis (PCA) is a
useful statistical technique that has found application in fields such as face recognition and image
compression, and is a common technique for finding patterns in data of high dimension. The
complete subject of PCA statistics is based on the idea that you have this huge set of data, and you
want to analyze that set expressions of the relationships between the single points in that set. PCA
is applied to the training dataset to find the intrinsic features, see algorithm (1), and GR from
information theory that selects features with the highest GR value, see algorithm (2). Thus two sets
of features in addition to set of all features in the training dataset will be used in design (learning)
of the proposed classifiers.
Algorithm (1): Customized_PCA
The goal of PCA is to minimize the dimensionality of the data while keeping as much as possible
of the difference present in the original dataset. It is a way of characterize intrinsic features and
theorize all of these features’ values.
Input: Proposed TrainD training dataset.
Output: PCAS set of most frequent and related features.
Steps:
1. Obtain training KDD’99 transactions.
2. Represent every transaction Ii as a vector xi.
3. Compute the average transaction …………………….…...(1)
4. Subtract the mean transaction …………………………...…. (2)

Journal of Asian Scientific Research, 2013, 3(4):381-395
386
5. Compute the covariance matrix =AAT…………………..……(3)
6. From C Compute eigenvectors ui of AAT:
a. Consider matrix AAT as a matrix.
b. Compute the eigenvectors vi of AAT such that:
ATAvi → iVi → AA
TAVi = iAvi → Cui = iui where i =Avi………..(4)
c. Compute the best eigenvectors of AAT: i= Avi ………………….…(5)
7. Keep only K eigenvectors, (K features with their values).
Algorithm (2): Gain_Ratio
Input: Proposed TrainD training dataset
Output: GRS set of GR values for each feature in (D)
Steps:
1. For each feature in (D)
2. Find feature’s InfoGain
3. Find its Split Information
4. If value of Split Information = 0
then set it to very small value(<0)
5. Find its GR and add it to GRS
6. End
Customized SVM and NB Classifiers
After the intrinsic features had been selected, the two popular DM classification algorithms:
Support Vector Machine SVM from statistical field and Naïve Bayesian from Bayesian theorem
field, used in the design of the proposed IDS.
A "Support Vector Machine Classifier" SVM is a useful technique for data classification. Even
though it’s looked that Neural Networks are simpler to use than SVM, however, sometimes wrong
results are gained. A classification task usually includes with training and testing data which
consist of some data examples. Each example in the training set contains one base values and
several attributes. The goal of SVM is to introduce a model which predicts base value of data
example in the testing set which are given only the attributes. Classification in SVM is Supervised
Learning. Known typecast help indicate whether the system is performing in a right way or not.
This information points to a coveted response, validating the precise of the system, or be used to
help the system learn to do correctly.
On the other hand, various empirical studies of "Bayesian classifier". In theory, Bayesian
classifiers have the lower error rate in comparison to all other classifiers. Bayesian classifiers are
also useful in that they supply a theoretical warrant for o ther classifiers that do not explicitly use
Bayes’ theorem. For example, under certain assumptions, it can be shown that many ANN
algorithms output the maximum posteriori hypothesis, as does the NB classifier. NB classifiers

Journal of Asian Scientific Research, 2013, 3(4):381-395
387
assume that the effect of a feature value on a given class is independent of the values of the other
features. This hypothesis is called class conditional independence. Both of SVM and NB classifiers
will be used 3 times with each of these 3 sets of features to design the proposed class ifiers:
1. All 44 features of training dataset.
2. Subset of features in (1) according to the result of implementation of the PCA method.
3. Subset of features in (1) according to the result of implementation of the GR measure.
Thus, six classifiers will be obtained: three SVM classifiers and three NB classifiers. Then the
classification of the testing dataset's records will be done with each one of these classifiers, and a
comparison among their classification results will be done in to specify the most efficient feature
selection method with the most accurate classifier.
SVM Classifiers in proposed IDM
SVM is a good technique for data classification. Now a set of training data {(x1,y1)... (xl,yl)} in Rn
R sampled according to unknown probability distribution P(x,y), There are many linear
classifiers (hyper planes) that separate the data. Only one of these achieves maximum separation.
The reason we need it is because if use a hyper plane to classify, it might end up closer to one set of
datasets compared to others and we do not want this to happen and thus we see that the concept of
maximum margin classifier or hyper plane as an apparent solution. For calculating the SVM we see
that the goal is to correctly classify all the data. For mathematical calculations have ,
If Yi= +1;
If Yi= -1; wxi + b ≤ 1
For all i; yi (wi + b) ≥ 1
In this equation x is a vector point and w is a vector weight. So to separate the data (6) should
always be maximal than zero. Among all potential hyper planes, SVM selects the one where the
distance of hyper plane is as max as possible. If the training data is reasonable and every test
vector is located in radius r from training vector. Now if the chosen hyper plane is located at the
outmost possible from the data . This coveted hyper plane which maximizes the margin also halves
the lines between closest points on convex hull of the two datasets. Distance of closest point on
hyper plane to origin can be discovered by maximizing the x as x is on the hyper plane. Similarly
for the other side points we have a similar strategy. Thus fixing and subtracting the two distances
we get the summed distance from the separating hyper plane to nearest points.
Getting Maximum Margin = MM = 2 / ||w||. ………………… (9)
Really maximizing the margin is same as minimum.
………………………( 6) 1bwxi
………………………(7)
………………………(8)
www t
2
1)( …………………………… (10)

Journal of Asian Scientific Research, 2013, 3(4):381-395
388
and for all points {(xi ,yi)}: yi (wTxi + b) ≥ 1, must optimize a quadratic function subject to linear
constraints. The solution involves constructing a dual problem where a Lagrange multiplier αi is
associated with every constraint in the primary problem: Find α1…αN such that
Q(α) =Σαi - ½ΣΣαiαjyiyjxiTxj …………………(11)
is maximized and we calculate Σαiyi = 0 and αi ≥ 0 for all αi
The solution will has the form:
w =Σαiyixi and b= yk- wTxk for any xk such that αk 0
Each non-zero αi references that corresponding xi is a support vector. Then the classifying function
will have the following form:
f(x) = ΣαiyixiTx + b …………………… (12)
It relies on an inner product between the test point x and the support vectors xi. Solving the
optimization problem involved caculating the inner products xiTxj between all pairs of training
points. The old formulation: Find w and b such that Φ(w) =½ wTw is minimized and for all {(xi
,yi)} , yi (wTxi + b) ≥ 1.
Algorithm (3) explain SVM algorithm with Intrusion detection depending on proposed TrainD and
TestD.
Algorithm (3): The SVM
Input: TrainD training dataset, TestD testing dataset that has not been classified
Output: TestD testing dataset that has been classified
Steps:
1. Initialize all points in training dataset as (Xi, Yj) where X is a vector of data x1, ……, xn
and Y is vector of classes.
2. Initialize vector of weight W.
3. Distribute all points (x, y) and extract the hyper plane separator.
4.If the hyper plane give optimal separation then depend hyper plane as classifier model to classify
TestD testing dataset and go End else must do the following steps
5. Maximize the hyper plan using equation (9) and for minimum using equation (10)
6. Initialize Lagrange multiplier αi vector α1…αn using equation (11)
7. Apply classification function using equation (12)
8. Determine the support vectors xi with non-zero αi (support vectors are the points determine the
area of hyper plan)
9. Depend the hyper plan resulted after determining support vectors as the classifier model to
classify TestD testing dataset
End
Naïve Bayesian Classifier in Proposed IDM
In NB classifier a set of probabilities (a priori, conditional, and posteriori) has been found instead
of constructing a set of classification rules. Firstly, compute the "a priori probability" of each class
(i.e. the frequency of each class in the training dataset). The a priori probability computed just

Journal of Asian Scientific Research, 2013, 3(4):381-395
389
once time for the whole training dataset. Then the following computations will be performed for
classifying each record in the testing dataset. The conditional probability P( | ) for every
feature's value in the record of the testing dataset is estimated as the relative frequency of records
having value as the jth feature in class . Assuming conditional independence of features, the
"conditional probabilities" P( ) of the testing record at each class is computed using equation
(13). Finally, the "postpriori probability" P(h|X) of the testing record at each class computed using
equation (14), the class with the maximum postpriori probability will be the label for the
testing record according to equation (15).
P( ) ………. (13)
P(h|X) = …………… (14)
arg arg (15)
Algorithm(4) Naive Bayesian
Input: TrainD training dataset, TestD testing dataset that has not been classified
Output: TestD testing dataset that has been classified
Steps:
1. Initialize MaxValue to a small value
2. For each class in TrainD find its a priori probability
3. For each record R in TestD do step 4 and 8
4. For each class in TrainD repeat steps 5-7
5. Find the conditional probability of R at using equation(13)
6. Find the postpriori probability of R using equation (14)
7. If value greater than MaxValue value
then MaxValue = and class_label = equation (15)
8. Assign class_label to the class of R
9. End
DISCUSSION AND EXPERIMENTS
The proposal had been implemented on the following platform: Windows 7 Ultimate Service Pack1
and 32-bit OS, 4GB RAM, and Intel® Core (TM) 2 Duo CPU with 2.00GHz; and by using Visual
Basic 6.0 and SQL server.
Training of the two used classifiers (NB and SVM) on TrainingHD has been done with three sets
of features (All_F, PCA_F, and GR_F), so the proposed model has been experimented (i.e., trained
and tested) for many times to assess the accuracy of the classifiers. Results of three conducted
experiments (Exp1, Exp2, Exp3), which producing the most accurate results, have been presented
in this section. Six classification models have been constructed in each of these three experiments.
Next these models have been applied on the same TestingHD, which has been constructed during
Exp1, to assess the validation and accuracy of these constructed models on the same testing dataset.
The classification results of testing are either TP (intrusion), TN (normal), false positive (FP)
(misclassified as intrusion), false negative (FN) (misclassified as normal), Unknown (new user
Journal of Asian Scientific Research, 2013, 3(4):381-395
390
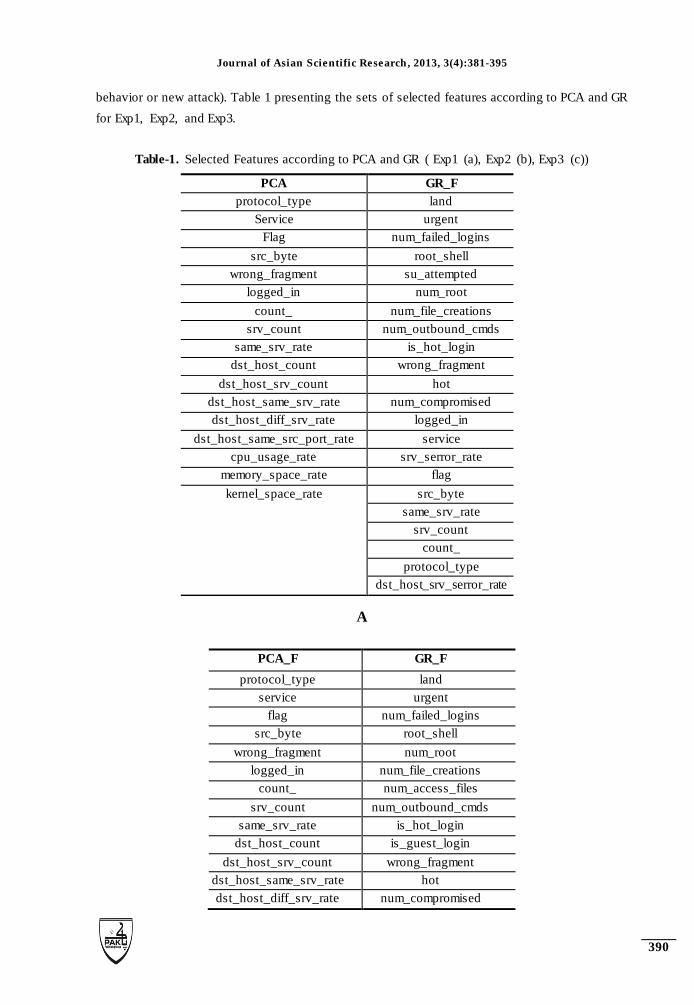
behavior or new attack). Table 1 presenting the sets of selected features according to PCA and GR
for Exp1, Exp2, and Exp3.
Table-1. Selected Features according to PCA and GR ( Exp1 (a), Exp2 (b), Exp3 (c))
A
PCA GR_F
protocol_type land
Service urgent
Flag num_failed_logins
src_byte root_shell
wrong_fragment su_attempted
logged_in num_root
count_ num_file_creations
srv_count num_outbound_cmds
same_srv_rate is_hot_login
dst_host_count wrong_fragment
dst_host_srv_count hot
dst_host_same_srv_rate num_compromised
dst_host_diff_srv_rate logged_in
dst_host_same_src_port_rate service
cpu_usage_rate srv_serror_rate
memory_space_rate flag
kernel_space_rate
src_byte
same_srv_rate
srv_count
count_
protocol_type
dst_host_srv_serror_rate
PCA_F GR_F
protocol_type land
service urgent
flag num_failed_logins
src_byte root_shell
wrong_fragment num_root
logged_in num_file_creations
count_ num_access_files
srv_count num_outbound_cmds
same_srv_rate is_hot_login
dst_host_count is_guest_login
dst_host_srv_count wrong_fragment
dst_host_same_srv_rate hot
dst_host_diff_srv_rate num_compromised

Journal of Asian Scientific Research, 2013, 3(4):381-395
391
B
C
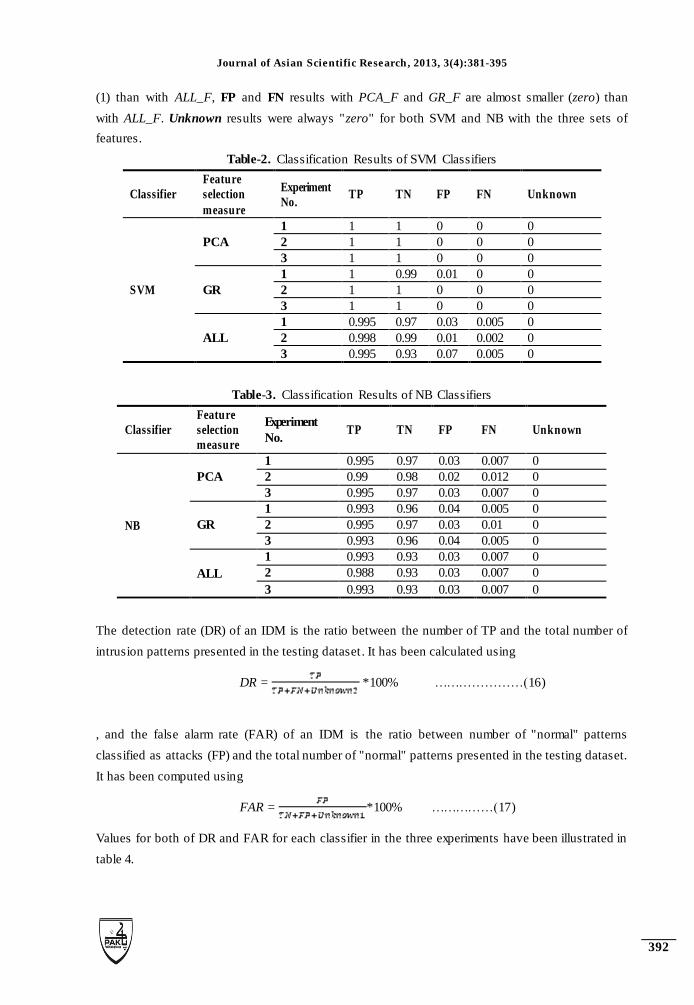
Table 2 and table 3 summarized values of classification results for the three experiments. Generally
in the three experiments, TP and TN results of SVM classifiers with PCA_F and GR_F are always
higher than that of SVM with ALL_F and NB classifiers with PCA_F, GR_F also always higher
than that of NB with ALL_F, FP and FN results of SVM classifiers with PCA_F and GR_F are
always smaller than that of SVM with PCA_F and GR_F NB classifiers . In particular with SVM
classifiers in the three experiments, TP and TN results with PCA_F and GR_F are almost higher
dst_host_same_src_port_rate logged_in
cpu_usage_rate srv_serror_rate
memory_space_rate src_byte
kernel_space_rate same_srv_rate
srv_count
protocol_type
count_
diff_srv_rate
dst_host_srv_rerror_rate
PCA_F GR_F
protocol_type land
service urgent
flag num_failed_logins
src_byte root_shell
wrong_fragment num_root
logged_in num_file_creations
count_ num_shells
srv_count num_access_files
same_srv_rate num_outbound_cmds
dst_host_count is_hot_login
dst_host_srv_count is_guest_login
dst_host_same_srv_rate wrong_fragment
dst_host_diff_srv_rate hot
dst_host_same_src_port_rate num_compromised
cpu_usage_rate logged_in
memory_space_rate src_byte
kernel_space_rate srv_serror_rate
srv_count
same_srv_rate
protocol_type
count_
Service
Journal of Asian Scientific Research, 2013, 3(4):381-395
392
(1) than with ALL_F, FP and FN results with PCA_F and GR_F are almost smaller (zero) than
with ALL_F. Unknown results were always "zero" for both SVM and NB with the three sets of
features.
Table-2. Classification Results of SVM Classifiers
Classifier
Feature
selection
measure
Experiment
No. TP TN FP FN Unknown
SVM
PCA
1 1 1 0 0 0
2 1 1 0 0 0
3 1 1 0 0 0
GR
1 1 0.99 0.01 0 0
2 1 1 0 0 0
3 1 1 0 0 0
ALL
1 0.995 0.97 0.03 0.005 0
2 0.998 0.99 0.01 0.002 0
3 0.995 0.93 0.07 0.005 0
Table-3. Classification Results of NB Classifiers
Classifier
Feature
selection
measure
Experiment
No. TP TN FP FN Unknown
NB
PCA
1 0.995 0.97 0.03 0.007 0
2 0.99 0.98 0.02 0.012 0
3 0.995 0.97 0.03 0.007 0
GR
1 0.993 0.96 0.04 0.005 0
2 0.995 0.97 0.03 0.01 0
3 0.993 0.96 0.04 0.005 0
ALL
1 0.993 0.93 0.03 0.007 0
2 0.988 0.93 0.03 0.007 0
3 0.993 0.93 0.03 0.007 0
The detection rate (DR) of an IDM is the ratio between the number of TP and the total number of
intrusion patterns presented in the testing dataset . It has been calculated using
DR = *100% …………………(16)
, and the false alarm rate (FAR) of an IDM is the ratio between number of "normal" patterns
classified as attacks (FP) and the total number of "normal" patterns presented in the testing dataset.
It has been computed using
FAR = *100% ……………(17)
Values for both of DR and FAR for each classifier in the three experiments have been illustrated in
table 4.

Journal of Asian Scientific Research, 2013, 3(4):381-395
393
Table-4. DRs and FARs of both of them SVM and NB Classifiers
SVM Classifier NB Classifier
Feature
Selection
Measure
Experiment
No. DR FAR
Feature
Selection
Measure Experiment No. DR FAR
PCA
1 1 0
PCA
1 0.995 0.03
2 1 0 2 0.993 0.02
3 1 0 3 0.995 0.03
GR
1 1 0.01
GR
1 0.993 0.04
2 1 0 2 0.993 0.03
3 1 0 3 0.993 0.04
ALL
1 0.995 0.03
ALL
1 0.993 0.03
2 0.998 0.01 2 0.988 0.03
3 0.995 0.07 3 0.993 0.03
DR are higher with SVM classifiers (often greater than "0.995") than with NB classifiers that often
did not exceed "0.995". And FAR often ranging between (0 - 0.07) with SVM classifiers while it is
often ranging between the range of (0.02 - 0.04) with NB classifiers. It is very clear from these
comparisons that SVM classifiers are better than NB. In particular, with SVM classifiers in the
three experiments, DR with PCA_F and GR_F is always higher (1) than with ALL_F. And FAR is
"zero" with PCA_F and GR_F, while it is ranging between the range of (0.01-0.07) with ALL_F .
Selection of the best classification model would be done significantly according to its classification
accuracy, which is introduced as the ratio between the number of the correctly classified patterns
(TP, TN) and the total number of patterns of the testing dataset. The accuracy (Accu) of each
classifier has been calculated using
Accu = *100% ………. (18)
Table 5 summarizes Accu of both SVM and NB classifiers with PCA_F, GR_F, ALL_F in the three
experiments. According to these results, the most accurate classifiers were SVM classifiers with
PCA_F Accu equal 1 in Exp1, Exp2 and Exp3 followed by SVM classifier with GR_F with Accu
equal 1 in Exp2 and Exp3, were SVM classifier with ALL_F with Accu equal to 0.996 in Exp2.
A comparison between Accu of NB and SVM, it is obvious that Accu of SVM classifier with all
sets of features and in the three experiments was almost higher than Accu of NB classifier. And for
SVM classifiers, the best classification accuracy was with PCA_F and GR_F. Therefore PCA
method is the feature selection measure that will be used in design of the proposed hybrid IDM.

Journal of Asian Scientific Research, 2013, 3(4):381-395
394
Table-5. Accuracy of SVM and NB Classifiers
Classifier Experiment
No. PCA_F GR_F ALL_F
SVM
1 1 0.998 0.990
2 1 1 0.996
3 1 1 0.982
NB
1 0.988 0.988 0.988
2 0.986 0.986 0.988
3 0.988 0.988 0.988
CONCLUSIONS
This paper design and implement a hybrid IDM for detecting intrusions. The design of model relies
on using of DM classification algorithms with a proposed dataset, named HybD, composed of the
10% KDD'99 dataset's features and suggested host-based features. Where these features related to
host itself not to network traffic give a support for proposed hybrid IDS to detect attacks, since
these features have clear affect on host resources performance.
The aim of considering two measures for feature selection is to get diversiform of subsets of
features, to make comprehensive comparisons. PCA find the most strong attributes in dataset and
GR selecting features that having greatest GR values. The "PCA" has given better results rather
than results of GR measure when they used with SVM and NB classifier, see tables (2, 3).
Accuracy of SVM classifier higher than NB in all cases of features (PCA, GR, ALL), see table (4,
5).
REFERENCES
Hassina Bensefia, a.N.G., 2011. A new approach for adaptive intrusion detection, 2011
seventh international conference on computational intelligence and security. pp:
983-987.
KDD, 1999. Kdd cup 1999 data, the uci kdd archive, information and computer science,
university of california, irvine, 1999. Available from
http://kdd.ics.uci.edu/databases/kddcup99/kddcup99.html.
Mohammed, A.N., 2006. A honey pot resources approach to divert system intruders,
m.Sc. Thesis, iraqi commission for computers and informatics, informatics
institute for postgraduate studies.

Journal of Asian Scientific Research, 2013, 3(4):381-395
395
Moses, G., L. Chunmei and F. Duane, 2008. Intrusion techniques: Comparative study of
network intrusion detection systems. pp: 592-598.
Muamer, N.M., S. Norrozila and A.M. Osama, 2011. A novel intrusion detection system
by using intelligent data mining in weka environment, published by elsevier ltd.
Procedia computer science 3: 1237-1242.
Nur, A.H., A. Muhammad and A.P. Syed, 2012. An activity pattern based wireless
intrusion detection system. pp: 846-847.
Risto, V., 2009. Real-time classification of ids alerts with data mining techniques,
milcom'09 proceedings of the 28th ieee conference on military communications.
1786-1792.
Risto, V. and P. Karlis, 2010. Network ids alert classification with frequent itemset mining
and data clustering, the 2010 international ieee conference on network and service
management. 451-456.
Sufyan, T.A.-J. and A.S. Hadeel, 2011. A neural network based anomaly intrusion
detection system, ieee computer society, 2011 Developments in E-systems
Engineering: 221-226.
Zhang, G., L. Chen and W. Ha, 2011. The design of cooperative intrusion detection
system. 764-766.