Embed Size (px)
Citation preview
ORIGINAL ARTICLE
Efficiency improvement opportunities for televisions in India:implications for market transformation programs
Won Young Park & Amol Phadke & Nihar Shah
Received: 24 June 2013 /Accepted: 5 February 2014 /Published online: 15 March 2014# The Author(s) 2014. This article is published with open access at Springerlink.com
Abstract Televisions (TVs) account for a significantportion of residential appliance electricity consumptionin India, and TV shipments in India are expected tocontinue to increase. We assess the market trends inthe energy efficiency of TVs that are likely to occurwithout any additional policy intervention and estimatethat TV efficiency will likely improve with saving po-tential of 6 terawatt-hours (TWh) per year in 2020,compared to today’s technology. We discuss variousenergy-efficiency improvement options and evaluatethe cost-effectiveness of three of them, at least one ofwhich improves efficiency by at least 20 % cost-effectively beyond these ongoing market trends. Weprovide insights for policies and programs that can beused to accelerate the adoption of efficient technologiesto capture the cost-effective energy savings potentialfrom TVs which we estimate to be 3.4 TWh per yearin 2020.
Keywords India . TVenergy efficiency.
Cost-effectiveness . Market transformation
Introduction
The total global television (TV) electricity consumptionwas estimated to be more than 250 terawatt-hours
[TWh] in 2008, i.e., more than 5 % of total globalresidential electricity consumption (InternationalEnergy Agency IEA 2009). The total electricity con-sumption in India was estimated to be 472 TWh in 2005,and TVs accounted for 3 % of this electricity consump-tion (i.e., 14 TWh or 17 % of electricity consumed inresidential appliances) (de la Rue du Can et al. 2009). Inaddition, while the market share of cathode ray tube(CRT) TVs in India has been significantly decreasingsince 2011, the average TV screen size (measured diag-onally) is expected to increase from 21 in. in 2011 to29 in. in 2016 due to the market transition toward flat-panel TVs (DisplaySearch 2012a; 2012e).
An assessment of efficiency improvement opportu-nities for TVs is needed for two reasons—first, to cor-rect market failures such as uncaptured economic andenvironmental benefits available from TV energy-consumption reduction through cost-effective1 efficien-cy improvements and second, to account for the ongo-ing large-scale transition from cold cathode fluorescentlamp (CCFL) backlit liquid crystal display (CCFL-LCD) TVs to light emitting diode (LED) backlit LCD(LED-LCD) TVs in designing market transformationprograms such as standards, labels, or incentives in atimely manner (Park et al. 2013). TV manufacturing ishighly globalized, and LCD TVs in India are likely toincrease significantly within the next 3–4 years, from
Energy Efficiency (2014) 7:811–832DOI 10.1007/s12053-014-9255-9
1 In this analysis, cost-effectiveness is defined as cost of conservedelectricity (CCE), the annualized investment in more expensiveequipment or component needed to provide a unit of electricitysaved (KWh), less than electricity price.
W. Y. Park (*) :A. Phadke :N. ShahEnvironmental Energy Technologies Division, LawrenceBerkeley National Laboratory,Berkeley, CA, USAe-mail: [email protected]
43 % of total TV shipments in 2012 to 95 % in 2015respectively, following the global TV market transition(DisplaySearch 2012a). Hence, the TV technology as-sessment and the cost-effectiveness of TV efficiencyimprovement options recently presented in Park et al.2013 are applicable to India.
This paper focuses on LCD TVs which are expectedto dominate the Indian TV market, amounting to anexpected 95 % of Indian TV shipments by 2015(DisplaySearch 2012a). We consider efficiency im-provement options that are discussed more fully inPark et al. 2011, 2013 and new types of TVs designedfor emerging markets such as India. Although the rapidevolution of technology in the display market makes aforecast over a longer time scale uncertain, in this paper,we assess the impacts of a short-term action, which isassumed to occur by 2015, on mid-term electricity-demand reduction by 2020. We obtained the data forthis paper primarily from the following sources: reviewof the literature including publicly available marketinformation, technical reports, commercially availableDisplaySearch data sets,2 the U.S. ENERGY STAR database,3 and interviews with manufacturers and experts inthe field.
The remainder of this paper is organized as follows:First, we present an overview of the India TV marketand technology trends. Second, we discuss technologi-cally feasible energy-efficiency improvement options,and adoption trends of such options. We also reviewrecent developments in low-cost LED-LCD TVs de-signed to be more affordable than conventional LED-LCD TVs. Third, we present a cost of conserved elec-tricity (CCE) analysis to assess the cost-effectiveness ofoptions identified. Fourth, we offer suggestions for ac-celerating the adoption of efficient technologies, and
fifth, we estimate the energy-savings potential of suchadoption. Finally, we present concluding remarks.
Overview of India TV market
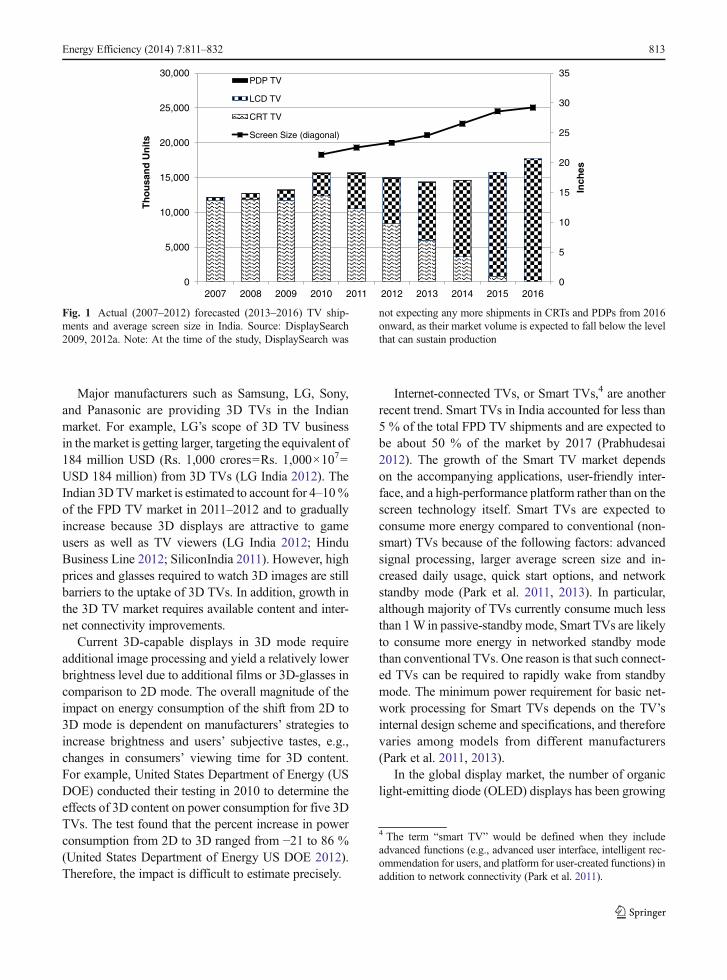
Total TV shipments for India increased by about 29 %from 2007 to 2011, reaching 15.6 million units, whichrepresent about 6.3 % of global TV shipments in 2011(DisplaySearch 2009; 2011a; 2012a). Although bothglobal and India TV shipments are expected to declinein the short term until 2013, the shipments are likely toreturn to growth once the global economy recovers(DisplaySearch 2012b; Morrod 2012). In addition,LCD TVs are expected to overtake CRT TVs in Indiafrom 2013 onward. The market share of plasma displaypanel (PDP) TVs has been less than 1 % of the market,and the shipment is expected to decrease to only 20,000units (i.e., 0.1 % of the market) in 2014. Fig. 1 shows theestimated India TV shipment and average screen sizeforecast.
A large-scale global transition from CCFL-LCD TVsto LED-LCD TVs—which are colloquially referred toas “LED TVs” in India—is expected to occur between2011 and 2015. LED backlights are expected to accountfor 100 % of the LCD TV market by 2020 (McKinseyand Company 2012). The rapid improvement in LEDtechnologies has driven the adoption of LED backlightsfor LCD TVs and other applications. In line with theexpected increasing demand and rapid technologicalimprovement, costs are expected to fall rapidly as thenumber of TVs being produced increases. Supply sidefactors such as relatively high selling prices, better mar-gins, and reduced logistics costs associated with thinnerand lighter form factors are also contributing to theglobal market transition (Park et al. 2011). Althoughthe high selling prices are still a barrier for LCD TVs,including LED-LCD TVs, to penetrate into emergingmarkets such as India, the penetration rates of LCD TVsin India is expected within the next 3–4 years to be closein percentage terms to that of the global LCDTVmarketbecause major manufacturers are planning to providemore affordable LCD TVs in the emerging markets.
Emerging trends—3DTVs, Smart TVs, and OLED TVs
We want to discuss these three trends because they allhave potential impact on energy consumption of TVs.
2 DisplaySearch has been providing reliable information based onmanufacturer survey and analyses on the display market andrelated industries which are widely used in the industry. ForIndia TV market, DisplaySearch provides quarterly updated TVshipment data and analysis of the regional TV market and tech-nology trends.3 India’s Star Rating registered TVs have accounted for only a fewmanufacturers and about 20 % of the Indian TVmarket. While weuse the India-specific market data in screen size, market shares ofscreen technologies, etc., we assume the on-mode power con-sumption of ENERGY STAR products by screen technology orLCD backlight technology can represent that of the TVs sold inIndia at that time, as the test methods for both programs are basedon IEC 62087.
812 Energy Efficiency (2014) 7:811–832
Major manufacturers such as Samsung, LG, Sony,and Panasonic are providing 3D TVs in the Indianmarket. For example, LG’s scope of 3D TV businessin the market is getting larger, targeting the equivalent of184 million USD (Rs. 1,000 crores=Rs. 1,000×107=USD 184 million) from 3D TVs (LG India 2012). TheIndian 3DTVmarket is estimated to account for 4–10%of the FPD TV market in 2011–2012 and to graduallyincrease because 3D displays are attractive to gameusers as well as TV viewers (LG India 2012; HinduBusiness Line 2012; SiliconIndia 2011). However, highprices and glasses required to watch 3D images are stillbarriers to the uptake of 3D TVs. In addition, growth inthe 3D TV market requires available content and inter-net connectivity improvements.
Current 3D-capable displays in 3D mode requireadditional image processing and yield a relatively lowerbrightness level due to additional films or 3D-glasses incomparison to 2D mode. The overall magnitude of theimpact on energy consumption of the shift from 2D to3D mode is dependent on manufacturers’ strategies toincrease brightness and users’ subjective tastes, e.g.,changes in consumers’ viewing time for 3D content.For example, United States Department of Energy (USDOE) conducted their testing in 2010 to determine theeffects of 3D content on power consumption for five 3DTVs. The test found that the percent increase in powerconsumption from 2D to 3D ranged from −21 to 86 %(United States Department of Energy US DOE 2012).Therefore, the impact is difficult to estimate precisely.
Internet-connected TVs, or Smart TVs,4 are anotherrecent trend. Smart TVs in India accounted for less than5 % of the total FPD TV shipments and are expected tobe about 50 % of the market by 2017 (Prabhudesai2012). The growth of the Smart TV market dependson the accompanying applications, user-friendly inter-face, and a high-performance platform rather than on thescreen technology itself. Smart TVs are expected toconsume more energy compared to conventional (non-smart) TVs because of the following factors: advancedsignal processing, larger average screen size and in-creased daily usage, quick start options, and networkstandby mode (Park et al. 2011, 2013). In particular,although majority of TVs currently consume much lessthan 1W in passive-standby mode, Smart TVs are likelyto consume more energy in networked standby modethan conventional TVs. One reason is that such connect-ed TVs can be required to rapidly wake from standbymode. The minimum power requirement for basic net-work processing for Smart TVs depends on the TV’sinternal design scheme and specifications, and thereforevaries among models from different manufacturers(Park et al. 2011, 2013).
In the global display market, the number of organiclight-emitting diode (OLED) displays has been growing
4 The term “smart TV” would be defined when they includeadvanced functions (e.g., advanced user interface, intelligent rec-ommendation for users, and platform for user-created functions) inaddition to network connectivity (Park et al. 2011).
0
5
10
15
20
25
30
35
0
5,000
10,000
15,000
20,000
25,000
30,000
2007 2008 2009 2010 2011 2012 2013 2014 2015 2016
Inch
es
Th
ou
san
d U
nit
s
PDP TV
LCD TV
CRT TV
Screen Size (diagonal)
Energy Efficiency (2014) 7:811–832 813
Fig. 1 Actual (2007–2012) forecasted (2013–2016) TV ship-ments and average screen size in India. Source: DisplaySearch2009, 2012a. Note: At the time of the study, DisplaySearch was
not expecting any more shipments in CRTs and PDPs from 2016onward, as their market volume is expected to fall below the levelthat can sustain production
rapidly in mobile applications. OLED TVs with largescreen sizes are expected to begin penetrating into theglobal TV market through 2013, but only reach salesof 2.7 million units (less than 1 % of the globalmarket) in 2015 (DisplaySearch 2011a). It does notappear that OLEDs will be cost-competitive in the shortterm against LCD TVs (DisplaySearch 2011a; Parket al. 2011, 2013). For example, starting January 2013,LG began soliciting pre-orders for 55-in. OLED TVs inSouth Korea. The manufacturer’s suggested retail pricewas 11 million KRW, equivalent to approx. 10,000USD(Mlot 2013), which is 3–4 times more expensive thanthe same size LED-LCD TVs sold in the market.
While a comprehensive discussion of consumerbehavioral patterns and integrated network featuresare beyond the scope of this paper which focuses onTV technology and efficiency improvements, the po-tential increase in TV screen size and correspondingenergy consumption increase is included in the analy-sis. In addition, though we do not focus here specifi-cally on 3D technologies and Smart TVs, all theefficiency improvement options and correspondingcost-effectiveness analysis presented here are also ap-plicable to 3D TVs and Smart TVs. No OLED TVshipment to India is expected to happen until 2016(DisplaySearch 2012a). This implies that designingmarket transformation programs to encourage penetra-tion of energy-efficient OLED TVs are still premature.Hence, we have not focused on OLED technologyhere. As LCD TVs are expected to dominate theIndian TV market from 2013 onward, accounting forabout 60 %, and expected to reach more than 90 % in2015, this analysis focuses on LCD TVs.
Efficiency improvement options and relatedtechnology trends
LCD TVs’ overall efficiency, if viewed in terms ofchange in luminance as light travels through the opticalprocessing elements in the display panel, has a signifi-cant room for improvement. The final luminance leav-ing the screen is less than 10 % of the initial luminanceavailable from the backlight source because two crossedpolarizers, a color filter, and TFT arrays in the LCDpanel collectively absorb or reflect a significant amount
of light from the backlight unit (Shieh et al. 2009). Therequired backlight luminance and the TV energy con-sumption are thus highly sensitive to the panel transmit-tance and optical-film efficiency. Therefore, even smallefficiency improvements in these components yieldlarge payoffs in terms of required luminance and there-fore overall efficiency (Park et al. 2013).
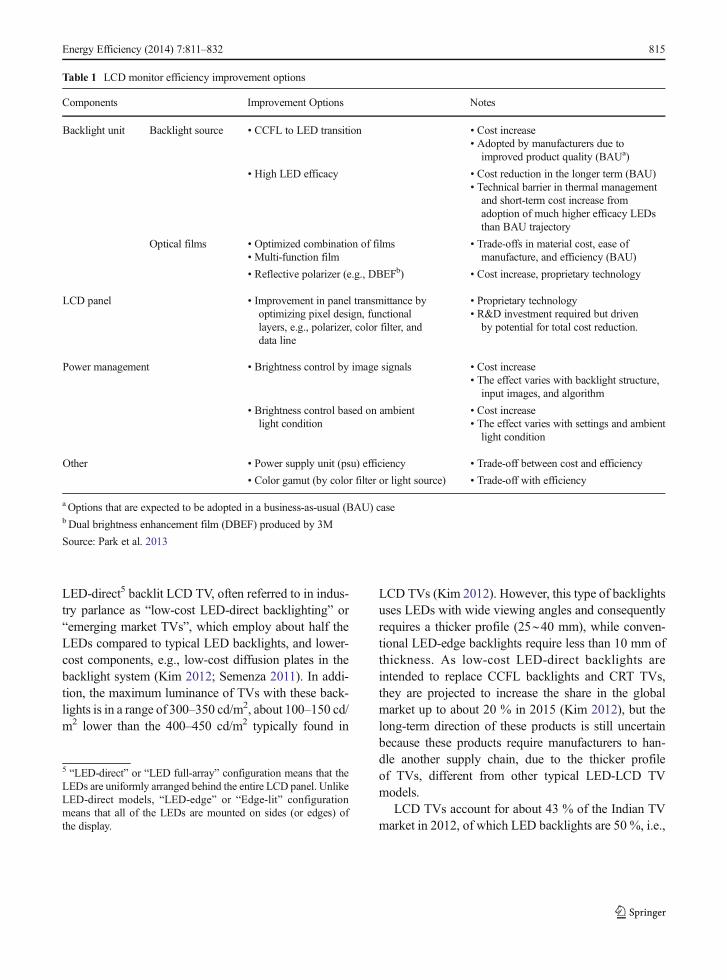
Table 1 summarizes widely accepted LCD TV effi-ciency improvement options. We here do not providedetails of these options and refer readers to Park et al.2011, 2013 for more detailed information. Althoughthose studies analyzed recently available and dominanttechnologies in order to identify feasible and cost-effective efficiency improvement options, we do notclaim that the selected options are the best, the leastcost, or the only efficiency improvement optionsavailable.
Low-cost LED-LCD TVs trend
Broadly speaking, TV technology develops in twodirections:
& pushing toward adoption of high picture quality andadvanced features (e.g., higher resolution, higherframe rate, new backlight system, 3D, and smart fea-tures) for early adopters or high-end consumers, and
& toward lower costs for newly developed productsfor price-sensitive consumers (Semenza 2011).
Developments in both technology directions are notmutually exclusive. Manufacturers plan to implementadvanced technology into low-cost models as the tech-nology matures, e.g., entry-level 3D TVs.
In particular, since 2011, major TV manufacturershave been providing new types of LED-LCD TVs atlower prices in the market for the purpose of decreasingthe price gap between conventional CRTor CCFL-LCDTVs and LED-LCD TVs. Manufacturers can accom-plish this in the following ways. First, decreasing themaximum luminance level and color-reproduction ca-pability reduces material costs as well as power con-sumption. For example, lower luminance allows manu-facturers to use fewer LED lamps as well as low-voltagedriven electronic parts in the circuitry (Park et al. 2011).Second, this trend leads to another type of affordable
814 Energy Efficiency (2014) 7:811–832
LED-direct5 backlit LCD TV, often referred to in indus-try parlance as “low-cost LED-direct backlighting” or“emerging market TVs”, which employ about half theLEDs compared to typical LED backlights, and lower-cost components, e.g., low-cost diffusion plates in thebacklight system (Kim 2012; Semenza 2011). In addi-tion, the maximum luminance of TVs with these back-lights is in a range of 300–350 cd/m2, about 100–150 cd/m2 lower than the 400–450 cd/m2 typically found in
LCD TVs (Kim 2012). However, this type of backlightsuses LEDs with wide viewing angles and consequentlyrequires a thicker profile (25∼40 mm), while conven-tional LED-edge backlights require less than 10 mm ofthickness. As low-cost LED-direct backlights areintended to replace CCFL backlights and CRT TVs,they are projected to increase the share in the globalmarket up to about 20 % in 2015 (Kim 2012), but thelong-term direction of these products is still uncertainbecause these products require manufacturers to han-dle another supply chain, due to the thicker profileof TVs, different from other typical LED-LCD TVmodels.
LCD TVs account for about 43 % of the Indian TVmarket in 2012, of which LED backlights are 50 %, i.e.,
Table 1 LCD monitor efficiency improvement options
Components Improvement Options Notes
Backlight unit Backlight source • CCFL to LED transition • Cost increase• Adopted by manufacturers due toimproved product quality (BAUa)
• High LED efficacy • Cost reduction in the longer term (BAU)• Technical barrier in thermal managementand short-term cost increase fromadoption of much higher efficacy LEDsthan BAU trajectory
Optical films • Optimized combination of films• Multi-function film
• Trade-offs in material cost, ease ofmanufacture, and efficiency (BAU)
• Reflective polarizer (e.g., DBEFb) • Cost increase, proprietary technology
LCD panel • Improvement in panel transmittance byoptimizing pixel design, functionallayers, e.g., polarizer, color filter, anddata line
• Proprietary technology• R&D investment required but drivenby potential for total cost reduction.
Power management • Brightness control by image signals • Cost increase• The effect varies with backlight structure,input images, and algorithm
• Brightness control based on ambientlight condition
• Cost increase• The effect varies with settings and ambientlight condition
Other • Power supply unit (psu) efficiency • Trade-off between cost and efficiency
• Color gamut (by color filter or light source) • Trade-off with efficiency
a Options that are expected to be adopted in a business-as-usual (BAU) casebDual brightness enhancement film (DBEF) produced by 3M
Source: Park et al. 2013
5 “LED-direct” or “LED full-array” configuration means that theLEDs are uniformly arranged behind the entire LCD panel. UnlikeLED-direct models, “LED-edge” or “Edge-lit” configurationmeans that all of the LEDs are mounted on sides (or edges) ofthe display.
Energy Efficiency (2014) 7:811–832 815
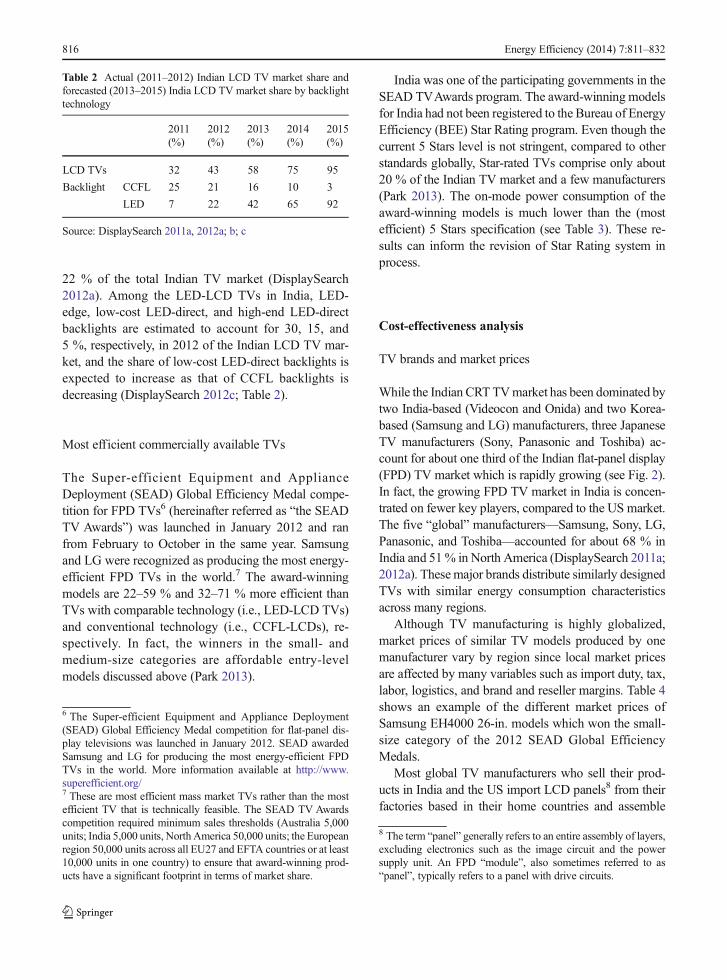
22 % of the total Indian TV market (DisplaySearch2012a). Among the LED-LCD TVs in India, LED-edge, low-cost LED-direct, and high-end LED-directbacklights are estimated to account for 30, 15, and5 %, respectively, in 2012 of the Indian LCD TV mar-ket, and the share of low-cost LED-direct backlights isexpected to increase as that of CCFL backlights isdecreasing (DisplaySearch 2012c; Table 2).
Most efficient commercially available TVs
The Super-efficient Equipment and ApplianceDeployment (SEAD) Global Efficiency Medal compe-tition for FPD TVs6 (hereinafter referred as “the SEADTV Awards”) was launched in January 2012 and ranfrom February to October in the same year. Samsungand LG were recognized as producing the most energy-efficient FPD TVs in the world.7 The award-winningmodels are 22–59 % and 32–71 % more efficient thanTVs with comparable technology (i.e., LED-LCD TVs)and conventional technology (i.e., CCFL-LCDs), re-spectively. In fact, the winners in the small- andmedium-size categories are affordable entry-levelmodels discussed above (Park 2013).
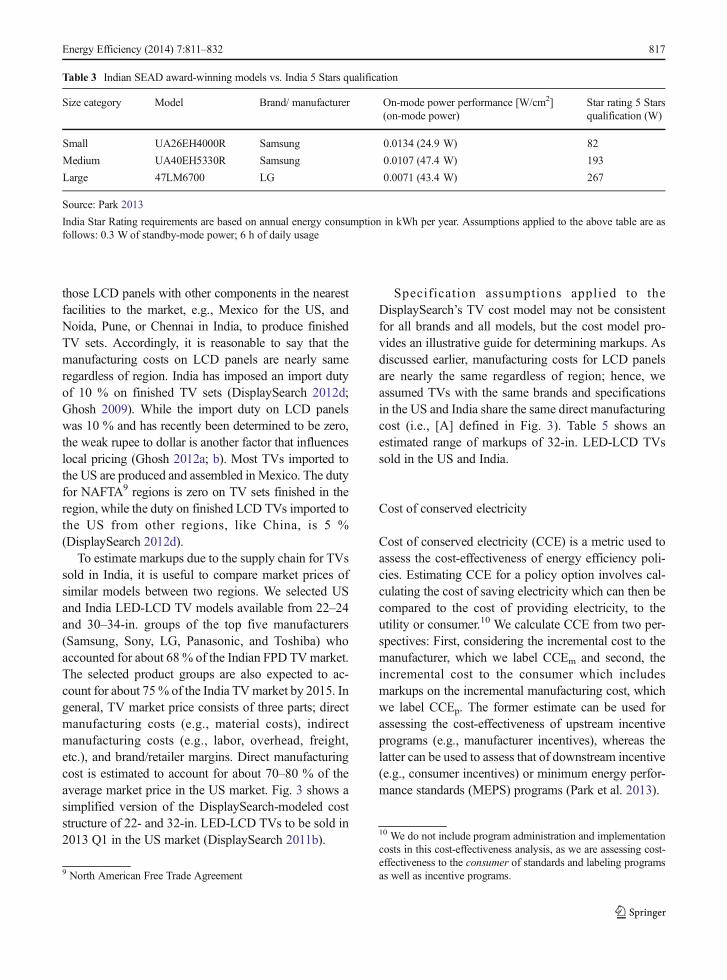
India was one of the participating governments in theSEAD TVAwards program. The award-winning modelsfor India had not been registered to the Bureau of EnergyEfficiency (BEE) Star Rating program. Even though thecurrent 5 Stars level is not stringent, compared to otherstandards globally, Star-rated TVs comprise only about20 % of the Indian TV market and a few manufacturers(Park 2013). The on-mode power consumption of theaward-winning models is much lower than the (mostefficient) 5 Stars specification (see Table 3). These re-sults can inform the revision of Star Rating system inprocess.
Cost-effectiveness analysis
TV brands and market prices
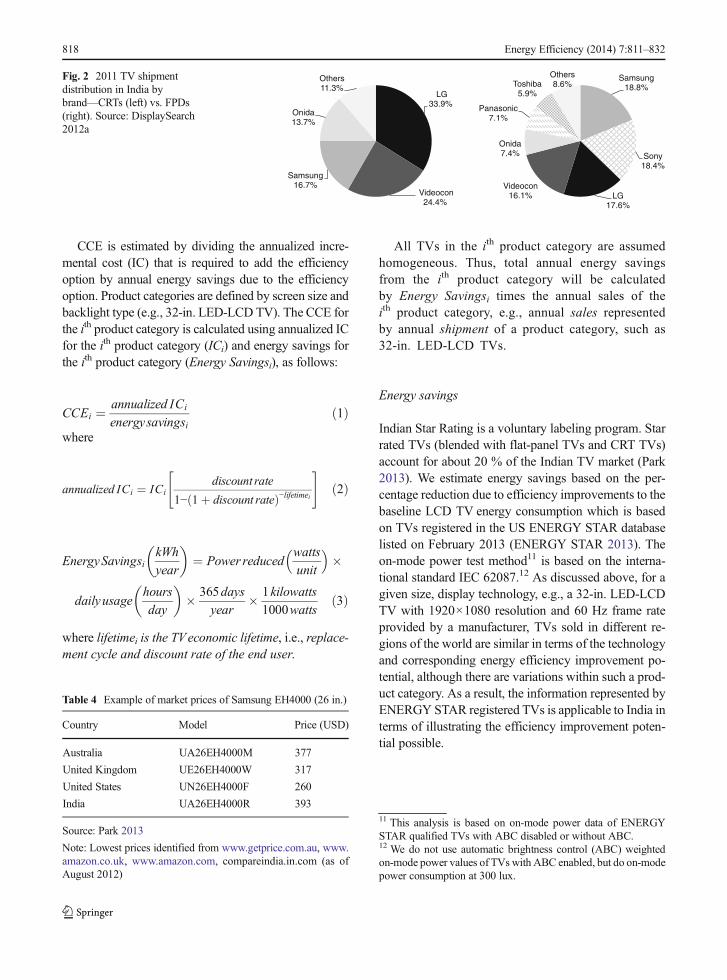
While the Indian CRTTVmarket has been dominated bytwo India-based (Videocon and Onida) and two Korea-based (Samsung and LG) manufacturers, three JapaneseTV manufacturers (Sony, Panasonic and Toshiba) ac-count for about one third of the Indian flat-panel display(FPD) TV market which is rapidly growing (see Fig. 2).In fact, the growing FPD TV market in India is concen-trated on fewer key players, compared to the US market.The five “global” manufacturers—Samsung, Sony, LG,Panasonic, and Toshiba—accounted for about 68 % inIndia and 51% in North America (DisplaySearch 2011a;2012a). Thesemajor brands distribute similarly designedTVs with similar energy consumption characteristicsacross many regions.
Although TV manufacturing is highly globalized,market prices of similar TV models produced by onemanufacturer vary by region since local market pricesare affected by many variables such as import duty, tax,labor, logistics, and brand and reseller margins. Table 4shows an example of the different market prices ofSamsung EH4000 26-in. models which won the small-size category of the 2012 SEAD Global EfficiencyMedals.
Most global TV manufacturers who sell their prod-ucts in India and the US import LCD panels8 from theirfactories based in their home countries and assemble
Table 2 Actual (2011–2012) Indian LCD TV market share andforecasted (2013–2015) India LCD TV market share by backlighttechnology
2011(%)
2012(%)
2013(%)
2014(%)
2015(%)
LCD TVs 32 43 58 75 95
Backlight CCFL 25 21 16 10 3
LED 7 22 42 65 92
Source: DisplaySearch 2011a, 2012a; b; c
6 The Super-efficient Equipment and Appliance Deployment(SEAD) Global Efficiency Medal competition for flat-panel dis-play televisions was launched in January 2012. SEAD awardedSamsung and LG for producing the most energy-efficient FPDTVs in the world. More information available at http://www.superefficient.org/7 These are most efficient mass market TVs rather than the mostefficient TV that is technically feasible. The SEAD TV Awardscompetition required minimum sales thresholds (Australia 5,000units; India 5,000 units, North America 50,000 units; the Europeanregion 50,000 units across all EU27 and EFTA countries or at least10,000 units in one country) to ensure that award-winning prod-ucts have a significant footprint in terms of market share.
8 The term “panel” generally refers to an entire assembly of layers,excluding electronics such as the image circuit and the powersupply unit. An FPD “module”, also sometimes referred to as“panel”, typically refers to a panel with drive circuits.
816 Energy Efficiency (2014) 7:811–832
those LCD panels with other components in the nearestfacilities to the market, e.g., Mexico for the US, andNoida, Pune, or Chennai in India, to produce finishedTV sets. Accordingly, it is reasonable to say that themanufacturing costs on LCD panels are nearly sameregardless of region. India has imposed an import dutyof 10 % on finished TV sets (DisplaySearch 2012d;Ghosh 2009). While the import duty on LCD panelswas 10 % and has recently been determined to be zero,the weak rupee to dollar is another factor that influenceslocal pricing (Ghosh 2012a; b). Most TVs imported tothe US are produced and assembled in Mexico. The dutyfor NAFTA9 regions is zero on TV sets finished in theregion, while the duty on finished LCD TVs imported tothe US from other regions, like China, is 5 %(DisplaySearch 2012d).
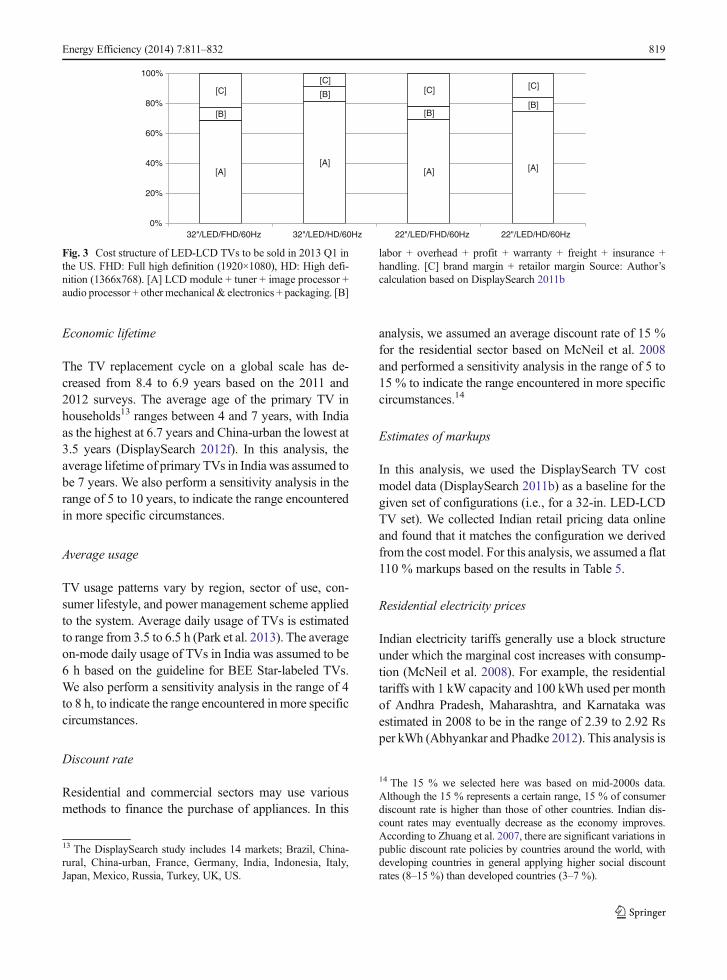
To estimate markups due to the supply chain for TVssold in India, it is useful to compare market prices ofsimilar models between two regions. We selected USand India LED-LCD TV models available from 22–24and 30–34-in. groups of the top five manufacturers(Samsung, Sony, LG, Panasonic, and Toshiba) whoaccounted for about 68 % of the Indian FPD TVmarket.The selected product groups are also expected to ac-count for about 75% of the India TVmarket by 2015. Ingeneral, TV market price consists of three parts; directmanufacturing costs (e.g., material costs), indirectmanufacturing costs (e.g., labor, overhead, freight,etc.), and brand/retailer margins. Direct manufacturingcost is estimated to account for about 70–80 % of theaverage market price in the US market. Fig. 3 shows asimplified version of the DisplaySearch-modeled coststructure of 22- and 32-in. LED-LCD TVs to be sold in2013 Q1 in the US market (DisplaySearch 2011b).
Specification assumptions applied to theDisplaySearch’s TV cost model may not be consistentfor all brands and all models, but the cost model pro-vides an illustrative guide for determining markups. Asdiscussed earlier, manufacturing costs for LCD panelsare nearly the same regardless of region; hence, weassumed TVs with the same brands and specificationsin the US and India share the same direct manufacturingcost (i.e., [A] defined in Fig. 3). Table 5 shows anestimated range of markups of 32-in. LED-LCD TVssold in the US and India.
Cost of conserved electricity
Cost of conserved electricity (CCE) is a metric used toassess the cost-effectiveness of energy efficiency poli-cies. Estimating CCE for a policy option involves cal-culating the cost of saving electricity which can then becompared to the cost of providing electricity, to theutility or consumer.10 We calculate CCE from two per-spectives: First, considering the incremental cost to themanufacturer, which we label CCEm and second, theincremental cost to the consumer which includesmarkups on the incremental manufacturing cost, whichwe label CCEp. The former estimate can be used forassessing the cost-effectiveness of upstream incentiveprograms (e.g., manufacturer incentives), whereas thelatter can be used to assess that of downstream incentive(e.g., consumer incentives) or minimum energy perfor-mance standards (MEPS) programs (Park et al. 2013).
9 North American Free Trade Agreement
10 We do not include program administration and implementationcosts in this cost-effectiveness analysis, as we are assessing cost-effectiveness to the consumer of standards and labeling programsas well as incentive programs.
Table 3 Indian SEAD award-winning models vs. India 5 Stars qualification
Size category Model Brand/ manufacturer On-mode power performance [W/cm2](on-mode power)
Star rating 5 Starsqualification (W)
Small UA26EH4000R Samsung 0.0134 (24.9 W) 82
Medium UA40EH5330R Samsung 0.0107 (47.4 W) 193
Large 47LM6700 LG 0.0071 (43.4 W) 267
Source: Park 2013
India Star Rating requirements are based on annual energy consumption in kWh per year. Assumptions applied to the above table are asfollows: 0.3 W of standby-mode power; 6 h of daily usage
Energy Efficiency (2014) 7:811–832 817
CCE is estimated by dividing the annualized incre-mental cost (IC) that is required to add the efficiencyoption by annual energy savings due to the efficiencyoption. Product categories are defined by screen size andbacklight type (e.g., 32-in. LED-LCD TV). The CCE forthe ith product category is calculated using annualized ICfor the ith product category (ICi) and energy savings forthe ith product category (Energy Savingsi), as follows:
CCEi ¼ annualized ICi
energysavingsið1Þ
where
annualized ICi ¼ ICidiscount rate
1− 1þ discount rateð Þ−lifetimei
" #ð2Þ
EnergySavingsikWh
year
� �¼ Power reduced
watts
unit
� ��
dailyusagehours
day
� �� 365days
year� 1kilowatts
1000wattsð3Þ
where lifetimei is the TVeconomic lifetime, i.e., replace-ment cycle and discount rate of the end user.
All TVs in the ith product category are assumedhomogeneous. Thus, total annual energy savingsfrom the ith product category will be calculatedby Energy Savingsi times the annual sales of theith product category, e.g., annual sales representedby annual shipment of a product category, such as32-in. LED-LCD TVs.
Energy savings
Indian Star Rating is a voluntary labeling program. Starrated TVs (blended with flat-panel TVs and CRT TVs)account for about 20 % of the Indian TV market (Park2013). We estimate energy savings based on the per-centage reduction due to efficiency improvements to thebaseline LCD TV energy consumption which is basedon TVs registered in the US ENERGY STAR databaselisted on February 2013 (ENERGY STAR 2013). Theon-mode power test method11 is based on the interna-tional standard IEC 62087.12 As discussed above, for agiven size, display technology, e.g., a 32-in. LED-LCDTV with 1920×1080 resolution and 60 Hz frame rateprovided by a manufacturer, TVs sold in different re-gions of the world are similar in terms of the technologyand corresponding energy efficiency improvement po-tential, although there are variations within such a prod-uct category. As a result, the information represented byENERGY STAR registered TVs is applicable to India interms of illustrating the efficiency improvement poten-tial possible.
11 This analysis is based on on-mode power data of ENERGYSTAR qualified TVs with ABC disabled or without ABC.12 We do not use automatic brightness control (ABC) weightedon-mode power values of TVs with ABC enabled, but do on-modepower consumption at 300 lux.
LG 33.9%
Videocon24.4%
Samsung 16.7%
Onida13.7%
Others11.3%
Samsung 18.8%
Sony18.4%
LG 17.6%
Videocon16.1%
Onida7.4%
Panasonic7.1%
Toshiba5.9%
Others8.6%
Fig. 2 2011 TV shipmentdistribution in India bybrand—CRTs (left) vs. FPDs(right). Source: DisplaySearch2012a
Table 4 Example of market prices of Samsung EH4000 (26 in.)
Country Model Price (USD)
Australia UA26EH4000M 377
United Kingdom UE26EH4000W 317
United States UN26EH4000F 260
India UA26EH4000R 393
Source: Park 2013
Note: Lowest prices identified from www.getprice.com.au, www.amazon.co.uk, www.amazon.com, compareindia.in.com (as ofAugust 2012)
818 Energy Efficiency (2014) 7:811–832
Economic lifetime
The TV replacement cycle on a global scale has de-creased from 8.4 to 6.9 years based on the 2011 and2012 surveys. The average age of the primary TV inhouseholds13 ranges between 4 and 7 years, with Indiaas the highest at 6.7 years and China-urban the lowest at3.5 years (DisplaySearch 2012f). In this analysis, theaverage lifetime of primary TVs in India was assumed tobe 7 years. We also perform a sensitivity analysis in therange of 5 to 10 years, to indicate the range encounteredin more specific circumstances.
Average usage
TV usage patterns vary by region, sector of use, con-sumer lifestyle, and power management scheme appliedto the system. Average daily usage of TVs is estimatedto range from 3.5 to 6.5 h (Park et al. 2013). The averageon-mode daily usage of TVs in India was assumed to be6 h based on the guideline for BEE Star-labeled TVs.We also perform a sensitivity analysis in the range of 4to 8 h, to indicate the range encountered in more specificcircumstances.
Discount rate
Residential and commercial sectors may use variousmethods to finance the purchase of appliances. In this
analysis, we assumed an average discount rate of 15 %for the residential sector based on McNeil et al. 2008and performed a sensitivity analysis in the range of 5 to15 % to indicate the range encountered in more specificcircumstances.14
Estimates of markups
In this analysis, we used the DisplaySearch TV costmodel data (DisplaySearch 2011b) as a baseline for thegiven set of configurations (i.e., for a 32-in. LED-LCDTV set). We collected Indian retail pricing data onlineand found that it matches the configuration we derivedfrom the cost model. For this analysis, we assumed a flat110 % markups based on the results in Table 5.
Residential electricity prices
Indian electricity tariffs generally use a block structureunder which the marginal cost increases with consump-tion (McNeil et al. 2008). For example, the residentialtariffs with 1 kW capacity and 100 kWh used per monthof Andhra Pradesh, Maharashtra, and Karnataka wasestimated in 2008 to be in the range of 2.39 to 2.92 Rsper kWh (Abhyankar and Phadke 2012). This analysis is
13 The DisplaySearch study includes 14 markets; Brazil, China-rural, China-urban, France, Germany, India, Indonesia, Italy,Japan, Mexico, Russia, Turkey, UK, US.
14 The 15 % we selected here was based on mid-2000s data.Although the 15 % represents a certain range, 15 % of consumerdiscount rate is higher than those of other countries. Indian dis-count rates may eventually decrease as the economy improves.According to Zhuang et al. 2007, there are significant variations inpublic discount rate policies by countries around the world, withdeveloping countries in general applying higher social discountrates (8–15 %) than developed countries (3–7 %).
[A][A]
[A] [A]
[B]
[B]
[B][B]
[C][C]
[C] [C]
0%
20%
40%
60%
80%
100%
32"/LED/FHD/60Hz 32"/LED/HD/60Hz 22"/LED/FHD/60Hz 22"/LED/HD/60Hz
Fig. 3 Cost structure of LED-LCD TVs to be sold in 2013 Q1 inthe US. FHD: Full high definition (1920×1080), HD: High defi-nition (1366x768). [A] LCD module + tuner + image processor +audio processor + other mechanical & electronics + packaging. [B]
labor + overhead + profit + warranty + freight + insurance +handling. [C] brand margin + retailor margin Source: Author’scalculation based on DisplaySearch 2011b
Energy Efficiency (2014) 7:811–832 819
based on the average rate by state based on IndianPower Market 2012.
Product categories analyzed
Although we assess several efficiency improvementoptions and analyze their impact on TV electricity con-sumption, we limit our analysis of cost-effectiveness tothose options which are unlikely to be adopted in theabsence of policy intervention. For example, as low-costLED-direct LCD TVs discussed earlier are energy effi-cient and affordable, the adoption of those products islikely to occur under a business-as-usual (BAU) case.However, even those TVs can be further improved inefficiency with additional options such as advancedoptical films or backlight dimming.
To estimate cost-effectiveness, we selected aproduct group with nominal screen size of 30–34 in. (typical nominal size of 32 in.), representingabout 38–40 % of the India LCD TV market, themajority of which are expected to be manufacturedwithout reflective polarizers or backlight dimmingin the absence of a policy intervention. Theseoptions are currently used primarily for somehigh-end models with screens larger than 40 in.
The results of our analysis for the selected screensize also hold for other screen size categories sincethe costs and benefits of adopting the selectedefficiency improvement options are generally pro-portional to screen area, and thus any size varia-tion does not largely affect cost-effectiveness.Although those options can also be applied toCCFL-LCD TVs, we here focus on LED-LCDTVs as the share of CCFL backlights are expectedto significantly decrease by 2015 as shown inTable 6.
Three options: reflective polarizers, backlight dimming,and ambient light sensors
As discussed in Park et al. 2011 and 2013, areflective polarizer improves TV efficiency by20–30 % regard less of backl ight source .Backlight dimming can reduce LCD TV powerconsumption by 10–60 %, depending on inputimages and dimming methods.15 For example, lo-cal dimming (or 2D dimming) is possible for ear-lier discussed low-cost LED-direct backlights, andthe efficiency improvement potential is estimatedto be up to 50–60 % (Park et al. 2011). Ambient
15 The simplest dimming option is to dim the whole backlight by auniversal amount varying by frame, which is called zero-dimensional (0D), complete, or global dimming. This option canbe applied to all types of backlights. Backlight auto-brightnesscontrol (ABC) can be generally regarded as part of this method.Another option is to dim part of the backlight area depending oninput image, which has two variations; (1) one-dimensional (1D),partial, or line dimming, and (2) two-dimensional (2D) or localdimming (Park et al. 2013).
Table 5 Estimated Range of Markups of 32-in. LED-LCD TVs
Screen size (in.) Backlight/ resolution/frame rate
Country Market price1 (a) ($) Estimated common manufacturingcost2 (b) ($)
að Þ− bð Þbð Þ � 100 (%)
32 LED/FHD/60Hz US 349–628 266 31–136
India 554–878 108–230
LED/HD/60Hz US 298–535 244 22–119
India 506–738 107–202
1 www.amazon.com, compareindia.in.com, www.mysmartprice.com (lowest price among models selected from Samsung, Sony, LG andPanasonic, as of April 2013)2 [A] defined in Fig. 4 (DisplaySearch 2011b)
Table 6 Share of selected product group in the India LCD TVmarket
Backlight CCFL LED
Year 2012 2015 2012 2015
30"–34" 19.4 % 1.1 % 19.4 % 36.7 %
Source: DisplaySearch 2012a
820 Energy Efficiency (2014) 7:811–832
light sensors are commercially available, and theirmaterial cost does not vary with screen size orresolution, implying that cost-effectiveness of thisoption increases with screen size. While backlightdimming in relation to ambient light conditions,i.e., auto-brightness control (ABC), can be gener-ally regarded as part of backlight dimming, moreresearch is needed to estimate the precise effect ofthese options on household TV energy consump-tion. As discussed in Park et al. 2013, the materialcost of an ambient light sensor was in a range of0.6 and $1.0 per unit as of 2012. The total incre-mental cost of ABC for a TV unit with backlightdimming option is estimated to be less than thecost that is required for backlight dimming discussedabove.
In this analysis, the product group (i.e., 32-in.LED-LCDs) selected is estimated to have a CCEm
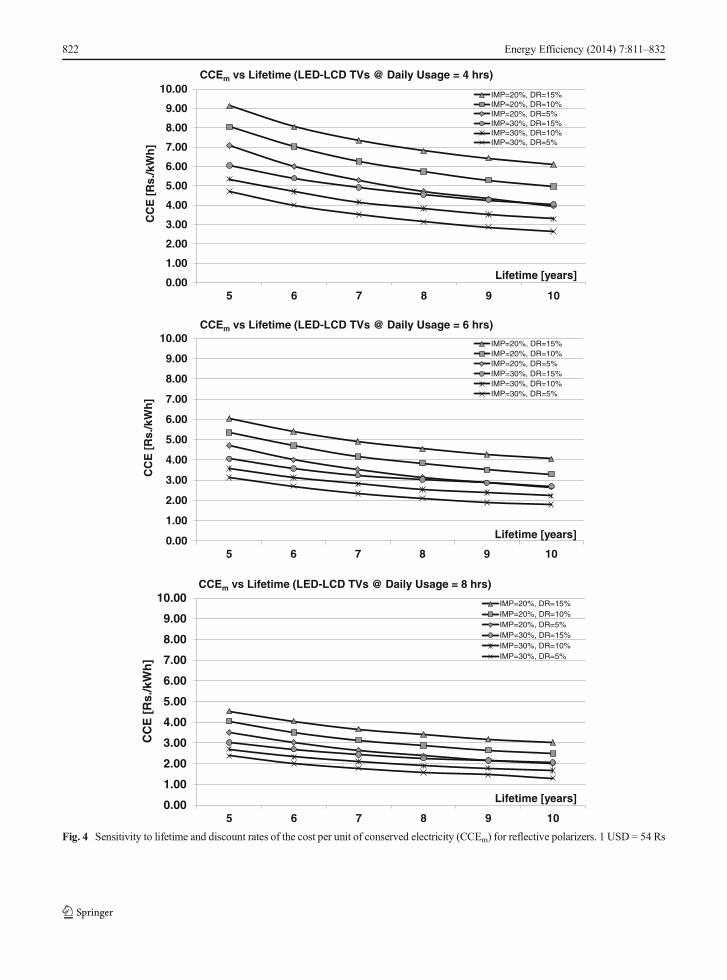
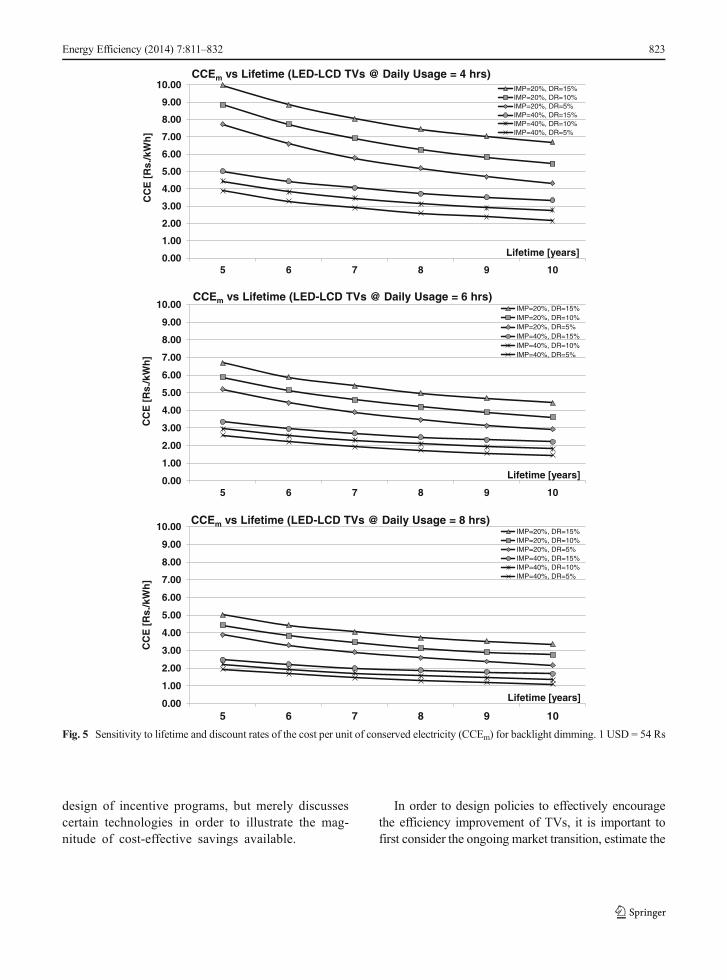
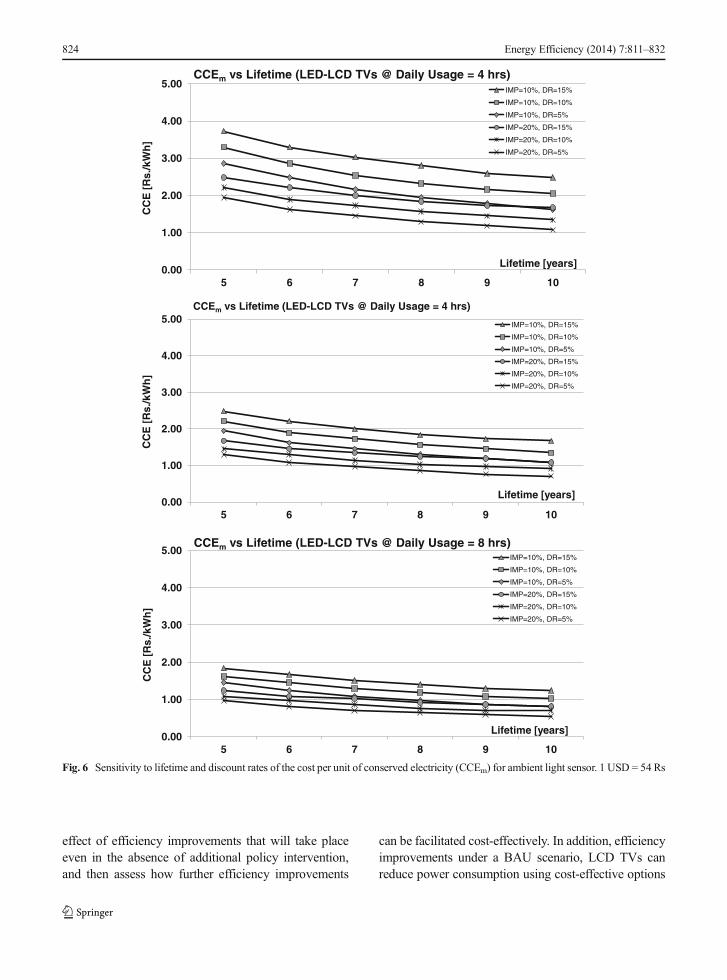
with a range of $0.037 (1.1 Rs) per kWh and$0.100 (5.4 Rs) and a CCEp with a range of$0.079 (4.3 Rs) per kWh and $0.207 (11.2 Rs)for the year 2015, with assumptions of 15 % dis-count rate, 7 years economic lifetime, and 6 h ofdaily usage (see Table 7). For reflective polarizersand backlight dimming, Figs. 4, 5, and 6 showCCEm for LED-LCDs vs. lifetime at various com-binations of discount rates and efficiency improve-ment potential.
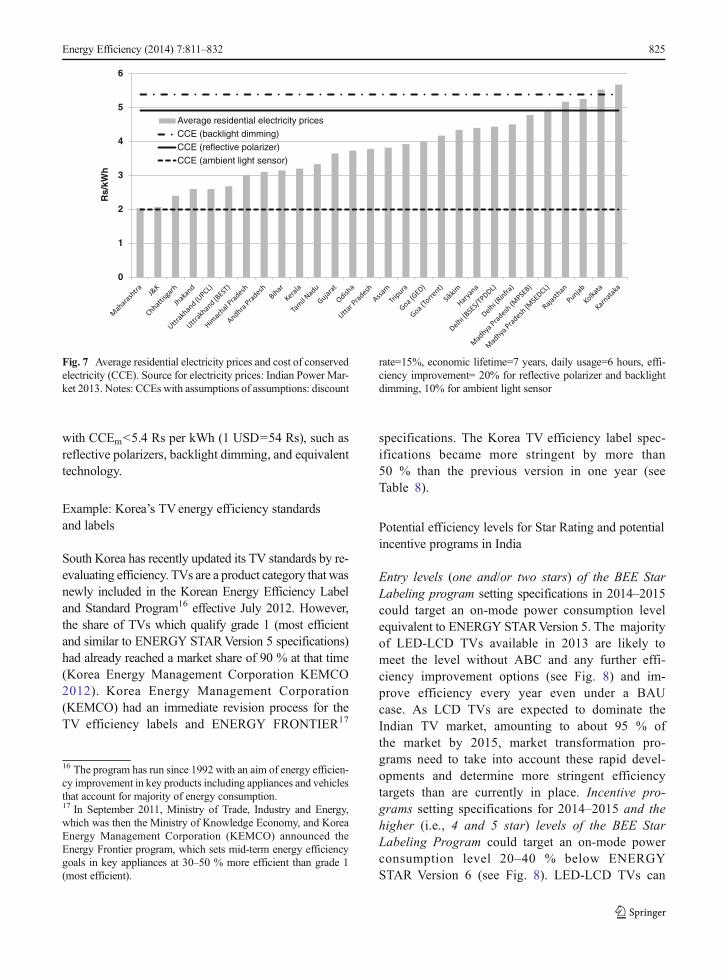
Fig. 7 shows the CCEs for the three technicaloptions compared to residential electricity pricesof many states in India. The results of our sensi-tivity analyses indicate that this result would alsohold under cases where average residential prices(tariffs) are lower than the marginal residentialtariffs (tariff for the last unit consumed which isequivalent to the reduction in consumer bill if oneunit of electricity is saved), or vice versa. Thus,TV efficiency can be cost-effectively improvedbeyond the BAU trajectory using these, or equiv-alent efficiency improvement options.
Policy insights to accelerate adoption of efficienttelevisions
Although we analyzed currently available anddominant technologies in order to identify feasibleand cost-effective efficiency improvement options,there is uncertainty regarding precisely which effi-ciency improvement options will be adopted bymanufacturers to meet efficiency requirements.We do not claim that the selected options are thebest or only efficiency improvement options avail-able. This analysis does not endorse any specifictechnology nor advocate prescription of proprietarytechnology for a standards-setting process or
Table 7 Cost of conserved electricity (CCE)a for selected options with a 32-in. LED-LCD TV (base year 2015)
Screen size ΔPon-modeb
per unit (W)ΔCm
c
per unit ($)CCEm
d
($/kWh)ΔCp
e
per unit ($)CCEp
f
($/kWh)
Reflective polarizer 5.2 W 4.3 0.091 9.0 0.191
Backlight dimming 5.2 W 4.7 0.100 9.8 0.207
Ambient light sensorg 2.1 W 0.7 0.037 1.5 0.079
aAssumptions are discount rate=15 %, economic lifetime=7 years, daily usage=6 h, efficiency improvement=20 % for reflective polarizerand backlight dimming, 10 % for ambient light sensorb Average power saving per unit=(average on-mode power of 2015 standard models estimated by authors)—(estimated average on-modepower of 2015 models with selected option)c Incremental manufacturing cost = (manufacturing cost for 2015 standard models with selected option estimated byauthors)—(manufacturing cost for 2015 standard US models predicted by DisplaySearch)d Cost to the manufacturer of conserved energy which is calculated by Eqs. 1 through 3 at IC=ΔCm
e Incremental price=(price for 2015 standard models with selected option estimated by authors)—(average market price for 2015 standardmodels estimated by authors)f Cost to the final user of conserved energy which is calculated by Eqs. 1 through 3 at IC=ΔCp
g Estimated for TVs with dimming capability
Energy Efficiency (2014) 7:811–832 821
0.00
1.00
2.00
3.00
4.00
5.00
6.00
7.00
8.00
9.00
10.00
5 6 7 8 9 10
CC
E [
Rs.
/kW
h]
Lifetime [years]
CCEm vs Lifetime (LED-LCD TVs @ Daily Usage = 4 hrs)
IMP=20%, DR=15%IMP=20%, DR=10%IMP=20%, DR=5%IMP=30%, DR=15%IMP=30%, DR=10%IMP=30%, DR=5%
0.00
1.00
2.00
3.00
4.00
5.00
6.00
7.00
8.00
9.00
10.00
5 6 7 8 9 10
CC
E [
Rs.
/kW
h]
Lifetime [years]
CCEm vs Lifetime (LED-LCD TVs @ Daily Usage = 6 hrs)
IMP=20%, DR=15%IMP=20%, DR=10%IMP=20%, DR=5%IMP=30%, DR=15%IMP=30%, DR=10%IMP=30%, DR=5%
0.00
1.00
2.00
3.00
4.00
5.00
6.00
7.00
8.00
9.00
10.00
5 6 7 8 9 10
CC
E [
Rs.
/kW
h]
Lifetime [years]
CCEm vs Lifetime (LED-LCD TVs @ Daily Usage = 8 hrs)
IMP=20%, DR=15%IMP=20%, DR=10%IMP=20%, DR=5%IMP=30%, DR=15%IMP=30%, DR=10%IMP=30%, DR=5%
Fig. 4 Sensitivity to lifetime and discount rates of the cost per unit of conserved electricity (CCEm) for reflective polarizers. 1 USD = 54 Rs
822 Energy Efficiency (2014) 7:811–832
design of incentive programs, but merely discussescertain technologies in order to illustrate the mag-nitude of cost-effective savings available.
In order to design policies to effectively encouragethe efficiency improvement of TVs, it is important tofirst consider the ongoing market transition, estimate the
0.00
1.00
2.00
3.00
4.00
5.00
6.00
7.00
8.00
9.00
10.00
5 6 7 8 9 10
CC
E [
Rs.
/kW
h]
Lifetime [years]
CCEm vs Lifetime (LED-LCD TVs @ Daily Usage = 4 hrs)IMP=20%, DR=15%IMP=20%, DR=10%IMP=20%, DR=5%IMP=40%, DR=15%IMP=40%, DR=10%IMP=40%, DR=5%
0.00
1.00
2.00
3.00
4.00
5.00
6.00
7.00
8.00
9.00
10.00
5 6 7 8 9 10
CC
E [
Rs.
/kW
h]
Lifetime [years]
CCEm vs Lifetime (LED-LCD TVs @ Daily Usage = 6 hrs)IMP=20%, DR=15%IMP=20%, DR=10%IMP=20%, DR=5%IMP=40%, DR=15%IMP=40%, DR=10%IMP=40%, DR=5%
0.00
1.00
2.00
3.00
4.00
5.00
6.00
7.00
8.00
9.00
10.00
5 6 7 8 9 10
CC
E [
Rs.
/kW
h]
Lifetime [years]
CCEm vs Lifetime (LED-LCD TVs @ Daily Usage = 8 hrs)IMP=20%, DR=15%IMP=20%, DR=10%IMP=20%, DR=5%IMP=40%, DR=15%IMP=40%, DR=10%IMP=40%, DR=5%
Fig. 5 Sensitivity to lifetime and discount rates of the cost per unit of conserved electricity (CCEm) for backlight dimming. 1 USD = 54 Rs
Energy Efficiency (2014) 7:811–832 823
effect of efficiency improvements that will take placeeven in the absence of additional policy intervention,and then assess how further efficiency improvements
can be facilitated cost-effectively. In addition, efficiencyimprovements under a BAU scenario, LCD TVs canreduce power consumption using cost-effective options
0.00
1.00
2.00
3.00
4.00
5.00
5 6 7 8 9 10
CC
E [
Rs.
/kW
h]
Lifetime [years]
CCEm vs Lifetime (LED-LCD TVs @ Daily Usage = 4 hrs)IMP=10%, DR=15%
IMP=10%, DR=10%
IMP=10%, DR=5%
IMP=20%, DR=15%
IMP=20%, DR=10%
IMP=20%, DR=5%
0.00
1.00
2.00
3.00
4.00
5.00
5 6 7 8 9 10
CC
E [
Rs.
/kW
h]
Lifetime [years]
CCEm vs Lifetime (LED-LCD TVs @ Daily Usage = 4 hrs)
IMP=10%, DR=15%
IMP=10%, DR=10%
IMP=10%, DR=5%
IMP=20%, DR=15%
IMP=20%, DR=10%
IMP=20%, DR=5%
0.00
1.00
2.00
3.00
4.00
5.00
5 6 7 8 9 10
CC
E [
Rs.
/kW
h]
Lifetime [years]
CCEm vs Lifetime (LED-LCD TVs @ Daily Usage = 8 hrs)IMP=10%, DR=15%
IMP=10%, DR=10%
IMP=10%, DR=5%
IMP=20%, DR=15%
IMP=20%, DR=10%
IMP=20%, DR=5%
Fig. 6 Sensitivity to lifetime and discount rates of the cost per unit of conserved electricity (CCEm) for ambient light sensor. 1 USD = 54 Rs
824 Energy Efficiency (2014) 7:811–832
with CCEm<5.4 Rs per kWh (1 USD=54 Rs), such asreflective polarizers, backlight dimming, and equivalenttechnology.
Example: Korea’s TVenergy efficiency standardsand labels
South Korea has recently updated its TV standards by re-evaluating efficiency. TVs are a product category that wasnewly included in the Korean Energy Efficiency Labeland Standard Program16 effective July 2012. However,the share of TVs which qualify grade 1 (most efficientand similar to ENERGY STARVersion 5 specifications)had already reached a market share of 90 % at that time(Korea Energy Management Corporation KEMCO2012). Korea Energy Management Corporation(KEMCO) had an immediate revision process for theTV efficiency labels and ENERGY FRONTIER17
specifications. The Korea TV efficiency label spec-ifications became more stringent by more than50 % than the previous version in one year (seeTable 8).
Potential efficiency levels for Star Rating and potentialincentive programs in India
Entry levels (one and/or two stars) of the BEE StarLabeling program setting specifications in 2014–2015could target an on-mode power consumption levelequivalent to ENERGY STARVersion 5. The majorityof LED-LCD TVs available in 2013 are likely tomeet the level without ABC and any further effi-ciency improvement options (see Fig. 8) and im-prove efficiency every year even under a BAUcase. As LCD TVs are expected to dominate theIndian TV market, amounting to about 95 % ofthe market by 2015, market transformation pro-grams need to take into account these rapid devel-opments and determine more stringent efficiencytargets than are currently in place. Incentive pro-grams setting specifications for 2014–2015 and thehigher (i.e., 4 and 5 star) levels of the BEE StarLabeling Program could target an on-mode powerconsumption level 20–40 % below ENERGYSTAR Version 6 (see Fig. 8). LED-LCD TVs can
16 The program has run since 1992 with an aim of energy efficien-cy improvement in key products including appliances and vehiclesthat account for majority of energy consumption.17 In September 2011, Ministry of Trade, Industry and Energy,which was then the Ministry of Knowledge Economy, and KoreaEnergy Management Corporation (KEMCO) announced theEnergy Frontier program, which sets mid-term energy efficiencygoals in key appliances at 30–50 % more efficient than grade 1(most efficient).
0
1
2
3
4
5
6
Rs/
kWh
Average residential electricity pricesCCE (backlight dimming)CCE (reflective polarizer)CCE (ambient light sensor)
Fig. 7 Average residential electricity prices and cost of conservedelectricity (CCE). Source for electricity prices: Indian Power Mar-ket 2013. Notes: CCEs with assumptions of assumptions: discount
rate=15%, economic lifetime=7 years, daily usage=6 hours, effi-ciency improvement= 20% for reflective polarizer and backlightdimming, 10% for ambient light sensor
Energy Efficiency (2014) 7:811–832 825
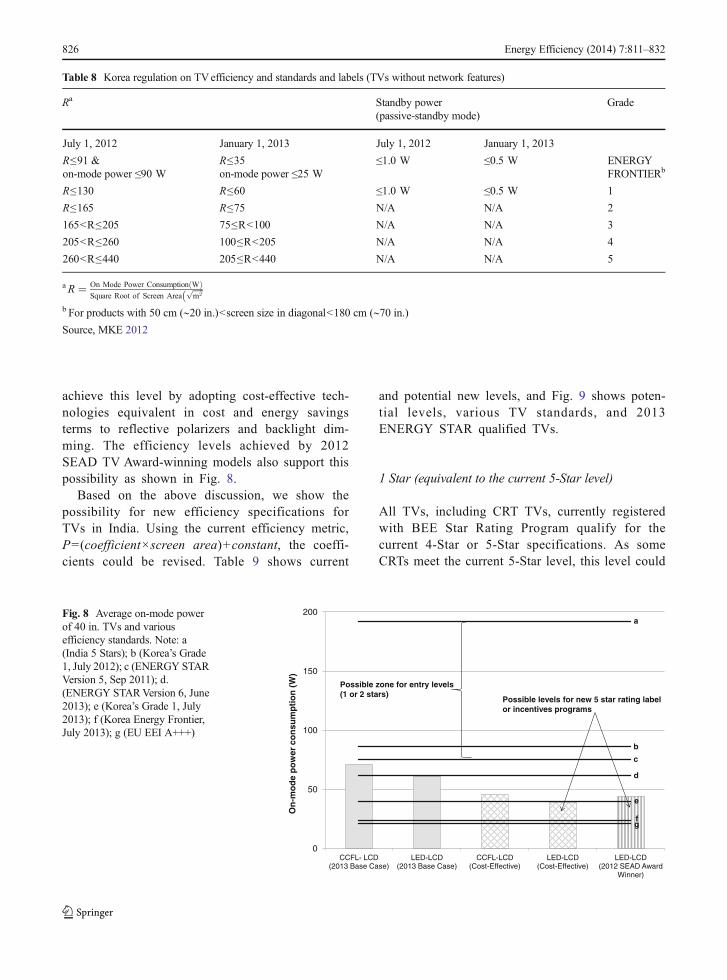
achieve this level by adopting cost-effective tech-nologies equivalent in cost and energy savingsterms to reflective polarizers and backlight dim-ming. The efficiency levels achieved by 2012SEAD TV Award-winning models also support thispossibility as shown in Fig. 8.
Based on the above discussion, we show thepossibility for new efficiency specifications forTVs in India. Using the current efficiency metric,P=(coefficient×screen area)+constant, the coeffi-cients could be revised. Table 9 shows current
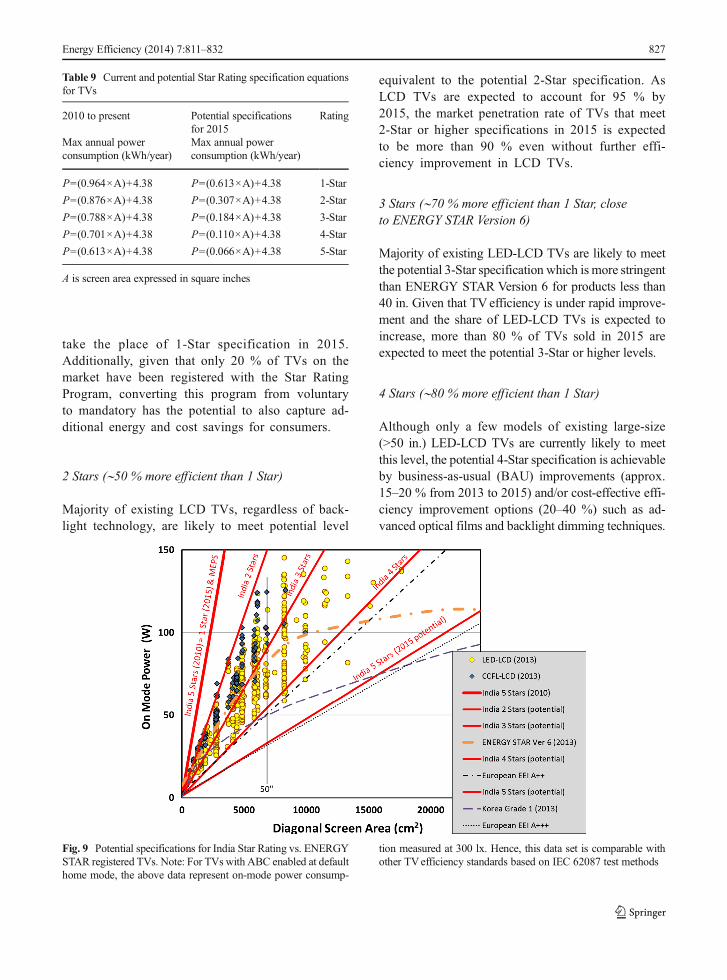
and potential new levels, and Fig. 9 shows poten-tial levels, various TV standards, and 2013ENERGY STAR qualified TVs.
1 Star (equivalent to the current 5-Star level)
All TVs, including CRT TVs, currently registeredwith BEE Star Rating Program qualify for thecurrent 4-Star or 5-Star specifications. As someCRTs meet the current 5-Star level, this level could
Table 8 Korea regulation on TVefficiency and standards and labels (TVs without network features)
Ra Standby power(passive-standby mode)
Grade
July 1, 2012 January 1, 2013 July 1, 2012 January 1, 2013
R≤91 &on-mode power ≤90 W
R≤35on-mode power ≤25 W
≤1.0 W ≤0.5 W ENERGYFRONTIERb
R≤130 R≤60 ≤1.0 W ≤0.5 W 1
R≤165 R≤75 N/A N/A 2
165<R≤205 75≤R<100 N/A N/A 3
205<R≤260 100≤R<205 N/A N/A 4
260<R≤440 205≤R<440 N/A N/A 5
aR ¼ On Mode Power Consumption Wð ÞSquare Root of Screen Area
ffiffiffiffiffim2
pðb For products with 50 cm (∼20 in.)<screen size in diagonal<180 cm (∼70 in.)Source, MKE 2012
0
50
100
150
200
CCFL- LCD (2013 Base Case)
LED-LCD (2013 Base Case)
CCFL-LCD (Cost-Effective)
LED-LCD (Cost-Effective)
LED-LCD (2012 SEAD Award
Winner)
On
-mo
de
po
wer
co
nsu
mp
tio
n (
W)
Possible zone for entry levels (1 or 2 stars)
Possible levels for new 5 star rating label or incentives programs
a
b
c
d
e
fg
Fig. 8 Average on-mode powerof 40 in. TVs and variousefficiency standards. Note: a(India 5 Stars); b (Korea’s Grade1, July 2012); c (ENERGY STARVersion 5, Sep 2011); d.(ENERGY STARVersion 6, June2013); e (Korea’s Grade 1, July2013); f (Korea Energy Frontier,July 2013); g (EU EEI A+++)
826 Energy Efficiency (2014) 7:811–832
take the place of 1-Star specification in 2015.Additionally, given that only 20 % of TVs on themarket have been registered with the Star RatingProgram, converting this program from voluntaryto mandatory has the potential to also capture ad-ditional energy and cost savings for consumers.
2 Stars (∼50 % more efficient than 1 Star)
Majority of existing LCD TVs, regardless of back-light technology, are likely to meet potential level
equivalent to the potential 2-Star specification. AsLCD TVs are expected to account for 95 % by2015, the market penetration rate of TVs that meet2-Star or higher specifications in 2015 is expectedto be more than 90 % even without further effi-ciency improvement in LCD TVs.
3 Stars (∼70 % more efficient than 1 Star, closeto ENERGY STAR Version 6)
Majority of existing LED-LCD TVs are likely to meetthe potential 3-Star specification which is more stringentthan ENERGY STAR Version 6 for products less than40 in. Given that TVefficiency is under rapid improve-ment and the share of LED-LCD TVs is expected toincrease, more than 80 % of TVs sold in 2015 areexpected to meet the potential 3-Star or higher levels.
4 Stars (∼80 % more efficient than 1 Star)
Although only a few models of existing large-size(>50 in.) LED-LCD TVs are currently likely to meetthis level, the potential 4-Star specification is achievableby business-as-usual (BAU) improvements (approx.15–20 % from 2013 to 2015) and/or cost-effective effi-ciency improvement options (20–40 %) such as ad-vanced optical films and backlight dimming techniques.
Table 9 Current and potential Star Rating specification equationsfor TVs
2010 to present Potential specificationsfor 2015
Rating
Max annual powerconsumption (kWh/year)
Max annual powerconsumption (kWh/year)
P=(0.964×A)+4.38 P=(0.613×A)+4.38 1-Star
P=(0.876×A)+4.38 P=(0.307×A)+4.38 2-Star
P=(0.788×A)+4.38 P=(0.184×A)+4.38 3-Star
P=(0.701×A)+4.38 P=(0.110×A)+4.38 4-Star
P=(0.613×A)+4.38 P=(0.066×A)+4.38 5-Star
A is screen area expressed in square inches
Fig. 9 Potential specifications for India Star Rating vs. ENERGYSTAR registered TVs. Note: For TVs with ABC enabled at defaulthome mode, the above data represent on-mode power consump-
tion measured at 300 lx. Hence, this data set is comparable withother TVefficiency standards based on IEC 62087 test methods
Energy Efficiency (2014) 7:811–832 827
5 Stars (∼90 % more efficient than 1 Star, close to EUEnergy Efficiency Index (EEI) A+++)
No currently commercially available TVs are estimatedtomeet this level. This is the level that can be achieved ifmost efficient models of existing TVs (i.e., TVs barelyqualified for 4 Stars) are improved by 40 %.
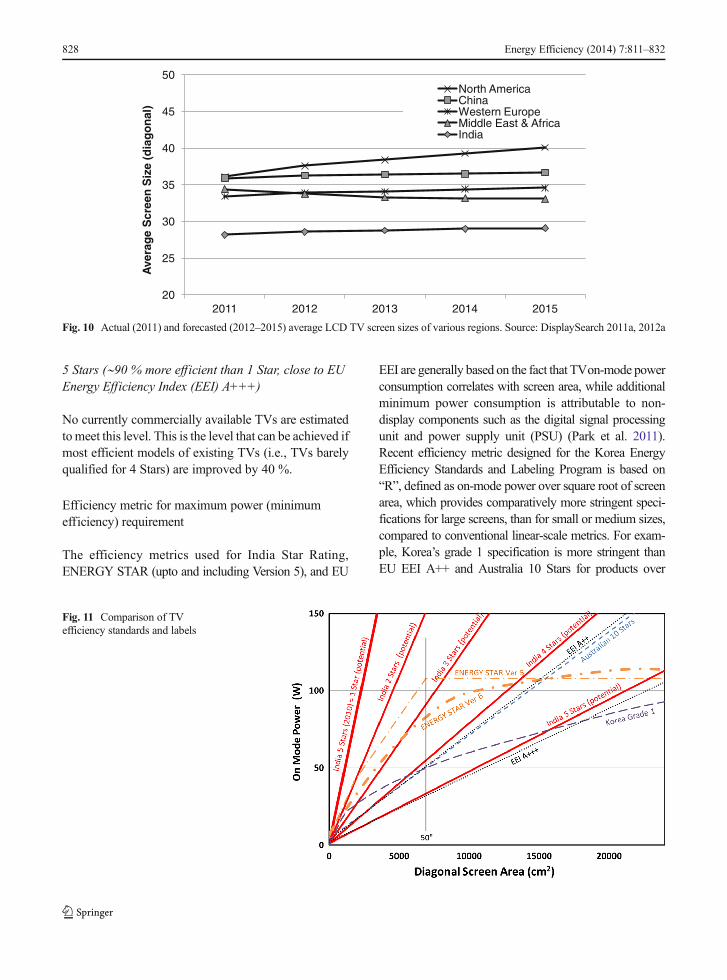
Efficiency metric for maximum power (minimumefficiency) requirement
The efficiency metrics used for India Star Rating,ENERGY STAR (upto and including Version 5), and EU
EEI are generally based on the fact that TVon-mode powerconsumption correlates with screen area, while additionalminimum power consumption is attributable to non-display components such as the digital signal processingunit and power supply unit (PSU) (Park et al. 2011).Recent efficiency metric designed for the Korea EnergyEfficiency Standards and Labeling Program is based on“R”, defined as on-mode power over square root of screenarea, which provides comparatively more stringent speci-fications for large screens, than for small or medium sizes,compared to conventional linear-scale metrics. For exam-ple, Korea’s grade 1 specification is more stringent thanEU EEI A++ and Australia 10 Stars for products over
Fig. 11 Comparison of TVefficiency standards and labels
20
25
30
35
40
45
50
2011 2012 2013 2014 2015
Ave
rag
e S
cree
n S
ize
(dia
go
nal
)
North AmericaChinaWestern EuropeMiddle East & AfricaIndia
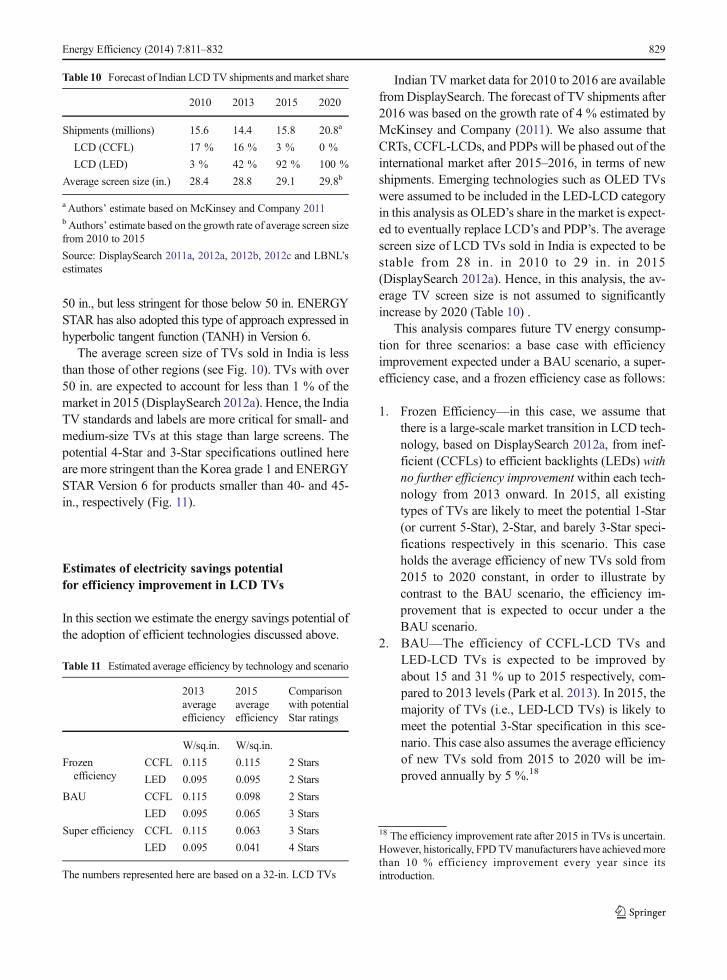
Fig. 10 Actual (2011) and forecasted (2012–2015) average LCD TV screen sizes of various regions. Source: DisplaySearch 2011a, 2012a
828 Energy Efficiency (2014) 7:811–832
50 in., but less stringent for those below 50 in. ENERGYSTAR has also adopted this type of approach expressed inhyperbolic tangent function (TANH) in Version 6.
The average screen size of TVs sold in India is lessthan those of other regions (see Fig. 10). TVs with over50 in. are expected to account for less than 1 % of themarket in 2015 (DisplaySearch 2012a). Hence, the IndiaTV standards and labels are more critical for small- andmedium-size TVs at this stage than large screens. Thepotential 4-Star and 3-Star specifications outlined hereare more stringent than the Korea grade 1 and ENERGYSTAR Version 6 for products smaller than 40- and 45-in., respectively (Fig. 11).
Estimates of electricity savings potentialfor efficiency improvement in LCD TVs
In this section we estimate the energy savings potential ofthe adoption of efficient technologies discussed above.
Indian TV market data for 2010 to 2016 are availablefrom DisplaySearch. The forecast of TV shipments after2016 was based on the growth rate of 4 % estimated byMcKinsey and Company (2011). We also assume thatCRTs, CCFL-LCDs, and PDPs will be phased out of theinternational market after 2015–2016, in terms of newshipments. Emerging technologies such as OLED TVswere assumed to be included in the LED-LCD categoryin this analysis as OLED’s share in the market is expect-ed to eventually replace LCD’s and PDP’s. The averagescreen size of LCD TVs sold in India is expected to bestable from 28 in. in 2010 to 29 in. in 2015(DisplaySearch 2012a). Hence, in this analysis, the av-erage TV screen size is not assumed to significantlyincrease by 2020 (Table 10) .
This analysis compares future TV energy consump-tion for three scenarios: a base case with efficiencyimprovement expected under a BAU scenario, a super-efficiency case, and a frozen efficiency case as follows:
1. Frozen Efficiency—in this case, we assume thatthere is a large-scale market transition in LCD tech-nology, based on DisplaySearch 2012a, from inef-ficient (CCFLs) to efficient backlights (LEDs) withno further efficiency improvement within each tech-nology from 2013 onward. In 2015, all existingtypes of TVs are likely to meet the potential 1-Star(or current 5-Star), 2-Star, and barely 3-Star speci-fications respectively in this scenario. This caseholds the average efficiency of new TVs sold from2015 to 2020 constant, in order to illustrate bycontrast to the BAU scenario, the efficiency im-provement that is expected to occur under a theBAU scenario.
2. BAU—The efficiency of CCFL-LCD TVs andLED-LCD TVs is expected to be improved byabout 15 and 31 % up to 2015 respectively, com-pared to 2013 levels (Park et al. 2013). In 2015, themajority of TVs (i.e., LED-LCD TVs) is likely tomeet the potential 3-Star specification in this sce-nario. This case also assumes the average efficiencyof new TVs sold from 2015 to 2020 will be im-proved annually by 5 %.18
18 The efficiency improvement rate after 2015 in TVs is uncertain.However, historically, FPD TVmanufacturers have achievedmorethan 10 % efficiency improvement every year since itsintroduction.
Table 10 Forecast of Indian LCDTV shipments andmarket share
2010 2013 2015 2020
Shipments (millions) 15.6 14.4 15.8 20.8a
LCD (CCFL) 17 % 16 % 3 % 0 %
LCD (LED) 3 % 42 % 92 % 100 %
Average screen size (in.) 28.4 28.8 29.1 29.8b
a Authors’ estimate based on McKinsey and Company 2011bAuthors’ estimate based on the growth rate of average screen sizefrom 2010 to 2015
Source: DisplaySearch 2011a, 2012a, 2012b, 2012c and LBNL’sestimates
Table 11 Estimated average efficiency by technology and scenario
2013averageefficiency
2015averageefficiency
Comparisonwith potentialStar ratings
W/sq.in. W/sq.in.
Frozenefficiency
CCFL 0.115 0.115 2 Stars
LED 0.095 0.095 2 Stars
BAU CCFL 0.115 0.098 2 Stars
LED 0.095 0.065 3 Stars
Super efficiency CCFL 0.115 0.063 3 Stars
LED 0.095 0.041 4 Stars
The numbers represented here are based on a 32-in. LCD TVs
Energy Efficiency (2014) 7:811–832 829
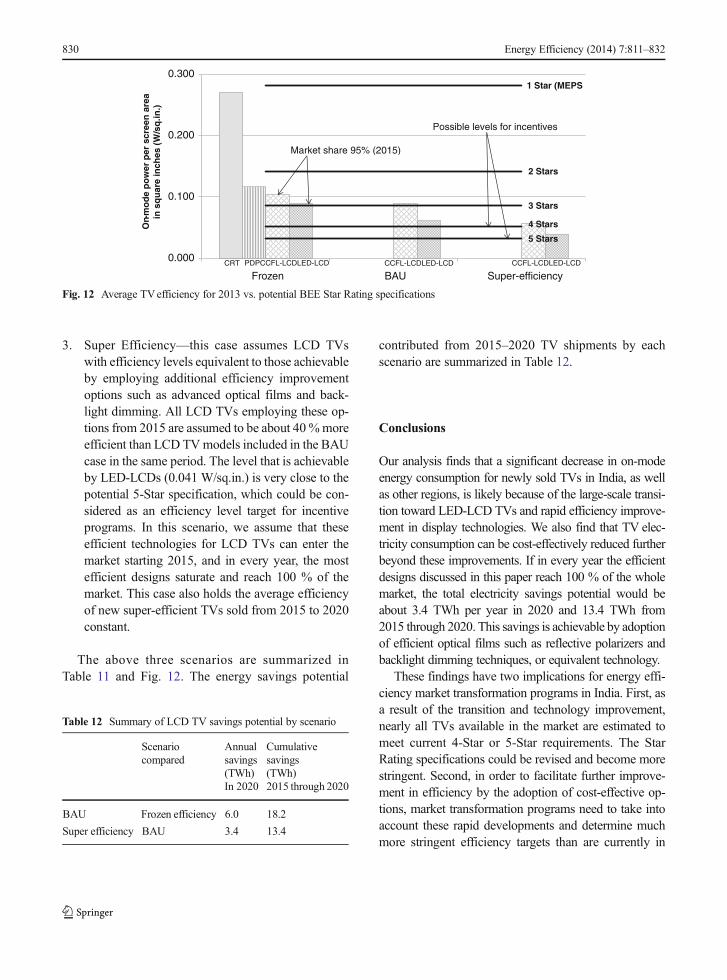
3. Super Efficiency—this case assumes LCD TVswith efficiency levels equivalent to those achievableby employing additional efficiency improvementoptions such as advanced optical films and back-light dimming. All LCD TVs employing these op-tions from 2015 are assumed to be about 40 %moreefficient than LCD TVmodels included in the BAUcase in the same period. The level that is achievableby LED-LCDs (0.041 W/sq.in.) is very close to thepotential 5-Star specification, which could be con-sidered as an efficiency level target for incentiveprograms. In this scenario, we assume that theseefficient technologies for LCD TVs can enter themarket starting 2015, and in every year, the mostefficient designs saturate and reach 100 % of themarket. This case also holds the average efficiencyof new super-efficient TVs sold from 2015 to 2020constant.
The above three scenarios are summarized inTable 11 and Fig. 12. The energy savings potential
contributed from 2015–2020 TV shipments by eachscenario are summarized in Table 12.
Conclusions
Our analysis finds that a significant decrease in on-modeenergy consumption for newly sold TVs in India, as wellas other regions, is likely because of the large-scale transi-tion toward LED-LCD TVs and rapid efficiency improve-ment in display technologies. We also find that TV elec-tricity consumption can be cost-effectively reduced furtherbeyond these improvements. If in every year the efficientdesigns discussed in this paper reach 100 % of the wholemarket, the total electricity savings potential would beabout 3.4 TWh per year in 2020 and 13.4 TWh from2015 through 2020. This savings is achievable by adoptionof efficient optical films such as reflective polarizers andbacklight dimming techniques, or equivalent technology.
These findings have two implications for energy effi-ciency market transformation programs in India. First, asa result of the transition and technology improvement,nearly all TVs available in the market are estimated tomeet current 4-Star or 5-Star requirements. The StarRating specifications could be revised and become morestringent. Second, in order to facilitate further improve-ment in efficiency by the adoption of cost-effective op-tions, market transformation programs need to take intoaccount these rapid developments and determine muchmore stringent efficiency targets than are currently in
CRT PDPCCFL-LCDLED-LCD CCFL-LCDLED-LCD CCFL-LCDLED-LCD
5 Stars
4 Stars
3 Stars
2 Stars
1 Star (MEPS)
0.000
0.100
0.200
0.300
Frozen BAU Super-efficiency
On-
mo
de
po
wer
per
scr
een
are
a in
sq
uar
e in
ches
(W
/sq
.in.)
Possible levels for incentives
Market share 95% (2015)
Fig. 12 Average TVefficiency for 2013 vs. potential BEE Star Rating specifications
Table 12 Summary of LCD TV savings potential by scenario
Scenariocompared
Annualsavings(TWh)
Cumulativesavings(TWh)
In 2020 2015 through 2020
BAU Frozen efficiency 6.0 18.2
Super efficiency BAU 3.4 13.4
830 Energy Efficiency (2014) 7:811–832
place. The savings potential estimated in this study maybe difficult to capture fully, given the long time it cansometimes take to develop and adopt energy efficiencyprograms. However, a short-term policy action based onthe reliable results presented here can make a differencegiven that the average economic life time of TVs is about6–10 years. Furthermore, our results also highlight theopen question of the appropriate policy tool to capturethese savings fully in a rapidly evolving market. Furtherresearch is necessary to address this question fully.
Acknowledgements This work was funded by the Bureau ofOceans and International Environmental and Scientific Affairs,U.S. Department of State, and administered by the U.S. Departmentof Energy in support of the Super-efficient Equipment and Appli-ance Deployment (SEAD) Initiative through the U.S. Department ofEnergy under Contract No. DE-AC02-05CH11231. Any errors oromissions are the authors’ own.
Open Access This article is distributed under the terms of theCreative Commons Attribution License which permits any use,distribution, and reproduction in any medium, provided the orig-inal author(s) and the source are credited.
References
Abhyankar, N., & Phadke, A. (2012). Impact of large-scale energyefficiency programs on utility finances and consumer tariffsin India. Energy Policy, 43(2012), 308–326.
McKinsey and Company (2011). Lighting the way: perspectiveson the global lighting market. Edn. 1.
McKinsey and Company (2012). Lighting the way: perspectiveson the global lighting market. Edn. 2.
de la Rue du Can et al. (2009). India energy outlook: end usedemand in India to 2020. Lawrence Berkeley NationalLaboratory. LBNL-1751E.
DisplaySearch (2009). India TV market data. Provided byDisplaySearch for the exclusive use only for this study.
DisplaySearch (2010). Quarterly advanced global TV shipmentand forecast report. First quarter 2010.
DisplaySearch (2011a). Quarterly advanced global TV shipmentand forecast report. Fourth quarter 2011.
DisplaySearch (2011b). Quarterly TV cost & price forecast modelreport. Fourth quarter, 2011.
DisplaySearch (2012a). Quarterly India TV shipment and forecastdatabase. Third quarter 2011.
DisplaySearch (2012b). Quarterly global TV shipment and fore-cast report. Third quarter, 2012.
DisplaySearch (2012c). DisplaySearch’s comments on estimatedmar-ket share of LED backlit LCD TVs in India from 2011 to 2013.
DisplaySearch (2012d). DisplaySearch’s comments on import du-ty for LCD TVs in India.
DisplaySearch (2012e). 2012 TV replacement study for India.Presentation slides. DisplaySearch.
DisplaySearch (2012f). Global TV replacement cycle falls below7 years, as households continue to replace older CRT TVs andupgrade to larger flat panel sets. http://www.displaysearch.com/pdf/120529_global_tv_replacement_cycle_falls_below_7_years_as_households_continue_to_replace.pdf.
ENERGY STAR (2013). List of ENERGY STAR qualified TVs.Access on Feb 15, 2013.
Ghosh, I. (2009). Indian government reduces import duty on LCDpanel. July. http://www.displaysearchblog.com/2009/07/indian-government-reduces-import-duty-on-lcd-panel/.
Ghosh, I. (2012a). TV brands in India struggle with slow growthand a weak rupee—is direct LED the solution? May. http://www.displaysearchblog.com/2012/05/tv-brands-in-india-struggle-with-slow-growth-and-a-weak-rupee-is-direct-led-the-solution/.
Ghosh, I. (2012b). LCD TV panels to attract zero import duty.March. http://www.displaysearchblog.com/2012/03/lcd-tv-panels-to-attract-zero-import-duty/.
Hindu Business Line (2012). LG bets big on 3D display panels.News article. http://www.thehindubusinessline.com/industry-and-economy/marketing/lg-bets-big-on-3d-display-panels/article4064497.ece.
LG India (2012). LG, the leader in Indian TV market plans tooccupy 50 % of 3DTVmarket share. May. http://lgindiablog.com/?p=1254.
India Power Market (2012). Electricity prices in different states ofIndia. September. http://www.indianpowermarket.com/2012/09/electricity-prices-in-different-states.html.
International Energy Agency (IEA). (2009). Gadgets and giga-watts—policies for energy efficient electronics. http://www.iea.org/textbase/nppdf/free/2009/gigawatts2009.pdf.
Kim, J. (2012). Lower-cost LED backlights darken CCFL’sfuture. DisplaySearch. May. http://www.electroiq.com/articles/sst/2012/05/lower-cost-led-backlights-darken-ccfl-future.html.
Korea Energy Management Corporation (KEMCO) (2012).KEMCO’s comment on market share of Grade 1 qualifiedTVs. August.
McNeil, M. A., et al. (2008). Potential benefits from improvedenergy efficiency of key electrical products: the case of India.Energy Policy, 36(2008), 3467–3476.
Ministry of Knowledge Economy (MKE) Korea (2012). Revisionof energy efficiency standards and labels.
Mlot, S. (2013). LG shipping $10,000 55-inch OLED TV nextmonth. PCMAG.COM. News article. http://www.pcmag.com/article2/0,2817,2413745,00.asp.
Morrod, T. (2012). Global television shipments to shrink in2012—shipment growth won’t return until 2015. October.IHS iSuppli. http://www.isuppli.com/Display-Materials-and-Systems/MarketWatch/Pages/Global-Television-Shipments-to-Shrink-in-2012.aspx.
Park, W.Y. (2013). Assessment of 2012 Global Energy Efficiencymedal for televisions. Super-efficient Equipment andAppliance Deployment (SEAD) Initiative. Clean EnergyMinisterial. April. http://www.superefficient.org/en/Activities/~/media/Files/Assessment%20of%20SEAD%20Global%20Efficiency%20Medals%20for%20TVs_FINAL.pdf.
Energy Efficiency (2014) 7:811–832 831
Park et al. (2011). TV energy consumption trends and energy-efficiency improvement options. Lawrence BerkeleyNational Laboratory. LBNL-5024E. July. http://www.superefficient.org/Activities/Technical%20Analysis/SEAD%20TV%20Analysis.aspx.
Park, W. Y., et al. (2013). Efficiency improvement opportunities inTVs: Implications for market transformation programs.Energy Policy, 59, 361–372.
Prabhudesai, A. (2012). Indian smart TV market to reach Rs.54000 Crore by 2017. October. http://trak.in/tags/business/2012/10/23/indian-smart-tv-market-growth/.
Semenza, P. (2011). The TVof the future. Society for InformationDisplay (SID), Information Display, Nov–Dec.
Shieh, H.D., et al. (2009). Eco-display—an LCDTV powered by abattery? National Chiao Tung University, Taiwan. Society forINFORMATION Display (SID).
SiliconIndia (2011). Will 3D TV click in Indian market? April.News article. http://www.siliconindia.com/shownews/Will_3D_TV_click_in_Indian_market-nid-81977-cid-2.html.
United States Department of Energy (USDOE) (2012). Television3D mode da t a h t t p : / /www. r egu l a t i o n s . gov / #!documentDetail;D=EERE-2010-BT-TP-0026-0033.
Zhuang et al. (2007). ERD working paper series no. 94:theory and practice in the choice of social discount ratefor cost-benefit analysis: a survey. Asian DevelopmentBank.
832 Energy Efficiency (2014) 7:811–832