Embed Size (px)
Citation preview
EFFICIENCY AND PRODUCTIVITY GROWTH OF
THE BANKING SECTOR IN JORDAN
AMMAR BARHAM JREISAT
B.C (Finance & Banking)
M.C (Finance & Banking)
A thesis submitted in fulfilment of the requirements for the degree of Doctor of Philosophy
School of Economics and Finance
University of Western Sydney
Australia
August 2011

i
DEDICATION
I express my deep and sincere gratitude to my father, Barham Jreisat and mother,
Martha Jreisat, who made every possible efforts to provide me right education. I
dedicate this thesis to them.
I want to thank you for your endless support loving and infinite sacrifices that made
it possible for me to reach this stage of my life; without them the road to success
would have been much more difficult. My debt to you is beyond measure. I have the
utmost love and respect for you and hope that this significant achievement may bring
you much happiness in return for your sacrifices. I also take this opportunity to
express my gratitude to my two brothers, Atef and Amer and two sisters, Randa and
Rana and other family members, for their support, love and kindness.

ii
ACKNOWLEDGEMENTS
I would like to express my deepest gratitude to my supervisor, Professor Satya Paul,
for his excellent guidance and supervision and unconditional support, which were
crucial in completing this thesis. His support was not only confined to research but
also to all academic and personal matters. He took great pains in checking my
writing; because of him, this thesis is readable. He is an example of an ideal
supervisor, an excellent teacher, a brilliant academician, and a kind hearted person
whose character I aspire to follow.
I am grateful to my co-supervisor, Dr Anil Mishra, for his continuous
encouragement, support and assistance during the course of this study. My thanks are
also due to my other co-supervisor, Associate Professor Kevin Daly, for his help and
encouragement.
I also wish to thank Dr Sriram Shankar for his help in explaining a number of
technical issues related to my research. My special thanks go to Dr Khaled
Kourouche for his help and support during the early stages of this study.
This thesis has been written on a full-time basis. All expenses were met by my
parents to whom I am very grateful. I am thankful to the staff of several banks in
Jordon for their help and cooperation in providing me the data required for this

iii
thesis. My special thanks to my dear friend Malik Al-Balbesy for providing a part of
the data.
I would also like to express my cordial gratitude to Professor John Lodewijks for his
support as Head of the School of Economics and Finance, and Dr. John Ablett for
providing me with teaching opportunities during the course of this research. My
sincere appreciation to Professor Bobby Banerjee for his support and encouragement
as Associate Dean of Research at the College of Business.
Last but not least, I would like to extend my gratitude to my dearest friends and
colleagues, Gazi Hassan, Hisham Al Refai, Mustafa Rahman, Zahid Hasan and many
more for their friendship, encouragement and support. Because of them, I did not feel
lonely when I was struggling with my research. I also learned a lot from their
experience. They have my true appreciation. Finally, I wish to thank Dr Margaret
Johnson of The Book Doctor for professionally editing the thesis.

iv
STATEMENT OF AUTHENTICATION
The work presented in this thesis is, to the best of my knowledge and belief, original
except as acknowledged in the text. I hereby declare that I have not submitted this
material, either in whole or in part, for a degree at this or any other institution. From
the research conducted in this thesis, I have published several papers and presented at
national and international conferences. The details of these are as follows:
Jreisat, A & Paul, S 2011, ‘Technical Efficiency of Jordanian Banking Sector based
on DEA Approach’, Terengganu International Finance and Economics Journal
1: 1, 11-24.
Jreisat, A & Paul, S 2010, ‘Banking Efficiency in the Middle East: A Survey and
New Result for Jordanian Banks’, International Journal of Applied Business
and Economic Research 8: 2, 191-209.
Conference Presentations
Jreisat, A & Paul, S 2011, ‘Financial Liberalisation and Productivity Change in the
Jordanian Banking Sector’, Western Economic Association International 9th
Biennial Pacific Rim Conference, April 26-29, 2011, Queensland University of
Technology, Australia.
Jreisat, A & Paul, S 2010, ‘Productivity Growth of the Jordanian Banking Sector
based on MPI Approach’, Postgraduate Research Student Colloquium, 05-06
October 2010, College of Business, University of Western Sydney, Parramatta,
Australia.
v
Jreisat, A & Paul, S 2010, ‘Technical Efficiency of Jordanian Banking Sector based
on DEA Approach’, Terengganu International Business and Economics
Conference 5–7 August 2010, Kuala Terengganu, Malaysia.
Jreisat, A & Paul, S 2009, ‘Efficiency Level of Jordanian Banking Sector based on
DEA Approach’, Postgraduate Research Student Colloquium, 27-29 October
2009, College of Business, University of Western Sydney, Parramatta,
Australia.
Signature
Ammar Barham Jreisat
31/August/2011

vi
TABLE OF CONTENTS
ABSTRACT ... . . . . . . . . . . . . . . . . . . . . . . . . . . . . . . . . . . . . . . . . . . . . . . . . . . . . . . . . . . . . . . . . . . . . . . . . . . . xviii
CHAPTER 1 .. . . . . . . . . . . . . . . . . . . . . . . . . . . . . . . . . . . . . . . . . . . . . . . . . . . . . . . . . . . . . . . . . . . . . . . . . . . . . . . . . 1
Introduction .. . . . . . . . . . . . . . . . . . . . . . . . . . . . . . . . . . . . . . . . . . . . . . . . . . . . . . . . . . . . . . . . . . . . . . . . . . . . . . . . . 1
1.1 Background and Objectives .......................................................................................... 1
1.2 Research Methodology and Data .................................................................................. 4
1.3 The Organisation of this Study ..................................................................................... 8
CHAPTER 2 .. . . . . . . . . . . . . . . . . . . . . . . . . . . . . . . . . . . . . . . . . . . . . . . . . . . . . . . . . . . . . . . . . . . . . . . . . . . . . . . 12
An Historical Overview of the Jordanian Banking Sector . . . . . . . . . . . . . . . . 12
2.1 Introduction ................................................................................................................. 12
2.2 Introduction to the Hashemite Kingdom of Jordan ..................................................... 12
2.2.1 An Overview of the Jordanian Economy ............................................................................ 13
2.2.2 An Overview of the Jordanian Financial Market ............................................................... 16
2.3 Background to the Jordanian Banking Sector ............................................................. 17
2.4 Developments of Jordanian Banking Sector: Banking Crisis, Financial Liberalisation
Program, and Deregulation ............................................................................................... 20
2.5 An Overview of the CBJ ............................................................................................. 24
2.5.1 Objectives and Functions of the CBJ ................................................................................. 24
2.6 The Structure of the Banking Sector in Jordan ........................................................... 25
2.6.1 Growth in Licensed Banks .................................................................................................. 27
2.6.2 Growth in Bank Branches ................................................................................................... 28
2.7 Development of Jordanian Banks’ Assets, Credit Facilities and Deposits ................. 29
2.7.1 Growth of Assets ................................................................................................................ 29
2.7.2 Growth in Credit Facilities ................................................................................................. 31
2.7.2.1 Growth of Credit Facilities in Jordanian Dinar and Foreign Currencies .................... 31
2.7.2.2 Growth in Type of Credit Facilities ............................................................................ 32
2.7.3 Growth in Deposits ............................................................................................................. 34
2.7.3.1 Changing Structure of Deposits .................................................................................. 35
2.8 Developments in the Interest Rate Structure in the Jordanian Banking Market ......... 37
2.8.1 Interest Rates on Deposits .................................................................................................. 37
vii
2.8.2 Interest Rates on Credit Facilities ....................................................................................... 38
2.9 Developments in Jordanian Banking Sector Services ................................................ 39
2.10 The Development of Islamic Banks .......................................................................... 42
2.10.1 Historical Developments of the Islamic Banks Operating in Jordan ................................ 43
2.10.2 Basic Principle of Islamic Banking .................................................................................. 48
2.10.3 Banking Services Provided by Islamic Banks .................................................................. 50
2.11 The Development of Foreign Banks Operating in Jordan ........................................ 51
2.11.1 Advantages and Disadvantages of Foreign Bank Entry in Jordan ................................... 54
2.11.2 Comparison of Domestic and Foreign Banks’ Performance in Terms of Financial Ratios
56
2.12 Summary ................................................................................................................... 57
CHAPTER 3 .. . . . . . . . . . . . . . . . . . . . . . . . . . . . . . . . . . . . . . . . . . . . . . . . . . . . . . . . . . . . . . . . . . . . . . . . . . . . . . . 59
A Review of Literature on Banking Efficiency and Productivity . . . . . . 59
3.1 Introduction ................................................................................................................. 59
3.2 International Studies of Banking Efficiency and Productivity ................................... 61
3.2.1 International Studies of Banking Efficiency and Productivity based on the Non-Parametric
Data Envelopment Analysis Approach ........................................................................................ 61
3.2.2 International Studies of Banking Efficiency and Productivity based on Parametric
Stochastic Frontier Analysis Approach ....................................................................................... 73
3.3 Middle East Studies of Banking Efficiency and Productivity .................................... 77
3.3.1 Middle Eastern Studies of Banking Efficiency and Productivity based on DEA ............... 77
3.3.2 The Middle East Studies of Banking Efficiency and Productivity Based on the Parametric
Stochastic Frontier Approach ...................................................................................................... 81
3.4 Jordanian Studies of Banking Efficiency and Productivity ........................................ 83
3.4.1 Jordanian Studies of Banking Efficiency and Productivity Based on a Non-Parametric
DEA Approach ............................................................................................................................ 83
3.4.2 Jordanian Studies of Banking Efficiency and Productivity Based on a Parametric SFA
Approach ...................................................................................................................................... 85
3.5 Concluding Remarks ................................................................................................... 86
CHAPTER 4 .. . . . . . . . . . . . . . . . . . . . . . . . . . . . . . . . . . . . . . . . . . . . . . . . . . . . . . . . . . . . . . . . . . . . . . . . . . . . . . . 87
The Technical Efficiency of the Jordanian Banking Sector . . . . . . . . . . . . . . 87
4.1 Introduction ................................................................................................................. 87
4.2 Approaches to Measuring Efficiencies ....................................................................... 87

viii
4.2.1 The Non-Parametric Approach ........................................................................................... 88
4.2.2. The Parametric Approach .................................................................................................. 89
4.2.3 Choice between Non-parametric and Parametric Measures ............................................... 91
4.2.4 Data Envelopment Analysis (DEA) Approach to Measuring Technical Efficiency .......... 92
4.2.4.1 The Input-Oriented DEA Measure of Technical Efficiency ....................................... 92
4.2.4.2. The Output-oriented DEA Measure of Technical Efficiency .................................... 94
4.2.4.3 Difference between the Two Orientations Measures of Technical Efficiency – an Illustration ............................................................................................................................... 95
4.2.4.4 Choice of DEA Orientation ........................................................................................ 96
4.2.4.5 Data Envelopment Analysis Program (DEAP Version 2.1) ....................................... 97
4.3 Choice of Variables for DEA Model .......................................................................... 98
4.4. Data Sources ............................................................................................................ 101
4.5 An Analysis of Technical Efficiency of Banks in Jordan ......................................... 103
4.5.1 Summary Statistics for Inputs and Outputs ...................................................................... 103
4.5.2 Results of Technical Efficiency ........................................................................................ 109
4.5.3 A comparison with Earlier Studies ................................................................................... 128
4.6 Conclusions ............................................................................................................... 133
CHAPTER 5 .. . . . . . . . . . . . . . . . . . . . . . . . . . . . . . . . . . . . . . . . . . . . . . . . . . . . . . . . . . . . . . . . . . . . . . . . . . . . . 136
Cost Efficiency in the Jordanian Banking Sector . . . . . . . . . . . . . . . . . . . . . . . . . . 136
5.1. Introduction .............................................................................................................. 136
5.2 Cost Efficiency: Concept and Measurement ............................................................. 136
5.3 The Data and Estimates of DEA-based Cost Efficiency of Banks ........................... 141
5.3.1 The Data ............................................................................................................................ 141
5.3.2. Empirical Results on Cost Efficiency .............................................................................. 143
5.4. Conclusions .............................................................................................................. 160
CHAPTER 6 .. . . . . . . . . . . . . . . . . . . . . . . . . . . . . . . . . . . . . . . . . . . . . . . . . . . . . . . . . . . . . . . . . . . . . . . . . . . . . 161
Productivity Change in the Jordanian Banking Sector . . . . . . . . . . . . . . . . . . . 161
6.1 Introduction ............................................................................................................... 161
6.2 The Malmquist Productivity Index (MPI): Decomposition and Measurement ........ 162
6.3 Empirical Results ...................................................................................................... 168
6.4 Concluding Remarks ................................................................................................. 182
CHAPTER 7 .. . . . . . . . . . . . . . . . . . . . . . . . . . . . . . . . . . . . . . . . . . . . . . . . . . . . . . . . . . . . . . . . . . . . . . . . . . . . . 183

ix
Summary and Conclusions . . . . . . . . . . . . . . . . . . . . . . . . . . . . . . . . . . . . . . . . . . . . . . . . . . . . . . . . . . 183
7.1 Summary and Conclusions ....................................................................................... 183
7.2 Limitations and Suggestions for Future Research .................................................... 188
BIBLIOGRAPHY ... . . . . . . . . . . . . . . . . . . . . . . . . . . . . . . . . . . . . . . . . . . . . . . . . . . . . . . . . . . . . . . . . . . . . 189

x
LIST OF TABLES
Table 2.1: Commercial Banks operating in Jordan, 2007 ...................................................... 26
Table 2.2: Islamic Banks operating in Jordan, 2007 .............................................................. 26
Table 2.3: Foreign Banks operating in Jordan, 2007 ............................................................. 26
Table 2.4: Number of Domestic and Foreign Banks operating in Jordan, 1996–2007 .......... 27
Table 2.5: Number of Branches, 1996 –2007 ........................................................................ 28
Table 2.6: Assets of Banks Operating in Jordan in millions of Dinar and its Ratio to GDP,
1996 – 2007 ......................................................................................................... 30
Table 2.7: Total Credit Facilities Extended by Banks operating in Jordan and its Ratio to
GDP, 1996–2007 ................................................................................................. 31
Table 2.8: Development of Types of Credit Facilities Extended by Licensed Banks, 2000–2007 ..................................................................................................................... 33
Table 2.9: Total Deposits at Banks operating in Jordan, 1996–2007 .................................... 34
Table 2.10: Development of Types of Deposits of Banks operating in Jordan, 1996–2007 . 36
Table 2.11: The Weighted Average of Interest Rates on Deposits at Banks, 1996–2007 ..... 37
Table 2.12: The Weighted Average of Interest Rates on Credit Facilities Extended by Banks,
1996–2007 ........................................................................................................... 38
Table 2.13: New Services Introduced by the End of 2007 .................................................... 40
Table 2.14: Electronic Banking Services in the End of 2007 ................................................ 41
Table 2.15: Distribution of the Assets of the Banking Sector between Commercial Jordanian
Banks and Islamic Banks, 1996–2007 ................................................................. 44
Table 2.16: Distribution of the Deposits at the Banking Sector between Commercial
Jordanian Banks and Islamic Banks, 1996–2007 ................................................ 45
Table 2.17: Distribution of the Credit Facilities Extended by the Banking Sector between Commercial Jordanian Banks and Islamic Banks, 1996–2007 ........................... 47
Table 2.18: Distribution of the Assets of the Banking Sector between Jordanian Banks and
Foreign Banks, 1996–2007 .................................................................................. 51
Table 2.19: Distribution of the Deposits at the Banking Sector between Jordanian Banks and Foreign Banks, 1996–2007 .................................................................................. 52
Table 2.20: Distribution of the Credit Facilities Extended by the Banking Sector between
Jordanian Banks and Foreign Banks, 1996–2007 ............................................... 54
Table 2.21: Comparison between Domestic and Foreign Banks in Jordan, 1996–2007 ....... 57
xi
Table 4.1: List of Inputs and Outputs .................................................................................. 100
Table 4.2: Assets of Domestic and Foreign Banks, 2007 .................................................... 103
Table 4.3: Summary Statistics of Variable for Jordanian Banks, 1996–2007 ..................... 106
Table 4.4: Contribution of Individual Banks to Total Banking Output, 1996–2007 ........... 107
Table 4.5: Mean DEA Estimates of Technical, Pure Technical and Scale Efficiency by
Category, 1996–2007 ........................................................................................ 113
Table 4.6: DEA Estimates of Efficiency by Category of Banks, 1996–2007 ...................... 116
Table 4.7: Estimates of the Nature of Returns to Scale for Domestic and Foreign Banks,
1996–2007 ......................................................................................................... 120
Table 4.8: DEA Estimates of Efficiency for Domestic and Foreign Banks, 1996–2007 .... 122
Table 4.8 (Continued): DEA Estimates of Efficiency for Domestic and Foreign Banks, 1996-
2007 ................................................................................................................... 124
Table 4.9: Average Annual Growth Rates of Efficiency by Sub-group, 1996–2007
(Percentage) ....................................................................................................... 129
Table 4.10: Sources of Inefficiency in Input and Output Variables, 1996–2007 ................ 130
Table 5.1: Variable Definitions Banks’ Input prices and Outputs for Jordan ...................... 141
Table 5.2: Summary Statistics for the Variables for the Jordanian Banks 1996–2007 ....... 142
Table 5.3: Yearly DEA Estimates of Cost, Allocative and Technical Efficiency 1996–2007
........................................................................................................................... 144
Table 5.4: Mean DEA Estimates of Cost, Allocative and Technical Efficiency by Category, 1996–2007 ......................................................................................................... 145
Table 5.5: Mean DEA Estimates of Cost, Allocative and Technical Efficiencies, 1996–2007
........................................................................................................................... 147
Table 5.6: DEA Estimates of Cost Efficiency by Category of Banks and ownership, 1996–2007 ................................................................................................................... 149
Table 5.7: DEA Estimates of Cost Efficiency for Domestic and Foreign Banks, 1996–2007
........................................................................................................................... 151
Table 5.7 (Continued): DEA Estimates of Cost Efficiency for Domestic and Foreign Banks,
1996–2007 ......................................................................................................... 153
Table 5.8: Average Annual Growth Rates of Cost Efficiency by Sub-group, 1996–2007 (Percentage) ....................................................................................................... 156
Table 6.1: Mean MPI Estimates of Productivity Change and its Components, 1996–2007 170
Table 6.2: Mean MPI Estimates of Productivity Change Broad Groupby Category, 1996–
2007 ................................................................................................................... 172

xii
Table 6.3: MPI Estimates for Eight Jordanian Banks, 1985–1995 ...................................... 172
Table 6.4: MPI Estimates of Productivity Change and its Components, 1996–2007 .......... 174
Table 6.5: MPI Productivity Change by Bank Category, 1996–2007 ................................. 179
Table 6.6: Mean MPI Estimates of Productivity Change by Sub-group, 1996– 2007 ........ 181

xiii
LIST OF FIGURES
Figure 2.1: Number of Domestic and Foreign Banks operating in Jordan, 1996–2007 ......... 28
Figure 2.2: Assets of Banks operating in Jordan in millions of JD and its Ratio to GDP, 1996–2007 ............................................................................................................ 30
Figure 2.3: Total Credit Facilities Extended by Banks operating in Jordan and its Ratio to
GDP, 1996–2007 .................................................................................................. 32
Figure 2.4: Development of Types of Credit Facilities Extended by Licensed Banks, 2000–2007 ...................................................................................................................... 33
Figure 2.5: Total Deposits of Banks operating in Jordan, 1996–2007 .......................... 35
Figure 2.6: Development of Types of Deposits at Banks operating in Jordan, 1996–2007 ... 36
Figure 2.7: The Weighted Average of Interest Rates on Deposits at Banks, 1996–2007 ....... 38
Figure 2.8: The Weighted Average of Interest Rates on Credit Facilities Extended by Banks,
1996–2007 ............................................................................................................ 39
Figure 2.9: Distribution of the Assets of the Banking Sector between Commercial Jordanian
Banks and Islamic Banks, 1996–2007 .................................................................. 45
Figure 2.10: Distribution of the Deposits at the Banking Sector between Commercial
Jordanian Banks and Islamic Banks, 1996–2007 ................................................. 46
Figure 2.11: Distribution of the Credit Facilities Extended by the Banking Sector between
Commercial Jordanian Banks and Islamic Banks, 1996–2007 ............................ 47
Figure 2.12: Distribution of the Assets of the Banking Sector between Jordanian Banks and Foreign Banks, 1996–2007 ................................................................................... 52
Figure 2.13: Distribution of the Deposits at the Banking Sector between Jordanian Banks and
Foreign Banks, 1996–2007 ................................................................................... 53
Figure 2.14: Distribution of the Credit Facilities Extended by the Banking Sector between
Jordanian Banks and Foreign Banks, 1996–2007 ................................................ 54
Figure 4.1: Technical Efficiency from an Input-Orientation .................................................. 93
Figure 4.2: Technical Efficiency from an Output Orientation ................................................ 94
Figure 4.3: Technical Efficiency Measures and Returns to Scale .......................................... 96
Figure 4.4: Calculation of Scale Economies in DEA ............................................................ 111
Figure 4.5: DEA Estimates of Technical Efficiency by Bank Category, 1996–2007 .......... 117
Figure 4.6: DEA Estimates of Pure Technical Efficiency by Bank Category, 1996–2007 .. 117

xiv
Figure 4.7: DEA Estimates of Scale Technical Efficiency by Bank Category, 1996–2007 . 118
Figure 4.8: DEA Estimates of Technical Efficiency by Bank Ownership, 1996–2007 ........ 118
Figure 4.9: DEA Estimates of Pure Technical Efficiency by Bank Ownership, 1996–2007119
Figure 4.10: DEA Estimates of Scale Technical Efficiency by Bank Ownership, 1996–2007
............................................................................................................................ 119
Figure 4.11: DEA Estimates of Nature of Return to Scale, 1996–2007 ............................... 122
Figure 5.1: Cost, Technical and Allocative Efficiencies ...................................................... 139
Figure 5.2 Average Efficiency Over Time for DEA Model (1996–2007) ............................ 145
Figure 5.3: DEA Estimates of Cost Efficiency by Bank Category, 1996–2007 ................... 157
Figure 5.4: DEA Estimates of Allocative Efficiency by Bank Category, 1996–2007 .......... 157
Figure 5.5: DEA Estimates of Technical Efficiency by Bank Category, 1996–2007 .......... 158
Figure 5.6: DEA Estimates of Cost Efficiency by Bank Ownership, 1996–2007 ................ 158
Figure 5.7: DEA Estimates of Allocative Efficiency by Bank Ownership, 1996–2007 ....... 159
Figure 5.8: DEA Estimates of Technical Efficiency by Bank Ownership, 1996–2007 ........ 159
Figure 6.1: Input Distance Function and Input Requirement Set ......................................... 164
Figure 6.2: Decomposition of Malmquist Productivity Index .............................................. 167

xv
ABBREVIATIONS
AB Arab Bank
ABC Arab Banking Corporation
AE Allocative Efficiency
AFM Amman Financial Market
AJIB Arab Jordan Investment Bank
AME Arab Middle Eastern
ANB Arab Nation Bank
ASE Amman Stock Exchange
BOJ Bank of Jordan
BSC Bank Standard Charter
CAB Cairo Amman Bank
CB Citi Bank
CBJ Central Bank of Jordan
CPB Capital Bank
CRS Constant Returns to Scale
DEA Data Envelopment Analysis
DEAP Data Envelopment Analysis Program
DFA Distribution Free Approach
DMU Decision Making Unit
DOS Department of Statistics in Jordan
DRS Decreasing Returns to Scale
Effnt Fully Efficient
FDH Free Disposal Hull
FTA Free Trade Area
GCC Gulf Co-operating Council
HBTF The Housing Bank for Trade & Finance
HSBC Hong Kong and Shanghai Banking Corporation
IMF International Monetary Fund

xvi
IRS Increasing Returns to Scale
JCB Jordan Commercial Bank
JD Jordanian Dinar
JIBF Jordan Islamic Bank for Finance and Investment
JIFB Jordan Investment and Finance Bank
JKB Jordan Kuwait Bank
JNB Jordan National Bank
LBR Labour
LP Linear Programming
MPI Malmquist Productivity Index/Indices
MPSS Most Productive Scale Size
NIE Non Interest Expense
NIM Net Interest Margin
NIN Non Interest Income
NIRS Non Increasing Returns to Scale
NN Neural Networks
OBS Off-Balance Sheet
Oinvt Other Investment
PNN Probabilistic Neural Network
PTE Pure Technical Efficiency
PTEC Pure Technical Efficiency Change
ROA Return on Assets
ROE Return on Equity
SD Standard Deviation
SE Scale Efficiency
SFA Stochastic Frontier Approach
SGBJ Societe Generale De Banque-Jordanie
TA Total Assets
TC Technological Change
Tdept Total Deposit
xvii
TE Technical Efficiency
TEC Technical Efficiency Change
TFA Thick Frontier Approach
TFP Total Factor Productivity
TLn Total Loan
UAE United Arab Emirates
UBJ Union Bank for Saving and Investment
VRS Variable Returns to Scale
xviii
ABSTRACT
This study investigates the efficiency and productivity of the Jordanian banking
sector, which consisted of 17 banks (two large, eight medium, four small and three
foreign) during the period of financial deregulation, 1996–2007. It begins with the
estimation of technical efficiency based on the input-oriented Data Envelopment
Analysis (DEA) approach. To enable a comprehensive analysis, technical efficiency
is decomposed into the product of pure technical efficiency and scale efficiency. This
is followed by measuring cost efficiency, which is the product of technical and
allocative efficiencies. Finally, the Malmquist Productivity Indices (MPI) are
computed to examine the total factor productivity (TFP) change over the sample
period. TFP change is decomposed into the products of technical efficiency change
(catch-up) and technological change. The results reveal that the large banks are the
most technically efficient in Jordan. The medium-sized banks have the lowest
technical efficiency. There is a clear evidence of improvement (of about 0.37% per
year) in the technical efficiency of banks during the sample period. The same is true
of cost efficiency. Interestingly, the Jordanian banking sector as a whole shows a
productivity growth of 3.5% per year, largely due to technological improvement. The
productivity change among the domestic banks is much higher than that of the
foreign banks during the entire deregulated period. Since the productivity growth
during the regulated period of 1985–1995 was only 1.0% per annum, the higher
xix
productivity growth reported here during the deregulated period suggests that the
banking sector has responded positively to the deregulation and liberalisation
policies of the government.
Keywords: Technical efficiency, Cost efficiency, Data Envelopment Analysis,
Jordanian banking sector, Financial reforms.
August 2011
Ammar Jreisat
CHAPTER 1
Introduction
1.1 Background and Objectives
There is a large body of literature dealing with the measurement of banking
efficiency and productivity in the western economies, but studies on banking
efficiency relating to Middle Eastern economies are few. The reasons for this can be
attributed to three factors. First, the financial systems of many Middle Eastern
countries are highly regulated and outdated. Second, they are dominated by the
public sector and do not face any competition. Third, reliable data on banks are not
available for many countries. However, during the last fifteen years, many Middle
Eastern economies have moved towards liberalising their financial systems. This has
encouraged researchers to undertake studies of banking efficiency and productivity
in some of the countries; see, for example, Hassan et al. (2004) and Al-Muharrami
(2007).
The measurement of efficiency and productivity of the banking industry is important
for several reasons. First, the measures of efficiency and productivity are considered
as crucial indicators of performance of individual banks and of the industry as a
whole. Second, efficiency is a vital factor for the financial institutions wishing to
maintaining a successful business, given the increasing competition in financial
markets. Third, in a rapidly changing and more globalised financial marketplace,
governments, regulators, managers and investors are concerned about how efficiently
Chapter One: Introduction
2
banks transform their expensive inputs into various financial products and services.
Finally, it may be noted that efficiency and productivity measures are critical aspects
of banking industry that enable us to distinguish banks that will survive and prosper
from those that will have problems with competitiveness.
The present study examines efficiency and productivity changes in the banking
sector of Jordon during the period of financial deregulation, 1996–2007. Before the
1980s the Jordanian banking sector was highly regulated, and economic policies
were directed towards prevention of and protection from any foreign competition.
The financial authorities put in place measures to limit foreign entry; as a result,
domestic banks in Jordan operated in an oligopolistic environment, and interest rates
on credits and deposits were determined in a monopolistic manner (Al-khoury et
al.,2008, p.163). In August 1989, Jordan experienced a crisis in its banking system
following the collapse of Petra Bank and the financial difficulties of six other
financial institutions linked to it. The crisis was a result, among other factors, of
inadequate banking regulations, over-exposure of the banking system to the real
estate market and imprudent speculations in foreign exchange (Canakci, 1995).
The 1989 crisis led to closer cooperation between the government, the International
Monetary Fund (IMF) and the World Bank to initiate a reform program for the
Jordanian banking sector. The government took various steps since 1993 to enhance
system efficiencies and to create competition among banks. The reform program
consisted of removing restrictions on interest rates, reducing direct governmental
lending, promoting deregulation and reducing the restrictions on foreign exchange
Chapter One: Introduction
3
transactions and the movement of capital. In addition, the government adopted trade
liberalisation policies to enhance economic growth and promote exports (Maghyereh,
2004; CBJ, 2005).
This study focuses on the measurement of efficiency and productivity changes in
seventeen Jordanian banks during the period of financial deregulation, 1996–2007.
Our sample consists of fourteen domestic (two large, eight medium and four small)
and three foreign banks for which adequate data were available. These banks cover
close to 90 per cent of banking output in Jordon (Association of Banks in Jordan,
Annual Report, 2007).
In an earlier study, Ahmad (2000) analysed the cost efficiency of 20 banks for the
period 1990–1996. In an unpublished paper, Maghyereh (2004) examined the
efficiency and productivity change in eight domestic banks during the period, 1984–
2001. Our study makes a significant contribution to the Jordanian literature on
banking efficiency and productivity change by covering the entire deregulated period
not encompassed in earlier studies. The results of this study may help policy makers
and bankers understand the ways in which regulatory changes may influence a
bank’s efficiency and productivity.
In particular, this study seeks to address the following questions:
1. How efficient are Jordanian banks?
Chapter One: Introduction
4
2. Which banks are most efficient in terms of technical, pure technical, scale,
allocative efficiencies and in terms of economic efficiency (cost
efficiency)?
3. Do all banks in Jordan exhibit the same degree of overall, technical,
allocative and cost efficiencies?
4. How productive are Jordanian banks?
5. Have the levels of efficiency and productivity improved or declined during
the deregulation period?
1.2 Research Methodology and Data
There are two broad approaches to measuring efficiencies and productivity change:
1. Non-parametric approach.
2. Parametric approach.
There are two non-parametric methods for measuring efficiency: Data Envelopment
Analysis (DEA) and the Free Disposal Hull (FDH). The DEA, developed by Charnes
et al. (1978), is more frequently used; it is a linear programming technique for
constructing external piecewise frontier. The frontier is non-parametric in the sense
that it is constructed through the envelopment of the decision making units (DMUs)
with ‘best practice’ DMUs. The DEA does not impose any functional form
specification on the production function. The FDH model, introduced by Deprins et
al. (1984) and developed by Tulkens (1993), is a special case of the DEA model
where the points on lines connecting DEA vertices are not included in the frontier:
instead the FDH production possibilities set is composed only of the DEA vertices
and the free disposal hull points interior to these vertices. Since the FDH frontier is
Chapter One: Introduction
5
either congruent with or interior to the DEA frontier, FDH will typically generate
larger estimates of average efficiency than DEA (Tulkens, 1993). The DEA is the
most widely used popular methodology for measuring efficiency and productivity
change.
The parametric approach is useful because of its ability to allow for random error,
and for the opportunity it offers for mathematical manipulation. A suitable functional
form must be selected, which attempts to resemble the actual production process as
closely as possible (Coelli et al, 2005). The form can be simple or complex, with
varying degrees of complexity between the two extremes.
There are three parametric methods to estimate the efficiency/ inefficiency of firms:
(i) The Stochastic Frontier Approach (SFA), (ii) The Distribution Free Approach
(DFA) and (iii) The Thick Frontier Approach (TFA). While a discussion on each of
these methods is provided in Chapter 4, it is sufficient to mention here that SFA
involves the estimation of efficiencies usually by estimating either a cost function or
a profit function. It allows the testing of hypotheses in regard to the efficiency and
structure of production technology. It has been widely used in empirical studies of
firms and the banking industry. The difficulties involved in the selection of a
distribution form for the efficiency term is a disadvantage of this approach. SFA
imposes a particular functional form (and associated behavioural assumptions) that
presuppose the shape of the frontier. If the functional form is mis-specified, the
measurement of efficiency may be confounded with specification errors. In contrast,
non-parametric methods do not impose any structure on the frontier; but they do not
Chapter One: Introduction
6
allow for random error resulting from luck, data problems, or other measurement
errors. If random error exists, measured efficiency may be confounded with these
random deviations from the true efficiency frontier.
It is not possible to determine which of the two major methods dominates the other
since the true level of efficiency is unknown. DEA has gained popular acceptance
and frequent application among studies on bank efficiency and productivity. This
study follows the DEA approach has been selected in this study to measure
efficiency and productivity change in Jordanian banks. DEA methodology may be
either input-oriented or output oriented. Since we believe that banks have better
control over inputs, the input-oriented DEA approach is most suitable.
Empirical results based on DEA may depend on or are likely to be influenced by the
choice and number of inputs entering the model. So far there is no agreement on the
choice of bank inputs and outputs; in fact, the choice of input and output variables
for the banking sector is a matter of some controversy. The literature offers three
distinct approaches used for selecting inputs and outputs: the production approach,
the intermediation approach, and the value-added approach. The first views financial
institutions as producers who use inputs of labour and capital to generate outputs of
deposits and loans. This approach is used, among others, by Sathey (2001) and Neal
(2004). The intermediation approach views financial institutions as intermediaries
that convert and transfer financial assets from surplus units to deficit units. Ahmad
(2000) views banks as intermediaries and uses two inputs, labour and deposits, and
two outputs, total loans and other investments. for measuring efficiency in Jordanian
Chapter One: Introduction
7
banks during 1990–1996. In another conceptualisation of the intermediate approach,
Paul and Kourouche (2008) and Kourouche (2008) use interest expenses and non-
interest expenses as inputs, and interest income and non-interest income as outputs.
In the value-added approach, high value-creating activities such as making loans and
taking deposits are classified as outputs, whereas labour, physical capital and
purchased funds are classified as inputs (Wheelock and Wilson, 1995).
The intermediation approach is quite popular in empirical research, particularly that
based on cross-sectional data (Colwell & Davis, 1992; Favero & Papi, 1995). The
production approach, though also found in empirical studies, is less favoured when
considering banking as it is known to have limitations, mainly due to the exclusion of
interest expenses which are considered a vital part of banking.
There are other practical issues or reasoning governing the selection of inputs and
outputs. If the aim is to estimate a unit’s production efficiency, then a production
approach might be appropriate; however, if the interest of the researcher is in
examining intermediation efficiency, then an intermediary approach is appropriate.
The choice of variables may also depend on the availability of data.
This study uses the intermediation approach, in which banks are viewed as
intermediaries that employ two inputs, labour (x1) and total deposits (x2) to produce
two outputs, total loans (y1) and other investments (y2). To ensure reliability,
comparability and consistency, the data used in this study are taken from the annual
reports of individual banks and from the Central Bank of Jordan (CBJ). In addition,

Chapter One: Introduction
8
different libraries in Jordan and the data bases of the Amman Stock Exchange (ASE)
and the Association of Banks in Jordan were consulted to gather more information or
to supply missing data.
The data were collected from 17 Jordanian banks, consisting of 14 domestic and
three foreign banks. For a comprehensive analysis, the domestic banks are classified,
based on their asset sizes in 2007 measured in millions of Jordanian Dinar (JD), into
three categories: large, medium and small-sized banks. There are two large, eight
medium, four small and three foreign banks in the sample. Details are provided in
Chapter 4.
1.3 The Organisation of this Study
The study is organised into seven chapters. Chapter 2 provides an overview of how
banking services have developed in Jordan. The chapter begins with a brief
discussion of the Jordanian economy and its financial sector. Since the focus of this
study is on analysing the performance of banks in terms of their efficiency and
productivity, an overview of the development of the Jordanian banking sector
provides details about the commercial, Islamic and foreign banks operating in Jordan
in the period 1996–2007. Those historical developments that affected the Jordanian
economy and financial institutions, and led to the financial liberalisation
(deregulation) program, are highlighted.
Chapter 3 provides a review of studies of banking efficiency conducted in the Middle
East and the rest of the world, but no claim is made that it covers all extant studies.
Chapter One: Introduction
9
The review is selective; it does, however, reveal that the majority of studies on
banking efficiency in the Middle East have used the DEA, only a few have used SFA
methodology to compute efficiency estimates. The empirical studies of banking
efficiency and productivity in Jordan are few, and do not cover the entire financial
regulation period.
The main research contributions of this study are provided in Chapters 4 through 6.
Chapter 4 runs an input-oriented DEA model to obtain measures of technical
efficiency (TE), decomposed into the product of pure technical efficiencies (PTE)
and scale efficiencies (SE) for each of the 17 banks of the Jordanian banking sector
during the liberalised period, 1996–2007. The chapter also investigates the nature of
returns to scale and the sources of inefficiency in the inputs and outputs of each
bank. The results reveal that the average technical efficiency for all banks is 79.2%.
This implies that inputs can be reduced by 20.8% on average, relative to the best-
practice banks during the sample period. The number of staff and the total deposits
are the most common sources of inefficiency. Banks need to use deposits efficiently
and reduce their staff to enhance efficiency. The Arab Bank, one of the largest banks,
is found to perform at the highest level of technical efficiency (90%); small banks are
found to be more efficient than the medium banks; foreign banks show the lowest
technical efficiency. However, the banking sector as a whole shows improvements in
technical efficiency at an average rate of 0.37% per year over the study period.
Chapter One: Introduction
10
The analysis of technical efficiency conducted in Chapter 4 is based on two
assumptions: first, that there are no allocative inefficiencies in the banking sector;
and second, that the frontier remains the same throughout the sample period. The
first assumption is guided by the international literature on the banking sector, which
suggests that allocative inefficiency is negligible during a short sample period. In
Chapter 5 this assumption is dropped, and the focus changes to overall (cost)
efficiency, which is the product of the technical and allocative efficiencies. The
assumption of the same frontier over the sample period permits a comparison of the
estimates of technical efficiencies across times and banks. The results, based on
DEA, provide an average estimate of cost efficiency score of 0.74, which implies
that the banking sector could reduce the cost of production by 26 per cent without
affecting the level of output. Again, large banks are found to be the most efficient in
terms of cost efficiency (86%), allocative efficiency (92.7%) and technical efficiency
(93%). The small banks rank second in terms of efficiency level. While the cost
efficiency shows a decline during the early and middle phases of deregulation, shows
large improvement in the latter phase of financial deregulation in Jordan.
In Chapters 4 and 5, it is assumed that the efficiency frontier does not shift over the
sample period. The efficiency frontier can shift in response to technological progress
(technological innovations). The latter needs to be distinguished from gains in
technical efficiency represented by units moving toward the frontier (commonly
referred to as the ‘catching-up effect’). Chapter 6 of this study studies the changes in
total factor productivity (TFP) over time, and investigate whether it is due to
Chapter One: Introduction
11
technological change (TC) or due to technical efficiency change (TEC), or due to a
combination of both. The productivity change of banks is measured by estimating the
Malmquist Productivity Index (MPI). The estimates of MPI reveal that the Jordanian
banking sector as a whole has shown a productivity growth of 3.5 per year per
annum, largely due to technological improvement. Productivity growth during the
regulated period of 1985–1995 was only 1.0% per annum, much lower than the per
annum productivity growth reported here. This shows that the banking sector has
responded positively to the deregulation and liberalisation policies of the
government, to achieve greater efficiency and productivity.
Chapter 7 summaries and brings together the conclusions.
CHAPTER 2
An Historical Overview of the Jordanian Banking
Sector
2.1 Introduction
Since the primary objective of this study is to measure the efficiency and
productivity of the Jordanian banks during the period 1996–2007, this chapter
provides an overview of how banking services have developed in Jordan. To put the
analysis into perspective, it begins with a brief discussion of the Jordanian economy
and of the financial sector. The background and historical developments of the
Jordanian banking sector are outlined in Sections 2.3 and 2.4. Section 2.5 provides an
overview of the CBJ. The structure of the Jordanian banking sector is presented in
Section 2.6. The developments in the banking assets, credits and deposits for the
period 1996–2007 are outlined in Section 2.7. Sections 2.8 and 2.9 present
developments in the interest rate structure and banking services. Islamic and foreign
banks operating in Jordan are discussed in Sections 2.10 and 2.11. Section 2.12
summarises the chapter.
2.2 Introduction to the Hashemite Kingdom of Jordan
Jordan is located in the western part of Asia. Its area is about 97,740 square
kilometers. At the end of 2007, the population was around 5.72 million, and its
population growth rate was around 2.3% (Department of Statistics in Jordan (DOS)
Chapter Two: An Historical Overview of the Jordanian Banking Sector
13
2008). During the last decade, a large part of the workforce was engaged in
agriculture; others worked in industry or in Arab Gulf states.
During the last 15 years, the Jordanian economy has witnessed a significant shift
from the public to the private sector, which is now the main driver of growth. The
CBJ maintains a monetary policy which is a vital and essential component of the
economic policy, designed to enhance the economic environment and the safety of
the banking system. Thus, the CBJ has secured sufficient liquidity to finance real
growth while ensuring price stability and keeping inflation under control (CBJ,
2008). The banking sector is a major contributor to the national economy, playing a
significant role as the main source of finance for investment in Jordan (DOS, 2008).
2.2.1 An Overview of the Jordanian Economy
Jordan is a small country with limited natural resources. The economy is
characterised by various features. First, it is small in terms of the size of GDP and
population compared to other countries (Seyam & Seyam, 1999). Second, due to the
scarcity of natural and financial resources in Jordan, the services sector dominates
the Jordanian economy; government and financial services account for 65.1% of
GDP. Third, Jordan has a mixed economy wherein the government plays a
significant role by employing about 50% of the workforce and by providing new
services in various fields (Al-Farhan, 2001). Finally, the population growth rate is
considered one of the highest compared to countries of the developed world, a result
of both high migration and high natural growth (Seyam & Seyam, 1999).

Chapter Two: An Historical Overview of the Jordanian Banking Sector
14
The economy has been affected by several political and economic factors. For
example, during the Israeli occupation of Palestine in 1948, large numbers of
refugees came to Jordan. In 1950, the Jericho Conference resolved to annex the West
Bank to Jordan; this meant that the Jordanian population increased suddenly. At that
time, and for some time after, Jordan was mainly dependent on foreign aid. The
United Kingdom supported the economy at an early stage, and later the US took over
this role. Foreign grants made up an average of 30% of all government revenue, and
between one fifth and one third of GDP, between 1952 and 1966 (Brynen, 1992). By
the 1960s, Jordan had implemented several five-year plans, but these were disrupted
by the 1967 Arab–Israeli war, which seriously affected the economy when Israeli
annexation of the West Bank deprived Jordan of many economic resources:
agriculture, industry, the tourist industry centred on Jerusalem and other Christian
sites. Simultaneously, Jordan’s population increased suddenly with a large influx of
refugees (Brynen, 1992).
The economy was affected more favourably by the increment in world oil prices in
the 1970s, when the GDP increased six times between 1973 and 1983. Real growth
in the economy took place at about 10% per year, as Jordan’s service sector
developed rapidly to meet the increased demands of Gulf States markets; in addition,
the expansion of the Jordanian potash industry added to the economic upturn (CBJ,
Annual Report, various issues). Remittances from Palestinians and Jordanians who
working in the Gulf States increased dramatically after 1973, reaching its peak at
Chapter Two: An Historical Overview of the Jordanian Banking Sector
15
around 475 million Jordanian Dinar (JD) – approximately US$1.2 billion (Zaghloul,
1992).
In the period 1973–1980, foreign aid continued, comprising 55% of government
revenue. Government expenditure during this time increased to at least 68% of GDP
(Ministry of Planning, Five Year Plan, 1986–1990). At the beginning of the 1980s,
because of the political situation in the region, economic growth slowed and large
numbers of expatriate workers returned from the Gulf. As a result, unemployment
rate began to rise. From 1981–1987 there was a decline in external grants, from more
than one third of state expenditure to less than one sixth; however, governmental
expenditure continued to grow at an average rate of over 6% per year; as a result the
state budget began to experience a chronic, slowly growing deficit (Department of
Research and Studies, CBJ, 1990).
The economic crisis of 19891 forced Jordan to adopt a comprehensive economic
program over the period 1989–1993 under the direction of the International
Monetary fund (IMF) and the World Bank (Mashaqbeh, 2005). Unfortunately, the
second Gulf War stopped this program; the Jordanian government came to an
agreement with the IMF mission for a second program from 1992–1998. The goal
was to increase economic growth, investment and structural reform, boost
productivity, stimulate the private sector, tackle unemployment, protect the poor, and
1 The 1989 crisis is discussed in Section 2.4.

Chapter Two: An Historical Overview of the Jordanian Banking Sector
16
reform specific economic sectors: manufacturing, agriculture, trade, energy and
water. The program continued to the middle of 2004 (Mashaqbeh, 2005). Recent
decades have witnessed growing governmental interest in improving economic
conditions, liberalising the economy, and increasing economic growth rates; to these
ends, Jordan has signed several international trade and regional agreements,
including
1. Convention on the Euro–Mediterranean Partnership of Jordan (2002);
2. Convention on the Jordanian–American free trade (2001);
3. Convention on the accession to the World Trade Organisation (2000);
4. Convention on the Greater Arab Free Trade (1998);
5. Agreements and arrangements for the establishment of Qualified Industrial
Zones (1996).
2.2.2 An Overview of the Jordanian Financial Market2
The task of financial market intermediation was divided into four major institutions:
commercial banks, insurance companies, brokers and investment banks (Akel, 1996).
In the past two decades, Jordan witnessed many developments in the financial
market; until 1964 it included 9 commercial banks. In 1978, the Amman Financial
Market (AFM) was established, and subsequently many other investment banks and
financial companies were created. AFM was established to supervise and organise
the trading and issue of financial papers such as stocks and bonds (Akel, 1996). By
2007, the Jordanian financial market included the CBJ, thirteen commercial banks,
2 For more details, see http://www.muflehakel.com/part%20one/Jordanian_Capital_Market.htm

Chapter Two: An Historical Overview of the Jordanian Banking Sector
17
two Islamic banks and five specialised credit institutions, 74 money exchange
companies, a credit and savings company, eight representative offices of foreign
banks, a loan guarantee company, a mortgage refinance company, 27 insurance
companies and the Amman stock exchange (CBJ, 2007).3
2.3 Background to the Jordanian Banking Sector
The Jordanian banking sector consists mainly of the central bank, commercial banks,
investment banks, development banks and Islamic banks. Banks engage in financial
activities including providing traditional deposit and lending services, financing
foreign trade activities and maintaining capital market transactions, as well as
investment banking activities.
Banks in Jordan were in operation as early as 1925, when a British Bank called the
Ottoman Bank became the first commercial bank to operate in Jordan.4 Due to the
absence of a central bank, the Ottoman Bank was considered the government bank
with a registered office in London. The bank was registered with the Ministry of
Justice on 30 August 1927. It became known as the National and Grindlays Bank in
1969, changed to ANZ Grindlays in 1989, and changed again to Standard Chartered
Grindlays in 2000; in October 2003 this changed to Standard Chartered Bank. The
Ottoman Bank operated alone until 1935, when the Arab Bank Limited, a Palestinian
3 For more details see http://dsbb.imf.org/Pages/SDDS/DQAFBase.aspx?ctycode=JOR&catcode=AAB00
4 http://www.muflehakel.com/not%20clasified/Banking.htm.
Chapter Two: An Historical Overview of the Jordanian Banking Sector
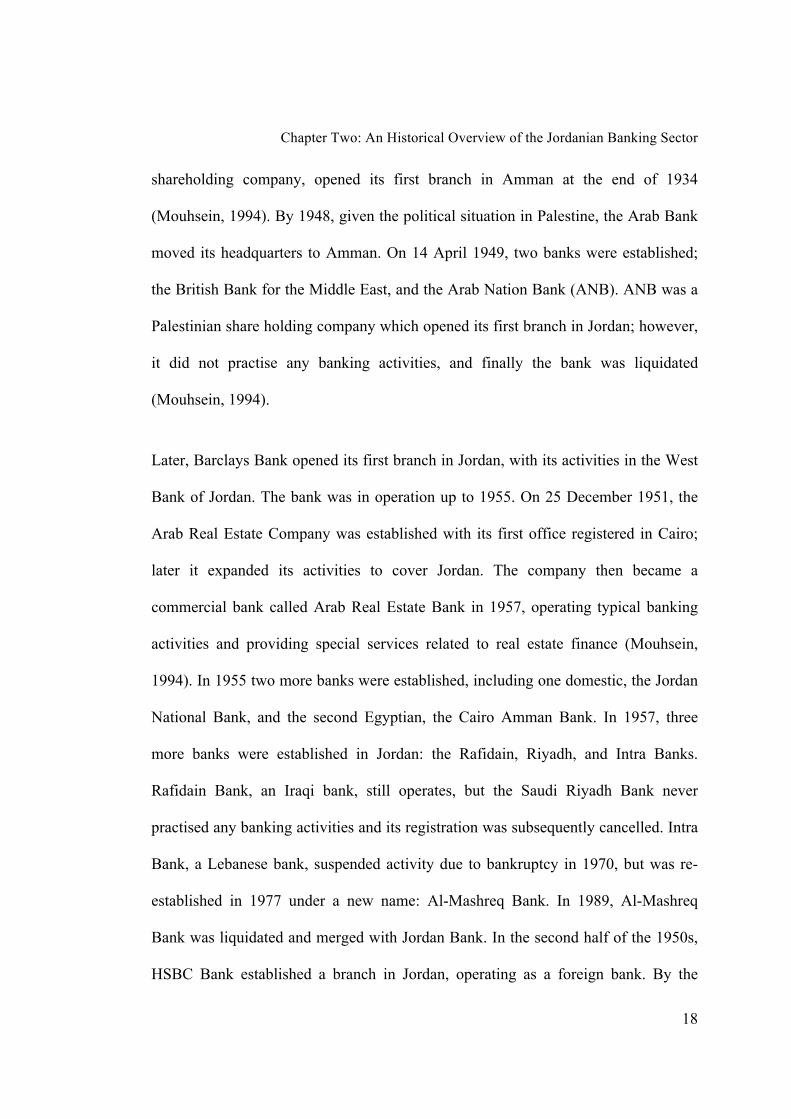
18
shareholding company, opened its first branch in Amman at the end of 1934
(Mouhsein, 1994). By 1948, given the political situation in Palestine, the Arab Bank
moved its headquarters to Amman. On 14 April 1949, two banks were established;
the British Bank for the Middle East, and the Arab Nation Bank (ANB). ANB was a
Palestinian share holding company which opened its first branch in Jordan; however,
it did not practise any banking activities, and finally the bank was liquidated
(Mouhsein, 1994).
Later, Barclays Bank opened its first branch in Jordan, with its activities in the West
Bank of Jordan. The bank was in operation up to 1955. On 25 December 1951, the
Arab Real Estate Company was established with its first office registered in Cairo;
later it expanded its activities to cover Jordan. The company then became a
commercial bank called Arab Real Estate Bank in 1957, operating typical banking
activities and providing special services related to real estate finance (Mouhsein,
1994). In 1955 two more banks were established, including one domestic, the Jordan
National Bank, and the second Egyptian, the Cairo Amman Bank. In 1957, three
more banks were established in Jordan: the Rafidain, Riyadh, and Intra Banks.
Rafidain Bank, an Iraqi bank, still operates, but the Saudi Riyadh Bank never
practised any banking activities and its registration was subsequently cancelled. Intra
Bank, a Lebanese bank, suspended activity due to bankruptcy in 1970, but was re-
established in 1977 under a new name: Al-Mashreq Bank. In 1989, Al-Mashreq
Bank was liquidated and merged with Jordan Bank. In the second half of the 1950s,
HSBC Bank established a branch in Jordan, operating as a foreign bank. By the

Chapter Two: An Historical Overview of the Jordanian Banking Sector
19
1960s, another domestic bank was established, the Jordan Bank. In 1961, a domestic
bank was registered under the name of Holy Land Bank, but its registration was
terminated in 1965. In addition, three specialised credit institutions owned by the
government were established in the 1960s (Agriculture Credit Corporation, Housing
and Urban Development Corporation, and Cities and Village Development
Corporation) as was one joint ownership institution, the Industrial Development
Bank (CBJ, 2007).
In the 1970s, five banks were established: four domestic banks (Housing Bank for
Trade and Finance, Jordan Kuwaiti Bank, Jordan Gulf Bank, known now as Jordan
Commercial Bank, and Arab Jordan Investment Bank) and one Islamic bank (Jordan
Islamic Bank for Finance and Investment) (Mouhsein, 1994). In the 1980s, two more
domestic banks (Arab Banking Corporation and Jordan Investment and Finance
Bank) were established. Four banks were established in the 1990s, three domestic
(Union Bank for saving and Investment, Société Générale De Banque-Jordanie, and
Export and Finance Bank) and one Islamic (Islamic International Arab Bank Plc). By
the turn of the century, four foreign banks had been established (Standard Chartered
Bank, National Bank of Kuwait, Audi Bank and BLOM Bank).5 All banking
operations in Jordan were supervised by the CBJ.
5 See CBJ, Annual Report, various issues.
Chapter Two: An Historical Overview of the Jordanian Banking Sector
20
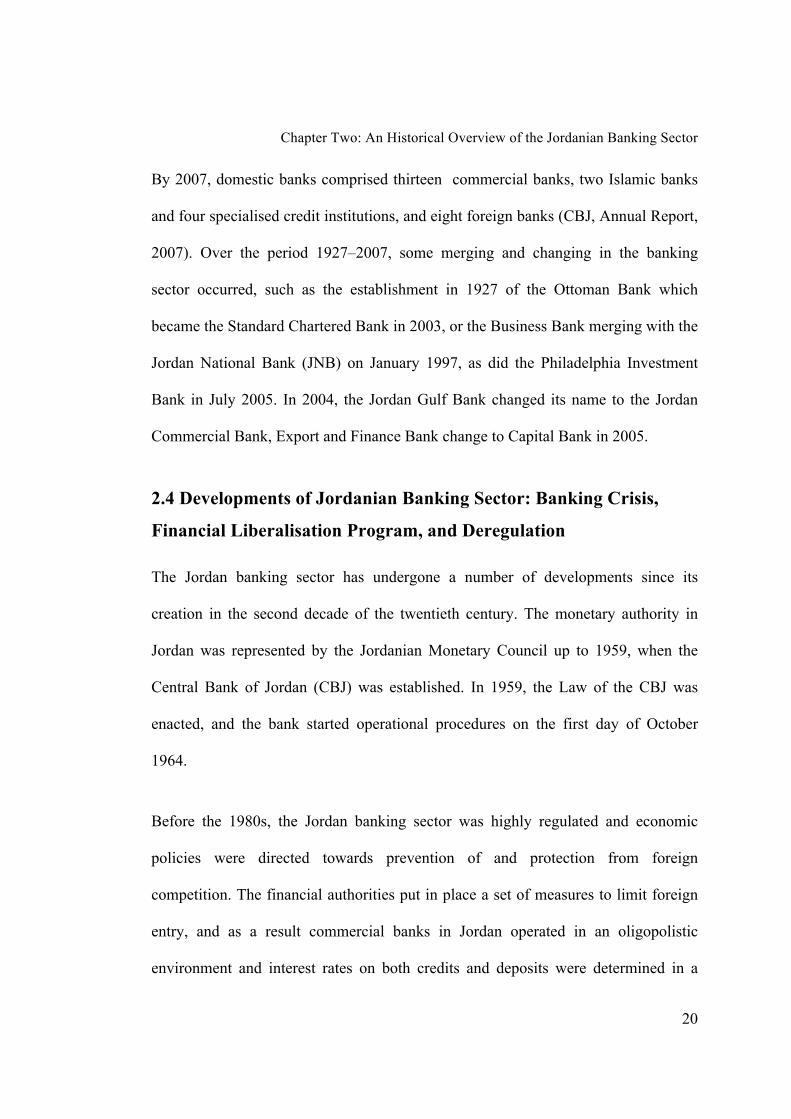
By 2007, domestic banks comprised thirteen commercial banks, two Islamic banks
and four specialised credit institutions, and eight foreign banks (CBJ, Annual Report,
2007). Over the period 1927–2007, some merging and changing in the banking
sector occurred, such as the establishment in 1927 of the Ottoman Bank which
became the Standard Chartered Bank in 2003, or the Business Bank merging with the
Jordan National Bank (JNB) on January 1997, as did the Philadelphia Investment
Bank in July 2005. In 2004, the Jordan Gulf Bank changed its name to the Jordan
Commercial Bank, Export and Finance Bank change to Capital Bank in 2005.
2.4 Developments of Jordanian Banking Sector: Banking Crisis,
Financial Liberalisation Program, and Deregulation
The Jordan banking sector has undergone a number of developments since its
creation in the second decade of the twentieth century. The monetary authority in
Jordan was represented by the Jordanian Monetary Council up to 1959, when the
Central Bank of Jordan (CBJ) was established. In 1959, the Law of the CBJ was
enacted, and the bank started operational procedures on the first day of October
1964.
Before the 1980s, the Jordan banking sector was highly regulated and economic
policies were directed towards prevention of and protection from foreign
competition. The financial authorities put in place a set of measures to limit foreign
entry, and as a result commercial banks in Jordan operated in an oligopolistic
environment and interest rates on both credits and deposits were determined in a
Chapter Two: An Historical Overview of the Jordanian Banking Sector
21
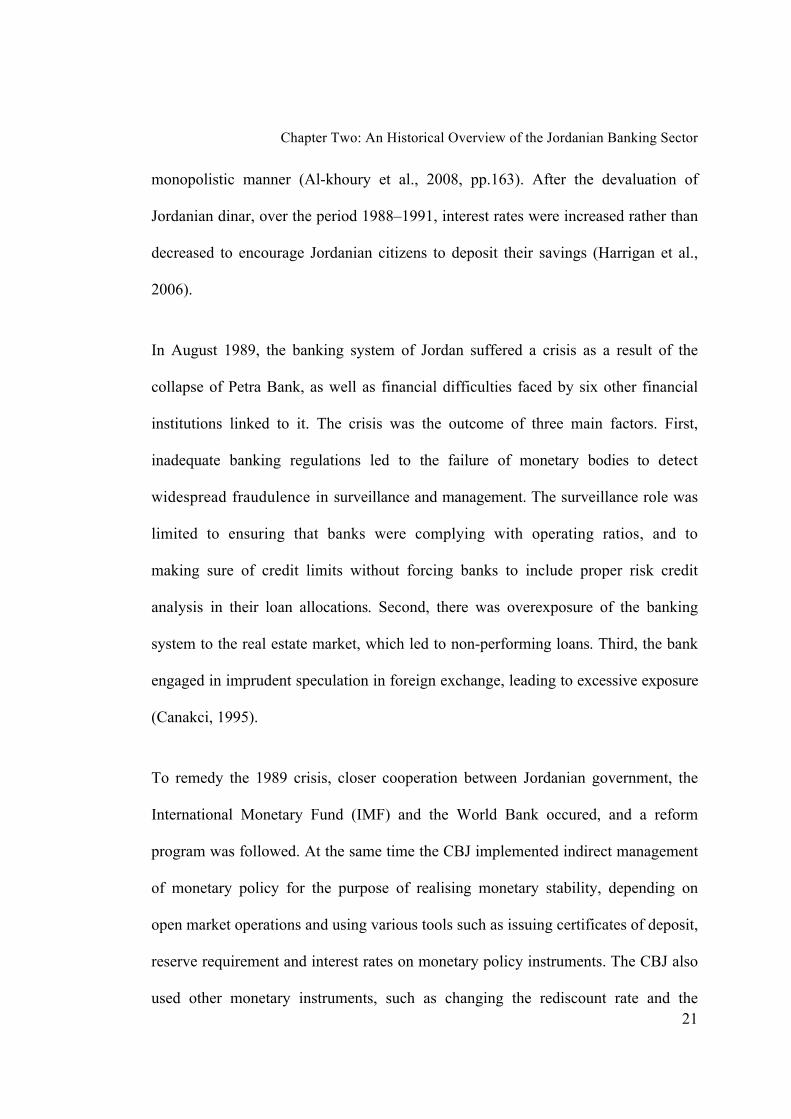
monopolistic manner (Al-khoury et al., 2008, pp.163). After the devaluation of
Jordanian dinar, over the period 1988–1991, interest rates were increased rather than
decreased to encourage Jordanian citizens to deposit their savings (Harrigan et al.,
2006).
In August 1989, the banking system of Jordan suffered a crisis as a result of the
collapse of Petra Bank, as well as financial difficulties faced by six other financial
institutions linked to it. The crisis was the outcome of three main factors. First,
inadequate banking regulations led to the failure of monetary bodies to detect
widespread fraudulence in surveillance and management. The surveillance role was
limited to ensuring that banks were complying with operating ratios, and to
making sure of credit limits without forcing banks to include proper risk credit
analysis in their loan allocations. Second, there was overexposure of the banking
system to the real estate market, which led to non-performing loans. Third, the bank
engaged in imprudent speculation in foreign exchange, leading to excessive exposure
(Canakci, 1995).
To remedy the 1989 crisis, closer cooperation between Jordanian government, the
International Monetary Fund (IMF) and the World Bank occured, and a reform
program was followed. At the same time the CBJ implemented indirect management
of monetary policy for the purpose of realising monetary stability, depending on
open market operations and using various tools such as issuing certificates of deposit,
reserve requirement and interest rates on monetary policy instruments. The CBJ also
used other monetary instruments, such as changing the rediscount rate and the
Chapter Two: An Historical Overview of the Jordanian Banking Sector
22
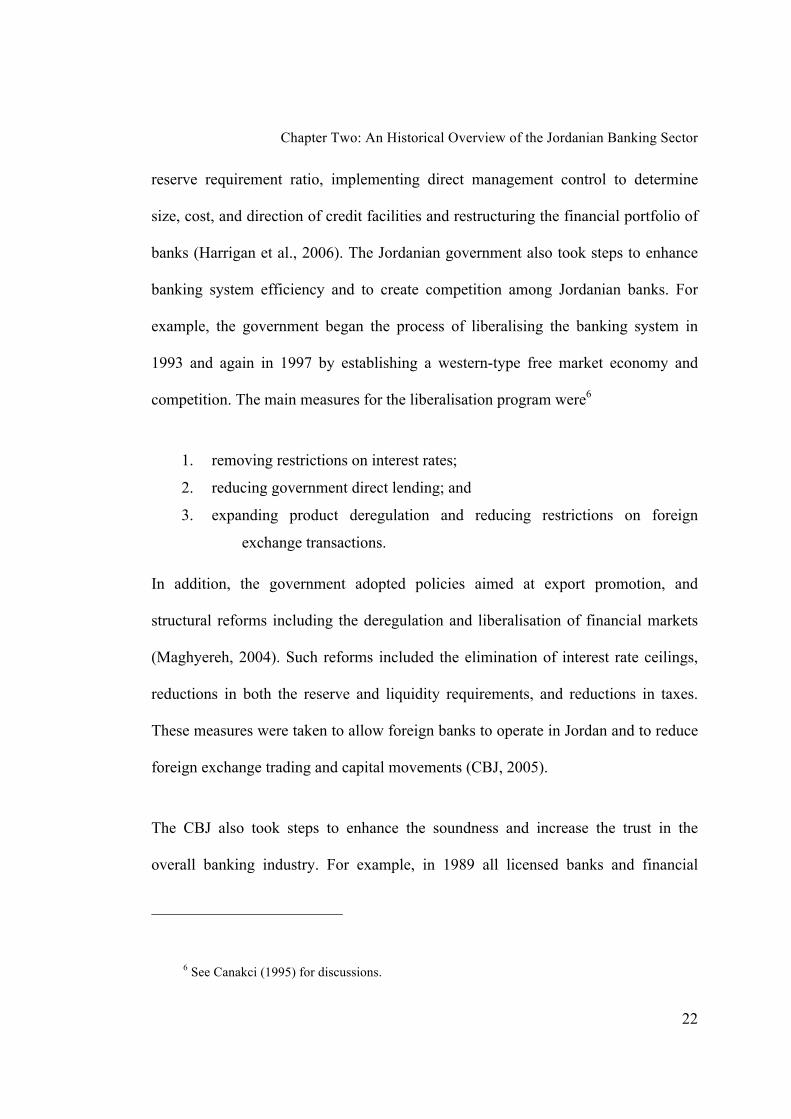
reserve requirement ratio, implementing direct management control to determine
size, cost, and direction of credit facilities and restructuring the financial portfolio of
banks (Harrigan et al., 2006). The Jordanian government also took steps to enhance
banking system efficiency and to create competition among Jordanian banks. For
example, the government began the process of liberalising the banking system in
1993 and again in 1997 by establishing a western-type free market economy and
competition. The main measures for the liberalisation program were6
1. removing restrictions on interest rates;
2. reducing government direct lending; and
3. expanding product deregulation and reducing restrictions on foreign
exchange transactions.
In addition, the government adopted policies aimed at export promotion, and
structural reforms including the deregulation and liberalisation of financial markets
(Maghyereh, 2004). Such reforms included the elimination of interest rate ceilings,
reductions in both the reserve and liquidity requirements, and reductions in taxes.
These measures were taken to allow foreign banks to operate in Jordan and to reduce
foreign exchange trading and capital movements (CBJ, 2005).
The CBJ also took steps to enhance the soundness and increase the trust in the
overall banking industry. For example, in 1989 all licensed banks and financial
6 See Canakci (1995) for discussions.
Chapter Two: An Historical Overview of the Jordanian Banking Sector
23
companies were instructed to deposit 35% of their total deposits as a required reserve
with the CBJ. In the following year, the CBJ liberalised the interest rates charged by
banks and financial companies, based on different types of bank facilities (CBJ,
Annual Report, 1991). In the second half of 1992, it instructed all commercial
banks to restrict the maximum credit in local currency extended to non-residents to
5% of their total credit facilities (CBJ, Annual Report, 1993). Later, in 1995, it
increased the minimum paid-up capital for all domestic banks to JD 20 million, and
foreign banks were asked to raise their capital to JD 10 million by the beginning of
1997. During the period 1998–2001, the CBJ adopted a number of measures and
legislative reforms; banking law was introduced in 2000, as will be discussed later in
this chapter (CBJ, Annual Report, 1993–2001).
A milestone in the financial liberalisation process occurred when Jordan took two
vital steps in 2000. First, Jordan came to an agreement with the WTO, which brought
extensive legislative and regulatory reforms regarding customs and tariffs, patents,
copyright and trademark legislation (Mahdi, 2001). Second, Jordan signed a Free
Trade Area (FTA) agreement with the US, to eliminate trade barriers between the
two countries in the following ten years – only the fourth such agreement with the
US, after Israel, Mexico and Canada (see Kanaan, 2001; Ihsan et al., 2004, p.11).
Towards the end of 2007 CBJ implemented a flexible monetary policy intended to
maintain monetary stability and ensure the invulnerability and soundness of the
banking system. This policy contributed to the achievement of acceptable rates of
economic growth accounting, at 6.0%, and of containing inflation pressure despite
Chapter Two: An Historical Overview of the Jordanian Banking Sector
24
unfavourable conditions such as the unprecedented rise in oil prices and the resultant
rise in the price of basic commodities in the international market in 2007 (CBJ,
Annual Report 2007, Summary of Economic Development).
2.5 An Overview of the CBJ7
The CBJ is one of the most active players in Jordan’s economy. It undertakes and
supervises the most important features of the Jordanian economy such as monetary
policy, fiscal policy and the balance of payments. Management is by a board of
directors appointed by the ministry council. With respect to other important
activities, the CBJ supports Jordan’s budget deficit by financing a portion of any
deficit via monetary expansion. The bank’s capital is totally owned by the
government, and increased gradually from JD1.00 million to JD18.00 million in
2007.8 Despite its ownership, the CBJ is an independent and autonomous corporate
body.
2.5.1 Objectives and Functions of the CBJ
According to legislation, ‘the objectives of the central bank shall be to maintain
monetary stability in the Kingdom, to ensure the convertibility of the Jordanian
Dinar, and to promote the sustained growth of the Kingdom’s economy in
accordance with the general economic policy of the government’ (CBJ, Objective
7 CBJ, available from http://www.cbj.gov.jo/
8 CBJ, Annual Report (2007).
Chapter Two: An Historical Overview of the Jordanian Banking Sector
25
and Functions of the CBJ, 2007). To achieve these objectives, the CBJ’s functions
have evolved to include
1. issuing and regulating bank notes and coins,
2. maintaining and managing the Kingdom’s reserves of gold and foreign
exchange,
3. acting as a banker and fiscal agent to the government and public
institutions,
4. acting as a banker to banks and specialised credit institutions
5. maintaining the safety of the banking system,
6. advising the government on the formulation and implementation of fiscal
and economic policies,
7. managing monetary problems and participating in containing local
economic problems,
8. regulating credit,
9. other roles, such as participating in the establishment of a number of
financial institutions and corporations, such as Amman Stock
Exchange, Jordan Mortgage Refinance Company.
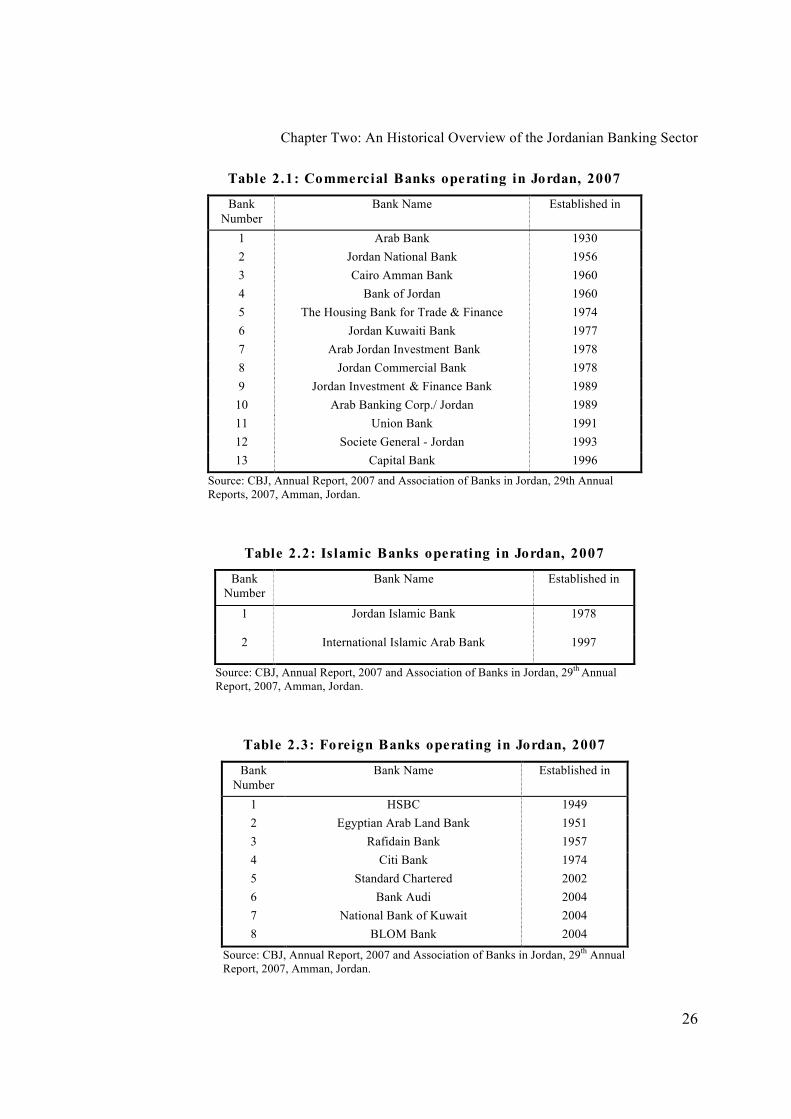
2.6 The Structure of the Banking Sector in Jordan
The Jordanian banking sector consists of the CBJ, the domestic Jordanian banks
(commercial and Islamic), specialised lending institutions, money-changing
companies and representative offices of foreign banks. According to the annual
report for the CBJ of 2007, the domestic banking sector consists of 13 commercial
banks (Table 2.1), two Islamic banks (Table 2.2) and eight foreign banks in Jordan
(Table 2.3).
Chapter Two: An Historical Overview of the Jordanian Banking Sector
26
Table 2.1: Commercial Banks operating in Jordan, 2007
Bank
Number
Bank Name Established in
1 Arab Bank 1930
2 Jordan National Bank 1956
3 Cairo Amman Bank 1960
4 Bank of Jordan 1960
5 The Housing Bank for Trade & Finance 1974
6 Jordan Kuwaiti Bank 1977
7 Arab Jordan Investment Bank 1978
8 Jordan Commercial Bank 1978
9 Jordan Investment & Finance Bank 1989
10 Arab Banking Corp./ Jordan 1989
11 Union Bank 1991
12 Societe General - Jordan 1993
13 Capital Bank 1996
Source: CBJ, Annual Report, 2007 and Association of Banks in Jordan, 29th Annual Reports, 2007, Amman, Jordan.
Table 2.2: Islamic Banks operating in Jordan, 2007
Bank Number
Bank Name Established in
1 Jordan Islamic Bank 1978
2 International Islamic Arab Bank 1997
Source: CBJ, Annual Report, 2007 and Association of Banks in Jordan, 29th Annual Report, 2007, Amman, Jordan.
Table 2.3: Foreign Banks operating in Jordan, 2007
Bank
Number
Bank Name Established in
1 HSBC 1949
2 Egyptian Arab Land Bank 1951
3 Rafidain Bank 1957
4 Citi Bank 1974
5 Standard Chartered 2002
6 Bank Audi 2004
7 National Bank of Kuwait 2004
8 BLOM Bank 2004
Source: CBJ, Annual Report, 2007 and Association of Banks in Jordan, 29th Annual Report, 2007, Amman, Jordan.

Chapter Two: An Historical Overview of the Jordanian Banking Sector
27
2.6.1 Growth in Licensed Banks
Licensed banks in Jordan increased from 19 in 1996 to 23 in 2007 (Table 2.4), due to
the increase in the number of foreign banks from five in 1996 to eight in 2007. The
foreign banks established in 2004 were Blom, Audi and the National Bank of
Kuwait. The number of domestic banks decreased from 16 to 15 after the merger of
Philadelphia Bank and Jordan National Bank in 2005; the, number of licensed banks
operating in Jordan in 2007 were 23, of which 15 were Jordanian and eight were
foreign (five of them Arabian).
Table 2.4: Number of Domestic and Foreign Banks operating in Jordan,
1996–2007
Year Number of Domestic Banks Number of Foreign
Banks
Total
Commercial
Banks
Islamic
Banks
1996 13 1 5 19
1997 12 2 5 19
1998 13 2 5 20
1999 13 2 5 20
2000 14 2 5 21
2001 14 2 5 21
2002 14 2 5 21
2003 14 2 5 21
2004 14 2 8 24
2005 13 2 8 23
2006 13 2 8 23
2007 13 2 8 23
Source: Association of Banks in Jordan, 29th Annual Report, 2007, Amman, Jordan and CBJ, various issues.
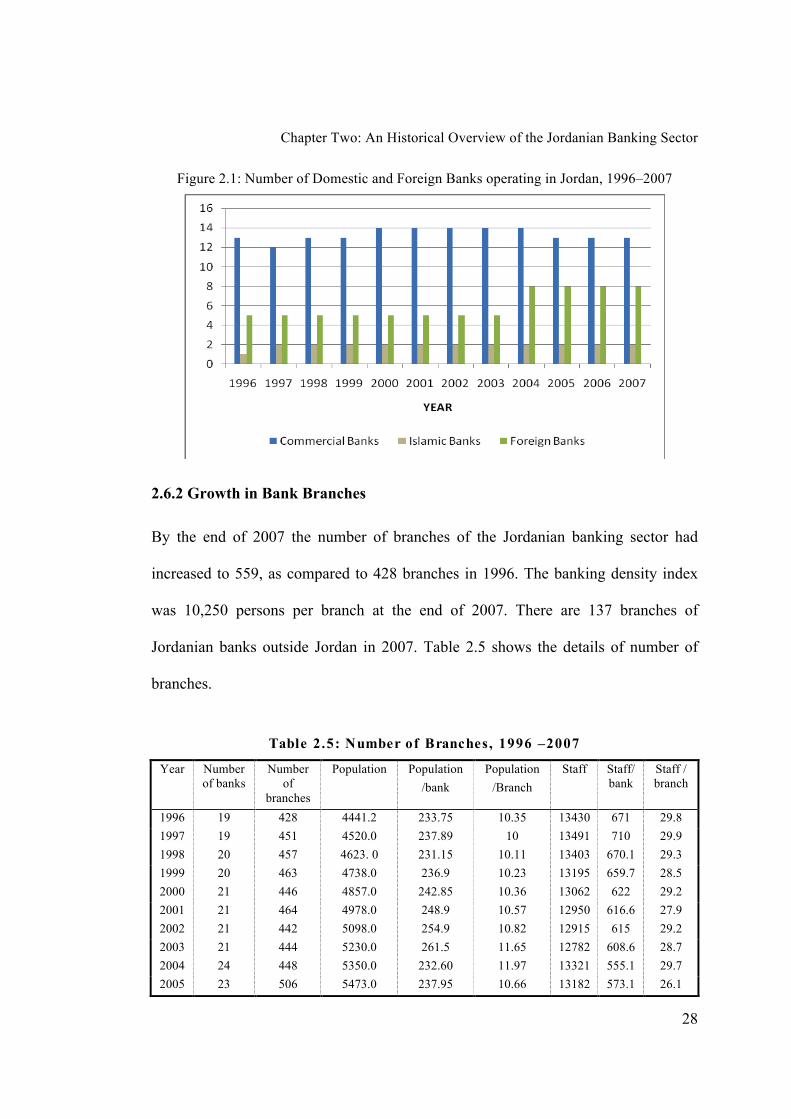
Chapter Two: An Historical Overview of the Jordanian Banking Sector
28
Figure 2.1: Number of Domestic and Foreign Banks operating in Jordan, 1996–2007
2.6.2 Growth in Bank Branches
By the end of 2007 the number of branches of the Jordanian banking sector had
increased to 559, as compared to 428 branches in 1996. The banking density index
was 10,250 persons per branch at the end of 2007. There are 137 branches of
Jordanian banks outside Jordan in 2007. Table 2.5 shows the details of number of
branches.
Table 2.5: Number of Branches, 1996 –2007
Year Number of banks
Number of
branches
Population Population
/bank
Population
/Branch
Staff Staff/ bank
Staff / branch
1996 19 428 4441.2 233.75 10.35 13430 671 29.8
1997 19 451 4520.0 237.89 10 13491 710 29.9
1998 20 457 4623. 0 231.15 10.11 13403 670.1 29.3
1999 20 463 4738.0 236.9 10.23 13195 659.7 28.5
2000 21 446 4857.0 242.85 10.36 13062 622 29.2
2001 21 464 4978.0 248.9 10.57 12950 616.6 27.9
2002 21 442 5098.0 254.9 10.82 12915 615 29.2
2003 21 444 5230.0 261.5 11.65 12782 608.6 28.7
2004 24 448 5350.0 232.60 11.97 13321 555.1 29.7
2005 23 506 5473.0 237.95 10.66 13182 573.1 26.1

Chapter Two: An Historical Overview of the Jordanian Banking Sector
29
2006 23 516 5600.0 243.47 10.87 14165 615.8 27.4
2007 23 559 5723.0 248.82 10.26 15065 655 26.9
Sources: Association of Banks in Jordan, 29th Annual Report, 2007 and CBJ, Annual Report, 2007.
2.7 Development of Jordanian Banks’ Assets, Credit Facilities and
Deposits
2.7.1 Growth of Assets
The Jordanian banking sector witnessed an impressive growth in assets over the
period 1996–2007. Table 2.6 provides information about the total assets of the
domestic and foreign banks in Jordan. For example, the total assets of banks
operating in Jordan jumped from JD 8857.7 million in 1996 to JD 26815.6 million at
the end of 2007, with an annual growth of 10.64% in 2007. The banks’ assets as a
percentage of the gross domestic product at current market prices increased from
180.3% in 1996 to 228.77% in 2007. The total assets of foreign banks operating in
Jordan during this time were a quarter of the total assets of the Jordanian sector. The
total assets held by foreign banks increased over the period 1996–2001, from 22.8%
in 1996 to 30.60% in 2001, then decreased to 24.30% in 2007.
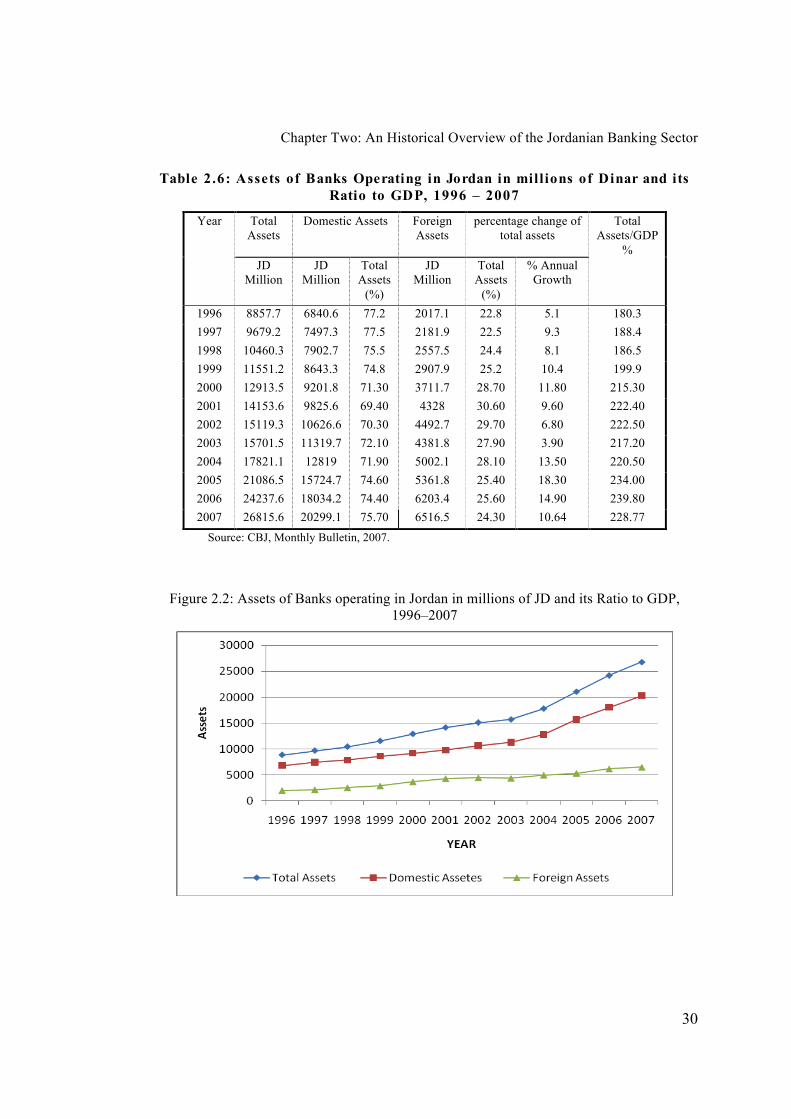
Chapter Two: An Historical Overview of the Jordanian Banking Sector
30
Table 2.6: Assets of Banks Operating in Jordan in mill ions of Dinar and its
Ratio to GDP, 1996 – 2007
Year Total Assets
Domestic Assets Foreign Assets
percentage change of total assets
Total Assets/GDP
%
JD Million
JD Million
Total Assets
(%)
JD Million
Total Assets
(%)
% Annual Growth
1996 8857.7 6840.6 77.2 2017.1 22.8 5.1 180.3
1997 9679.2 7497.3 77.5 2181.9 22.5 9.3 188.4
1998 10460.3 7902.7 75.5 2557.5 24.4 8.1 186.5
1999 11551.2 8643.3 74.8 2907.9 25.2 10.4 199.9
2000 12913.5 9201.8 71.30 3711.7 28.70 11.80 215.30
2001 14153.6 9825.6 69.40 4328 30.60 9.60 222.40
2002 15119.3 10626.6 70.30 4492.7 29.70 6.80 222.50
2003 15701.5 11319.7 72.10 4381.8 27.90 3.90 217.20
2004 17821.1 12819 71.90 5002.1 28.10 13.50 220.50
2005 21086.5 15724.7 74.60 5361.8 25.40 18.30 234.00
2006 24237.6 18034.2 74.40 6203.4 25.60 14.90 239.80
2007 26815.6 20299.1 75.70 6516.5 24.30 10.64 228.77
Source: CBJ, Monthly Bulletin, 2007.
Figure 2.2: Assets of Banks operating in Jordan in millions of JD and its Ratio to GDP, 1996–2007

Chapter Two: An Historical Overview of the Jordanian Banking Sector
31
2.7.2 Growth in Credit Facilities
2.7.2.1 Growth of Credit Facilities in Jordanian Dinar and Foreign
Currencies
Table 2.7 shows that the balance of credits increased from JD 3920.3 million in 1996
to JD 11295.6 million at the end of 2007. In contrast, there was a decrease in the
percentage of credits in domestic currencies to total credit facilities from 91.58% in
1996 to 90.30% as of the end of 2007.
Table 2.7: Total Credit Facilities Extended by Banks operating in Jordan
and its Ratio to GDP, 1996–2007
Year Total
Credit Facilities
in (JD) Million
Domestic Credit
Facilities
Foreign Credit
Facilities
Percentage
change of Total
Credit Facilities
Percentage
of Total Credit
Facilities to GDP
JD
Million
Percent of
Total Credit
Facilities
JD
Million
Percent of
Total Credit
Facilities
1996 3920.3 3590.4 91.58 329.9 8.42 ** 79.8
1997 3979.7 3562.7 89.52 417.0 10.48 1.5 77.5
1998 4285.3 3746.1 87.42 539.2 12.58 7.7 76.4
1999 4466.0 3871.7 86.69 594.3 13.31 4.2 77.3
2000 4546.5 3,936.8 86.59 609.7 13.41 1.80 75.8
2001 4948.9 4,251.9 85.92 697.0 14.08 8.90 77.8
2002 5130.0 4,311.9 84.05 818.1 15.95 3.70 75.5
2003 5262.4 4,333.0 82.34 929.4 17.66 2.60 72.8
2004 6189.2 5,227.9 84.47 961.3 15.53 17.60 76.6
2005 7744.3 6,887.4 88.94 856.9 11.06 25.10 85.9
2006 9761.9 8,761.8 89.76 1000.1 10.24 26.10 96.6
2007 11295.6 10,199.7 90.30 1095.9 9.70 15.71 97.3
Source: CBJ, Monthly Bulletin, 2007.
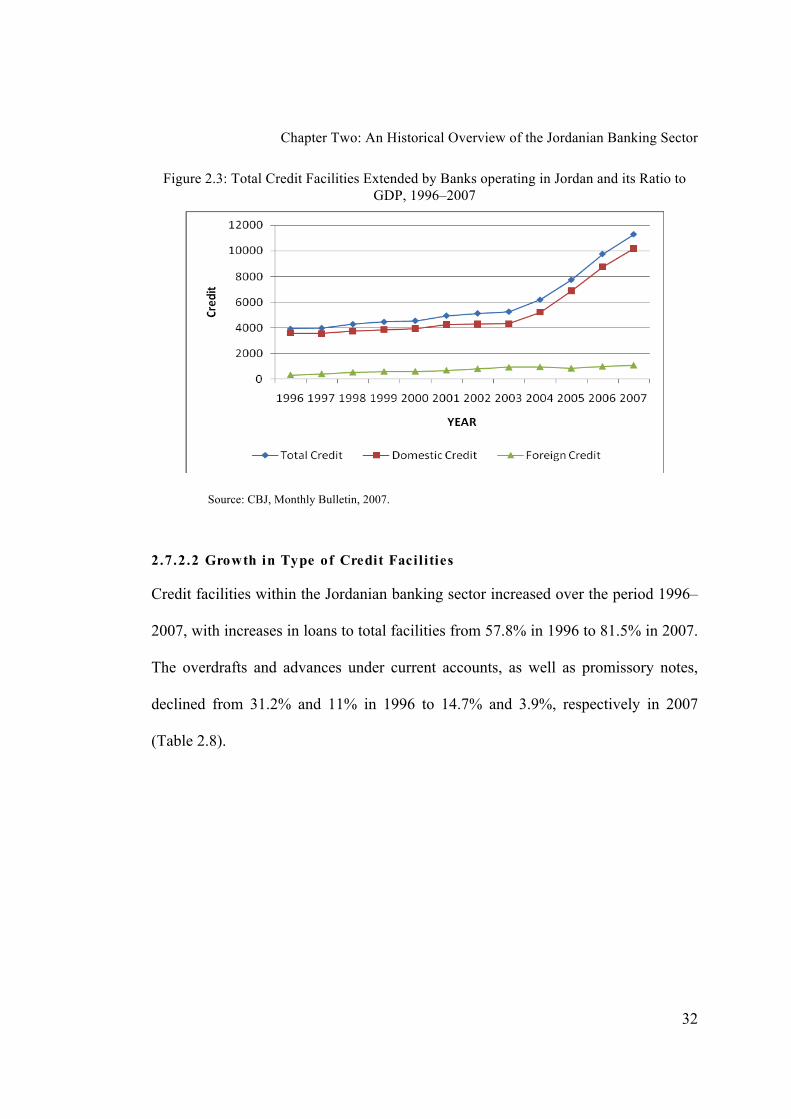
Chapter Two: An Historical Overview of the Jordanian Banking Sector
32
Figure 2.3: Total Credit Facilities Extended by Banks operating in Jordan and its Ratio to
GDP, 1996–2007
Source: CBJ, Monthly Bulletin, 2007.
2.7.2.2 Growth in Type of Credit Facilities
Credit facilities within the Jordanian banking sector increased over the period 1996–
2007, with increases in loans to total facilities from 57.8% in 1996 to 81.5% in 2007.
The overdrafts and advances under current accounts, as well as promissory notes,
declined from 31.2% and 11% in 1996 to 14.7% and 3.9%, respectively in 2007
(Table 2.8).
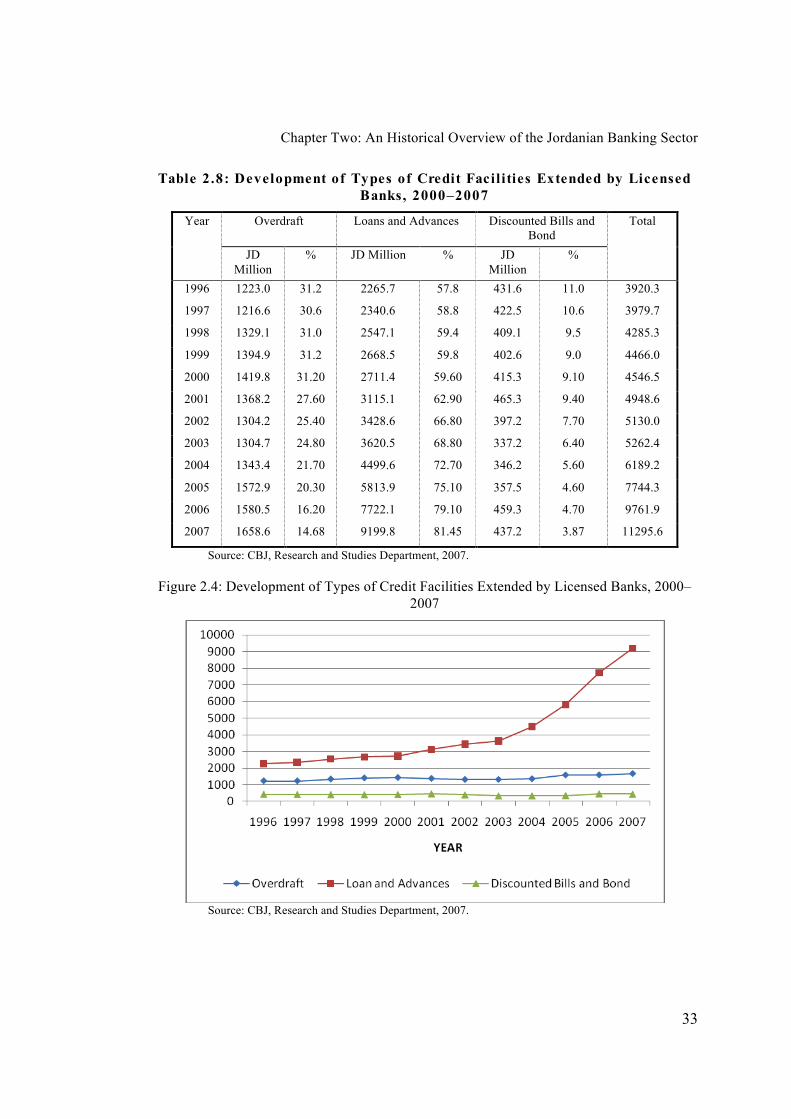
Chapter Two: An Historical Overview of the Jordanian Banking Sector
33
Table 2.8: Development of Types of Credit Facilities Extended by Licensed
Banks, 2000–2007
Year Overdraft Loans and Advances Discounted Bills and Bond
Total
JD
Million
% JD Million % JD
Million
%
1996 1223.0 31.2 2265.7 57.8 431.6 11.0 3920.3
1997 1216.6 30.6 2340.6 58.8 422.5 10.6 3979.7
1998 1329.1 31.0 2547.1 59.4 409.1 9.5 4285.3
1999 1394.9 31.2 2668.5 59.8 402.6 9.0 4466.0
2000 1419.8 31.20 2711.4 59.60 415.3 9.10 4546.5
2001 1368.2 27.60 3115.1 62.90 465.3 9.40 4948.6
2002 1304.2 25.40 3428.6 66.80 397.2 7.70 5130.0
2003 1304.7 24.80 3620.5 68.80 337.2 6.40 5262.4
2004 1343.4 21.70 4499.6 72.70 346.2 5.60 6189.2
2005 1572.9 20.30 5813.9 75.10 357.5 4.60 7744.3
2006 1580.5 16.20 7722.1 79.10 459.3 4.70 9761.9
2007 1658.6 14.68 9199.8 81.45 437.2 3.87 11295.6
Source: CBJ, Research and Studies Department, 2007.
Figure 2.4: Development of Types of Credit Facilities Extended by Licensed Banks, 2000–
2007
Source: CBJ, Research and Studies Department, 2007.
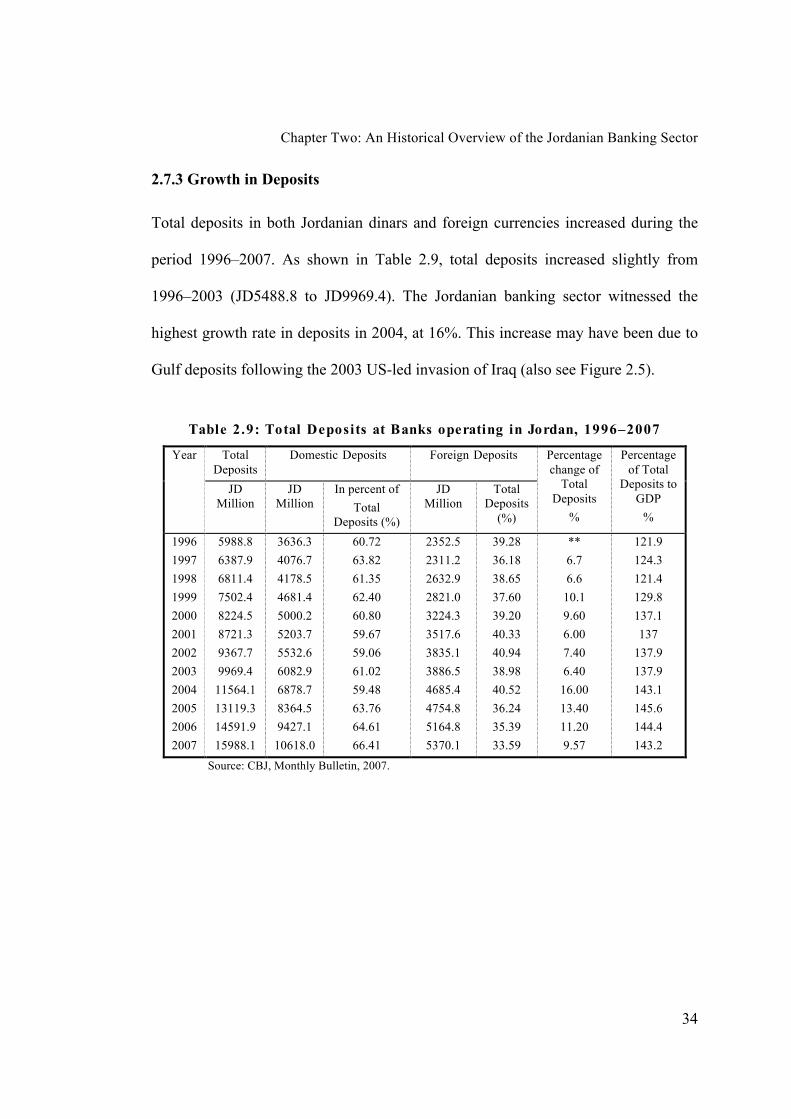
Chapter Two: An Historical Overview of the Jordanian Banking Sector
34
2.7.3 Growth in Deposits
Total deposits in both Jordanian dinars and foreign currencies increased during the
period 1996–2007. As shown in Table 2.9, total deposits increased slightly from
1996–2003 (JD5488.8 to JD9969.4). The Jordanian banking sector witnessed the
highest growth rate in deposits in 2004, at 16%. This increase may have been due to
Gulf deposits following the 2003 US-led invasion of Iraq (also see Figure 2.5).
Table 2.9: Total Deposits at Banks operating in Jordan, 1996–2007
Year Total
Deposits
Domestic Deposits Foreign Deposits Percentage
change of Total
Deposits
%
Percentage
of Total Deposits to
GDP
%
JD Million
JD Million
In percent of
Total Deposits (%)
JD Million
Total Deposits
(%)
1996
1997
1998
1999
2000
2001
2002
2003
2004
2005
2006
2007
5988.8
6387.9
6811.4
7502.4
8224.5
8721.3
9367.7
9969.4
11564.1
13119.3
14591.9
15988.1
3636.3
4076.7
4178.5
4681.4
5000.2
5203.7
5532.6
6082.9
6878.7
8364.5
9427.1
10618.0
60.72
63.82
61.35
62.40
60.80
59.67
59.06
61.02
59.48
63.76
64.61
66.41
2352.5
2311.2
2632.9
2821.0
3224.3
3517.6
3835.1
3886.5
4685.4
4754.8
5164.8
5370.1
39.28
36.18
38.65
37.60
39.20
40.33
40.94
38.98
40.52
36.24
35.39
33.59
**
6.7
6.6
10.1
9.60
6.00
7.40
6.40
16.00
13.40
11.20
9.57
121.9
124.3
121.4
129.8
137.1
137
137.9
137.9
143.1
145.6
144.4
143.2
Source: CBJ, Monthly Bulletin, 2007.

Chapter Two: An Historical Overview of the Jordanian Banking Sector
35
Figure 2.5: Total Deposits of Banks operating in Jordan, 1996–2007
Source: CBJ, Monthly Bulletin, 2007.
2.7.3.1 Changing Structure of Deposits
It is worth mentioning that the structure of deposits has changed during the past
decade in favour of demand deposits at the expense of term deposits. Demand
deposits increased from JD 925.6 in 1996 to JD 4001.9 at the end of 2007 whereas
saving deposits increased from JD 782.2 in 1996 to JD2002.9 in 2007, while time
deposits increased from JD 4581 in 1996 to JD 9983.3 at the end of 2007 (Table
2.10).
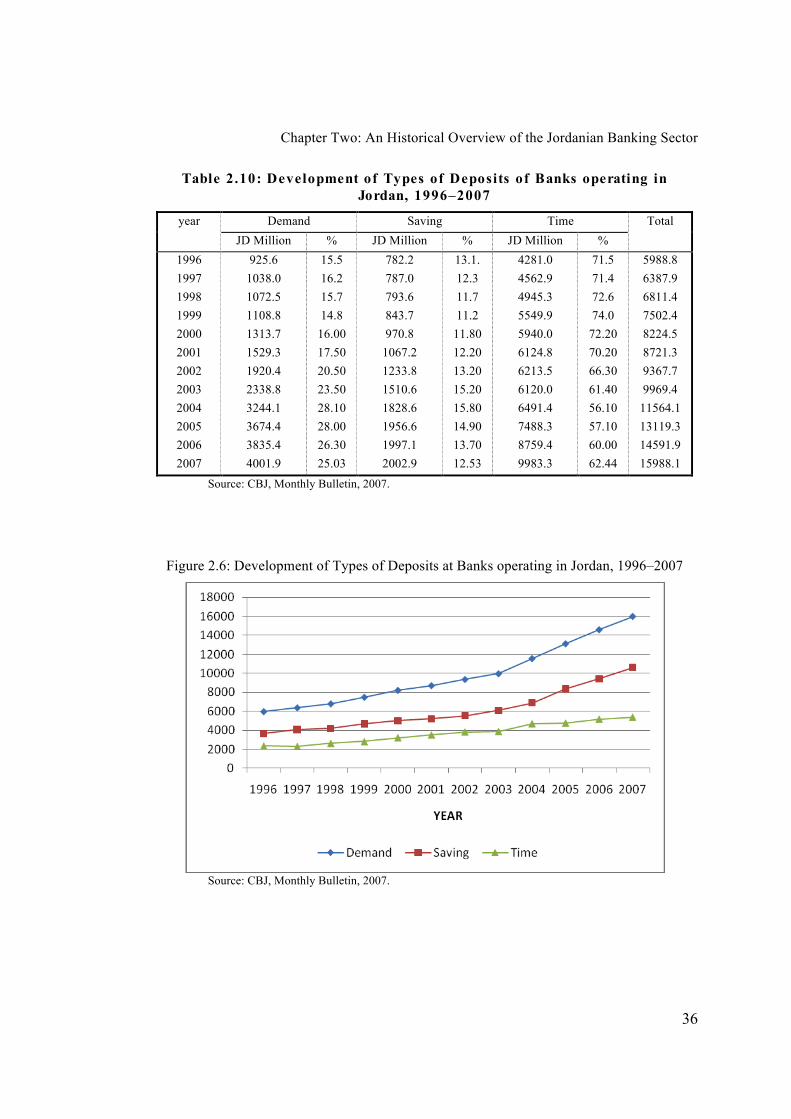
Chapter Two: An Historical Overview of the Jordanian Banking Sector
36
Table 2.10: Development of Types of Deposits of Banks operating in
Jordan, 1996–2007
year Demand Saving Time Total
JD Million % JD Million % JD Million %
1996
1997
1998
1999
2000
2001
2002
2003
2004
2005
2006
2007
925.6
1038.0
1072.5
1108.8
1313.7
1529.3
1920.4
2338.8
3244.1
3674.4
3835.4
4001.9
15.5
16.2
15.7
14.8
16.00
17.50
20.50
23.50
28.10
28.00
26.30
25.03
782.2
787.0
793.6
843.7
970.8
1067.2
1233.8
1510.6
1828.6
1956.6
1997.1
2002.9
13.1.
12.3
11.7
11.2
11.80
12.20
13.20
15.20
15.80
14.90
13.70
12.53
4281.0
4562.9
4945.3
5549.9
5940.0
6124.8
6213.5
6120.0
6491.4
7488.3
8759.4
9983.3
71.5
71.4
72.6
74.0
72.20
70.20
66.30
61.40
56.10
57.10
60.00
62.44
5988.8
6387.9
6811.4
7502.4
8224.5
8721.3
9367.7
9969.4
11564.1
13119.3
14591.9
15988.1
Source: CBJ, Monthly Bulletin, 2007.
Figure 2.6: Development of Types of Deposits at Banks operating in Jordan, 1996–2007
Source: CBJ, Monthly Bulletin, 2007.
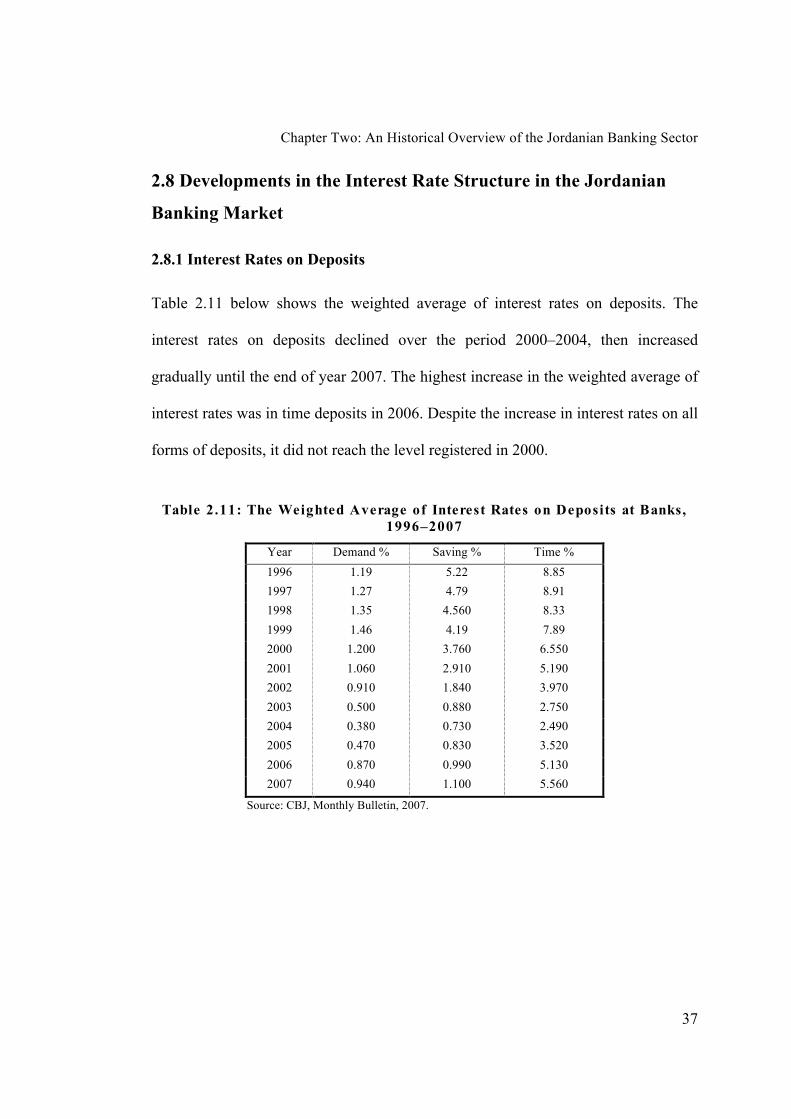
Chapter Two: An Historical Overview of the Jordanian Banking Sector
37
2.8 Developments in the Interest Rate Structure in the Jordanian
Banking Market
2.8.1 Interest Rates on Deposits
Table 2.11 below shows the weighted average of interest rates on deposits. The
interest rates on deposits declined over the period 2000–2004, then increased
gradually until the end of year 2007. The highest increase in the weighted average of
interest rates was in time deposits in 2006. Despite the increase in interest rates on all
forms of deposits, it did not reach the level registered in 2000.
Table 2.11: The Weighted Average of Interest Rates on Deposits at Banks,
1996–2007
Year Demand % Saving % Time %
1996 1.19 5.22 8.85
1997 1.27 4.79 8.91
1998 1.35 4.560 8.33
1999 1.46 4.19 7.89
2000 1.200 3.760 6.550
2001 1.060 2.910 5.190
2002 0.910 1.840 3.970
2003 0.500 0.880 2.750
2004 0.380 0.730 2.490
2005 0.470 0.830 3.520
2006 0.870 0.990 5.130
2007 0.940 1.100 5.560
Source: CBJ, Monthly Bulletin, 2007.

Chapter Two: An Historical Overview of the Jordanian Banking Sector
38
Figure 2.7: The Weighted Average of Interest Rates on Deposits at Banks, 1996–2007
Source: CBJ, Monthly Bulletin, 2007.
2.8.2 Interest Rates on Credit Facilities
The weighted average of interest rates on all kinds of credit facilities declined over
the period 1996– 2004, then increased gradually until 2007 (see Table 2.12).
Table 2.12: The Weighted Average of Interest Rates on Credit Facilities
Extended by Banks, 1996–2007
Year Overdrafts % Loans & Advances
%
Discounted Bills & Bonds
%
1996 12.93 11.60 12.66
1997 13.12 12.55 13.44
1998 12.49 12.89 13.97
1999 12.66 12.67 13.37
2000 11.600 11.380 12.810
2001 10.420 10.450 11.880
2002 9.350 9.850 10.950
2003 9.430 8.920 10.240
2004 8.790 7.590 8.980
2005 9.260 8.100 7.920
2006 9.230 8.560 8.720
2007 9.830 8.860 9.450
Source: CBJ, Monthly Bulletin, 2007.

Chapter Two: An Historical Overview of the Jordanian Banking Sector
39
Figure 2.8: The Weighted Average of Interest Rates on Credit Facilities Extended by
Banks, 1996–2007
Source: CBJ, Monthly Bulletin, 2007.
2.9 Developments in Jordanian Banking Sector Services
The Jordanian banking sector took steps to modernise and develop their products,
keeping them in line with developments in the international banking industry. Banks
developed their services and diversified their products in conformity with the results
and outputs of the information technology and telecommunications revolution. Until
the end of 2007, the Jordanian banking sector introduced approximately 66 new
services, mostly by employing technology in the service of clients. Table 2.13 details
the services introduced by the end of 2007. Table 2.14 details the rapid
technological growth the Jordanian banking sector underwent to modernise and
develop their services and to attract more customers. For instance, banks designed
websites for their customers and, from 2007, provided new electronic services.

Chapter Two: An Historical Overview of the Jordanian Banking Sector
40
Table 2.13: New Services Introduced by the End of 2007
Source: Association of Banks in Jordan, 29th Annual Reports, 2007. Amman, Jordan.
Name of service Name of service
Car financing
Housing financing
Opening five new branches
Expanding ATM network
Establishing quality assurance unit
Accepting loan applications via the bank’s website
Upgrading the automated phone banking services “ Hala Arabi”
Launching new website: www.arabbank.com.jo
Online cash deposit service available at 20 ATM locations
Electronic clearing
Ma’ak Visa credit card programme
Al-Hal programme for personal loans
Mubarak programme for car loans
Financing projects of Housing and Urban Development Department
Establishing 12 specialized centers for developing SMEs
Finance leasing
New campaign for saving accounts
Accepting Social Security subscriptions
Call centre
Operating the customers’ management system
Launching the follow-up collection unit
Launching the customers’ follow-unit
“Let’s Go Places” campaign
“Know Your Customer” campaign
“My Business” revolving loan
National premium banking service
Microfinance
Internet banking
SMS banking
Banking services via Jordan Post
Fuel loans
Golden deposit account
Medical loans
Social Security subscription payment
Orange bill payment
Social Security installment payments
Financing travel packages
Discounted certificates of deposit
Western Union transfers via internet
Secure shopping via internet (VBV)
Electronic clearing
Camera surveillance for branches and ATMs
Prepaid cards service
ABC Online “Jordan”
Social Security subscription payment
IN card for companies
Premier centre
My Rewards Points programme
Credit cover
Opening new branch in Abdoun
Gold certificates Visa cards
Assortment of credit cards Visa card :SMS service
Visa card: SMS service
Master card: SMS service
LCD loan
Furniture loan

Chapter Two: An Historical Overview of the Jordanian Banking Sector
41
Table 2.14: Electronic Banking Services in the End of 2007
Corporate e-banking
Retail e-banking
Availability of Online
services in Jordan
Website Bank’s Name
Yes Yes Yes www.arabbank.com.jo Arab Bank
Yes Yes Yes www.ahli.com Jordan National
Bank
No Yes Yes www.cab.jo Cairo Amman Bank
Yes Yes Yes www.bankofjordan.com Bank of Jordan
Yes Yes Yes www.hbtf.com The Housing Bank for Trade & Finance
Yes Yes Yes www.jordan-kuwait-bank.com Jordan Kuwait Bank
Yes Yes Yes www.ajib.com Arab Jordan
Investment Bank
No No No www.jgbank.com.jo Jordan Commercial Bank
Yes Yes Yes www.jordanislamiCBJnk.com Jordan Islamic Bank
No Yes Yes www.jifbank.com Jordan Investment
& Finance Bank
Yes Yes Yes www.arabbanking.com.jo Arab Banking Corp.
Yes Yes Yes www.unionbankjo.com Union Bank
Yes Yes Yes www.sgbj.com.jo Societe General Bank-Jordan
Yes Yes Yes www.capitalbank.jo Capital Bank
No No No www.iiabank.com.jo International Islamic
Arab Bank
Yes Yes Yes www.jordan.hsbc.com HSBC
No No No www.arakari.com.jo Egyptian Arab Land
Bank
No No No www.rafidain-bank.org Rafidain Bank
NA NA NA www.citibank.com/jordan Citi Bank
No Yes Yes www.standardchartered.com Standard Chartered
Yes Yes Yes www.audi.com.lb Bank Audi
No No No www.nbk.com National Bank of Kuwait
Yes Yes Yes www.blom.com.lb BLOM Bank
Source: Association of Banks in Jordan, 29th Annual Reports, 2007. Amman, Jordan.
Chapter Two: An Historical Overview of the Jordanian Banking Sector
42
2.10 The Development of Islamic Banks
After the independence of Arab and Muslim countries several experiments were
undertaken in an effort to establish Islamic financial institutions. The first idea for
Islamic banks emerged in Pakistan in the nineteen forties. In the sixties the first
attempt to establish Islamic banks occurred in Egypt. Ahmad Elnajar introduced
savings banks based on profit-sharing in the Egyptian town of Mit Ghamr in 1963. In
1971 the bank was closed because of political circumstances. In 1972, the Mit Ghamr
savings project became part of the Naser Social Bank (Al Qeri, 1996). In the late
sixties, several Islamic countries endorsed the notion of Islamic banks. The Islamic
Summit conference in Rabat/ Morocco in 1969 decided to refer the matter to the
Arab Foreign Ministers’ meeting, held on 25–28 December 1970, where it was
proposed to establish an international Islamic bank. In 1974 the first Islamic bank,
under the name of the Islamic Development Bank, was established in Jeddah/
Kingdom of Saudi Arabia with the participation of governments of the Islamic states
(Al-Qeri, 1996). In 1975, after the establishment of the Dubai Islamic Bank in United
Arab Emirates, Islamic countries have established more Islamic banks, basing them
on the statute of Dubai Islamic Bank. In 1976, the Islamic Development Bank
commenced its activities in Jeddah/ Kingdom of Saudi Arabia after approval from
the finance ministers of 36 Islamic states; it is deemed the first international Islamic
bank.
Later, the idea of Islamic banks spread over the world: an important indication of
international acceptance of the idea of Islamic banking. The seventies witnessed the
Chapter Two: An Historical Overview of the Jordanian Banking Sector
43
emergence of many Islamic banks in various Arab countries, such as the Faisal
Islamic Bank of Sudan in (1978), the Jordan Islamic Bank for Finance and
Investment in (1978) and the Bahrain Islamic Bank in (1979) (Sowan, 2000).
2.10.1 Historical Developments of the Islamic Banks Operating in Jordan
At the end of the 1970s the Islamic banking system was introduced to Jordan. The
Jordan Islamic Bank for Finance and Investment was the first, established in 1978 as
a member of the Saudi Arabia-based Al Baraka network of Islamic banks (Zeitun &
Saleh, 2006), although 90% of its capital is owned by Jordanian citizens. Later, a
number of Islamic financial institutions such as the Finance House and the Islamic
Investment House were established; these later became the National Islamic Bank
(Zeitun & Saleh, 2006). By 1986 the Jordan Islamic Bank for Finance and
Investment was the sixth largest of Jordan’s banks in assets, and had financed
numerous projects. In 1997 a second Islamic bank was established by the Arab Bank,
the Islamic International Arab Bank. Jordan was one of the first countries to organise
the work of the Islamic banks, with the issuance of the banking law of Jordan in
2000. Since then, Jordan has witnessed the emergence of a new generation of Islamic
financial institutions. With regard to the size of the domestic market, Jordan has
taken serious steps to integrate her with other regional markets, whether stock
markets the banking sector or the financial sector. In 2007 the Industrial
Development Bank completed all necessary formalities to become an Islamic bank.
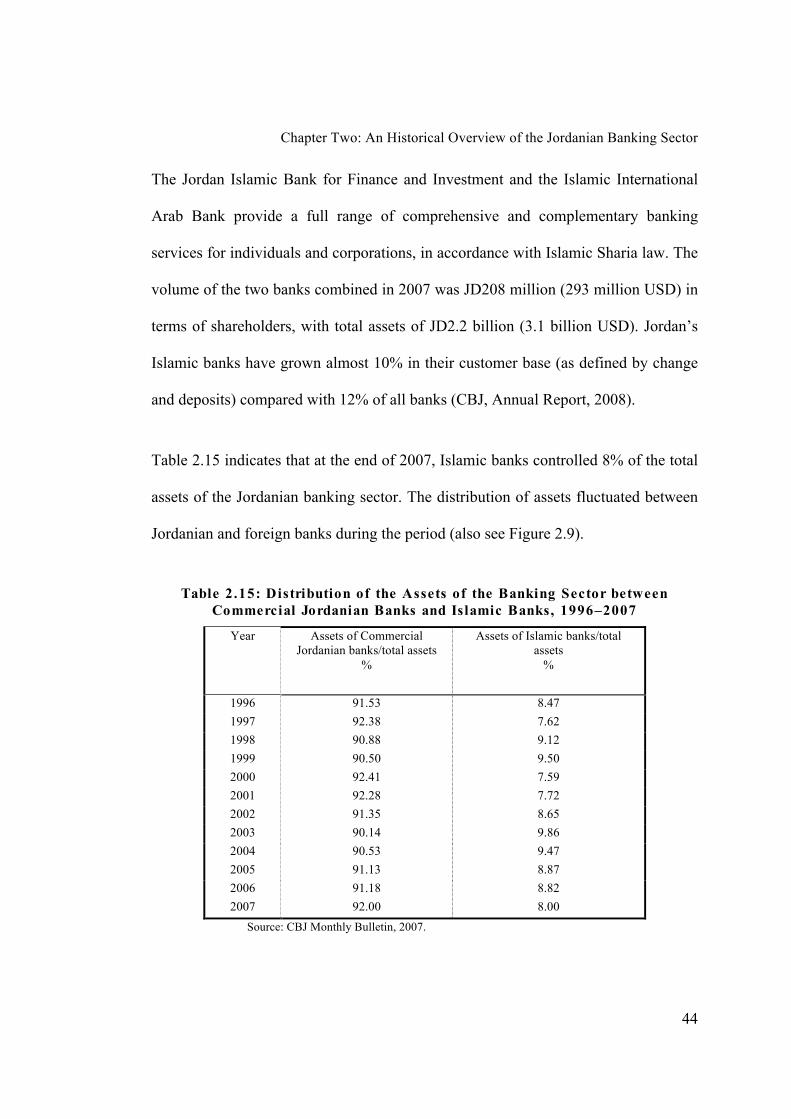
Chapter Two: An Historical Overview of the Jordanian Banking Sector
44
The Jordan Islamic Bank for Finance and Investment and the Islamic International
Arab Bank provide a full range of comprehensive and complementary banking
services for individuals and corporations, in accordance with Islamic Sharia law. The
volume of the two banks combined in 2007 was JD208 million (293 million USD) in
terms of shareholders, with total assets of JD2.2 billion (3.1 billion USD). Jordan’s
Islamic banks have grown almost 10% in their customer base (as defined by change
and deposits) compared with 12% of all banks (CBJ, Annual Report, 2008).
Table 2.15 indicates that at the end of 2007, Islamic banks controlled 8% of the total
assets of the Jordanian banking sector. The distribution of assets fluctuated between
Jordanian and foreign banks during the period (also see Figure 2.9).
Table 2.15: Distribution of the Assets of the Banking Sector between
Commercial Jordanian Banks and Islamic Banks, 1996–2007
Year Assets of Commercial Jordanian banks/total assets
%
Assets of Islamic banks/total assets
%
1996 91.53 8.47
1997 92.38 7.62
1998 90.88 9.12
1999 90.50 9.50
2000 92.41 7.59
2001 92.28 7.72
2002 91.35 8.65
2003 90.14 9.86
2004 90.53 9.47
2005 91.13 8.87
2006 91.18 8.82
2007 92.00 8.00
Source: CBJ Monthly Bulletin, 2007.
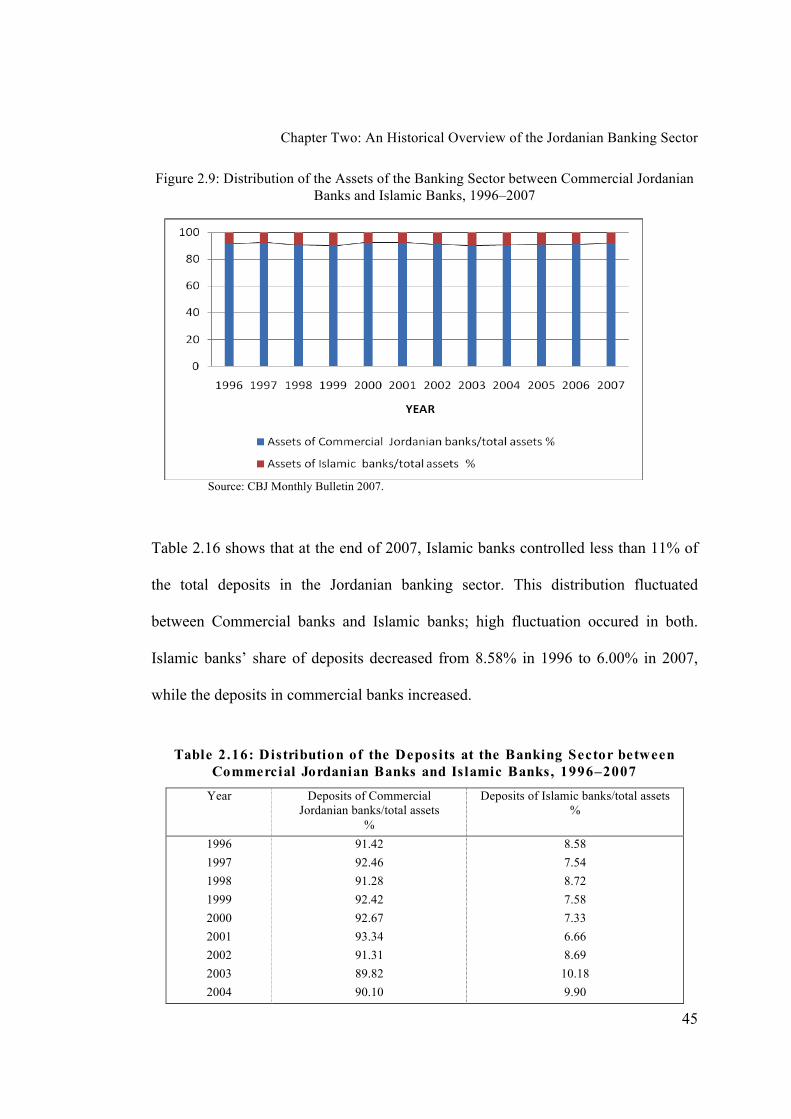
Chapter Two: An Historical Overview of the Jordanian Banking Sector
45
Figure 2.9: Distribution of the Assets of the Banking Sector between Commercial Jordanian
Banks and Islamic Banks, 1996–2007
Source: CBJ Monthly Bulletin 2007.
Table 2.16 shows that at the end of 2007, Islamic banks controlled less than 11% of
the total deposits in the Jordanian banking sector. This distribution fluctuated
between Commercial banks and Islamic banks; high fluctuation occured in both.
Islamic banks’ share of deposits decreased from 8.58% in 1996 to 6.00% in 2007,
while the deposits in commercial banks increased.
Table 2.16: Distribution of the Deposits at the Banking Sector between
Commercial Jordanian Banks and Islamic Banks, 1996–2007
Year Deposits of Commercial Jordanian banks/total assets
%
Deposits of Islamic banks/total assets %
1996
1997
1998
1999
2000
2001
2002
2003
2004
91.42
92.46
91.28
92.42
92.67
93.34
91.31
89.82
90.10
8.58
7.54
8.72
7.58
7.33
6.66
8.69
10.18
9.90
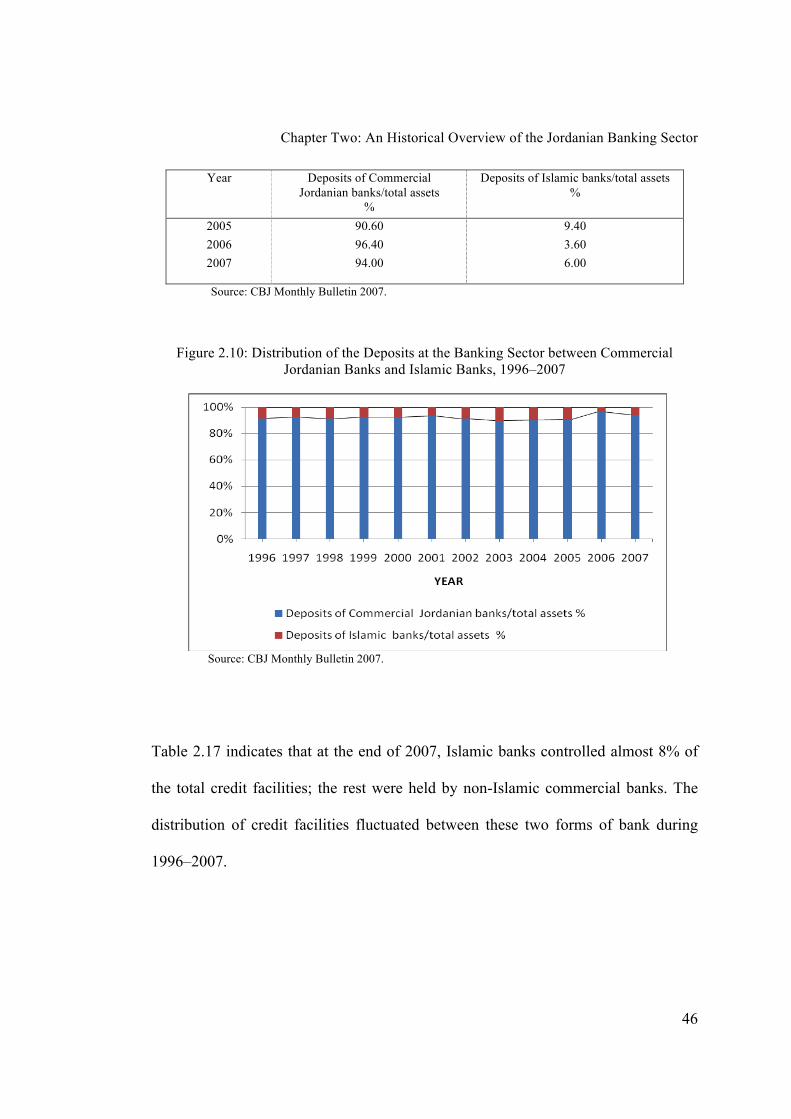
Chapter Two: An Historical Overview of the Jordanian Banking Sector
46
Year Deposits of Commercial
Jordanian banks/total assets %
Deposits of Islamic banks/total assets
%
2005
2006
2007
90.60
96.40
94.00
9.40
3.60
6.00
Source: CBJ Monthly Bulletin 2007.
Figure 2.10: Distribution of the Deposits at the Banking Sector between Commercial Jordanian Banks and Islamic Banks, 1996–2007
Source: CBJ Monthly Bulletin 2007.
Table 2.17 indicates that at the end of 2007, Islamic banks controlled almost 8% of
the total credit facilities; the rest were held by non-Islamic commercial banks. The
distribution of credit facilities fluctuated between these two forms of bank during
1996–2007.
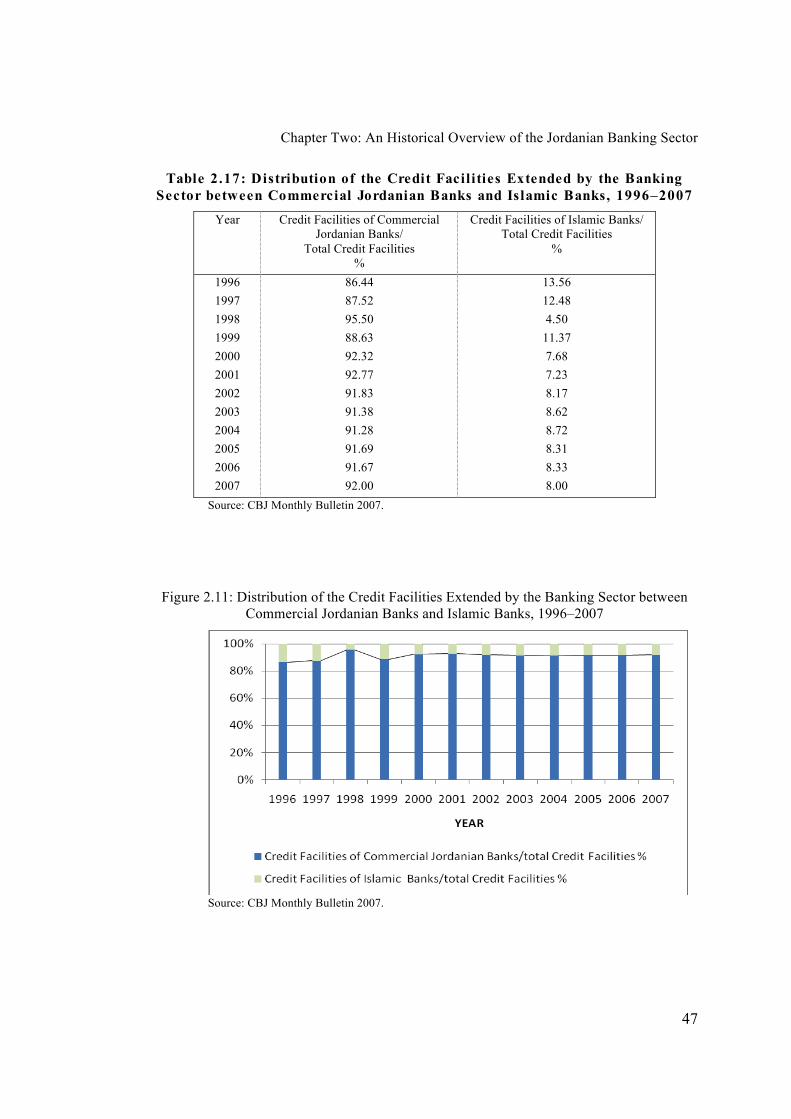
Chapter Two: An Historical Overview of the Jordanian Banking Sector
47
Table 2.17: Distribution of the Credit Facilities Extended by the Banking
Sector between Commercial Jordanian Banks and Islamic Banks, 1996–2007
Year Credit Facilities of Commercial Jordanian Banks/
Total Credit Facilities %
Credit Facilities of Islamic Banks/ Total Credit Facilities
%
1996
1997
1998
1999
2000
2001
2002
2003
2004
2005
2006
2007
86.44
87.52
95.50
88.63
92.32
92.77
91.83
91.38
91.28
91.69
91.67
92.00
13.56
12.48
4.50
11.37
7.68
7.23
8.17
8.62
8.72
8.31
8.33
8.00
Source: CBJ Monthly Bulletin 2007.
Figure 2.11: Distribution of the Credit Facilities Extended by the Banking Sector between Commercial Jordanian Banks and Islamic Banks, 1996–2007
Source: CBJ Monthly Bulletin 2007.
Chapter Two: An Historical Overview of the Jordanian Banking Sector
48
2.10.2 Basic Principle of Islamic Banking
Islamic banking refers to a system of banking activity that is consistent with the
principles of Sharia, which prohibits the payment of interest fees for the lending of
money. Islamic banking has the same purpose as conventional banking except that it
claims to follow Sharia law. The basic principle is the sharing of profit and loss and
the prohibition of riba (interest). Riba is an Arabic word which, literally, denotes an
increase of something to more than its original size or amount. In the Quran, the term
riba signifies an unlawful and forced addition to the payback value of money or
goods lent by one person to another.9
From a theoretical perspective, Islamic banking is different from conventional
banking because interest (riba) is prohibited. These banks are not allowed to offer a
fixed rate of return on deposits, and are not allowed to charge interest on loans. They
depend on a profit-and-loss-sharing paradigm, based on modes of financing such as
mudarabah (profit-sharing) and musharakah (joint venture).
There are some activities in which Islamic banks and the conventional banks are
similar, but there are several differences. While Islamic banks offer banking products
and services similar to those offered by conventional bank (Al-Syed, 2006), they
finance lending activity on the basis of sharing achieved profit; any loss is borne by
the bank (Ahmad, 2001). The most notable features of Islamic banks are:
9 http://islamic-law.suite101.com/article.cfm/what_is_riba#ixzz0tpOL78PZ

Chapter Two: An Historical Overview of the Jordanian Banking Sector
49
1. Islamic banks are Islamic financial institutions.
2. Islamic banks collaborate with other institutions and individuals in the
development of Islamic values and ethics in the field of transactions, to
maximise the economic and social returns of the Islamic nation
(Kafrawi, 1998).
While Sharia bans riba, this does not mean that capital in an Islamic financial system
has no cost. Indeed, capital is considered one of the main factors of production, but
the financial system does not allow such a factor to make a claim on productive
surplus in the form of interest. Instead, the two partners, the owner of capital (rabb-
ul-mal) and the entrepreneur share the obtained profits, since profit sharing is
allowed in Islam while riba is not. This means, according to Islamic law, that
investors are not entitled to demand a fixed rate of return. Nor is any addition to the
original amount allowed to anyone who does not share in the involved risks (Racha,
2008). Islamic banks’ funds are received from clients without any obligation or
undertaking, directly or indirectly, to give any agreed return on their deposits, but it
does undertake to return the deposits upon request. Islamic banks use such deposits
in investment activities or business; they do not lend money at interest, but do
finance activities on the basis of participation in achieved profit (Ahmad, 2001).
According to Ahmad (2001) the economic imperative for Islamic banks is based on
the following:
1. A financial institution that deals by sharing is more able to collect cash
balances for investment.
Chapter Two: An Historical Overview of the Jordanian Banking Sector
50
2. A banking institution that deals by sharing is more able to distribute
available cash resources to make the best use of it for economic and
social development.
3. A banking institution that deals with sharing contributes directly to fairness
in the distribution of national income.
Assaf et al, (1993) summarises the main objectives of the Islamic bank as follows:
1. To serve and encourage individuals who do not want to deal with riba by
collecting their savings and investing the same in a sharing transaction
to benefit society on the basis of Sharia.
2. To provide needed funds for economic sectors who will not deal with
conventional banks to avoid usury.
3. To introduce services that ensure social solidarity based on Islamic law, by
linking economic development with social development on Islamic
principles.
2.10.3 Banking Services Provided by Islamic Banks
Article (52) of Banking Law number 28 for the year 2000 states that Islamic banks
may exercise the following:
1. Accept cash deposits in various accounts, whether in credit accounts, joint
investment accounts or special investment accounts.
2. Issue joint common lending or special lending bonds or create investment
portfolios or investment funds.
3. Undertake all business finance and investment on the basis of non-interest.
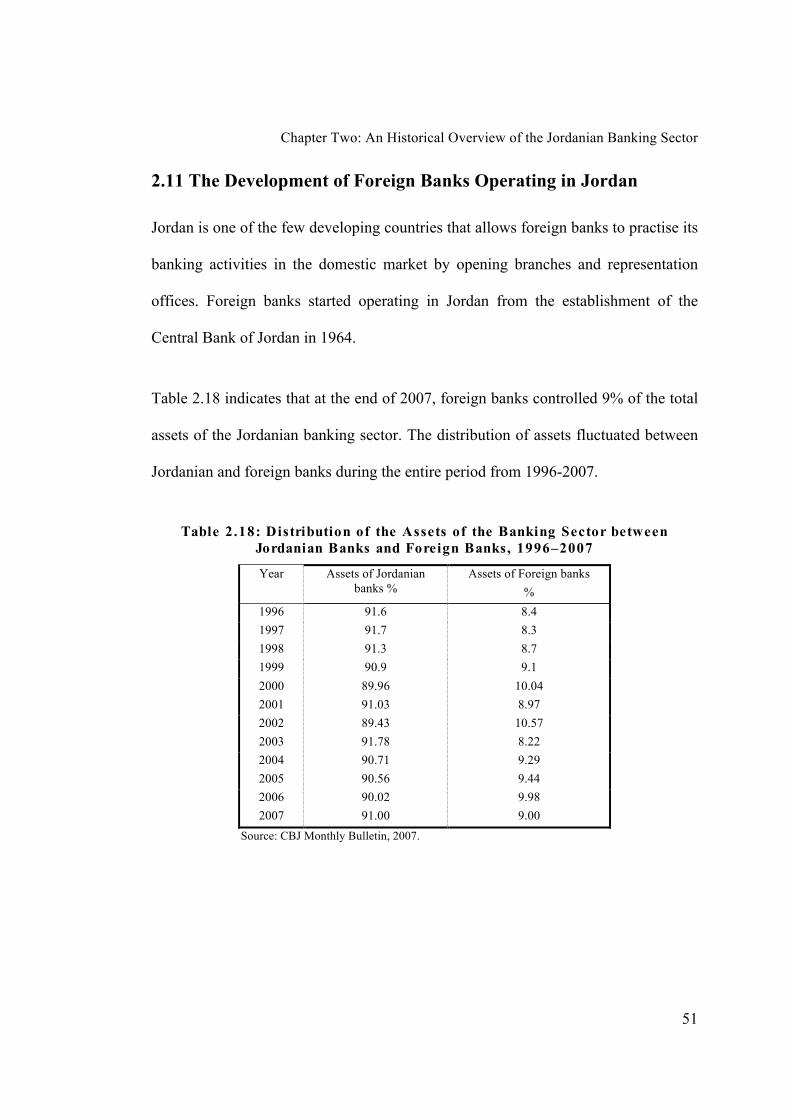
Chapter Two: An Historical Overview of the Jordanian Banking Sector
51
2.11 The Development of Foreign Banks Operating in Jordan
Jordan is one of the few developing countries that allows foreign banks to practise its
banking activities in the domestic market by opening branches and representation
offices. Foreign banks started operating in Jordan from the establishment of the
Central Bank of Jordan in 1964.
Table 2.18 indicates that at the end of 2007, foreign banks controlled 9% of the total
assets of the Jordanian banking sector. The distribution of assets fluctuated between
Jordanian and foreign banks during the entire period from 1996-2007.
Table 2.18: Distribution of the Assets of the Banking Sector between
Jordanian Banks and Foreign Banks, 1996–2007
Year Assets of Jordanian
banks %
Assets of Foreign banks
%
1996 91.6 8.4
1997 91.7 8.3
1998 91.3 8.7
1999 90.9 9.1
2000 89.96 10.04
2001 91.03 8.97
2002 89.43 10.57
2003 91.78 8.22
2004 90.71 9.29
2005 90.56 9.44
2006 90.02 9.98
2007 91.00 9.00
Source: CBJ Monthly Bulletin, 2007.
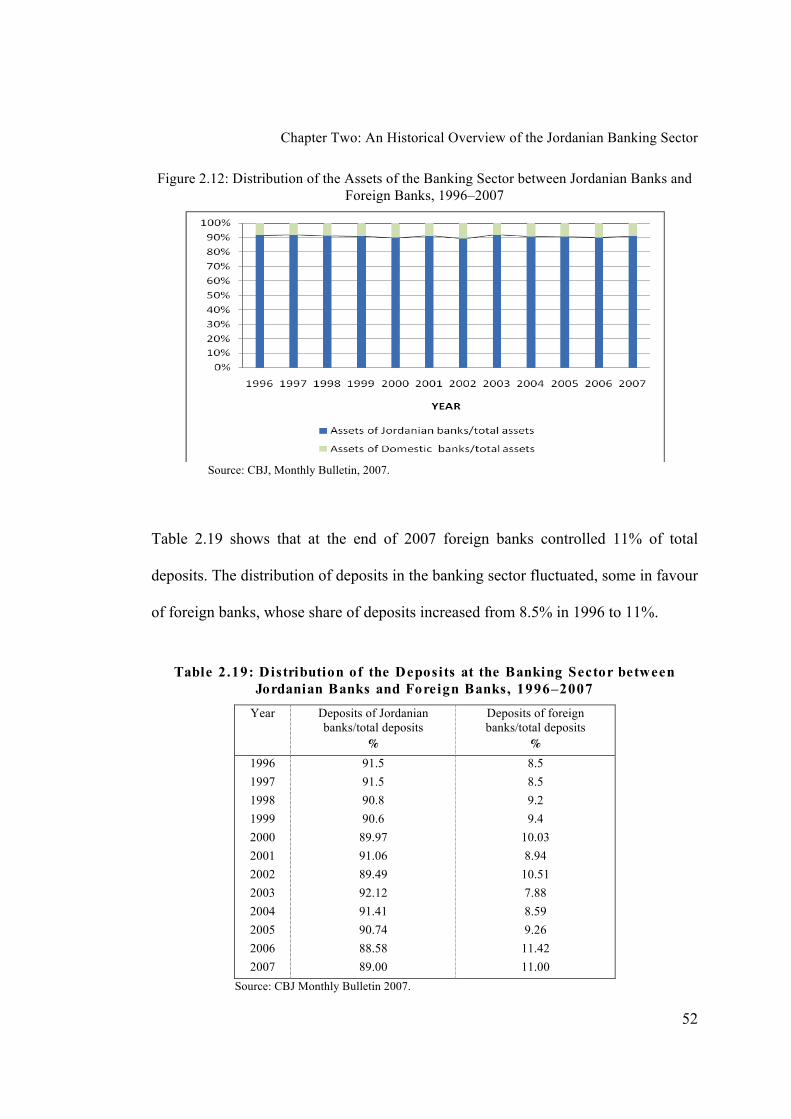
Chapter Two: An Historical Overview of the Jordanian Banking Sector
52
Figure 2.12: Distribution of the Assets of the Banking Sector between Jordanian Banks and
Foreign Banks, 1996–2007
Source: CBJ, Monthly Bulletin, 2007.
Table 2.19 shows that at the end of 2007 foreign banks controlled 11% of total
deposits. The distribution of deposits in the banking sector fluctuated, some in favour
of foreign banks, whose share of deposits increased from 8.5% in 1996 to 11%.
Table 2.19: Distribution of the Deposits at the Banking Sector between
Jordanian Banks and Foreign Banks, 1996–2007
Year Deposits of Jordanian banks/total deposits
%
Deposits of foreign banks/total deposits
%
1996
1997
1998
1999
2000
2001
2002
2003
2004
2005
2006
2007
91.5
91.5
90.8
90.6
89.97
91.06
89.49
92.12
91.41
90.74
88.58
89.00
8.5
8.5
9.2
9.4
10.03
8.94
10.51
7.88
8.59
9.26
11.42
11.00
Source: CBJ Monthly Bulletin 2007.
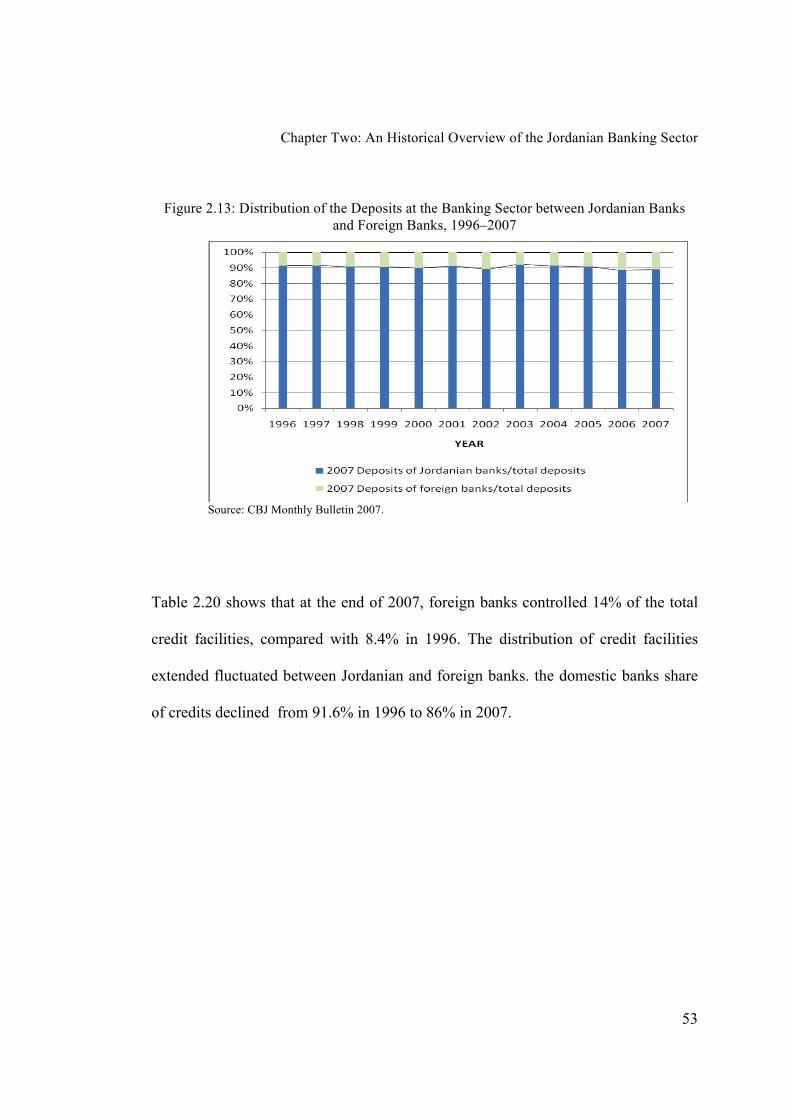
Chapter Two: An Historical Overview of the Jordanian Banking Sector
53
Figure 2.13: Distribution of the Deposits at the Banking Sector between Jordanian Banks
and Foreign Banks, 1996–2007
Source: CBJ Monthly Bulletin 2007.
Table 2.20 shows that at the end of 2007, foreign banks controlled 14% of the total
credit facilities, compared with 8.4% in 1996. The distribution of credit facilities
extended fluctuated between Jordanian and foreign banks. the domestic banks share
of credits declined from 91.6% in 1996 to 86% in 2007.

Chapter Two: An Historical Overview of the Jordanian Banking Sector
54
Table 2.20: Distribution of the Credit Facilities Extended by the Banking
Sector between Jordanian Banks and Foreign Banks, 1996–2007
Year Credit Facilities of Jordanian Banks/total
Credit Facilities
%
Credit Facilities of Foreign Banks/total Credit
Facilities
%
1996
1997
1998
1999
2000
2001
2002
2003
2004
2005
2006
2007
91.6
90.9
91.2
91.2
90.00
92.05
90.80
91.26
91.22
91.31
90.61
86.00
8.4
9.1
8.8
8.8
10.00
7.95
9.20
8.74
8.78
8.69
9.39
14.00
Source: Central Banks in Jordan, various issues.
Figure 2.14: Distribution of the Credit Facilities Extended by the Banking Sector between
Jordanian Banks and Foreign Banks, 1996–2007
Source: Central Banks in Jordan, various issues.
2.11.1 Advantages and Disadvantages of Foreign Bank Entry in Jordan
There is argument regarding the positive and negative effects of foreign bank entry in
developing or less developed countries, since foreign banks may affect, negatively or
Chapter Two: An Historical Overview of the Jordanian Banking Sector
55
positively, and directly or indirectly, the domestic banking market. For example,
foreign banks may have a positive impact on a national economy by
1. Improving the quality of banking and financial services, through increased
banking competition and by applying more advanced technology and
recruiting skilled staff.
2. Increasing competition, forcing local banks to operate more cost-
effectively.
3. Modernising, developing and enhancing the banking legal environment.
4. Attracting foreign capital.
According to Melhim (2006) the negative side of foreign banks is reflected in their
granting loans to large companies and institutions, leaving the less lucrative small
companies and retailers to the domestic banks.
The Jordanian experience so far is that foreign bank entry into the market has
enhanced banking activity in the kingdom. The following are some of the most
important impacts of foreign bank entry in Jordan (Melhim, 2006):
1. Foreign banks are generally more efficient institutions, with better
capabilities and greater experience in operations, and banking
practices.
2. Foreign banking services are involved in personal loans, company finance,
lease financing, banking insurance, portfolio management, financial
management, issuing paper and providing financial consultants.
3. Foreign banks are involved in the transfer of knowledge and skill.
Chapter Two: An Historical Overview of the Jordanian Banking Sector
56
2.11.2 Comparison of Domestic and Foreign Banks’ Performance in Terms of
Financial Ratios
Based on financial ratios (ROA, ROE, NIM/TA, NIN/TA, NIE/TA),10 we can
compare the performance of foreign banks with domestic banks. Table 2.21 reveals
the following:
1. Foreign banks achieved net margin interest as a percent of assets more than
domestic banks.
2. Foreign banks achieved revenues other than interest (non-interest income)
as a percentage of assets (NIN/TA) equal to domestic banks.
3. Domestic banks’ general and administrative expenses (non-interest
expenses) as a percentage of assets (NIE/TA) were less than foreign
banks’.
4. Foreign banks achieved greater return on assets (ROA) than domestic
banks.
5. Domestic banks achieved greater return on equity (ROE) than foreign
banks.
10 NIM: net interest margin, NIE: non-interest expense, NIN: non-interest income, ROA: return on assets, ROE: return on equity, TA: total assets.
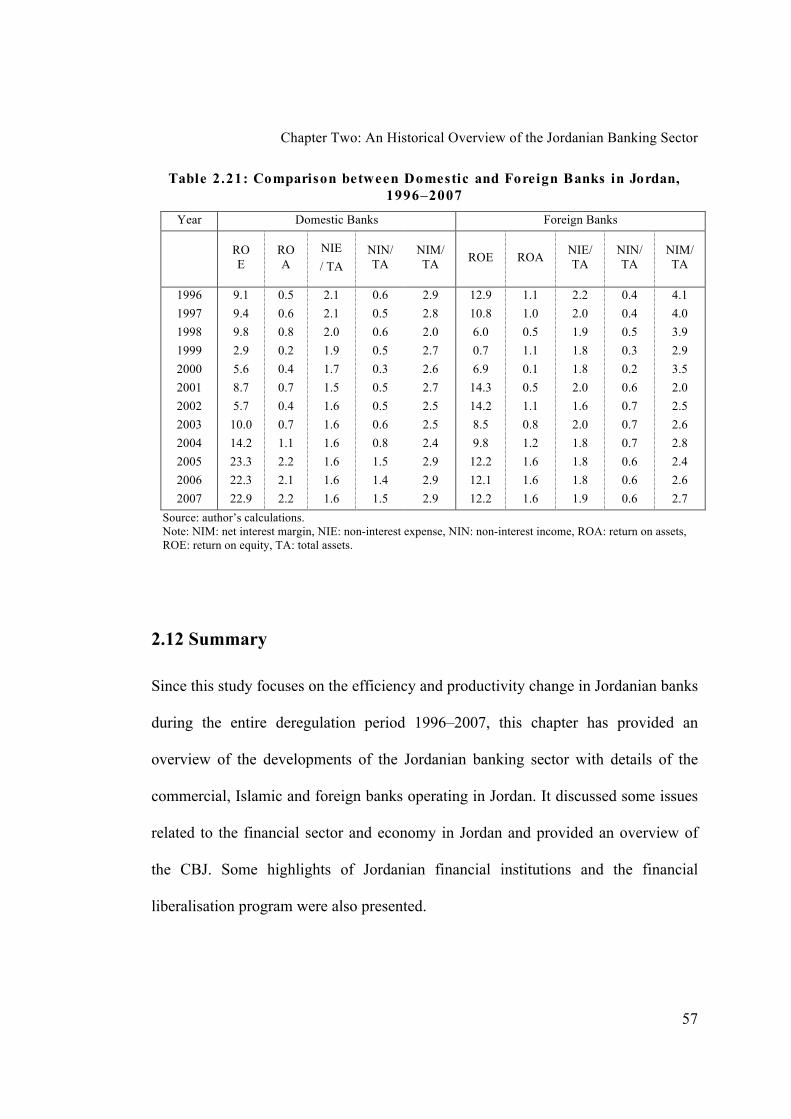
Chapter Two: An Historical Overview of the Jordanian Banking Sector
57
Table 2.21: Comparison between Domestic and Foreign Banks in Jordan,
1996–2007
Year Domestic Banks Foreign Banks
ROE
ROA
NIE
/ TA
NIN/ TA
NIM/ TA
ROE ROA NIE/ TA
NIN/ TA
NIM/ TA
1996
1997
1998
1999
2000
2001
2002
2003
2004
2005
2006
2007
9.1
9.4
9.8
2.9
5.6
8.7
5.7
10.0
14.2
23.3
22.3
22.9
0.5
0.6
0.8
0.2
0.4
0.7
0.4
0.7
1.1
2.2
2.1
2.2
2.1
2.1
2.0
1.9
1.7
1.5
1.6
1.6
1.6
1.6
1.6
1.6
0.6
0.5
0.6
0.5
0.3
0.5
0.5
0.6
0.8
1.5
1.4
1.5
2.9
2.8
2.0
2.7
2.6
2.7
2.5
2.5
2.4
2.9
2.9
2.9
12.9
10.8
6.0
0.7
6.9
14.3
14.2
8.5
9.8
12.2
12.1
12.2
1.1
1.0
0.5
1.1
0.1
0.5
1.1
0.8
1.2
1.6
1.6
1.6
2.2
2.0
1.9
1.8
1.8
2.0
1.6
2.0
1.8
1.8
1.8
1.9
0.4
0.4
0.5
0.3
0.2
0.6
0.7
0.7
0.7
0.6
0.6
0.6
4.1
4.0
3.9
2.9
3.5
2.0
2.5
2.6
2.8
2.4
2.6
2.7
Source: author’s calculations. Note: NIM: net interest margin, NIE: non-interest expense, NIN: non-interest income, ROA: return on assets, ROE: return on equity, TA: total assets.
2.12 Summary
Since this study focuses on the efficiency and productivity change in Jordanian banks
during the entire deregulation period 1996–2007, this chapter has provided an
overview of the developments of the Jordanian banking sector with details of the
commercial, Islamic and foreign banks operating in Jordan. It discussed some issues
related to the financial sector and economy in Jordan and provided an overview of
the CBJ. Some highlights of Jordanian financial institutions and the financial
liberalisation program were also presented.
Chapter Two: An Historical Overview of the Jordanian Banking Sector
58
As this study covers the period of the deregulation era (1996–2007), this chapter has
shown the steps taken by the Jordanian government and the Central Bank of Jordan
to liberalise the financial system with a view to increasing its efficiency and creating
competition in the financial system. The purpose of these steps was to establish a
Western-type free market economy and create competition by removing restrictions
on interest rates, reducing government direct lending and removing restrictions on
foreign exchange transactions. The deregulation program provided greater autonomy
to banks, promoted bank mergers and acquisitions, liberalised foreign exchange
transactions and stimulated foreign investment. Other vital developments in the
banking industry included the computerisation of banking operations and the
introduction of Automatic Teller Machines (ATMs) and on-line communication and
internet banking.
CHAPTER 3
A Review of Literature on Banking Efficiency and
Productivity
3.1 Introduction
While research on the measurement of efficiency of banking sector in Western
economies has expanded rapidly over the past decade, relatively little work has been
done on measuring the efficiency of banks in the Middle East. One of the reasons for
the lack of this research is that most Arab countries did not introduce financial and
banking sector reforms until the 1990s. Until then, financial systems tended to be
heavily regulated and dominated by the public sector (United Nations, 2005).
However, over the past one and a half decades, the majority of Middle East countries
have gradually moved towards more liberalised financial systems. This has created
interest among policy makers, managers and economists in assessing the efficiency
performance of banks over time in Middle Eastern countries.
In Middle Eastern economies, three types of banks operate simultaneously:
conventional, Islamic and foreign banks. They vary in terms of size as measured by
assets. It is a matter of great interest to policy makers and consumers to see which of
banks are most efficient. This chapter reviews the literature concerning banking
efficiency and productivity in two sections: international literature and studies of
Middle Eastern countries including Jordan.
Chapter Three: A Review of Literature on Banking Efficiency and Productivity
60
The efficiency of banks and other financial institutions is assessed on summary
measures which are technical in nature. It is, therefore, crucial to be familiar with
these measures to understand and compare the efficiency estimates of banks of
different sizes and over time. The existing measures of efficiency are classified into
two categories: non-parametric methods and parametric methods. Non-parametric
methods include Data Envelopment Analysis (DEA) and Free Disposal Hull (FDH);
parametric methods include the Stochastic Frontier Approach (SFA), Thick Frontier
Approach (TFA) and Distribution Free Approach (DFA). DEA is the most widely
used non-parametric technique and SFA is the favoured parametric technique for
measuring efficiency.
DEA provides technical efficiency scores (divided into pure technical and scale
efficiency scores) between 0 and 1, where 1 indicates full efficiency and 0 means
fully inefficient; thus, DEA can reveal how efficient a decision making unit (DMU)
is relative to the others. The efficiency score translates into how well a bank converts
its inputs into outputs. For instance, if a bank has a technical efficiency score of 80%,
then this means that it would have to reduce its inputs by 20% to become as efficient
as its reference set – that is, those banks with 100% scores (for details see Chapter 4
of this study).
The parametric approach is usually based on estimating the cost or production
function to obtain cost and production efficiencies using stochastic frontiers (see
Coelli at al., 2005; Kourouche, 2008).

Chapter Three: A Review of Literature on Banking Efficiency and Productivity
61
Almost all the existing studies of banking efficiency and productivity, in Middle
Eastern economies and elsewhere, have been based on DEA and SFA. This chapter
provides an overview of the empirical evidence from the international literature on
bank efficiency and productivity in Section 3.2. The Middle Eastern studies are
reviewed in Section 3.3. Section 3.4 discusses the Jordanian studies. Some
concluding remarks are made in Section 3.5.
3.2 International Studies of Banking Efficiency and Productivity
Most international studies have focused on examining technical efficiency levels
rather than allocative efficiency. This was due to the difficulties faced by the
researchers in obtaining the required input prices for calculating allocative efficiency.
Results of these empirical studies show that technical inefficiency is more prevalent
than allocative inefficiency in the banking sector. Some studies also used the
Malmquist Productivity Index (MPI) to identify productivity change in the banking
sector.
3.2.1 International Studies of Banking Efficiency and Productivity based on the
Non-Parametric Data Envelopment Analysis Approach
Emrouznejad et al. (2008) presented a survey and analysis of the first 30 years of
literature in DEA, covering research developments and outcomes from the
pioneering years of DEA to 2007. The survey is the most comprehensive source of
references on DEA application in measuring the efficiency and productivity of

Chapter Three: A Review of Literature on Banking Efficiency and Productivity
62
DMUs. It covers 4015 publications, serving as an important source for obtaining
references.
Various studies conducted in the US, Europe and Asia have measured efficiency and
productivity change in banking sector. Ferrier and Lovell (1990), Elyasiani and
Mehdian (1995), Mukherjee et al. (2001), Grabowski et al. (1994), Richard et al
(2002), and Seiford and Zhu (1999) have all studied efficiency and productivity of
US banks in recent years. Elyasiani and Mehdian (1995) investigated productivity,
concentrating on trends in technical efficiency and technological change for small
and large US commercial banks for the period of 1979–1986. Mukherjee et al. (2001)
studied productivity growth in 201 large US commercial banks, covering the initial
post-deregulation period of 1984–1990, and found that productivity grew by 4.5%
per year on average, with a significant decline in the initial years. Banks with large
asset size experienced higher productivity growth overall. Ferrier and Lovell (1990)
and Grabowski et al. (1994) used the DEA approach to assess the productive
performance of US banks relative to the best practice frontier, and found that overall
the efficiency of the US banking industry ranges from 65% to 90%. Following this,
Richard et al. (2002) used the DEA model to evaluate the productive efficiency of
US commercial banks from 1984–1998. Strong and consistent relationships between
efficiency and independent measures of performance were found. Seiford and Zhu
(1999) examined the performance of the top 55 US commercial banks using DEA.

Chapter Three: A Review of Literature on Banking Efficiency and Productivity
63
They used a two-stage11 production process to measure profitability and
marketability, with inputs and outputs in each stage consisting of eight factors. Their
results indicated that relatively large banks exhibited better performance on
profitability, whereas smaller banks tended to perform better with respect to
marketability.
A more recent study by Wu et al. (2006) integrated DEA and neural networks (NN),
using input-oriented measures to examine the profit efficiency of 142 branches of a
Canadian bank. By comparing the efficiency scores with DEA normal results, they
found that the combined system identifies more efficient branches. They found that
efficiency predicted using the DEA-NN model had good correlation with that
calculated by DEA alone. This illustrates that the DEA-NN approach is a good proxy
for the classical DEA approach in predicting efficiency.
Several studies have measured the efficiency and productivity of the banking sectors
in European countries. For example, Berg et al. (1993) assessed the efficiency and
productivity growth of the banking sector in Nordic countries, using DEA to measure
the X-inefficiency of banks in Finland, Norway and Sweden. MPI was used to
identify productivity change in banks. Their research concluded that Swedish banks
11 The process is divided into two stages, and the eight factors are expressed as inputs and outputs in each stage. ‘The first stage measures profitability, i.e., a bank’s ability to generate the revenue and profit in terms of its current labor, assets, and capital stock. The second stage measures (stock) market-ability, i.e., a bank’s
performance in the stock market by the revenue and profit it generates. It can be seen that revenue and profit serve as intermediate factors in the sense that they are outputs from the first stage and inputs to the second stage’ (Seiford and Zhu, 1999, p.1271).
Chapter Three: A Review of Literature on Banking Efficiency and Productivity
64
were more efficient than their counterparts. In another study, Bukh et al. (1995) used
DEA to investigate inefficiencies in the banking industries of Denmark, Finland,
Norway and Sweden. The study found that the largest Danish and Swedish banks
tended to be the most efficient, although it was also found that one large Finnish
bank and one large Norwegian bank achieved more than 90% efficiency scores.
In Spain, many studies have used DEA to investigate efficiency and productivity
change in the banking sector. Perez and Quesada (1994) estimated changes in
productivity in the major savings and commercial banks during 1986–1992. The
study clearly revealed that the productivity of the largest banks was substantial and
that 40% of commercial banks operated with high efficiency. Compared to all other
Spanish banks, 20% of the commercial banks were found to be most efficient.
Another study conducted by Grifell-Tatje and Lovell (1996) used similar linear
programming techniques to investigate productivity change by calculating total
factor productivity in savings banks between 1986 and 1991. The study reveals a
productivity decline in savings banks during this period.
Havrylchyk (2006) investigated the efficiency of the Polish banking industry for
1997– 2001. DEA was applied to distinguish between cost, allocative, technical, pure
technical, and scale efficiencies. The results indicated that bank efficiency had not
improved over the period.
Casu and Molyneux (2003) investigated the possibility of an improvement in the
technical efficiency of European banks since the creation of the EU single internal
Chapter Three: A Review of Literature on Banking Efficiency and Productivity
65
market. DEA was used to measure banks in France, Germany, Italy, Spain and the
UK. The study included a sample of 530 banks from these countries, and employed
two input and two output variables. The input variables consisted of total costs and
short term funding, while output variables comprised total loans and other earning
assets. The study concluded that relatively low levels of technical efficiency resulted
from the creation of a single EU internal market for European banking. The majority
of banks in the study had averages at 65% in frequency distribution of mean
technical efficiency. The sampled countries showed improvements in mean technical
efficiency over the study period, except for Italy, which recorded a slight decrease of
0.5%. Overall, this study demonstrated that the most technically efficient were UK
banks with a score of 78.2%, followed by Germany with 71.3%. Italy was found to
be the least technically efficient banking industry in the EU with a score of 53.8%.
The Casu et al. (2004) study used MPI to compare the productivity of banks from
five European countries between 1994 and 2000. Three input and three output
variables were used: labour, total deposits and capital as inputs; output variables
included total loans, securities, and, advances and receivables off-balance sheet
activity (OBS) items. The Spanish banks showed the highest productivity growth of
9.5% on average, followed by Italian (8.9%), French (1.8%), German (0.6%), and
UK banks (0.1%).
Attaullah et al. (2004) examined the technical efficiency of banks in India and
Pakistan during the ten years from 1988 to 1998. The study applied DEA to two
models. Model A used two inputs, interest expense and operating expense; and two

Chapter Three: A Review of Literature on Banking Efficiency and Productivity
66
outputs, total loans and investments. Model B used the same inputs as model A, but
outputs were different, comprising interest and non-interest income. The results
showed a difference in the mean technical efficiency of banks in the two countries.
For India, the mean technical efficiency scores of banks provided by Models A and B
were 72.8% and 63% respectively. In contrast, the mean technical efficiency of
banks in Pakistan under Models A and B were 42.4% and 54.1% respectively.
Das and Gho (2006) investigated the performance of the Indian commercial banking
sector during the post reform period from 1992 to 2002 using DEA methodology.
Three different approaches were used for the purpose of comparing the results of the
efficiency scores with changes in inputs and outputs. These approaches were the
intermediation, value-added, and operating approach. A close relationship was found
between efficiency and soundness as determined by a bank’s capital adequacy ratio.
Moreover, the results indicated that technically efficient banks are those that have, on
average, fewer non-performing loans.
The productive efficiency of 70 Indian commercial banks was examined by
Bhattacharya et al. (1997) for 1986–1991. DEA was used to calculate technical
efficiency scores. The result showed that publicly owned Indian banks were the most
efficient, followed by foreign banks and privately owned Indian banks.
Jackson et al. (1998) measured the efficiency and productivity growth in Turkish
commercial banks using the DEA-based MPI. The results, based on data for 1992–
1996, showed that foreign and private banks were more efficient than banks owned
Chapter Three: A Review of Literature on Banking Efficiency and Productivity
67
by the state. Jackson and Fethi (2000) also used DEA to evaluate the technical
efficiency of individual Turkish banks. This study also investigated the determinants
of efficiency, using the Tobit model, for the year 1998. Larger and more profitable
banks were found to be more likely to operate at higher levels of technical efficiency.
The DEA and DEA-MPI were used by Cingi and Tarim (2000) to examine efficiency
and productivity changes in Turkish commercial banks between 1989 and 1996. It
was found that, while the four state-owned banks were not efficient, the three private
holding banks maintained high efficiency scores over the study period. Yildirim
(2002) analysed the efficiency performance of the Turkish banking sector between
1988 and 1999. The technical and scale efficiencies of Turkish commercial banks
were computed based on a DEA approach. Pure technical and scale efficiency
measures were found to have large variations. Turkish commercial banks did not
achieve sustained efficiency gains, and the Turkish commercial banking sector
suffered from scale inefficiency caused by decreasing returns to scale. Moreover,
some differences in the efficiency of commercial banks were related to the banks’
ownership. Pure technical efficiency and scale inefficiency were positively related to
bank size.
Zaim (1995) analysed the efficiency of Turkish commercial banks in order to
investigate the effects of post-1980 financial liberalisation policies. It was found that
financial reforms had a positive effect on both technical and allocative efficiencies,
and that state-owned banks appeared more efficient than private ones. Yolalan
(1996) used financial ratios to analyse the performance of Turkish commercial banks

Chapter Three: A Review of Literature on Banking Efficiency and Productivity
68
over 1988–1995. The results indicated that foreign banks were the most efficient
group, followed by private banks in the Turkish commercial bank sector.
Isik and Hassan (2002) investigated efficiency in the Turkish banking industry to
understand the impact of size, international variables, ownership, control and
governance on profit, cost, and allocative, technical, pure technical and scale
efficiency measures. The study employed both non-parametric and parametric
approaches, and covered the period 1988–1996. It showed that heterogeneous
characteristics of banks had a significant impact on their efficiency. The dominant
source of inefficiency in Turkish banking was found to be technical inefficiency
rather than allocative inefficiency.
Grigorian and Manole (2006) examined the technical efficiency of banks in 17
transition economies from 1995–1998, using a nonparametric DEA approach. They
used two models which each employed three inputs and three outputs. The inputs of
both models consisted of labour, fixed assets, and, interest expenses. Model A
outputs consisted of revenues, net loans and liquid assets, while Model B used total
deposits, net loans and liquid assets. The study results indicated that Model A’s
technical efficiency scores ranged between 23.7% for Belarus, and 79.9% for
Czechoslovakia, while Model B’s technical efficiency scores ranged between 15.5%,
for Belarus and 84.3% for Slovenia. The results of Model A also indicated that five
countries, Slovakia, Latvia, Romania, Moldova and the Ukraine, suffered a decline in
technical efficiency. Likewise, Model B revealed that Slovakia, Kazakhstan and
Chapter Three: A Review of Literature on Banking Efficiency and Productivity
69
Moldova suffered declines in technical efficiency levels. In spite of such results,
most of the countries showed improvements in technical efficiency over time.
In the Asian region, many authors have carried out studies: Fukuyama (1995) from
Japan; Yeh (1996) from Taiwan; Leightner and Lovell (1998) from Thailand; Gilbert
and Wilson (1998) from Korea; Lim and Chu-Chun-Lin (1998) from Singapore; and
Rezvanian and Mehdian (2002) also from Singapore. The results of these studies
revealed that depository institutions had an average efficiency of around 77%.
Chen (2001) investigated the technical efficiency of Taiwan’s banking sector during
the deregulation period, 1988–1997, using the DEA approach. His results revealed
that the implementation of banking reforms had positively affected the technical
efficiency levels of banks in Taiwan. It also showed that the older banks were the
least efficient, and the newly established ones were more efficient than others. The
private banks were shown to have improved their performance later on.
Gilbert and Wilson (1998) employed DEA to measure the effects of deregulation on
the productivity change of South Korean banks for the period 1980–1994. Their
findings indicate that deregulation had led to an improvement in the productivity
levels of large banks, which recorded strong productivity growth, whereas the
regional banks recorded productivity regress or no change.
Chen et al (2004) examined the cost, technical and allocative efficiency of 43
Chinese banks, covering the deregulation era from 1993 to 2000, using an input-
Chapter Three: A Review of Literature on Banking Efficiency and Productivity
70
oriented DEA approach. They employed an intermediation approach for choosing
three input prices (price of labour, price of deposits and price of capital) with three
outputs (loans, deposits and non-interest income). The study found an improvement
in the efficiency of Chinese banks after the initiation of a program of deregulation in
1995. The large state-owned banks and smaller banks were more efficient than
medium sized banks.
In Malaysia, Matthews and Mahadzir (2006) examined the technical efficiency and
productivity of domestic and foreign commercial banks in Malaysia during the
period 1994–2000. Foreign banks were found to have higher efficiency levels than
domestic banks. Technical efficiency contributed most to the observed productivity
growth.
Krishnasamy et al. (2004) used DEA MPI to evaluate bank efficiency and
productivity changes in Malaysia over the period from 2000 till 2001. Results from
this analysis indicated a total MPI increase in all banks.
Rezvaniana et al. (2008) examined the effects of ownership on efficiency change,
technological progress and productivity growth of the Indian banking industry over
the period 1998–2003. A non-parametric frontier approach was used. The study
revealed that foreign banks were significantly more efficient than domestic banks.
Batchelor and Gerrard (2004) used MPI to identify the extent to which technical
efficiency and technological advances explained any productivity changes in the

Chapter Three: A Review of Literature on Banking Efficiency and Productivity
71
three commercial banks of Singapore over the period 1997–2001. The results showed
that the banks improved their performance by 11.7% in terms of total factor
productivity, while the technical efficiency of the banks remained relatively
unchanged.
Randhawa and Lim (2005) used DEA to examine the X-efficiency of local banks in
Hong Kong and Singapore during the period 1995–1999. The study revealed an
overall efficiency score of 80.4% under the intermediation approach, and 97.2%
under the production approach. Burki and Niazi (2003) showed that state-owned
banks in Pakistan were the most inefficient banks compared to private banks and
foreign banks, which were the least inefficient over the period 1991–2000.
Sathye (2002) analysed the change in productivity of seventeen Australian banks for
the period 1995–1999. The results showed that the technical efficiency of banks
declined by 3.10% and the total factor productivity (TFP) index declined by 3.5%
during the sample period. Neal (2004) investigated X-efficiency and productivity
changes in the Australian banking sector over the same period, revealing that
regional banks were less efficient than others. It also showed that TFP in the banking
sector had increased by 7.60% per annum over the sample period.
Sturm and Williams (2002) examined the efficiency and productivity performance of
Australian banks based on technical efficiency and MPI for the period,1988–2001.
The study utilised two models: Model A employed three inputs: labour, total deposits
and capital; and two outputs: loans and, advances and receivables off-balance sheet

Chapter Three: A Review of Literature on Banking Efficiency and Productivity
72
activity (OBS). Model B employed two inputs: interest expenses and non-interest
expenses; and two outputs: net interest income and non-interest income. The results
indicated that technical efficiency improved over time under both models. The
annual mean technical efficiency scores under Model A ranged from 73% in 1991 to
94% in1986. Under Model B, the scores ranged from 67% in 1993 to 96% in 1997.
The results from the MPI analysis were mixed. Under Model A, it was found that
there was an overall mean TFP growth of 10%, with technological progress
dominating technical efficiency change, while under Model B, it was found that
overall mean TFP declined by 3%.
Another study in Australia, conducted by Avkiran (1999), examined the effects of
Australian bank mergers on efficiency levels. The sample consisted of 23 banks over
the period 1986–1995 and showed that banks’ efficiency increased until 1991 and
then declined, due to problems associated with bad debts. More recently, Kourouche
(2008) investigated the efficiency and productivity of ten Australian banks during the
period 1995–2005. Technical efficiency levels of the banks were examined using
DEA; and TFP change was estimated using MPI. The results revealed that the
efficiency and productivity change varied across the banks and over the years. The
results suggested that the banks needed to control their costs and invest in new
technology and capital equipment to improve efficiency and productivity levels.
Chapter Three: A Review of Literature on Banking Efficiency and Productivity
73
3.2.2 International Studies of Banking Efficiency and Productivity based on
Parametric Stochastic Frontier Analysis Approach
Many researchers have investigated scale efficiency in the banking sector using
parametric methods. For instance, Benston (1964, 1965), Bell and Murphy (1969),
Powers (1969), Kalish and Gilbert (1973), and Longbrake and Haslem (1975) have
measured the scale efficiency of US banks using the Cobb-Douglas production
function. Other studies by Benston et al. (1982), Benston et al. (1983), Gilligan and
Smirlock (1984), Gilligan et al. (1984), Lawrence and Shay (1985), Hunter and
Timme (1986), Kolari and Zardhooki (1987), Berger et al. (1987) and Rangan et al.
(1989) used the translog cost function developed by Christensen et al. (1973). These
studies found that bank cost curves are either U-shaped or flat. Many of these studies
observed that medium-sized banks are more scale-efficient than very large or very
small banks (Berger et al., 1993b, p.223). The results from the studies which used
data on banks with under US$1 billion in assets revealed that the average costs were
usually minimised between US$75 million and US$300 million in assets., Banks
with more than US$1 billion in assets showed the minimum average cost point to be
between US$2 billion and US$10 billion in assets (Kourouche, 2008).
In Australia, Edgar et al. (1971) examined scale efficiency among eight banks using
the parametric method. The results, based on the Cobb-Douglas production function,
revealed that seven out of eight banks experienced economies of scale. Swan and
Harper (1982) investigated scale economies at the branch level in two Australian
Chapter Three: A Review of Literature on Banking Efficiency and Productivity
74
banks, revealing significant economies of scale in one bank and constant returns to
scale in the other.
Karim (2001) examined and compared the level of technical efficiency among banks
of four countries from the Association of South-East Asian Nations (ASEAN) for the
period 1989–1996. The sample consisted of 82, 31, 27 and 15 banks from Indonesia,
Malaysia, the Philippines and Thailand respectively. The study specified three input
and five output variables. Input variables were employee wages and salaries;
expenses on land, buildings and equipment; and interest expenses. Output variables
included commercial and industrial loans; other loans; time deposits; demand
deposits; and securities and investments. The results revealed significant differences
in mean technical efficiency scores across countries. The mean technical efficiency
level of banks was highest (98.1%) in Thailand and lowest (65.8%) in Philippine.
In Europe, Kraf and Turtrong (1998) examined X-efficiency and scale-efficiencies of
old and new state and private banks based on Stochastic-cost Frontier Analysis
(SFA) for 1994 and 1995. They found that new state and private banks were more X-
inefficient, and more scale-inefficient, than old privatised and state banks. Noulas
(2001) examined the efficiency of Greek banks for the period 1993–1998 and
concluded that private banks were more efficient than state controlled banks.
Bonin et al. (2005) conducted a study of eleven transition economies using SFA. The
sample consisted of 225 banks for the period 1996–2000 and one input and four
outputs were employed in the model. Capital was the input; outputs were total
Chapter Three: A Review of Literature on Banking Efficiency and Productivity
75
deposits, total loans, liquid assets and investments. The study recorded an overall
mean technical efficiency score of 70.1%. Foreign banks were found to be more
technically efficient than domestic banks.
Weill (2003) examined the differences in the efficiency levels of domestic and
foreign banks in transition countries, using SFA. He took samples from two
countries: 31 Polish banks and 16 Czech banks for the year 1997. The model used
three inputs: personnel expenses, interest expenses and non-interest expenses; and
two outputs: total loans and investment assets. The results showed that foreign banks
in transition countries were more technically efficient than domestic banks. The
technical efficiency of foreign banks operating in Poland and Czechoslovakia
recorded an average of 70.4%, while the technical efficiency of the domestic banks
recorded an average of 62.0%.
Kasman (2002) examined the productive efficiency of Turkish commercial banks in
the deregulated period. The study used SFA to estimate X-inefficiency, scale
economies and technological change for a panel of Turkish commercial banks. This
methodology used the Fourier-flexible cost function specification form. The results
showed that the Turkish banking system had a significant inefficiency problem.
Goldberg and Rai (1996) also applied SFA to measure the technical and scale
efficiencies of a sample of banks from eleven European countries. They concentrated
on large banks because at that time the European banking industry was being
dominated by large banks. The study specified capital, labour and borrowed funds as
Chapter Three: A Review of Literature on Banking Efficiency and Productivity
76
inputs, and total loans and all other earning assets as outputs; the results showed
relatively high levels of technical efficiency. The overall mean technical efficiency
score for banks in the specified countries was 94.2%. Banks operating with the
highest technical efficiency included Belgium at 96.7%; Denmark at 96.4%; Spain at
96.2% and Germany at 96.1%. The lowest efficiency scores were reported for
Switzerland (91.9%), Sweden (91.8%), and Italy (91.8%).
More recently, Dong (2009) studied the cost efficiency of Chinese banks over the
liberalisation period, 1994–2007. He employed both parametric (SFA) and non-
parametric (DEA) methods. The study used a one-stage SFA model that included the
input prices, the outputs and the control variables (that is, equity, non-performing
loans and the time trend) in the cost frontier and the environmental variables (that is,
ownership structure, size, deregulation, and market structure and market discipline)
in the inefficiency term. Additionally, for the cost efficiency, a two-stage DEA
model was employed. The findings from this study indicated that Chinese banking
efficiency had declined since China’s admission to the WTO, implying that the
external environmental changes which arose from China’s WTO entry may have had
a negative influence on banking efficiency. The results also showed that both state-
owned banks and foreign banks were more efficient than domestic private banks, and
that larger banks tend to be relatively more efficient than smaller banks.
Chapter Three: A Review of Literature on Banking Efficiency and Productivity
77
3.3 Middle East Studies of Banking Efficiency and Productivity
Almost all the existing studies of banking efficiency in Middle Eastern economies
have been based on DEA and SFA. The Middle Eastern studies of banking efficiency
based on non-parametric DEA approach are reviewed in Section 3.3.1, and those
based on SFA are reviewed in Section 3.3.2.
3.3.1 Middle Eastern Studies of Banking Efficiency and Productivity based on
DEA
Al-Faraj et al. (1993) evaluated the relative efficiency of 15 branches in Saudi Arabia
Bank, one of the largest commercial banks, using a number of inputs and outputs in a
DEA model. The inputs include the number of employees working in the branch, the
percentage of employees with college degrees, the average years of experience of
employees at a branch, an index for location, one for the rank of the highest
authority, one for expenditure on decoration, one for the average monthly salaries,
one for other operational expenses and one for acquired equipment. The outputs
included the monthly average net profit, the monthly average balance of current
accounts, the monthly average balance of savings accounts, the monthly average
balance of other accounts and the monthly average of mortgages. The results
revealed that 12 out of 15 branches were efficient.
Using an input-oriented DEA approach, Darrat et al. (2003) examined the
performance of eight banks in Kuwait during the period 1994–1997. The data used
for three inputs: labour, capital and deposits, and two outputs: loans and investment,
Chapter Three: A Review of Literature on Banking Efficiency and Productivity
78
were drawn from the balance sheets and income statements of the banks. Labour was
measured by the number of all employees in the banks, capital by the book value of
fixed assets and premises, and deposits by the sum of demand and savings deposits.
The results showed that Kuwaiti banks failed to utilise a significant proportion of
their resources optimally. The bank inefficiency appeared to be both allocative and
technical in nature. The results also indicated that smaller banks in Kuwait were
more efficient than larger ones, although all banks had improved their efficiency
levels and experienced some gains in productivity.
Hassan et al. (2004) investigated the efficiency of the banking sector in Bahrain,
based on data for a panel of 31 banks in 1998 and 2000. Their study estimated
allocative and technical efficiencies, scale efficiency and overall cost efficiency. The
model used three inputs: labour, capital, and loanable funds; and two outputs: short-
term loans and long-term loans. The input prices were price of labour, price of
capital, and interest rates on loanable funds. The results indicated that the average
allocative efficiency was about 73%, whereas the average technical efficiency was
about 56%. This indicated that the dominant source of inefficiency in Bahrain banks
was due to technical inefficiency rather than allocative inefficiency, and this was
mainly attributed to diseconomies in scale. Overall, average scale efficiency was
about 79%, and average pure technical efficiency about 71%, suggesting that the
major source of the total technical inefficiency for Bahrain banks was pure technical
inefficiency (input related), and not scale inefficiency. Hassan et al. (2004) also
investigated the conventional accounting measures of performance with four
Chapter Three: A Review of Literature on Banking Efficiency and Productivity
79
measures of cost efficiency, to investigate whether higher financial performance had
an effect on bank cost efficiency. Their results showed that ROE and ROA, which
measured overall profitability of the banking sector in Bahrain, gave the profitability,
with average ROE and ROA being 10.36% and 1.622% in 1998, and 13.49% and
2.097% in 2000 respectively. They also measured productivity growth using MPI.
Their results revealed that all banks had improved their efficiency levels and
experienced some gains in productivity. Finally, regression analysis was used to
investigate determinants of the overall efficiency scores. They found that larger and
more profitable banks were more likely to operate at a higher level of efficiency; and
that market power played an important role in cost and technical efficiencies.
The relative efficiency of the top 50 Gulf Cooperation Council (GCC) banks was
investigated by Mostafa (2007a) using cross-sectional data for the year 2005. The
study used a variable returns to scale DEA approach with three outputs (net profit,
returns on assets, and returns on equity) and two inputs (assets and equity). The
results indicated that efficiency scores ranged from 13% to 100% for all banks, with
an average of 55% when using a Constant Returns to Scale (CRS) model with a
standard deviation of 22.1, and from 20% to 100% when using a Varying Returns to
Scale (VRS) model; the results indicted an average of 73% and standard deviation of
21.8%. Al-Muharrami (2007) investigated productivity changes in 52 GCC banks
covering 1993–2002. The inputs were number of staff, total deposit, and fixed assets;
the outputs were total loan, other operating income, other earning assets, and OBS
activities. The results, based on Malmquist DEA, showed a decline of TFP change

Chapter Three: A Review of Literature on Banking Efficiency and Productivity
80
for GCC banks over the period due to declines in efficiency and technological
regress.
Mostafa (2007b) examined the relative efficiency of the top Arab banks using cross-
sectional data for the year 2005. Two methodologies were adopted in this study: the
first DEA, the second a probabilistic neural network (PNN) and a traditional
statistical classification method for modelling and classifying relative efficiency. The
CRS model returned scores ranging from 0 to 100%, with an average of 31% and a
standard deviation of 21.6, while the VRS model returned an average efficiency
score of 43% with a standard deviation of 27.2; results that revealed great scope for
achieving cost savings in Arab banks.
Using the data from the annual reports of individual banks published by Emirates
Banks Association for 1997–2001, Al-Tamimi (2008) focused on identifying the
relatively best performing banks and relatively worst performing banks in the United
Arab Emirates (UAE). The study used DEA and some traditional financial ratios
such as returns on assets, returns on equity, ratio of loans to deposits and ratio of loan
to total assets, to investigate efficiency. The DEA model used interest expense and
non-interest expense as input variables; interest revenue and non-interest revenue as
output variables. The study revealed that most UAE commercial banks were
inefficient. The national banks were relatively more efficient than the foreign banks.
Two traditional ratios, loans to deposits and loans to total assets, indicated that the
UAE commercial banks did not use available resources efficiently.

Chapter Three: A Review of Literature on Banking Efficiency and Productivity
81
Al-Faraj et al. (2006) evaluated the technical efficiency of Saudi banks for 2002 and
compared them with world mean efficiency scores. Their results indicated that the
mean efficiency score of Saudi commercial banks compared very well with the world
mean efficiency scores. The results suggested that Saudi banks should develop new
technologies and provide new banking services to compete with other banks. In a
more recent study, AlKhathlan and Malik (2010) investigated both technical and
scale efficiencies of Saudi commercial banks for the period 2003–2008. Their sample
covered ten of the twelve commercial banks and employed the DEA intermediation
approach. The results indicated that the majority of Saudi banks operated at high
levels of efficiency and managed their financial resources adequately.
3.3.2 The Middle East Studies of Banking Efficiency and Productivity Based on
the Parametric Stochastic Frontier Approach
Chaffai (1997) examined the productive efficiency of banks operating in Tunisia.
The study employed an econometric model to estimate input-specific technical
efficiency, and revealed that the technical efficiency of both labour and capital
declined over time, but labour was more inefficiently used than capital. Limam
(2001) used a SFA to determine the technical efficiency of eight banks in Kuwait for
the period 1994–1999. The study used earning assets as output and fixed assets,
labour and financial capital as inputs; results showed that banks produced earning
assets at constant returns to scale. The study also found that there was much room for
improving the technical efficiency of most banks. Larger size, a higher share of
Chapter Three: A Review of Literature on Banking Efficiency and Productivity
82
equity capital in assets and greater profitability were associated with better
efficiency.
Murjan and Ruze (2002) aimed to investigate the competitive nature of the Arab
Middle Eastern (AME) banking sector during the 1990s. The study used data from
the banking sectors of nine AME countries, and applied the Rosse-Panzar test to
appraise quantitatively the dominant competitive conditions in these markets from
1993–1997. The sample consisted of 141 banks: 16 from Bahrain, 35 from Egypt, 13
from Jordan, 10 from Kuwait, 10 from Oman, 6 from Qatar, 12 from Saudi Arabia,
17 from Tunisia, and 22 from the UAE. This study concluded that banking markets
had been operating in the region under conditions of monopolistic competition.
Following Shaffer (1981–1982) and Nathan and Neave (1989), the study also
estimated a reduced form equation to model the behaviour of the banks’ revenues.
An important finding revealed by this study was that in the AME region, where two
distinct economic spectrums dominated the market, the banking sector in the oil-
producing countries (Gulf Countries) appeared to be less competitive than its
counterpart in non-oil producing countries.
Ariss (2008) investigated the evolution of bank efficiency in Lebanon subsequent to
a period of deregulation/ financial liberalisation. The study attempted to answer three
questions related to cost efficiency: (i) Are banks becoming more cost efficient with
the passage of time? (ii) Are large banks more cost efficient than small banks? (iii)
Are there cost efficiency differences between domestic and foreign banks? The
results, based on a SFA model, showed that the average cost inefficiency of

Chapter Three: A Review of Literature on Banking Efficiency and Productivity
83
Lebanese banks appeared to be small (around 12%). The results also indicated that
cost efficiency had improved over the study period: that is, the consolidation in the
financial sector had enhanced banking efficiency. The domestic banks were found to
be as efficient as foreign banks.
3.4 Jordanian Studies of Banking Efficiency and Productivity
3.4.1 Jordanian Studies of Banking Efficiency and Productivity Based on a Non-
Parametric DEA Approach
One of the earliest studies of efficiency in the Jordanian banking sector was Al-
Shammari and Salimi’s (1998). In this study, DEA was used and an input oriented
model was applied to 16 out of 18 commercial banks operating in Jordan in the
period 1991–1994. The dataset for the study was obtained from the Amman
Financial Market (1995). The empirical results revealed that the majority of banks
investigated were fairly inefficient over the study period. The lowest efficiency
scores were 52.61%, 54.12%, 52.43%, and 49.84%, in 1991, 1992, 1993 and 1994
respectively; only three banks appeared to be fully efficient through the period.
Maghyereh (2004) investigated TFP in eight domestic Jordanian banks over 18 years
from 1984 to 2001. The DEA model used three inputs (labour, capital, and deposits)
and three outputs (earning assets, loans and liquid assets and investments). The
results indicated that the mean of technical efficiency for all banks over the sample
period was 91.8%. The main source of technical inefficiency in the Jordanian banks
was scale inefficiency, with an average rate of 93.1%. Importantly, the result
Chapter Three: A Review of Literature on Banking Efficiency and Productivity
84
indicated that the larger banks in the sample had lower scale efficiency and higher
pure technical efficiency than small and medium banks.
Ihsan et al. (2004) analysed managerial and scale efficiencies in the Jordanian
banking sector (commercial, investment and Islamic) operating in Jordan over 1996–
2001. They used two DEA Models. The first applied the production approach and
specified banks as multi-product firms producing credits, investment securities and
deposits services by employing labour and capital; the second model took an
intermediation approach which defined banks as financial intermediaries where
labour, capital and deposits served as inputs, and credits and investments securities
served as outputs. The results indicated that Jordanian banks would obtain significant
cost savings (as much as 40%) should they catch up with the best practice banks. The
findings from the first model (production approach) estimated managerial efficiency
at 71%, pure technical efficiency at 89% and scale efficiency at 79%; from the
second model (intermediation approach) the managerial efficiency, pure technical
efficiency and scale efficiency turned out to be 89%, 96% and 92% respectively.
Most of the managerial inefficiency was found to be due to scale inefficiency rather
than pure technical inefficiency. The study also found that most banks in Jordan
experienced increasing returns to scale in their operations under both models,
suggesting that the Jordanian banks could have expanded their operations by either
internal or external growth. The Arab Bank was found to be most efficient bank.
More recently, Bdour and Al–Khouri (2008) evaluated the efficiency of 17 domestic
commercial Jordanian banks during the liberalisation period, 1998–2004. The study
Chapter Three: A Review of Literature on Banking Efficiency and Productivity
85
used DEA with an intermediation approach, with three inputs (net-operating
expenses, total assets and number of employees) and three outputs (net operating
income, demand deposits, and net direct credits). They found that the liberalisation
program had improved the efficiency of the Jordanian banks for all years except
2003 and 2004, when a decline in efficiency occurred, possibly due to the adverse
effects of the Gulf War.
3.4.2 Jordanian Studies of Banking Efficiency and Productivity Based on a
Parametric SFA Approach
A study by Ahmad (2000) examined the efficiency of the banking sector in Jordan
for seven years (1990–1996). The study applied both DEA and SFA to a data set
consisting of 20 banks, domestic and foreign. For the DEA approach the outputs used
were total loan, other investments (defined as investment in bonds and securities plus
deposits at foreign banks); the inputs were the number of full-time workers and total
deposits. In addition, the study used prices of labour and capital. In the SFA
approach, cost efficiency was estimated based on the Cobb-Doglas cost function
which employed two banking outputs (loans and other investments) and prices of
labour and capital, in addition to the number of branches. Total Cost was defined as
interest expenses plus wages and benefits for workers. An attempt was also made to
estimate profit function. The study revealed that the large banks were more profit
efficient than other banks. The efficiency scores obtained using DEA were higher
than those obtained from the SFA.
Chapter Three: A Review of Literature on Banking Efficiency and Productivity
86
3.5 Concluding Remarks
This chapter has provided a review of major studies of banking efficiency conducted
in the Middle East countries and the rest of the world, although no claim is made to
have covered all extant studies. The majority of studies of the Middle East used
DEA; only a few used SFA methodology to compute efficiency estimates. The
studies revealed that banks achieved some levels of efficiency in the Middle East.
There were a few Jordanian studies of banking efficiency and productivity, but none
covered the entire deregulation era, the years covered by the present study
investigating the levels of efficiency and productivity growth in 17 banks operating
in Jordan covering the deregulation period 1996-2007. A DEA approach is used to
examine efficiency and productivity change in the next chapters.
CHAPTER 4
The Technical Efficiency of the Jordanian Banking
Sector
4.1 Introduction
This chapter analyses the technical efficiency of banks in Jordan using a non-
parametric Data Envelopment Analysis (DEA) approach. For a comprehensive
analysis, technical efficiency is split into pure technical efficiency and scale
efficiency. The empirical results are obtained by running an input-oriented DEA
model using the software package DEAP Version 2.1 (Coelli, T. 1996). The study
uses data for 13 domestic commercial banks, 1 domestic Islamic bank and 3 foreign
banks operating in Jordan during the period 1996–2007.
The chapter is organised as follows: Section 4.2 discusses alternative approaches for
estimating efficiencies, with a particular emphasis on DEA approach. Section 4.3
provides a discussion on the choice of input and output variables required for
estimating the DEA model. The data sources are described in Section 4.4. Section 4.5
discusses the results of technical efficiency, divided into the product of pure
technical efficiency and scale efficiency. Conclusions are presented in Section 4.6.
4.2 Approaches to Measuring Efficiencies
Efficiency in generally refers to how a firm allocates scarce resources to meet
production targets. The efficiency of a production unit is defined by the relationship
Chapter Four: The Technical Efficiency of the Jordanian Banking Sector
88
between the observed and optimal values of its inputs and outputs (Coelli et al.,
2005). There are two broad approaches to measuring efficiency:
1. The Non-parametric Approach
2. The Parametric Approach
4.2.1 The Non-Parametric Approach
There are two non-parametric approaches for measuring efficiency: DEA and FDH.
DEA is the most frequently used non-parametric technique. It was developed by
Charnes et al. (1978) and is a linear programming technique for constructing a
piecewise frontier. The constructed frontiers are non-parametric in the sense that they
are constructed through the envelopment of the decision making units (DMUs) with
the ‘best practice’ DMUs forming the non-parametric frontier. It does not impose any
functional specification on the production function. The frontier is formed in such a
way that no observation point lies beyond it; therefore, the frontier creates an
envelopment of all data points. DEA is often used to generate relative technical
efficiency scores by comparing a particular DMU to a virtual technically efficient
DMU (or its target). The comparison is made with the underlying condition that
compared DMUs have the same input-output configuration. The efficiency scores
generated follow the technical efficiency ratio as defined by Farrell (1957).
The Free Disposal Hull (FDH) model was introduced by Deprins et al. (1984) and
developed by Tulkens (1993). It is a special case of the DEA model in which the
points on lines connecting DEA vertices are not included in the frontier. Instead, the
Chapter Four: The Technical Efficiency of the Jordanian Banking Sector
89
FDH production possibilities set is composed only of the DEA vertices and the free
disposal hull points interior to these vertices. Since the FDH frontier is either
congruent with or interior to the DEA frontier, FDH will typically generate larger
estimates of average efficiency than DEA (Tulkens, 1993).
4.2.2. The Parametric Approach
The parametric approach is popular due to its flexibility in allowing for random
error, and the opportunity it offers for mathematical manipulation. A suitable
functional form must be selected to resemble the actual production process as closely
as possible (Coelli et al, 2005). This form could be simple or very complex, with
many varying degrees of complexity between these two extremes.
There are three parametric methods to estimate efficiency/ inefficiency of firms:
1. The Stochastic Frontier Approach (SFA)
2. The Distribution Free Approach (DFA)
3. The Thick Frontier Approach (TFA)
The Stochastic Frontier Approach (SFA)12 involves the use of econometric
modelling methods. This method identifies the functional form for cost, profit or
production function in relation to inputs and outputs, and allows for random errors.
Technical efficiency, scale efficiency, allocative efficiency and MPI can be measured
12 Aigner, Lovell and Schmidt (1977) and Meeuse and vanden Broeck (1977) simultaneously propose the
stochastic frontier model (see Kumbhakar and Lovell, 2000, p.8). For more details, see Kumbhakar and Lovell (2000) for an extensive survey of parametric methods and Coelli et al. (2005), p.241.
Chapter Four: The Technical Efficiency of the Jordanian Banking Sector
90
with SFA. SFA also allows the testing of hypotheses in regard to the inefficiency and
structure of production technology. However, the difficulties involved in selecting
the distribution form for the efficiency term is a disadvantage, as is the difficulty in
adapting SFA to multiple outputs in the case of production function approach. Some
studies such as Benston (1964, 1965), Powers (1969), Kalish and Gilbert (1973) and
Longbrake and Haslem (1975) have used the Cobb-Douglas form to measure the
scale efficiency of US banks using SFA, and many studies have used more flexible
functional forms to represent production technology (for example, Dong, 2009;
Ncube, 2009;, Kiyota, 2009,; Delis et al., 2009;, Isik & Hassan, 2002; Battes &
Coelli, 199; Benston et al., 1982, 1983; Gilligan & Smirlock, 1984; Gilligan et al.,
1984; Lawrence & Shay, 1985; Hunter & Timme, 1986; Kolari and Zardhooki, 1987;
Berger et al., 1987 Berger & Master 1997; and Rangan et al.. 1989).
The Distribution Free Approach (DFA) is similar to SFA as it specifies a functional
form for production technology, but it assumes that efficiency is stable and that
random error averages out to near zero over time. Thus, DFA seeks to describe
average deviations in terms of inefficiency of each DMU relative to the benchmark’s
inefficiency at any point in time. DFA has been employed by Bauer et al (1993) and
Berger and Humphrey (1997).
The Thick Frontier Approach (TFA) does not impose any pre-conceived functional
form on technology. Instead, random errors and inefficiencies are accounted for by
(a) deviations from predicted performance within the highest quartiles and (b)
deviations from predicted performance between the lowest and the highest quartiles.
Chapter Four: The Technical Efficiency of the Jordanian Banking Sector
91
TFA does not provide estimates of efficiency for individual DMUs, but is intended
instead to provide an estimate of the general level of overall efficiency. Studies that
have applied TFA include Bauer et al. (1993), Lozano (1995) and Mahajan et al.
(1996).
SFA is the most popular and widely used parametric approach.
4.2.3 Choice between Non-parametric and Parametric Measures
In essence, one can assume that parametric models impose a particular functional
form (and associated behavioural assumptions) that presuppose the shape of the
frontier. If the functional form is mis-specified, measured efficiency may be
confounded with specification errors. This weakness has been shown to provide poor
approximations for banking data that are not near the mean scale and product mix
(see McAllister & McManus, 1993; Mitchell & Onvural, 1996).
In contrast, non-parametric methods do not impose any structure on the frontier; but
they do not allow for random error owing to luck, data problems, or other
measurement errors. If random error exists, measured efficiency may be confounded
with these random deviations from the true efficiency frontier. The conflict between
parametric and non-parametric models is important because they tend to have
different degrees of dispersion and to rank the same DMUs differently. It is not
possible to determine which of the two major methods dominates the other since the
true level of efficiency is unknown. DEA is a close substitute for SFA; DEA reports
the same measures that SFA does. In light of this, DEA has gained popular
Chapter Four: The Technical Efficiency of the Jordanian Banking Sector
92
acceptance and frequent application among studies on bank efficiency and
productivity: hence the decision to use DEA to measure efficiency in this study.
4.2.4 Data Envelopment Analysis (DEA) Approach to Measuring Technical
Efficiency
There are two measures of DEA:
1. Input-oriented DEA Measures
2. Output-oriented DEA Measures
Input-oriented technical efficiency measures deal with questions relating to the
reduction of input quantities, without changing the output quantities produced. If the
question is reversed to discover how much output quantities can be proportionally
expanded without altering the input quantities used, this will deal with output-
oriented measures (Coelli et al., 2005). These are discussed below.
4.2.4.1 The Input-Oriented DEA Measure of Technical Efficiency
Input oriented measures are attributed to Farrell (1957), who demonstrated his ideas
using a simple example of firms who use two inputs (x1 and x2) to produce one
output (q) with the assumption of constant return to scale. In figure 4.1, the unit
isoquant of a fully efficient firm is represented by the curve SS ′ . This curve can be
used to measure technical efficiency; so if a given firm uses quantities of inputs,
defined by the point P, for producing a unit of outputs, then the technical inefficiency
of that firm can be represented by the distance QP. The distance QP refers to the
amount to which all inputs could be proportionally reduced without a reduction in
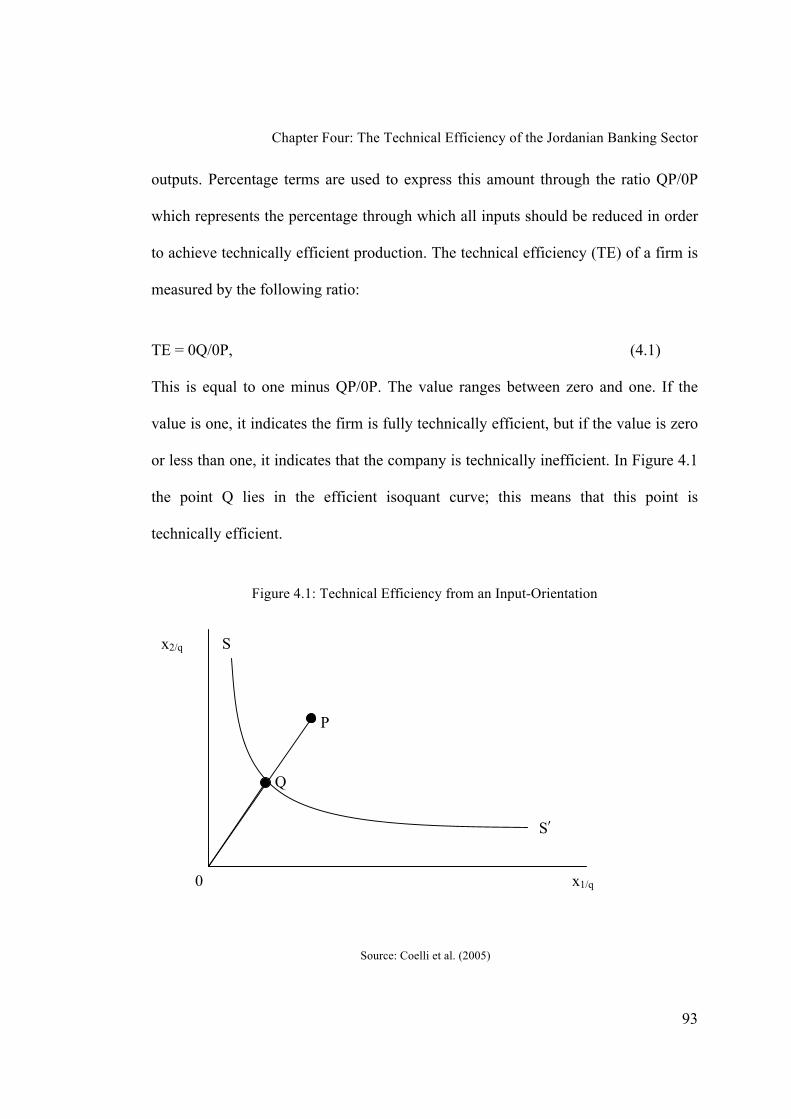
Chapter Four: The Technical Efficiency of the Jordanian Banking Sector
93
outputs. Percentage terms are used to express this amount through the ratio QP/0P
which represents the percentage through which all inputs should be reduced in order
to achieve technically efficient production. The technical efficiency (TE) of a firm is
measured by the following ratio:
TE = 0Q/0P, (4.1)
This is equal to one minus QP/0P. The value ranges between zero and one. If the
value is one, it indicates the firm is fully technically efficient, but if the value is zero
or less than one, it indicates that the company is technically inefficient. In Figure 4.1
the point Q lies in the efficient isoquant curve; this means that this point is
technically efficient.
Figure 4.1: Technical Efficiency from an Input-Orientation
Source: Coelli et al. (2005)
x2/q
x1/q 0
S
P
Q
S′
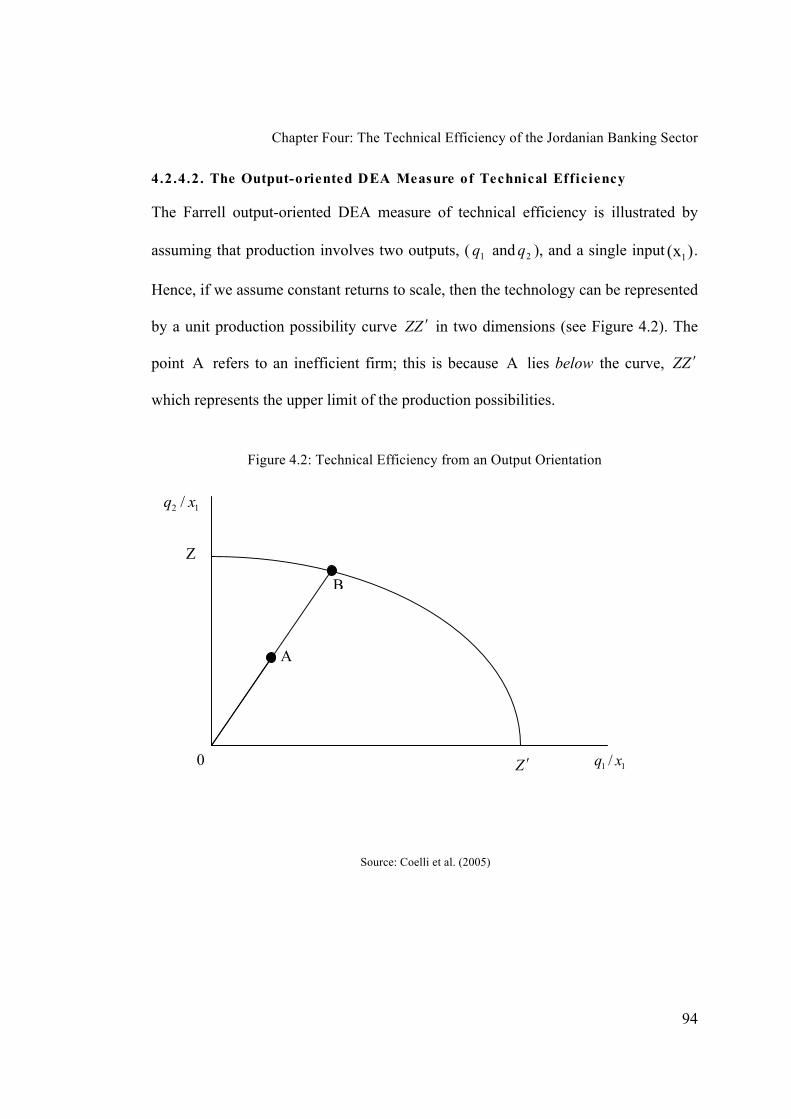
Chapter Four: The Technical Efficiency of the Jordanian Banking Sector
94
4.2.4.2. The Output-oriented DEA Measure of Technical Efficiency
The Farrell output-oriented DEA measure of technical efficiency is illustrated by
assuming that production involves two outputs, (1q and
2q ), and a single input )(x1 .
Hence, if we assume constant returns to scale, then the technology can be represented
by a unit production possibility curve ZZ ′ in two dimensions (see Figure 4.2). The
point A refers to an inefficient firm; this is because A lies below the curve, ZZ ′
which represents the upper limit of the production possibilities.
Figure 4.2: Technical Efficiency from an Output Orientation
Source: Coelli et al. (2005)
12/ xq
11/ xq 0
Z
B
A
Z ′

Chapter Four: The Technical Efficiency of the Jordanian Banking Sector
95
The distance AB refers to the technical inefficiency that is the amount by which
outputs could be increased without requiring extra input. The measure of output-
oriented technical efficiency is expressed by the ratio
OB/OATE = (4.2)
4.2.4.3 Difference between the Two Orientations Measures of Technical
Efficiency – an Illustration
The difference between input- and output-oriented measures can be illustrated by a
simple one-input (x) and one-output (y) example, as provided by Coelli et al. (2005).
In Figure 4.3(a) a decreasing returns to scale (DRS) technology is represented by
f(x), and an inefficient DMU operating at the point P. The Farrell (1957) input-
oriented measure of technical efficiency would be equal to the ratio /AB AP , while
the output-oriented measure of technical efficiency would be equal to the
ratio /CP CD . Note that /AB AP is not equal to /CP CD . The constant returns to
scale case is illustrated in Figure 4.3(b) where we observe that / /AB AP CP CD= ,
for the inefficient firm operating at point P. The input- and output-oriented measures
provide equivalent measures of technical efficiency only when constant returns to
scale exist – they will be unequal if increasing or decreasing returns to scale are
present.

Chapter Four: The Technical Efficiency of the Jordanian Banking Sector
96
Figure 4.3: Technical Efficiency Measures and Returns to Scale
Source: Coelli et al. (1998). Note: DRS denote Decreasing Returns to Scale and CRS
Constant Returns to Scale.
4.2.4.4 Choice of DEA Orientation
The input-orientated DEA model maximises the proportional reduction in inputs as
much as possible, without changing the level of outputs. Conversely, the output-
oriented model maximises the proportional expansion in outputs for the same level of
inputs. These orientations have similar envelopment surface, or efficiency frontier;
however, the measures of inefficient firms may differ between the two under non-
constant returns to scale. The selection of a suitable orientation depends on which
quantities (inputs or outputs) the managers have most control over (Dong, 2009).
Thus, if the firm manager is required to meet market demands, and he can freely
adjust input usage, then it is appropriate to choose an input-oriented model. An
output-oriented model will be more appropriate if the firm has a fixed quantity of
y
x0
D
PAB
f(x)
C
(a) DRS
y
x0
D
PAB
f(x)
C
(b) CRS
Chapter Four: The Technical Efficiency of the Jordanian Banking Sector
97
inputs and is asked to produce as much output as possible. However, some
researchers have pointed out that the choice of orientation has only a minor effect on
the scores obtained, and therefore may not be a vital issue (see Coelli & Perelman,
1999). Here, the input-oriented model for measuring technical efficiency is chosen,
as banks are believed to have better control over inputs.
4.2.4.5 Data Envelopment Analysis Program (DEAP Version 2.1)
Coelli’s (1996) Data Envelopment Analysis Program (DEAP Version 2.1) for
calculating efficiencies in production implement methods based upon the work of
Fare, Grosskopf and Lovell (1994a) and their associates. DEA involves the use of
linear programming methods to construct a non-parametric piecewise surface or
frontier over the data. In DEAP, three options are available:
1. The standard CRS and VRS DEA models;13
2. The extension of these models to account for cost and allocative
efficiencies; and
3. The application of Malmquist DEA methods to calculate Total Factor
Productivity (TFP) change.14
Option 1 is used in this Chapter, Option 2 in Chapter 5 and Option 3 in Chapter 6.
The relevant mathematics underlying these methods is available in Coelli et al
(2005).
13 These methods are outlined in Fare, Grosskopf and Lovell (1994a).
14 For more details, see Fare, Grosskopf, Norris and Zhang (1994b).
Chapter Four: The Technical Efficiency of the Jordanian Banking Sector
98
4.3 Choice of Variables for DEA Model
Empirical results based on DEA may depend on, or are likely to be influenced by, the
choice and number of inputs entering the model. There is no agreement on the choice
of bank inputs and outputs; in fact, the choice of input and output variables for the
banking sector remains controversial. The literature provides three distinct
approaches used for selecting inputs and outputs: the production approach, the
intermediation approach, and the value-added approach. The first views financial
institutions as producers who use inputs of labour and capital to generate outputs of
deposits and loans. This approach is used by, among others, Sathey (2001) and Neal
(2004). The intermediation approach views financial institutions as intermediaries
that convert and transfer financial assets from surplus units to deficit units. Ahmad
(2000) views banks as intermediaries and uses two inputs, labour and deposits; and
two outputs, total loans and other investments, for measuring efficiency in Jordanian
banks during 1990–1996. In another conceptualisation of the intermediation
approach, Paul and Kourouche (2008) and Kourouche (2008) use interest expenses
and non-interest expenses as inputs and interest income and non-interest income as
outputs. In the value-added approach, high-value-creating activities such as making
loans and taking deposits are classified as outputs, whereas labour, physical capital
and purchased funds are classified as inputs (Wheelock & Wilson, 1995).
The intermediation approach is quite popular in empirical research, particularly that
based on cross-sectional data (Colwell & Davis, 1992; Favero & Papi, 1995). The
Chapter Four: The Technical Efficiency of the Jordanian Banking Sector
99
production approach, also used in empirical studies, is known to have a limitation as
it excludes interest expenses, which are considered a vital part of banking.
There are other practical issues or reasoning governing the selection of inputs and
outputs. If one’s aim is to estimate a unit’s production efficiency, then the production
approach might be appropriate. However, if the interest of the researcher is in
examining intermediation efficiency, then the intermediary approach is more
appropriate. The choice of variables may also depend on the availability of required
data.
In the DEA approach, the number of inputs and outputs is always determined by the
number of DMUs (banks, in the present context) in the sample. The ability of DEA
to distinguish between efficient inefficient DMUs depends on the number of inputs
and outputs incorporated in the model. As a rule of thumb, the product of the number
of inputs and outputs should not exceed the number of DMUs in the sample (Cooper
et al., 2000). Dyson et al. (2001) suggest that the product of the total number of
inputs and outputs should not exceed fifty percent of the unit’s number under
investigation, for the purpose of obtaining a reasonable level of differentiation. On
the other hand, Cinca et al. (2004) suggest that DMUs’ efficiency may be estimated
using alternative specification methods, and should rely on the average estimated
efficiency. In examining banking efficiency based on DEA, the rule of thumb,
mentioned above, is the most popular strategy for selecting the number of inputs and
outputs.
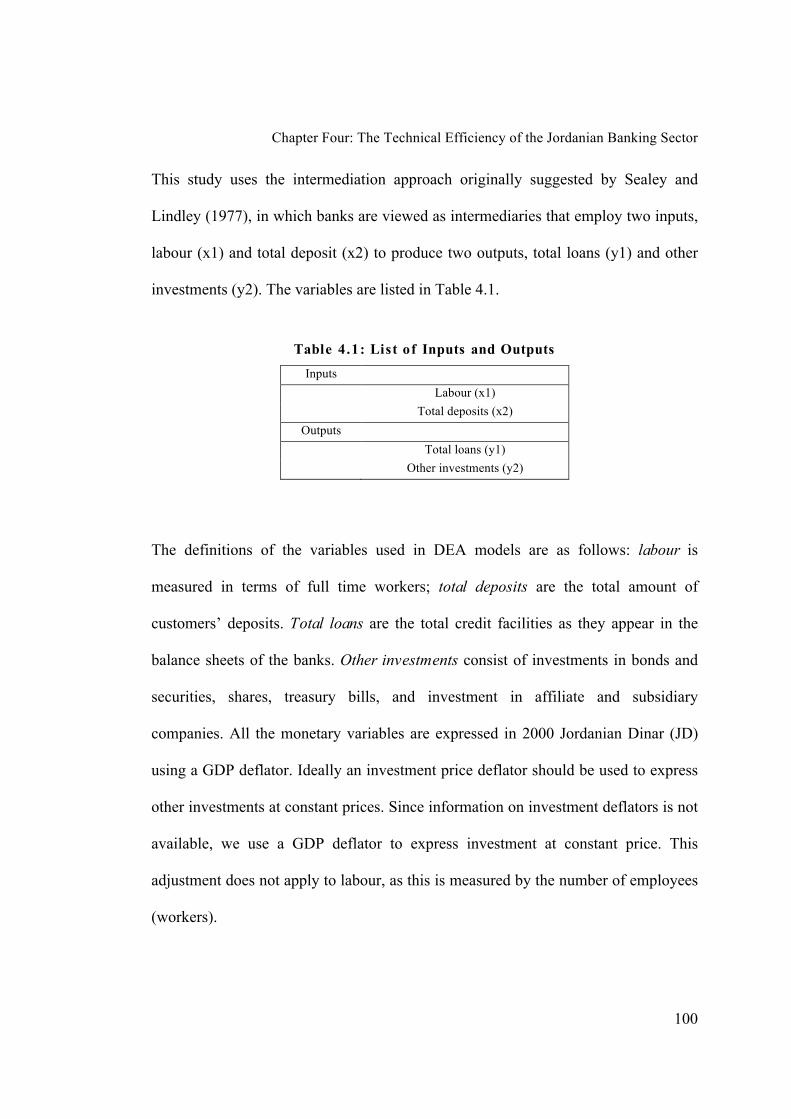
Chapter Four: The Technical Efficiency of the Jordanian Banking Sector
100
This study uses the intermediation approach originally suggested by Sealey and
Lindley (1977), in which banks are viewed as intermediaries that employ two inputs,
labour (x1) and total deposit (x2) to produce two outputs, total loans (y1) and other
investments (y2). The variables are listed in Table 4.1.
Table 4.1: List of Inputs and Outputs
Inputs
Labour (x1)
Total deposits (x2)
Outputs
Total loans (y1)
Other investments (y2)
The definitions of the variables used in DEA models are as follows: labour is
measured in terms of full time workers; total deposits are the total amount of
customers’ deposits. Total loans are the total credit facilities as they appear in the
balance sheets of the banks. Other investments consist of investments in bonds and
securities, shares, treasury bills, and investment in affiliate and subsidiary
companies. All the monetary variables are expressed in 2000 Jordanian Dinar (JD)
using a GDP deflator. Ideally an investment price deflator should be used to express
other investments at constant prices. Since information on investment deflators is not
available, we use a GDP deflator to express investment at constant price. This
adjustment does not apply to labour, as this is measured by the number of employees
(workers).
Chapter Four: The Technical Efficiency of the Jordanian Banking Sector
101
4.4. Data Sources
The non-availability of data at the micro level is one of the main reasons for the lack
of adequate numbers of empirical analyses on banking efficiency in emerging
economies in general and Jordan in particular. The Bankscope databases provide
limited information on Jordanian banks. They do not cover all the banks operating in
the country, particularly in the earlier years of data compilation. In addition, the data
reported in Bankscope are aggregate, and so lack details; this inhibits a
comprehensive analysis of the institutions under study. As well, samples compiled by
Bankscope suffer from an implicit selectivity bias in favour of large banks, which
may not be a good representation of the banking industry and thus may yield biased
and inaccurate results (Ehrmann et al., 2001).
Bhattacharya (2003) and Ehrmann et al. (2001) recommend the use of databases
maintained by central banks, because such databases have more complete data and
therefore produce more consistent, robust and stable results. To ensure reliability,
comparability and consistency, the data used in this study cover the period 1996–
2007 and are taken from auditing annual reports of individual banks and from the
CBJ. In addition, different libraries in Jordan and the databases of the Amman Stock
Exchange (ASE) and the Association of Banks in Jordan were consulted to gather
further information and supply missing data.
The data were collected from 17 Jordanian banks, consisting of thirteen domestic
banks, one domestic Islamic bank (two large, eight medium, four small) and three
Chapter Four: The Technical Efficiency of the Jordanian Banking Sector
102
foreign banks (see Table 4.2). A total of 204 Annual Reports were consulted. The
data collection process from the Annual reports was time-consuming. There are
existing studies of banking efficiency in Jordan covering the period 1990–1996 and
analysing 19 banks; however, closure and merger over the years and the non-
availability of data restricted the present study to 17 banks. The deregulated period
1996–2007 was selected because it had not been compassed in earlier studies.
The 14 domestic Jordanian banks selected for this study are those listed on the
Amman Stock Exchange (ASE; these banks contribute about 90 percent of banking
output in Jordan (Association of Banks in Jordan, Annual Report, 2007). ASE does
not list foreign banks, of which currently there are eight; the data for three for the
whole period was collected from libraries and the Association of Banks in Jordan. Of
the remaining five foreign banks, two refused to provide the required data, and the
other three came into existence only in 2004.
For a comprehensive analysis, the domestic banks are classified into three categories,
based on their assets size in 2007, measured in Jordanian Dinar (JD) millions; see
Table 4.2. The three categories are:
1. Large domestic banks: (Assets size ≥ JD 4000 million)
2. Medium domestic banks: (700 ≤ Assets size < JD 4000 million)
3. Small domestic banks: (Assets size < JD 700 million).
The banks’ assets have changed over the years but none have changed their
categories, facilitating their comparison over the sample period.
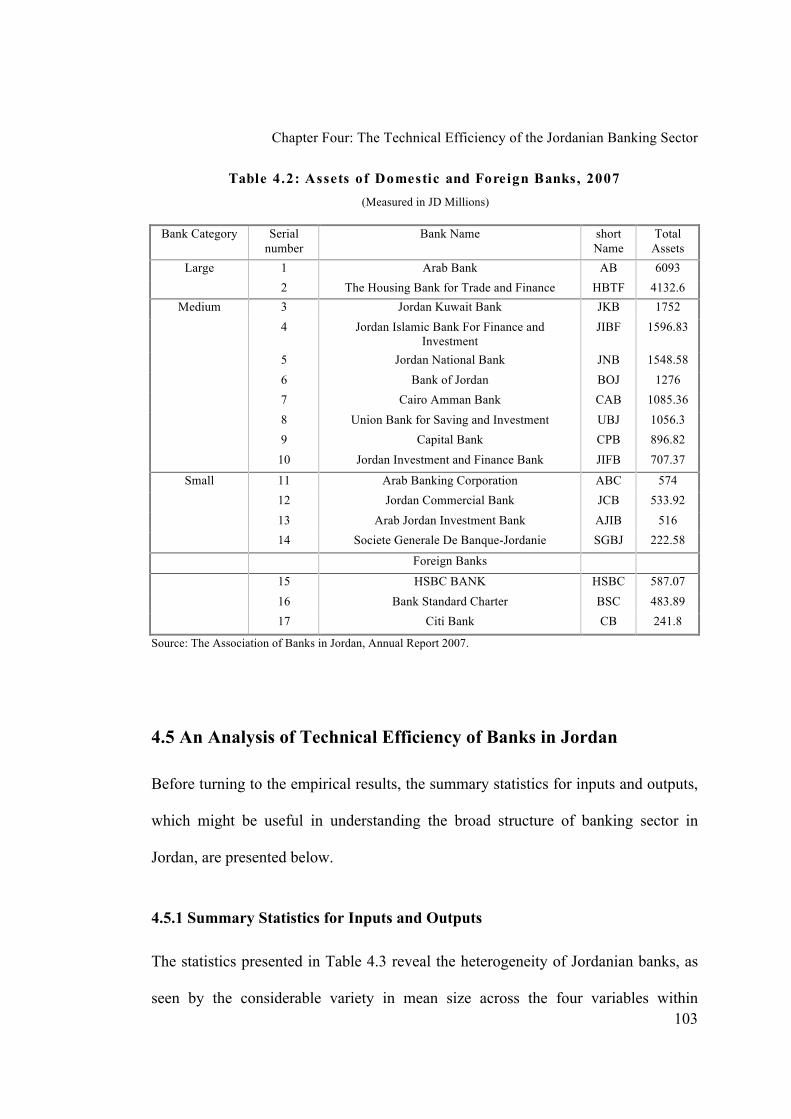
Chapter Four: The Technical Efficiency of the Jordanian Banking Sector
103
Table 4.2: Assets of Domestic and Foreign Banks, 2007
(Measured in JD Millions)
Bank Category Serial
number
Bank Name short
Name
Total
Assets
Large 1 Arab Bank AB 6093
2 The Housing Bank for Trade and Finance HBTF 4132.6
Medium 3 Jordan Kuwait Bank JKB 1752
4 Jordan Islamic Bank For Finance and Investment
JIBF 1596.83
5 Jordan National Bank JNB 1548.58
6 Bank of Jordan BOJ 1276
7 Cairo Amman Bank CAB 1085.36
8 Union Bank for Saving and Investment UBJ 1056.3
9 Capital Bank CPB 896.82
10 Jordan Investment and Finance Bank JIFB 707.37
Small 11 Arab Banking Corporation ABC 574
12 Jordan Commercial Bank JCB 533.92
13 Arab Jordan Investment Bank AJIB 516
14 Societe Generale De Banque-Jordanie SGBJ 222.58
Foreign Banks
15 HSBC BANK HSBC 587.07
16 Bank Standard Charter BSC 483.89
17 Citi Bank CB 241.8
Source: The Association of Banks in Jordan, Annual Report 2007.
4.5 An Analysis of Technical Efficiency of Banks in Jordan
Before turning to the empirical results, the summary statistics for inputs and outputs,
which might be useful in understanding the broad structure of banking sector in
Jordan, are presented below.
4.5.1 Summary Statistics for Inputs and Outputs
The statistics presented in Table 4.3 reveal the heterogeneity of Jordanian banks, as
seen by the considerable variety in mean size across the four variables within

Chapter Four: The Technical Efficiency of the Jordanian Banking Sector
104
Jordanian banking groups. For instance, the number of employees in large banks is
almost three times the number in medium sized banks, six times the number in small
banks and twelve times the number in foreign banks. The number of employees,
recognised as input, within the domestic banks as a whole is five times that of the
number within foreign banks.
Another interesting observation is that deposits in the large Jordanian banks are
almost 11 times those held by medium banks, and 32 times those of small banks.
This difference could be a product of variation in operational efficiency within the
respective banking sectors, or a results of services in Jordan’s large banks, which are
more efficient and attractive for customers than other banks’. The fact that larger
banks are taking the lead in regard to deposits implies that a major source of funding
in Jordanian banks is collection. This is a typical characteristic of a traditional
banking system. When considering the output variables, a similar trend is evident, as
the large banks have a total loan amount eleven times that of the medium banks, and
30 times that of the small banks. Other investments of large banks are nearly 17
times those of the medium banks, and 47 times those of the small banks. In addition,
it appears that the total loans of large Jordanian banks are half of their total deposits.
In light of this, it can be inferred that Jordanian banks are facing a risky business
environment and may be reluctant to engage heavily in loan markets, as business
credits are more costly to originate, maintain and monitor, and thus more likely to
default than investment securities. As a result, the Jordanian banking environment –
loan activities/ markets – is markedly skewed towards liquid loans.
Chapter Four: The Technical Efficiency of the Jordanian Banking Sector
105
The total loan provided by domestic banks to their customers in Jordan is seven
times larger than the total loan provided by foreign banks. Other investments of
domestic banks are 26 times larger than those of foreign banks; and domestic banks
have six times the total deposit of the foreign banks operating in Jordan.
The contribution of individual banks, or of a category of banks, to total banking
outputs has not remained stable or unchanged over the sample period. The share of
large banks in total banking output has declined from 72% in 1996 to 66% in 2007,
while the shares of medium and small banks in total banking output have shown
significant increase over the years from 1996-2007. The output share of foreign
banks shows a marginal decline over the sample period (see Table 4.4). The Islamic
bank (JIBF) has the largest shares in the group of medium banks, indicating that the
Islamic banks in Jordan make a significant contribution to the banking industry;
however, their share has declined slightly over the sample period.
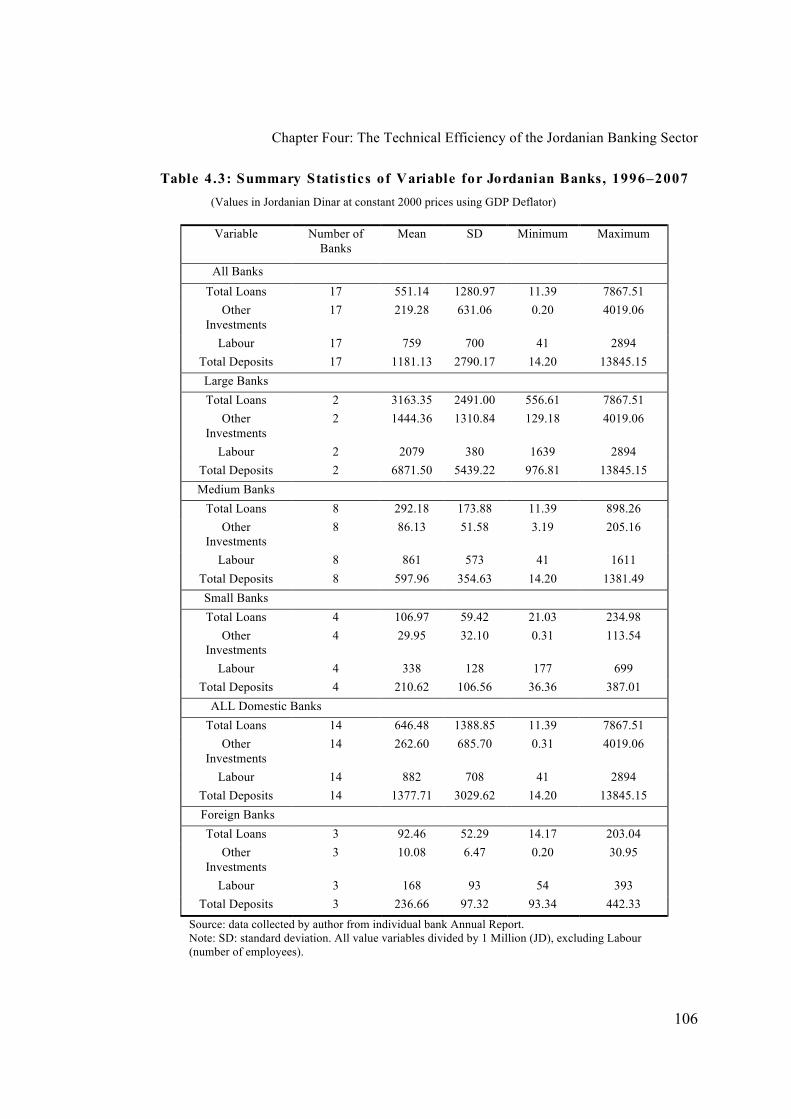
Chapter Four: The Technical Efficiency of the Jordanian Banking Sector
106
Table 4.3: Summary Statistics of Variable for Jordanian Banks, 1996–2007
(Values in Jordanian Dinar at constant 2000 prices using GDP Deflator)
Variable
Number of
Banks
Mean SD Minimum Maximum
All Banks
Total Loans 17 551.14 1280.97 11.39 7867.51
Other
Investments
17 219.28 631.06 0.20 4019.06
Labour 17 759 700 41 2894
Total Deposits 17 1181.13 2790.17 14.20 13845.15
Large Banks
Total Loans 2 3163.35 2491.00 556.61 7867.51
Other
Investments
2 1444.36 1310.84 129.18 4019.06
Labour 2 2079 380 1639 2894
Total Deposits 2 6871.50 5439.22 976.81 13845.15
Medium Banks
Total Loans 8 292.18 173.88 11.39 898.26
Other Investments
8 86.13 51.58 3.19 205.16
Labour 8 861 573 41 1611
Total Deposits 8 597.96 354.63 14.20 1381.49
Small Banks
Total Loans 4 106.97 59.42 21.03 234.98
Other Investments
4 29.95 32.10 0.31 113.54
Labour 4 338 128 177 699
Total Deposits 4 210.62 106.56 36.36 387.01
ALL Domestic Banks
Total Loans 14 646.48 1388.85 11.39 7867.51
Other
Investments
14 262.60 685.70 0.31 4019.06
Labour 14 882 708 41 2894
Total Deposits 14 1377.71 3029.62 14.20 13845.15
Foreign Banks
Total Loans 3 92.46 52.29 14.17 203.04
Other
Investments
3 10.08 6.47 0.20 30.95
Labour 3 168 93 54 393
Total Deposits 3 236.66 97.32 93.34 442.33
Source: data collected by author from individual bank Annual Report. Note: SD: standard deviation. All value variables divided by 1 Million (JD), excluding Labour (number of employees).
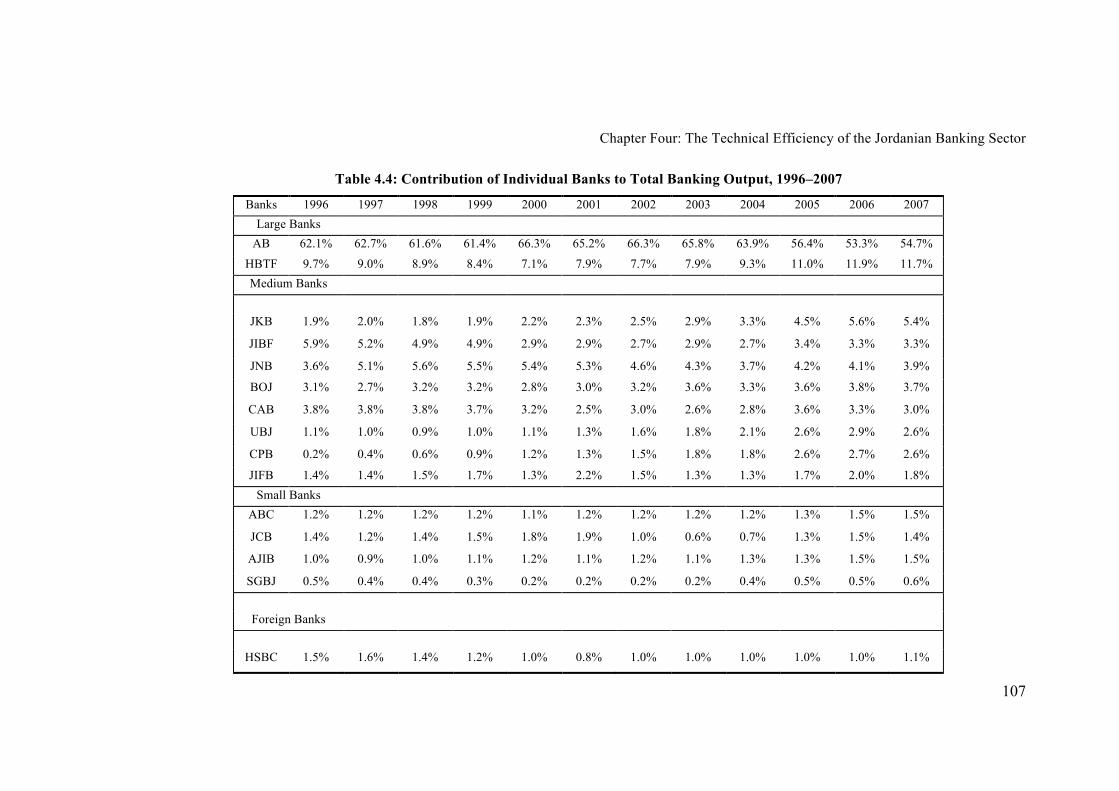
Chapter Four: The Technical Efficiency of the Jordanian Banking Sector
107
Table 4.4: Contribution of Individual Banks to Total Banking Output, 1996–2007
Banks 1996 1997 1998 1999 2000 2001 2002 2003 2004 2005 2006 2007
Large Banks
AB 62.1% 62.7% 61.6% 61.4% 66.3% 65.2% 66.3% 65.8% 63.9% 56.4% 53.3% 54.7%
HBTF 9.7% 9.0% 8.9% 8.4% 7.1% 7.9% 7.7% 7.9% 9.3% 11.0% 11.9% 11.7%
Medium Banks
JKB 1.9% 2.0% 1.8% 1.9% 2.2% 2.3% 2.5% 2.9% 3.3% 4.5% 5.6% 5.4%
JIBF 5.9% 5.2% 4.9% 4.9% 2.9% 2.9% 2.7% 2.9% 2.7% 3.4% 3.3% 3.3%
JNB 3.6% 5.1% 5.6% 5.5% 5.4% 5.3% 4.6% 4.3% 3.7% 4.2% 4.1% 3.9%
BOJ 3.1% 2.7% 3.2% 3.2% 2.8% 3.0% 3.2% 3.6% 3.3% 3.6% 3.8% 3.7%
CAB 3.8% 3.8% 3.8% 3.7% 3.2% 2.5% 3.0% 2.6% 2.8% 3.6% 3.3% 3.0%
UBJ 1.1% 1.0% 0.9% 1.0% 1.1% 1.3% 1.6% 1.8% 2.1% 2.6% 2.9% 2.6%
CPB 0.2% 0.4% 0.6% 0.9% 1.2% 1.3% 1.5% 1.8% 1.8% 2.6% 2.7% 2.6%
JIFB 1.4% 1.4% 1.5% 1.7% 1.3% 2.2% 1.5% 1.3% 1.3% 1.7% 2.0% 1.8%
Small Banks
ABC 1.2% 1.2% 1.2% 1.2% 1.1% 1.2% 1.2% 1.2% 1.2% 1.3% 1.5% 1.5%
JCB 1.4% 1.2% 1.4% 1.5% 1.8% 1.9% 1.0% 0.6% 0.7% 1.3% 1.5% 1.4%
AJIB 1.0% 0.9% 1.0% 1.1% 1.2% 1.1% 1.2% 1.1% 1.3% 1.3% 1.5% 1.5%
SGBJ 0.5% 0.4% 0.4% 0.3% 0.2% 0.2% 0.2% 0.2% 0.4% 0.5% 0.5% 0.6%
Foreign Banks
HSBC 1.5% 1.6% 1.4% 1.2% 1.0% 0.8% 1.0% 1.0% 1.0% 1.0% 1.0% 1.1%
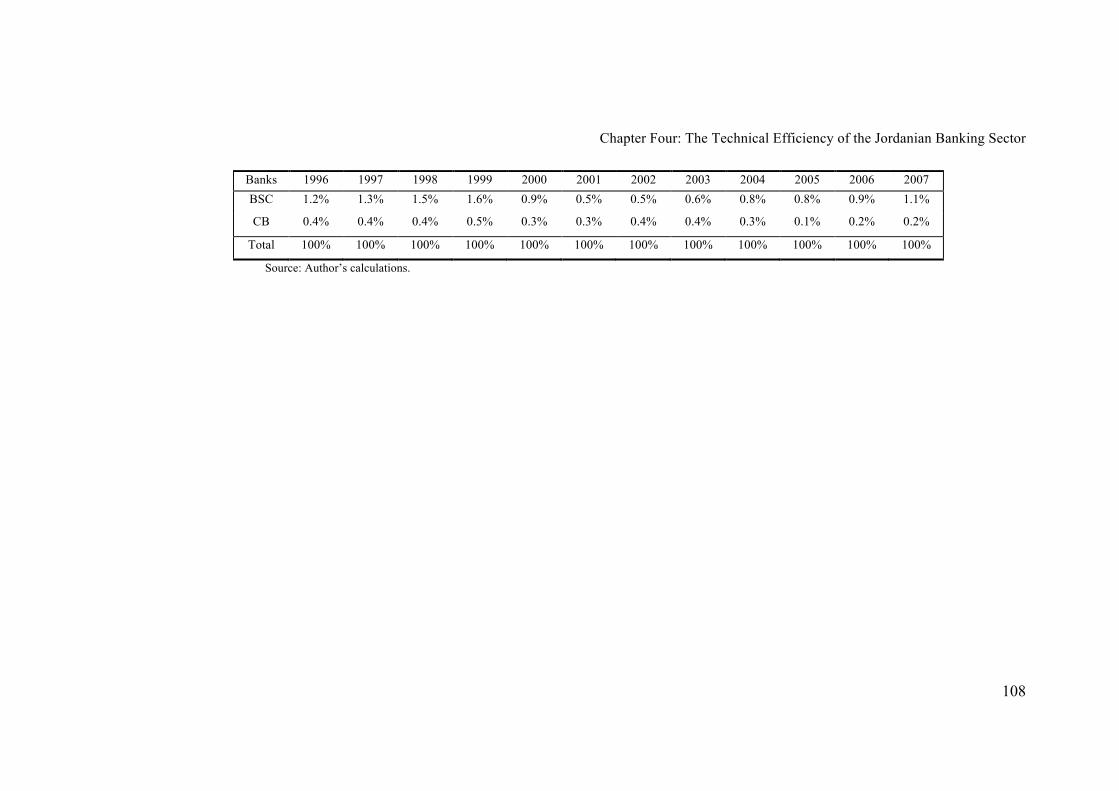
Chapter Four: The Technical Efficiency of the Jordanian Banking Sector
108
Banks 1996 1997 1998 1999 2000 2001 2002 2003 2004 2005 2006 2007
BSC 1.2% 1.3% 1.5% 1.6% 0.9% 0.5% 0.5% 0.6% 0.8% 0.8% 0.9% 1.1%
CB 0.4% 0.4% 0.4% 0.5% 0.3% 0.3% 0.4% 0.4% 0.3% 0.1% 0.2% 0.2%
Total 100% 100% 100% 100% 100% 100% 100% 100% 100% 100% 100% 100%
Source: Author’s calculations.
Chapter Four: The Technical Efficiency of the Jordanian Banking Sector
109
4.5.2 Results of Technical Efficiency
The results determining the technical efficiency levels of banks are obtained by
running the DEA model using the DEAP program to construct a grand frontier that
envelops all input-output observations of all banks. As mentioned earlier, the sample
comprises thirteen domestic commercial banks, one domestic Islamic bank, and three
foreign banks for which data were available, and the study covers the entire financial
liberalisation period.
The input-oriented DEA approach is applied to the panel data (204 observations) of
all 17 banks to construct the grand efficient frontier against which the technical
efficiency scores of all banking units are computed. The efficiency scores compare
across banks and over years, because the efficient frontier is made of best-practice
observations from the whole data set. The approach provides the simplest and most
direct way to compare and track down the efficiency level of a bank. The approach
assumes that technology is constant over the sample period.
The technical efficiency scores lie between 0 and 1, where 1 indicates full efficiency
and 0 indicates full inefficiency. The DEA reveals how efficient a decision making
unit (DMU) is relative to the others. The efficiency score translates into how well a
bank converts its inputs into outputs. For instance, if a bank has a technical
efficiency score of 75%, this means that it would have to reduce its inputs by 25% to
become as efficient as its reference set: those banks with 100% scores.

Chapter Four: The Technical Efficiency of the Jordanian Banking Sector
110
Technical efficiency can be split into the product of ‘pure technical’ and ‘scale’
efficiencies. This requires the estimation of two DEA models: one with constant
returns to scale (CRS), and, the other with variable returns to scale (VRS). If there is
a difference in the two technical efficiency scores for a particular bank, then this
indicates that the bank has scale inefficiency. This process is illustrated in Figure 4.4
for a case with one input (x) and one output (y). The constant returns and variable
returns to scale DEA frontiers are represented by CRS and VRS respectively. Under
CRS, the input-oriented technical inefficiency of point P is the distance PPc, while
under VRS the technical inefficiency would be PPv. The difference between these
two, PcPv, is put down to scale inefficiency. This can all be expressed in ratio
efficiency measures:
TECRS = APC/AP (Technical Efficiency) (4.3)
TEVRS = APV/AP (Pure Technical Efficiency) (4.4)
SE = APC/APV (Scale Efficiency) (4.5)
All of these efficiency measures are bounded by zero and one. It may be noted that
TECRS = TEVRS x SE. (4.6)
That is, the CRS technical efficiency measure is the product of pure technical
efficiency and scale efficiency. The scale efficiency measure does not indicate
whether a bank is operating at increasing returns to scale (IRS) or decreasing returns
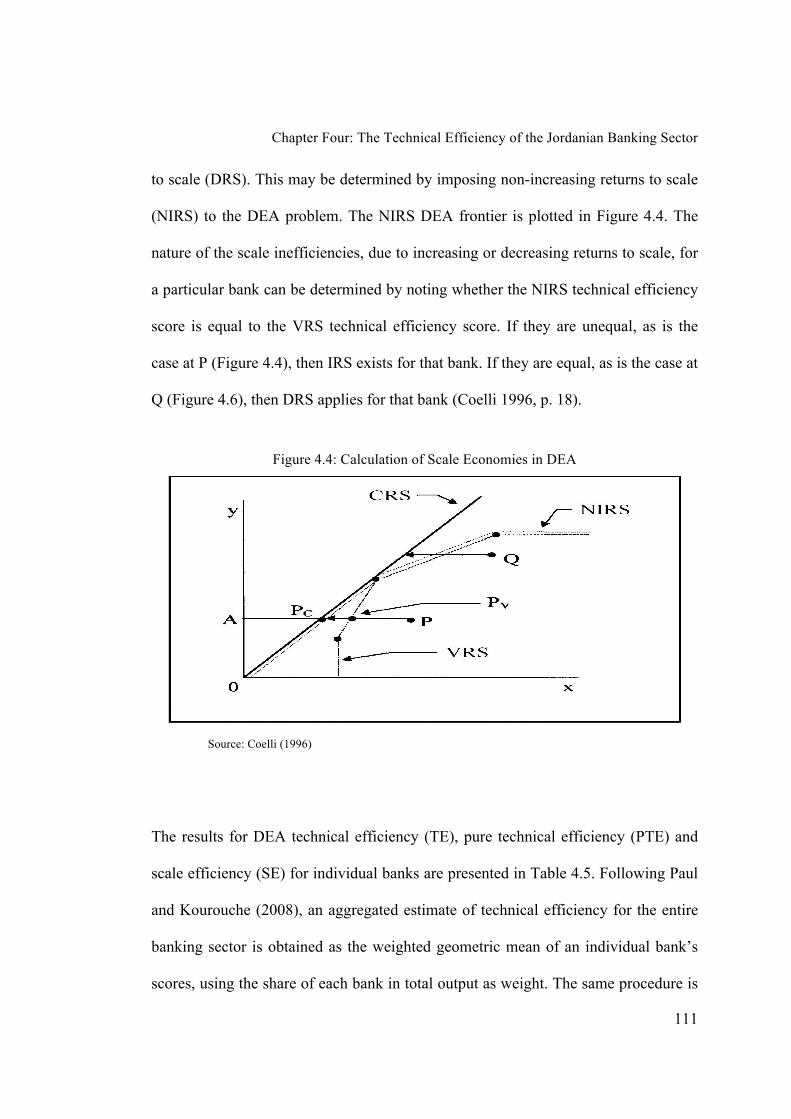
Chapter Four: The Technical Efficiency of the Jordanian Banking Sector
111
to scale (DRS). This may be determined by imposing non-increasing returns to scale
(NIRS) to the DEA problem. The NIRS DEA frontier is plotted in Figure 4.4. The
nature of the scale inefficiencies, due to increasing or decreasing returns to scale, for
a particular bank can be determined by noting whether the NIRS technical efficiency
score is equal to the VRS technical efficiency score. If they are unequal, as is the
case at P (Figure 4.4), then IRS exists for that bank. If they are equal, as is the case at
Q (Figure 4.6), then DRS applies for that bank (Coelli 1996, p. 18).
Figure 4.4: Calculation of Scale Economies in DEA
Source: Coelli (1996)
The results for DEA technical efficiency (TE), pure technical efficiency (PTE) and
scale efficiency (SE) for individual banks are presented in Table 4.5. Following Paul
and Kourouche (2008), an aggregated estimate of technical efficiency for the entire
banking sector is obtained as the weighted geometric mean of an individual bank’s
scores, using the share of each bank in total output as weight. The same procedure is

Chapter Four: The Technical Efficiency of the Jordanian Banking Sector
112
used to calculate the efficiency scores of each group of banks. The aggregate
efficiency scores, calculated in this way, are more accurate than the simple arithmetic
or geometric average of the banks specific scores. This is so because each bank
differs in terms of its contribution to the aggregate output of the banking sector.
The average estimates of technical efficiency for the whole banking sector as well as
for different bank categories are presented in Table 4.5. The table reveals that the
technical efficiency score for the banking sector as a whole is 0.79, which reveals
that 21% of inputs can be reduced to achieve full level of efficiency (without
affecting their output). This value is similar to those found in developing countries
but lower than what is found in some developed countries. For example,
Bhattacharya et al., (1997), Taylor et al. (1997), Chaffai (1997), Darrat et al. (2002)
and Yildirim (2002) report the technical efficiency levels of Indian, Mexican,
Tunisian, Kuwaiti and Turkish banks respectively at 79%, 75%, 72%, 86% and 89%.
However, in developing countries, studies by Fukuyama (1993), Altunbas et al.
(1994), Favero and Papi (1995), Miller and Noulas (1996), and Kourouche (2008)
report technical efficiency levels of Japanese, Germany, Italian, US, and Australian
banks respectively at 94%, 92%, 90%, 95%, and 92.7%. We may note that these
efficiency scores are not strictly comparable across countries because banks in these
countries face different DEA frontiers.
The group of large-sized banks has the highest technical efficiency, at 90.5% on
average during the study period. The medium banks have the lowest technical
efficiency, at 57.5% on average. The efficiency performance of small banks is
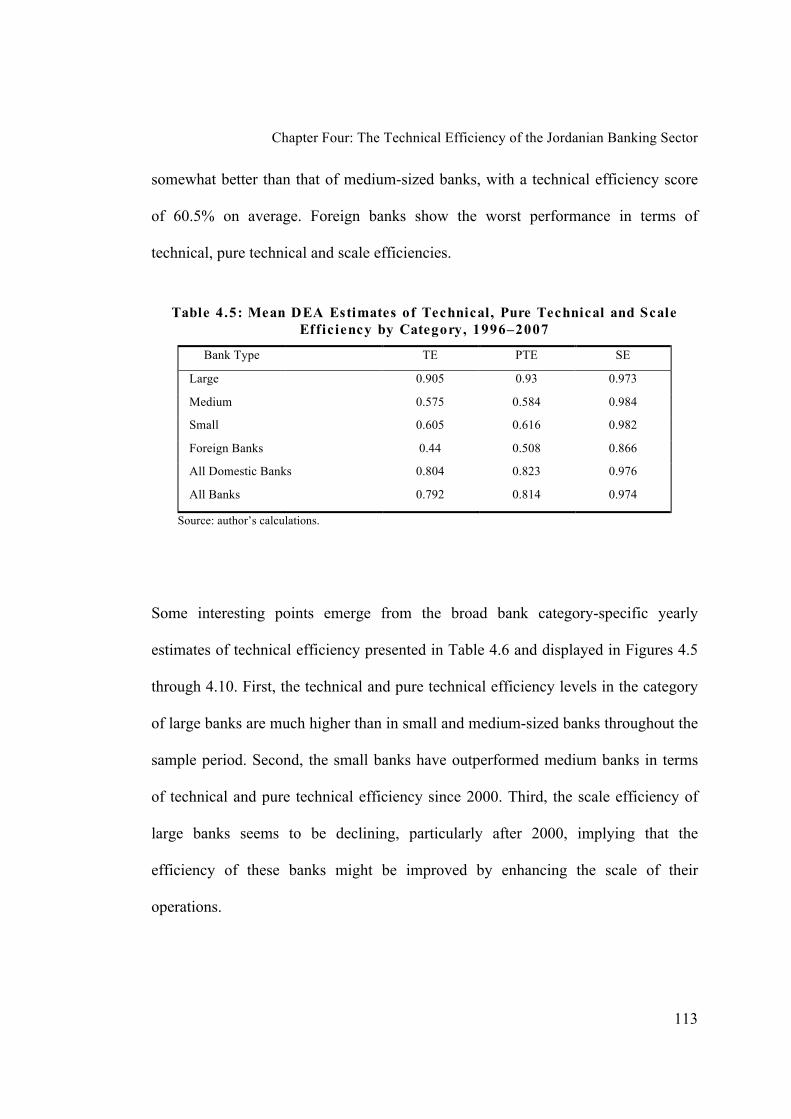
Chapter Four: The Technical Efficiency of the Jordanian Banking Sector
113
somewhat better than that of medium-sized banks, with a technical efficiency score
of 60.5% on average. Foreign banks show the worst performance in terms of
technical, pure technical and scale efficiencies.
Table 4.5: Mean DEA Estimates of Technical, Pure Technical and Scale
Efficiency by Category, 1996–2007
Bank Type TE PTE SE
Large 0.905 0.93 0.973
Medium 0.575 0.584 0.984
Small 0.605 0.616 0.982
Foreign Banks 0.44 0.508 0.866
All Domestic Banks 0.804 0.823 0.976
All Banks 0.792 0.814 0.974
Source: author’s calculations.
Some interesting points emerge from the broad bank category-specific yearly
estimates of technical efficiency presented in Table 4.6 and displayed in Figures 4.5
through 4.10. First, the technical and pure technical efficiency levels in the category
of large banks are much higher than in small and medium-sized banks throughout the
sample period. Second, the small banks have outperformed medium banks in terms
of technical and pure technical efficiency since 2000. Third, the scale efficiency of
large banks seems to be declining, particularly after 2000, implying that the
efficiency of these banks might be improved by enhancing the scale of their
operations.
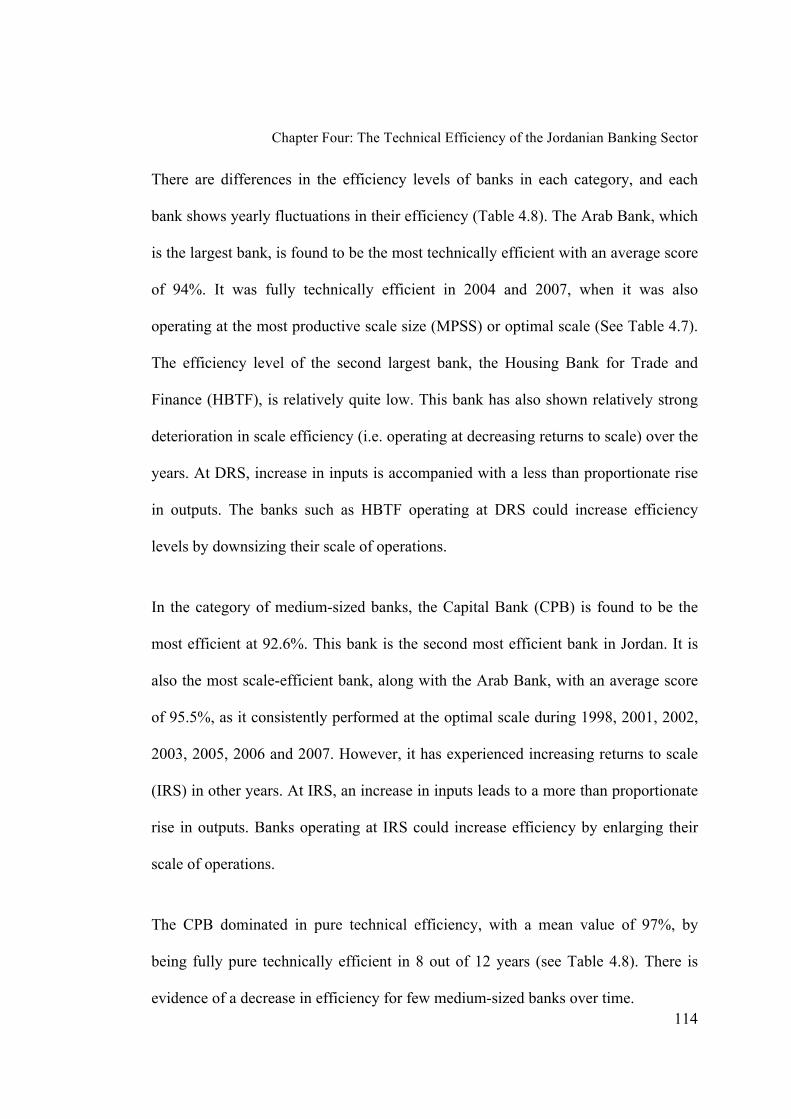
Chapter Four: The Technical Efficiency of the Jordanian Banking Sector
114
There are differences in the efficiency levels of banks in each category, and each
bank shows yearly fluctuations in their efficiency (Table 4.8). The Arab Bank, which
is the largest bank, is found to be the most technically efficient with an average score
of 94%. It was fully technically efficient in 2004 and 2007, when it was also
operating at the most productive scale size (MPSS) or optimal scale (See Table 4.7).
The efficiency level of the second largest bank, the Housing Bank for Trade and
Finance (HBTF), is relatively quite low. This bank has also shown relatively strong
deterioration in scale efficiency (i.e. operating at decreasing returns to scale) over the
years. At DRS, increase in inputs is accompanied with a less than proportionate rise
in outputs. The banks such as HBTF operating at DRS could increase efficiency
levels by downsizing their scale of operations.
In the category of medium-sized banks, the Capital Bank (CPB) is found to be the
most efficient at 92.6%. This bank is the second most efficient bank in Jordan. It is
also the most scale-efficient bank, along with the Arab Bank, with an average score
of 95.5%, as it consistently performed at the optimal scale during 1998, 2001, 2002,
2003, 2005, 2006 and 2007. However, it has experienced increasing returns to scale
(IRS) in other years. At IRS, an increase in inputs leads to a more than proportionate
rise in outputs. Banks operating at IRS could increase efficiency by enlarging their
scale of operations.
The CPB dominated in pure technical efficiency, with a mean value of 97%, by
being fully pure technically efficient in 8 out of 12 years (see Table 4.8). There is
evidence of a decrease in efficiency for few medium-sized banks over time.

Chapter Four: The Technical Efficiency of the Jordanian Banking Sector
115
Among the group of small-sized banks, the Jordan Commercial Bank (JCB) showed
the highest efficiency score at 67.4%, and operated at IRS over the sample period
(see Tables 4.7 and 4.8). The Arab Jordan Investment Bank (AJIB) had the lowest
mean efficiency of 53%. All three foreign banks had low efficiency scores compared
to domestic banks. Their efficiency scores were less than half those of the large
banks.
A complete picture on the nature of the returns to scale experienced by the banking
sector is provided in Table 4.7 and Figure 4.11. On average each year, only one bank
was operating at MPSS exceptions. During 1997, 2001, 2002, 2004, 2006 and 2007,
two banks operated at MPSS, but in 2000 no bank operated at MPSS. The number of
banks operating at IRS has declined from 15 banks in 1996 to six in 2007.
Not all banks have shown an improvement in efficiency over the sample period. The
Arab Bank (AB) and the Capital Bank (CPB) and some small banks show a
substantial improvement in technical efficiency, which can be attributed to
improvement in both PTE and SE. Among the medium-sized banks, Jordan National
Bank (JNB) shows deterioration in TE and PTE; all other banks show improvement
in all efficiency scales. Among the foreign banks, all three show fluctuations in
efficiency over time. The efficiency scores of Jordanian banks increased between
1999 and 2002 and dropped again in 2003. This pattern can be attributed to the
worldwide recession and the political situation in the region. The third Gulf war, also
known as the American–British War on Iraq (2003), adversely affected Jordan’s
economy, causing income decline, inflation, unemployment and impoverishment (see

Chapter Four: The Technical Efficiency of the Jordanian Banking Sector
116
Table 4.8). In 2004, banks’ efficiency scores started to increase in both domestic and
foreign banks.
Table 4.6: DEA Estimates of Efficiency by Category of Banks, 1996–2007
Banks Eff 1996 1997 1998 1999 2000 2001 2002 2003 2004 2005 2006 2007 Mean
Domestic Banks
Large
TE 0.877 0.903 0.877 0.818 0.909 0.932 0.955 0.883 0.960 0.908 0.905 0.947 0.905
PTE 0.882 0.908 0.885 0.833 0.927 0.959 0.981 0.907 0.993 0.949 0.967 0.989 0.930
SE 0.994 0.996 0.990 0.983 0.981 0.972 0.974 0.973 0.966 0.957 0.936 0.958 0.973
Medium
TE 0.665 0.590 0.641 0.610 0.491 0.526 0.484 0.468 0.518 0.628 0.693 0.645 0.575
PTE 0.674 0.599 0.643 0.614 0.496 0.532 0.488 0.470 0.529 0.651 0.712 0.669 0.584
SE 0.988 0.986 0.996 0.995 0.991 0.989 0.993 0.995 0.978 0.965 0.974 0.964 0.984
Small
TE 0.586 0.536 0.564 0.536 0.625 0.614 0.580 0.546 0.629 0.660 0.703 0.715 0.605
PTE 0.603 0.551 0.575 0.546 0.634 0.620 0.587 0.558 0.634 0.670 0.716 0.730 0.616
SE 0.972 0.971 0.981 0.981 0.986 0.989 0.987 0.979 0.991 0.986 0.982 0.979 0.982
Foreign Banks
TE 0.480 0.566 0.551 0.512 0.377 0.356 0.367 0.379 0.408 0.412 0.433 0.510 0.440
PTE 0.527 0.612 0.599 0.557 0.440 0.487 0.454 0.468 0.480 0.477 0.484 0.550 0.508
SE 0.910 0.926 0.919 0.919 0.855 0.731 0.810 0.809 0.849 0.864 0.896 0.926 0.866
All Domestic Banks
TE 0.812 0.806 0.801 0.750 0.788 0.810 0.813 0.758 0.827 0.811 0.829 0.842 0.804
PTE 0.819 0.813 0.808 0.761 0.802 0.830 0.831 0.775 0.853 0.844 0.873 0.876 0.823
SE 0.992 0.993 0.991 0.985 0.983 0.976 0.979 0.978 0.969 0.961 0.949 0.961 0.976
ALL Banks
TE 0.799 0.797 0.791 0.740 0.776 0.799 0.801 0.747 0.815 0.801 0.817 0.832 0.792
PTE 0.807 0.805 0.800 0.753 0.791 0.822 0.822 0.767 0.843 0.835 0.863 0.867 0.814
SE 0.989 0.990 0.989 0.983 0.980 0.971 0.975 0.974 0.967 0.959 0.948 0.960 0.974
Source: author’s calculations.
Note: TE: technical efficiency, PTE: pure technical efficiency SE: scale efficiency. The
efficiency estimates for each bank category are the weighted geometric means of bank
specific efficiencies, where the weights are their share in the aggregate output of the bank
category they belong to. The weights vary from year to year.
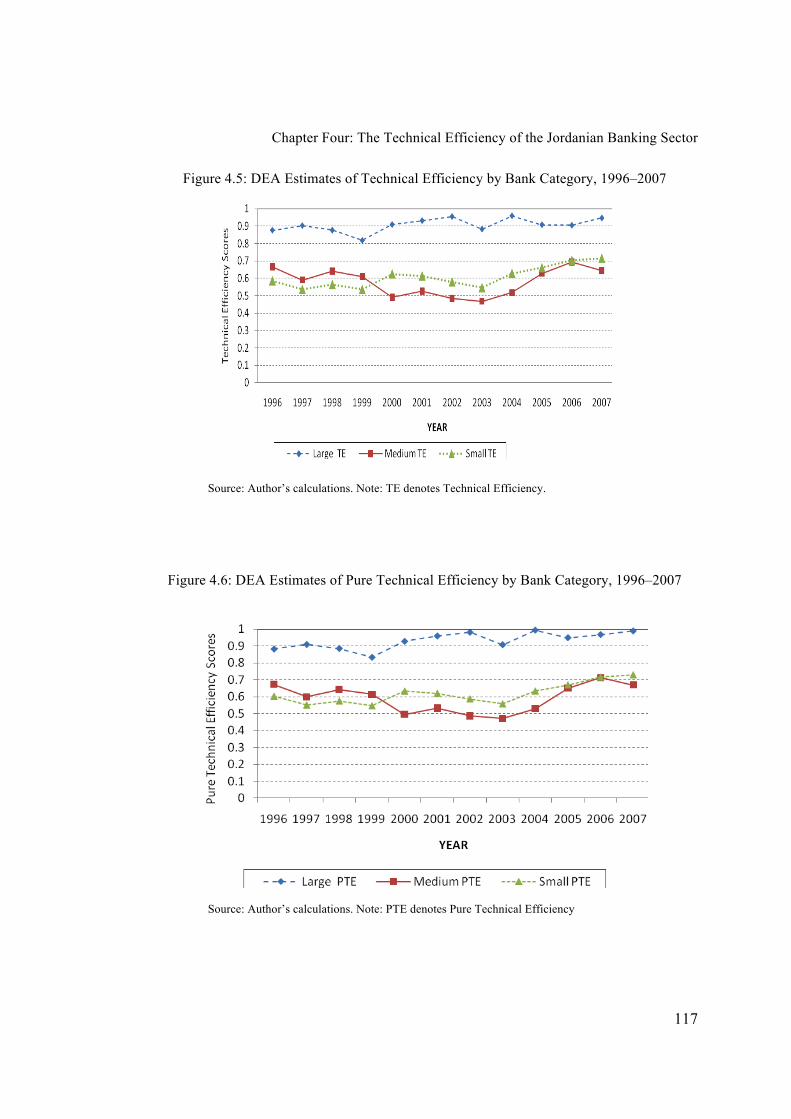
Chapter Four: The Technical Efficiency of the Jordanian Banking Sector
117
Figure 4.5: DEA Estimates of Technical Efficiency by Bank Category, 1996–2007
Source: Author’s calculations. Note: TE denotes Technical Efficiency.
Figure 4.6: DEA Estimates of Pure Technical Efficiency by Bank Category, 1996–2007
Source: Author’s calculations. Note: PTE denotes Pure Technical Efficiency
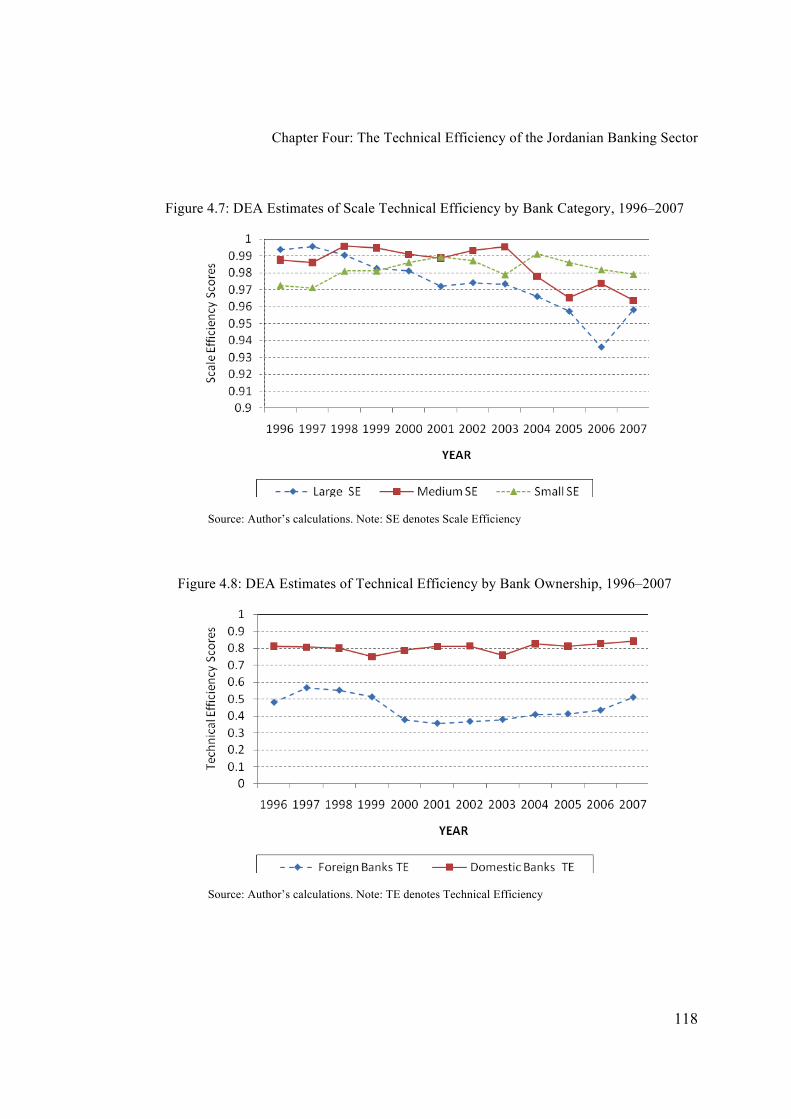
Chapter Four: The Technical Efficiency of the Jordanian Banking Sector
118
Figure 4.7: DEA Estimates of Scale Technical Efficiency by Bank Category, 1996–2007
Source: Author’s calculations. Note: SE denotes Scale Efficiency
Figure 4.8: DEA Estimates of Technical Efficiency by Bank Ownership, 1996–2007
Source: Author’s calculations. Note: TE denotes Technical Efficiency
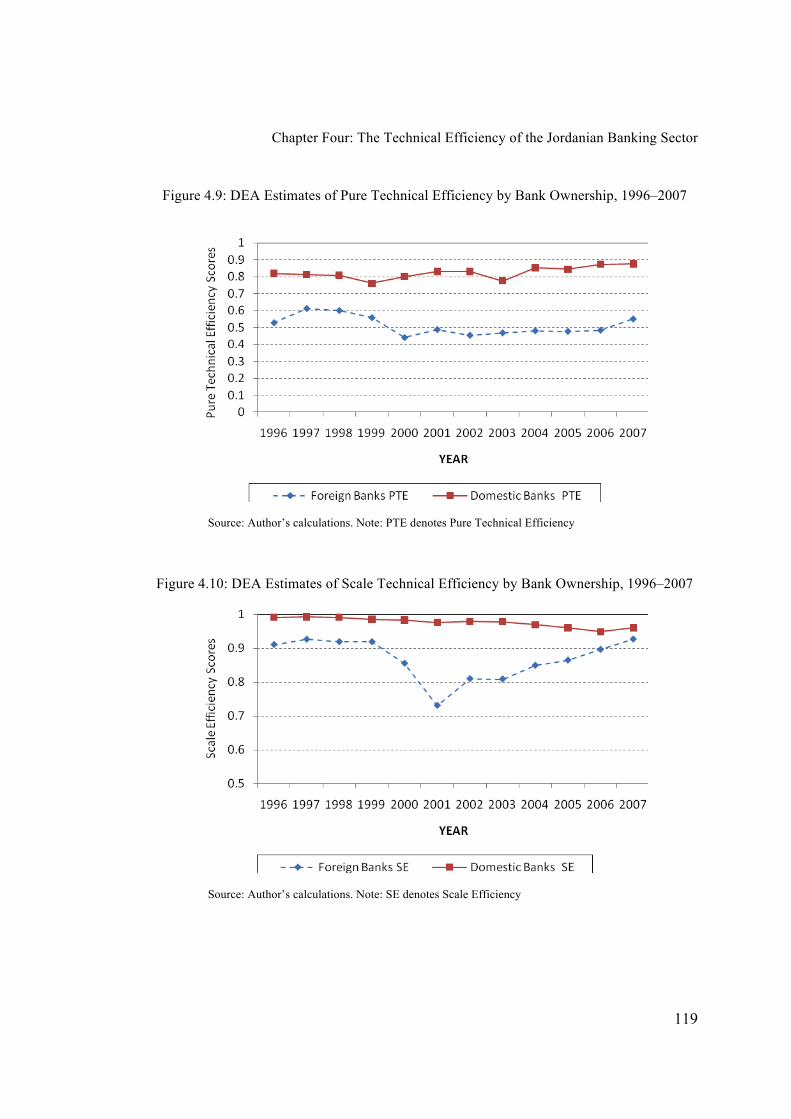
Chapter Four: The Technical Efficiency of the Jordanian Banking Sector
119
Figure 4.9: DEA Estimates of Pure Technical Efficiency by Bank Ownership, 1996–2007
Source: Author’s calculations. Note: PTE denotes Pure Technical Efficiency
Figure 4.10: DEA Estimates of Scale Technical Efficiency by Bank Ownership, 1996–2007
Source: Author’s calculations. Note: SE denotes Scale Efficiency
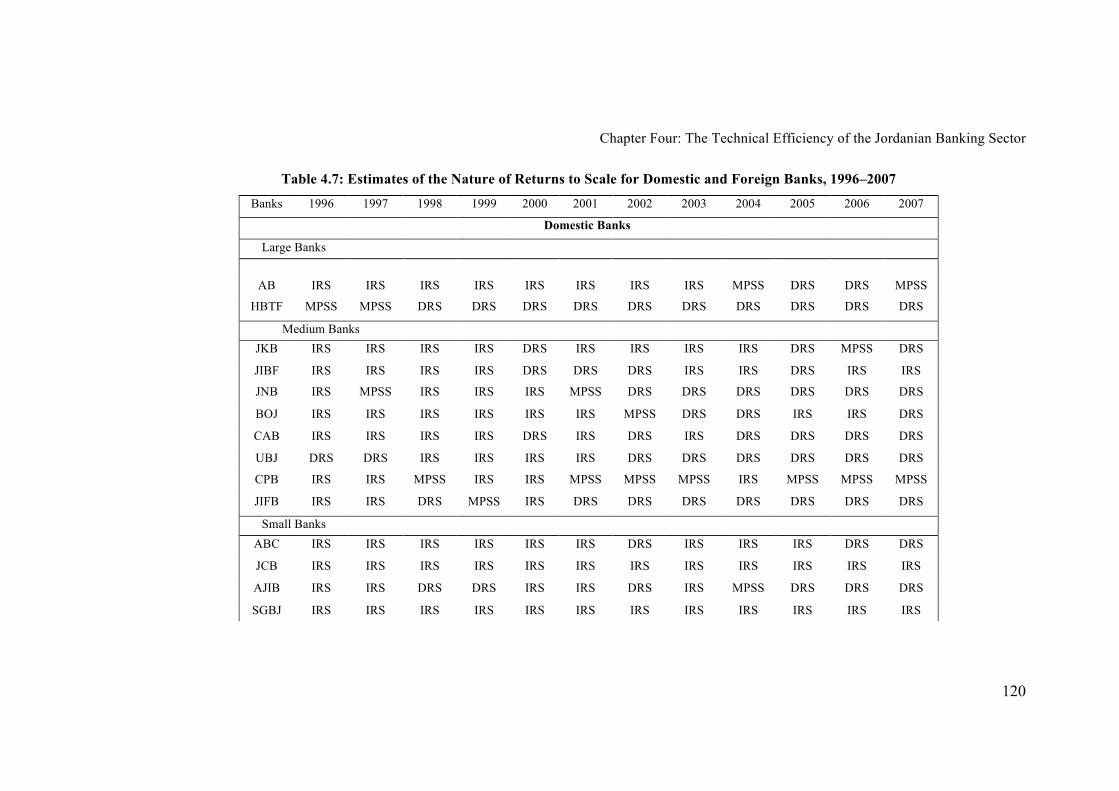
Chapter Four: The Technical Efficiency of the Jordanian Banking Sector
120
Table 4.7: Estimates of the Nature of Returns to Scale for Domestic and Foreign Banks, 1996–2007
Banks 1996 1997 1998 1999 2000 2001 2002 2003 2004 2005 2006 2007
Domestic Banks
Large Banks
AB IRS IRS IRS IRS IRS IRS IRS IRS MPSS DRS DRS MPSS
HBTF MPSS MPSS DRS DRS DRS DRS DRS DRS DRS DRS DRS DRS
Medium Banks
JKB IRS IRS IRS IRS DRS IRS IRS IRS IRS DRS MPSS DRS
JIBF IRS IRS IRS IRS DRS DRS DRS IRS IRS DRS IRS IRS
JNB IRS MPSS IRS IRS IRS MPSS DRS DRS DRS DRS DRS DRS
BOJ IRS IRS IRS IRS IRS IRS MPSS DRS DRS IRS IRS DRS
CAB IRS IRS IRS IRS DRS IRS DRS IRS DRS DRS DRS DRS
UBJ DRS DRS IRS IRS IRS IRS DRS DRS DRS DRS DRS DRS
CPB IRS IRS MPSS IRS IRS MPSS MPSS MPSS IRS MPSS MPSS MPSS
JIFB IRS IRS DRS MPSS IRS DRS DRS DRS DRS DRS DRS DRS
Small Banks
ABC IRS IRS IRS IRS IRS IRS DRS IRS IRS IRS DRS DRS
JCB IRS IRS IRS IRS IRS IRS IRS IRS IRS IRS IRS IRS
AJIB IRS IRS DRS DRS IRS IRS DRS IRS MPSS DRS DRS DRS
SGBJ IRS IRS IRS IRS IRS IRS IRS IRS IRS IRS IRS IRS
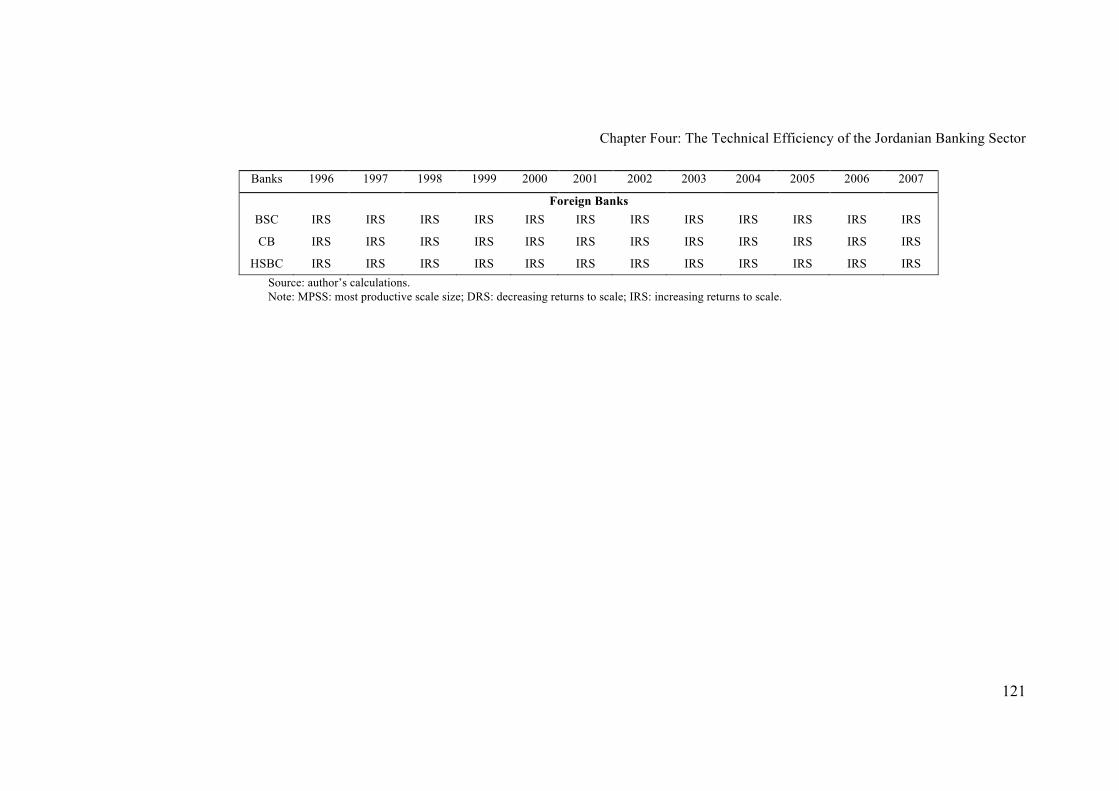
Chapter Four: The Technical Efficiency of the Jordanian Banking Sector
121
Banks 1996 1997 1998 1999 2000 2001 2002 2003 2004 2005 2006 2007
Foreign Banks
BSC IRS IRS IRS IRS IRS IRS IRS IRS IRS IRS IRS IRS
CB IRS IRS IRS IRS IRS IRS IRS IRS IRS IRS IRS IRS
HSBC IRS IRS IRS IRS IRS IRS IRS IRS IRS IRS IRS IRS
Source: author’s calculations.
Note: MPSS: most productive scale size; DRS: decreasing returns to scale; IRS: increasing returns to scale.
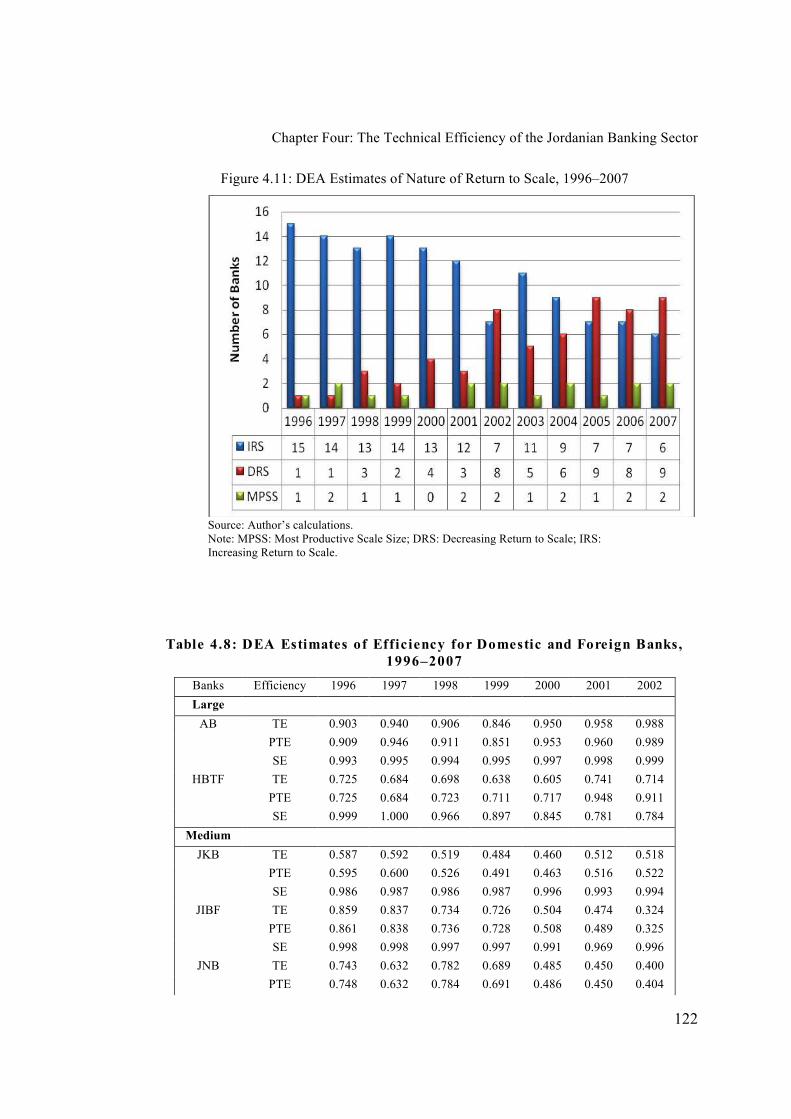
Chapter Four: The Technical Efficiency of the Jordanian Banking Sector
122
Figure 4.11: DEA Estimates of Nature of Return to Scale, 1996–2007
Source: Author’s calculations.
Note: MPSS: Most Productive Scale Size; DRS: Decreasing Return to Scale; IRS:
Increasing Return to Scale.
Table 4.8: DEA Estimates of Efficiency for Domestic and Foreign Banks,
1996–2007
Banks Efficiency 1996 1997 1998 1999 2000 2001 2002
Large
AB TE 0.903 0.940 0.906 0.846 0.950 0.958 0.988
PTE 0.909 0.946 0.911 0.851 0.953 0.960 0.989
SE 0.993 0.995 0.994 0.995 0.997 0.998 0.999
HBTF TE 0.725 0.684 0.698 0.638 0.605 0.741 0.714
PTE 0.725 0.684 0.723 0.711 0.717 0.948 0.911
SE 0.999 1.000 0.966 0.897 0.845 0.781 0.784
Medium
JKB TE 0.587 0.592 0.519 0.484 0.460 0.512 0.518
PTE 0.595 0.600 0.526 0.491 0.463 0.516 0.522
SE 0.986 0.987 0.986 0.987 0.996 0.993 0.994
JIBF TE 0.859 0.837 0.734 0.726 0.504 0.474 0.324
PTE 0.861 0.838 0.736 0.728 0.508 0.489 0.325
SE 0.998 0.998 0.997 0.997 0.991 0.969 0.996
JNB TE 0.743 0.632 0.782 0.689 0.485 0.450 0.400
PTE 0.748 0.632 0.784 0.691 0.486 0.450 0.404

Chapter Four: The Technical Efficiency of the Jordanian Banking Sector
123
Banks Efficiency 1996 1997 1998 1999 2000 2001 2002
SE 0.993 1.000 0.998 0.998 0.999 1.000 0.990
BOJ TE 0.612 0.475 0.567 0.562 0.480 0.506 0.489
PTE 0.617 0.479 0.568 0.566 0.482 0.508 0.490
SE 0.992 0.992 0.998 0.994 0.995 0.995 0.999
CAB TE 0.518 0.413 0.501 0.436 0.415 0.395 0.435
PTE 0.521 0.415 0.503 0.438 0.417 0.397 0.439
SE 0.994 0.995 0.995 0.995 0.995 0.995 0.990
UBJ TE 0.492 0.546 0.464 0.443 0.448 0.522 0.564
PTE 0.495 0.547 0.472 0.453 0.457 0.530 0.568
SE 0.995 0.998 0.983 0.978 0.979 0.985 0.994
CPB TE 0.861 0.605 1.000 0.990 0.973 0.932 1.000
PTE 1.000 0.862 1.000 1.000 1.000 0.932 1.000
SE 0.861 0.702 1.000 0.990 0.973 1.000 1.000
JIFB TE 0.588 0.525 0.614 0.741 0.511 0.962 0.786
PTE 0.641 0.561 0.615 0.741 0.535 1.000 0.801
Small
ABC TE 0.610 0.568 0.544 0.503 0.481 0.510 0.529
PTE 0.624 0.580 0.555 0.513 0.487 0.511 0.530
SE 0.978 0.979 0.980 0.980 0.986 0.999 0.999
JCB TE 0.723 0.681 0.692 0.662 0.744 0.748 0.522
PTE 0.737 0.695 0.703 0.671 0.751 0.754 0.531
SE 0.981 0.979 0.984 0.986 0.991 0.992 0.983
AJIB TE 0.353 0.315 0.396 0.430 0.654 0.537 0.674
PTE 0.365 0.325 0.397 0.433 0.657 0.542 0.679
SE 0.969 0.967 0.998 0.994 0.995 0.991 0.992
SGBJ TE 0.818 0.711 0.769 0.559 0.435 0.620 0.654
PTE 0.869 0.760 0.828 0.611 0.484 0.688 0.706
SE 0.942 0.935 0.929 0.914 0.897 0.901 0.926
Foreign
HSBC TE 0.510 0.641 0.557 0.462 0.407 0.367 0.364
PTE 0.513 0.651 0.566 0.466 0.414 0.377 0.367
SE 0.994 0.985 0.985 0.992 0.982 0.975 0.994
BSC TE 0.464 0.545 0.590 0.568 0.375 0.352 0.322
PTE 0.476 0.557 0.601 0.572 0.408 0.530 0.415
SE 0.975 0.979 0.980 0.993 0.917 0.665 0.776
CB TE 0.430 0.397 0.423 0.464 0.293 0.336 0.440
PTE 0.771 0.641 0.719 0.818 0.705 0.808 0.818
SE 0.557 0.619 0.588 0.567 0.416 0.415 0.537
Note: TE: technical efficiency, PTE: pure technical efficiency SE: scale efficiency

Chapter Four: The Technical Efficiency of the Jordanian Banking Sector
124
Table 4.8 (Continued): DEA Estimates of Efficiency for Domestic and
Foreign Banks, 1996-2007
Banks
Efficiency
2003
2004
2005
2006
2007
Mean
Ranking
based on
mean TE
Large
AB TE 0.920 1.000 0.948 0.938 1.000 0.940 1
PTE 0.922 1.000 0.950 0.960 1.000 0.945
SE 0.998 1.000 0.998 0.977 1.000 0.995
HBTF TE 0.627 0.723 0.728 0.772 0.734 0.697 4
PTE 0.793 0.949 0.942 1.000 0.937 0.829
SE 0.791 0.762 0.773 0.772 0.784 0.842
Medium
JKB TE 0.552 0.619 0.821 1.000 0.912 0.611 7
PTE 0.555 0.621 0.833 1.000 0.967 0.619
SE 0.995 0.997 0.985 1.000 0.944 0.987
JIBF TE 0.281 0.287 0.375 0.398 0.449 0.483 13
PTE 0.282 0.288 0.377 0.399 0.449 0.485
SE 0.997 0.997 0.996 0.998 0.999 0.994
JNB TE 0.404 0.368 0.463 0.520 0.498 0.520 12
PTE 0.406 0.384 0.487 0.563 0.529 0.532
SE 0.994 0.957 0.951 0.925 0.942 0.979
BOJ TE 0.500 0.544 0.526 0.568 0.492 0.525 11
PTE 0.503 0.558 0.527 0.569 0.493 0.528
SE 0.994 0.975 0.998 0.999 0.998 0.994
CAB TE 0.377 0.453 0.638 0.635 0.550 0.473 14
PTE 0.379 0.456 0.714 0.665 0.591 0.485
SE 0.994 0.994 0.893 0.956 0.930 0.977
UBJ TE 0.555 0.732 0.860 0.784 0.745 0.581 8
PTE 0.557 0.778 0.904 0.830 0.768 0.596
SE 0.997 0.941 0.951 0.944 0.969 0.976
CPB TE 0.907 0.942 1.000 1.000 1.000 0.926 2
PTE 0.907 0.957 1.000 1.000 1.000 0.970
SE 1.000 0.984 1.000 1.000 1.000 0.955
JIFB TE 0.652 0.862 0.792 0.954 0.764 0.714 3
PTE 0.656 0.884 0.832 1.000 0.816 0.742
SE 0.995 0.975 0.952 0.954 0.936 0.963
Small

Chapter Four: The Technical Efficiency of the Jordanian Banking Sector
125
Banks
Efficiency
2003
2004
2005
2006
2007
Mean
Ranking
based on
mean TE
ABC TE 0.516 0.566 0.663 0.729 0.716 0.573 9
PTE 0.525 0.571 0.670 0.732 0.723 0.580
SE 0.983 0.992 0.990 0.995 0.990 0.988
JCB TE 0.667 0.670 0.711 0.650 0.654 0.674 5
PTE 0.690 0.675 0.719 0.655 0.658 0.684
SE 0.967 0.993 0.989 0.992 0.993 0.986
AJIB TE 0.508 0.639 0.623 0.716 0.750 0.530 10
PTE 0.511 0.639 0.633 0.745 0.786 0.539
SE 0.993 0.999 0.984 0.961 0.955 0.983
SGBJ TE 0.619 0.724 0.621 0.770 0.786 0.665 6
PTE 0.668 0.754 0.639 0.791 0.802 0.709
SE 0.926 0.960 0.972 0.973 0.980 0.938
Foreign
HSBC TE 0.386 0.390 0.406 0.446 0.473 0.444 16
PTE 0.388 0.391 0.408 0.447 0.476 0.449
SE 0.995 0.996 0.996 0.997 0.994 0.990
BSC TE 0.384 0.462 0.497 0.483 0.603 0.461 15
PTE 0.460 0.493 0.530 0.485 0.604 0.507
SE 0.833 0.937 0.938 0.996 0.998 0.909
CB TE 0.352 0.339 0.153 0.203 0.320 0.331 17
PTE 0.787 0.883 0.783 0.771 0.694 0.764
SE 0.448 0.384 0.196 0.264 0.460 0.433
Source: Author’s calculations.
Note: TE: technical efficiency, PTE: pure technical efficiency SE: scale efficiency
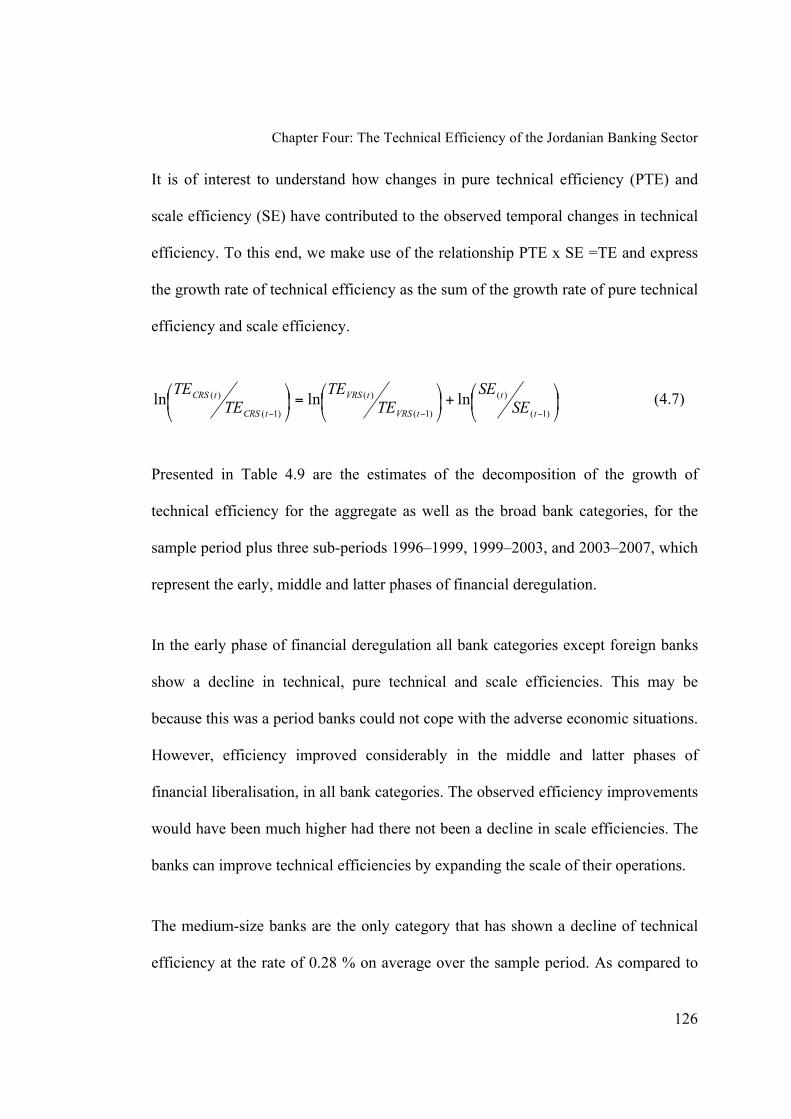
Chapter Four: The Technical Efficiency of the Jordanian Banking Sector
126
It is of interest to understand how changes in pure technical efficiency (PTE) and
scale efficiency (SE) have contributed to the observed temporal changes in technical
efficiency. To this end, we make use of the relationship PTE x SE =TE and express
the growth rate of technical efficiency as the sum of the growth rate of pure technical
efficiency and scale efficiency.
+
=
−−− )1(
)(
)1(
)(
)1(
)( lnlnlnt
t
tVRS
tVRS
tCRS
tCRS
SE
SE
TE
TE
TE
TE (4.7)
Presented in Table 4.9 are the estimates of the decomposition of the growth of
technical efficiency for the aggregate as well as the broad bank categories, for the
sample period plus three sub-periods 1996–1999, 1999–2003, and 2003–2007, which
represent the early, middle and latter phases of financial deregulation.
In the early phase of financial deregulation all bank categories except foreign banks
show a decline in technical, pure technical and scale efficiencies. This may be
because this was a period banks could not cope with the adverse economic situations.
However, efficiency improved considerably in the middle and latter phases of
financial liberalisation, in all bank categories. The observed efficiency improvements
would have been much higher had there not been a decline in scale efficiencies. The
banks can improve technical efficiencies by expanding the scale of their operations.
The medium-size banks are the only category that has shown a decline of technical
efficiency at the rate of 0.28 % on average over the sample period. As compared to

Chapter Four: The Technical Efficiency of the Jordanian Banking Sector
127
foreign banks, small banks show greater improvements in efficiency, particularly in
the latter phase of financial deregulation in Jordan.
It may further be noted that the DEA approach enables us to identify the sources of
inefficiencies, or areas with the opportunity to develop efficiency levels, by
identifying slacks in output or input vectors for each bank of the sample. Slacks refer
to the additional amount by which an output or input can be decreased or increased,
respectively, to reach the point of full technical efficiency. This is under the
condition that decreased inputs or outputs are in equal proportion in order to reach
the production frontier.
The results in Table 4.10 suggest sources of inefficiencies in each bank. For
example, the Arab Bank in 1996 would have needed to reduce labour by 10% and
increase investments by 123% to reach the efficient point. Its performance improved
to become fully efficient by 2007. HBTF in 1996 could have reduced total deposits
by 28% and done the same with other investments. In 2007 HBTF appears to be
more efficient than in 1996, after a reduction in total deposits and increased deposits
in other investments.
The fact that different banks are found to be efficient or inefficient indicates that
bank size does not necessarily affect the level of efficiency: that is, banks can be
efficient at different sizes. It can be seen that the number of fully efficient banks has
increased over the study period of financial reforms; in the year 1996 there were no

Chapter Four: The Technical Efficiency of the Jordanian Banking Sector
128
fully efficient banks, but in 2007 two were fully efficient: the Arab Bank and the
Capital Bank.
4.5.3 A comparison with Earlier Studies
Magayrah (2004) investigated the efficiency of eight domestic banks using DEA,
covering the period up to 2001. The results show a mean technical efficiency of
91.8%. Bdour and Al–Khouri (2008) evaluated the efficiency of 17 Jordanian banks
during the six-year liberalisation period, 1998–2004. Their results show an increase
in the efficiency scores of most banks, except a few which showed a decline in 2003
and 2004, possibly due to the Gulf War. The estimates of efficiency are not strictly
comparable to those in this study because of differences in sample size, sample
period and model specifications; however, a rough comparison does reveal that
deregulation and financial liberalisation worked positively and led to improvement in
the technical efficiency levels of banks in Jordan.
It should also be noted that not all the studies of banking sectors conducted in other
countries support the view that financial deregulation improves efficiency. While the
positive effects of deregulation on banking efficiency are observed by Leightner and
Lovell (1998), Gilbert and Wilson (1998), and Avkiran (1999) in Asian countries,
unexpected (negative) effects were found by Grabowski, Rangan and Rezvanian
(1994), and Wheelock and Wilson (1999) in the US banks.
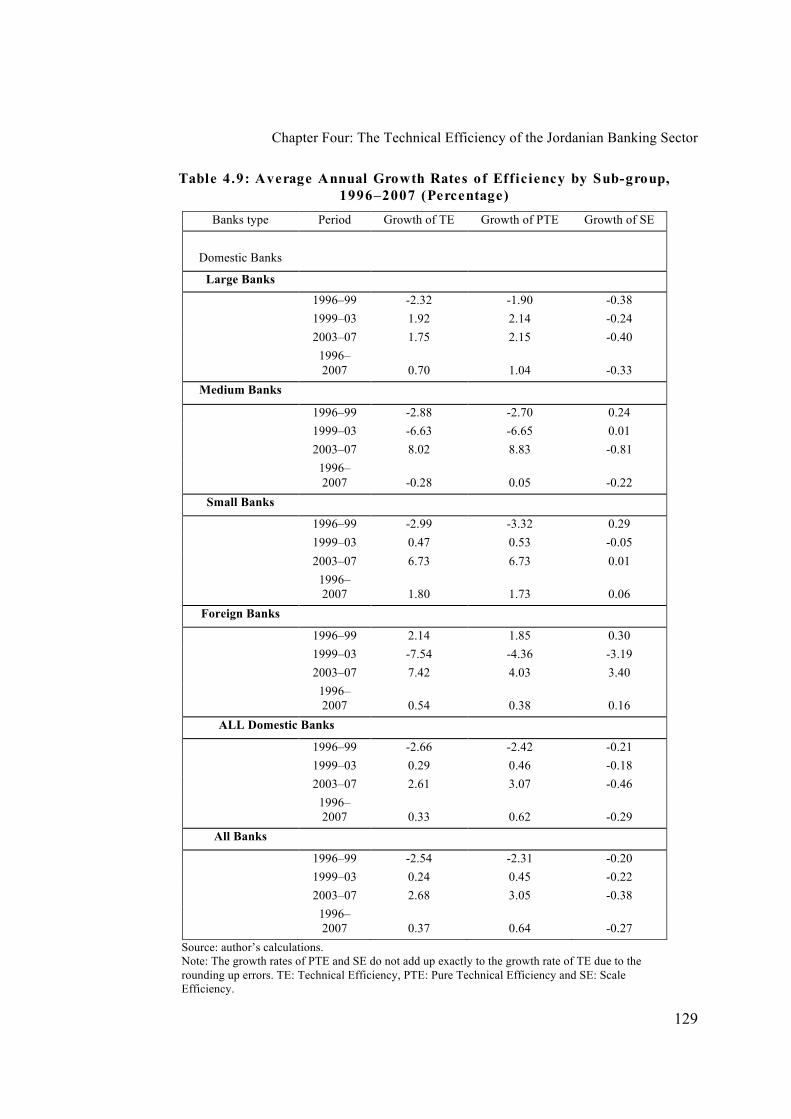
Chapter Four: The Technical Efficiency of the Jordanian Banking Sector
129
Table 4.9: Average Annual Growth Rates of Efficiency by Sub-group,
1996–2007 (Percentage)
Banks type Period Growth of TE Growth of PTE Growth of SE
Domestic Banks
Large Banks
1996–99 -2.32 -1.90 -0.38
1999–03 1.92 2.14 -0.24
2003–07 1.75 2.15 -0.40
1996–
2007 0.70 1.04 -0.33
Medium Banks
1996–99 -2.88 -2.70 0.24
1999–03 -6.63 -6.65 0.01
2003–07 8.02 8.83 -0.81
1996–
2007 -0.28 0.05 -0.22
Small Banks
1996–99 -2.99 -3.32 0.29
1999–03 0.47 0.53 -0.05
2003–07 6.73 6.73 0.01
1996–
2007 1.80 1.73 0.06
Foreign Banks
1996–99 2.14 1.85 0.30
1999–03 -7.54 -4.36 -3.19
2003–07 7.42 4.03 3.40
1996–
2007 0.54 0.38 0.16
ALL Domestic Banks
1996–99 -2.66 -2.42 -0.21
1999–03 0.29 0.46 -0.18
2003–07 2.61 3.07 -0.46
1996–
2007 0.33 0.62 -0.29
All Banks
1996–99 -2.54 -2.31 -0.20
1999–03 0.24 0.45 -0.22
2003–07 2.68 3.05 -0.38
1996–
2007 0.37 0.64 -0.27
Source: author’s calculations.
Note: The growth rates of PTE and SE do not add up exactly to the growth rate of TE due to the
rounding up errors. TE: Technical Efficiency, PTE: Pure Technical Efficiency and SE: Scale
Efficiency.
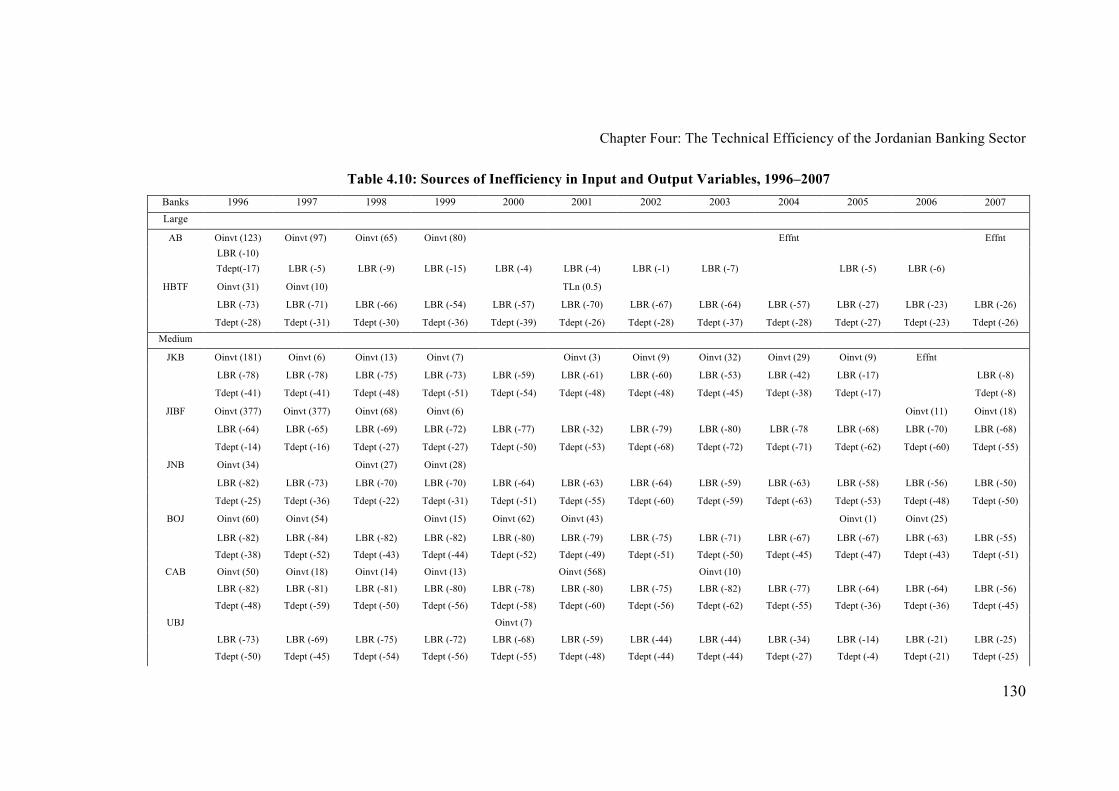
Chapter Four: The Technical Efficiency of the Jordanian Banking Sector
130
Table 4.10: Sources of Inefficiency in Input and Output Variables, 1996–2007
Banks 1996 1997 1998 1999 2000 2001 2002 2003 2004 2005 2006 2007
Large
AB Oinvt (123) Oinvt (97) Oinvt (65) Oinvt (80) Effnt Effnt
LBR (-10)
Tdept(-17) LBR (-5) LBR (-9) LBR (-15) LBR (-4) LBR (-4) LBR (-1) LBR (-7) LBR (-5) LBR (-6)
HBTF Oinvt (31) Oinvt (10) TLn (0.5)
LBR (-73) LBR (-71) LBR (-66) LBR (-54) LBR (-57) LBR (-70) LBR (-67) LBR (-64) LBR (-57) LBR (-27) LBR (-23) LBR (-26)
Tdept (-28) Tdept (-31) Tdept (-30) Tdept (-36) Tdept (-39) Tdept (-26) Tdept (-28) Tdept (-37) Tdept (-28) Tdept (-27) Tdept (-23) Tdept (-26)
Medium
JKB Oinvt (181) Oinvt (6) Oinvt (13) Oinvt (7) Oinvt (3) Oinvt (9) Oinvt (32) Oinvt (29) Oinvt (9) Effnt
LBR (-78) LBR (-78) LBR (-75) LBR (-73) LBR (-59) LBR (-61) LBR (-60) LBR (-53) LBR (-42) LBR (-17) LBR (-8)
Tdept (-41) Tdept (-41) Tdept (-48) Tdept (-51) Tdept (-54) Tdept (-48) Tdept (-48) Tdept (-45) Tdept (-38) Tdept (-17) Tdept (-8)
JIBF Oinvt (377) Oinvt (377) Oinvt (68) Oinvt (6) Oinvt (11) Oinvt (18)
LBR (-64) LBR (-65) LBR (-69) LBR (-72) LBR (-77) LBR (-32) LBR (-79) LBR (-80) LBR (-78 LBR (-68) LBR (-70) LBR (-68)
Tdept (-14) Tdept (-16) Tdept (-27) Tdept (-27) Tdept (-50) Tdept (-53) Tdept (-68) Tdept (-72) Tdept (-71) Tdept (-62) Tdept (-60) Tdept (-55)
JNB Oinvt (34) Oinvt (27) Oinvt (28)
LBR (-82) LBR (-73) LBR (-70) LBR (-70) LBR (-64) LBR (-63) LBR (-64) LBR (-59) LBR (-63) LBR (-58) LBR (-56) LBR (-50)
Tdept (-25) Tdept (-36) Tdept (-22) Tdept (-31) Tdept (-51) Tdept (-55) Tdept (-60) Tdept (-59) Tdept (-63) Tdept (-53) Tdept (-48) Tdept (-50)
BOJ Oinvt (60) Oinvt (54) Oinvt (15) Oinvt (62) Oinvt (43) Oinvt (1) Oinvt (25)
LBR (-82) LBR (-84) LBR (-82) LBR (-82) LBR (-80) LBR (-79) LBR (-75) LBR (-71) LBR (-67) LBR (-67) LBR (-63) LBR (-55)
Tdept (-38) Tdept (-52) Tdept (-43) Tdept (-44) Tdept (-52) Tdept (-49) Tdept (-51) Tdept (-50) Tdept (-45) Tdept (-47) Tdept (-43) Tdept (-51)
CAB Oinvt (50) Oinvt (18) Oinvt (14) Oinvt (13) Oinvt (568) Oinvt (10)
LBR (-82) LBR (-81) LBR (-81) LBR (-80) LBR (-78) LBR (-80) LBR (-75) LBR (-82) LBR (-77) LBR (-64) LBR (-64) LBR (-56)
Tdept (-48) Tdept (-59) Tdept (-50) Tdept (-56) Tdept (-58) Tdept (-60) Tdept (-56) Tdept (-62) Tdept (-55) Tdept (-36) Tdept (-36) Tdept (-45)
UBJ Oinvt (7)
LBR (-73) LBR (-69) LBR (-75) LBR (-72) LBR (-68) LBR (-59) LBR (-44) LBR (-44) LBR (-34) LBR (-14) LBR (-21) LBR (-25)
Tdept (-50) Tdept (-45) Tdept (-54) Tdept (-56) Tdept (-55) Tdept (-48) Tdept (-44) Tdept (-44) Tdept (-27) Tdept (-4) Tdept (-21) Tdept (-25)
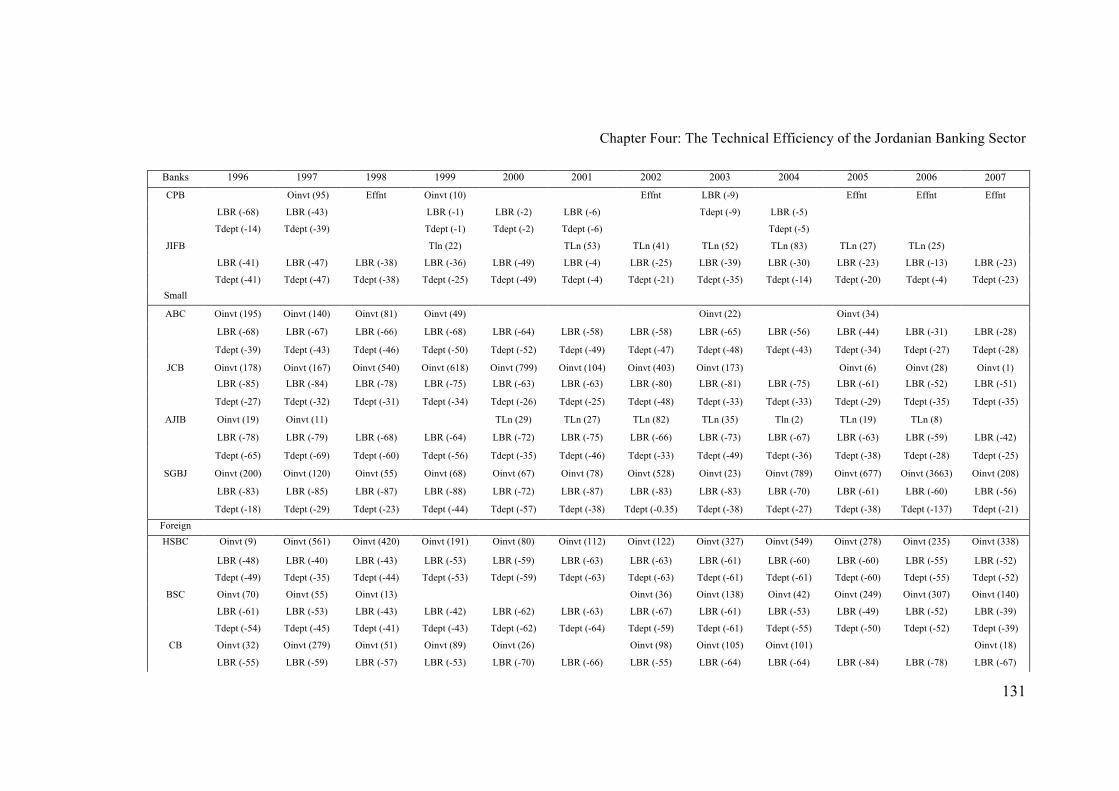
Chapter Four: The Technical Efficiency of the Jordanian Banking Sector
131
Banks 1996 1997 1998 1999 2000 2001 2002 2003 2004 2005 2006 2007
CPB Oinvt (95) Effnt Oinvt (10) Effnt LBR (-9) Effnt Effnt Effnt
LBR (-68) LBR (-43) LBR (-1) LBR (-2) LBR (-6) Tdept (-9) LBR (-5)
Tdept (-14) Tdept (-39) Tdept (-1) Tdept (-2) Tdept (-6) Tdept (-5)
JIFB Tln (22) TLn (53) TLn (41) TLn (52) TLn (83) TLn (27) TLn (25)
LBR (-41) LBR (-47) LBR (-38) LBR (-36) LBR (-49) LBR (-4) LBR (-25) LBR (-39) LBR (-30) LBR (-23) LBR (-13) LBR (-23)
Tdept (-41) Tdept (-47) Tdept (-38) Tdept (-25) Tdept (-49) Tdept (-4) Tdept (-21) Tdept (-35) Tdept (-14) Tdept (-20) Tdept (-4) Tdept (-23)
Small
ABC Oinvt (195) Oinvt (140) Oinvt (81) Oinvt (49) Oinvt (22) Oinvt (34)
LBR (-68) LBR (-67) LBR (-66) LBR (-68) LBR (-64) LBR (-58) LBR (-58) LBR (-65) LBR (-56) LBR (-44) LBR (-31) LBR (-28)
Tdept (-39) Tdept (-43) Tdept (-46) Tdept (-50) Tdept (-52) Tdept (-49) Tdept (-47) Tdept (-48) Tdept (-43) Tdept (-34) Tdept (-27) Tdept (-28)
JCB Oinvt (178) Oinvt (167) Oinvt (540) Oinvt (618) Oinvt (799) Oinvt (104) Oinvt (403) Oinvt (173) Oinvt (6) Oinvt (28) Oinvt (1)
LBR (-85) LBR (-84) LBR (-78) LBR (-75) LBR (-63) LBR (-63) LBR (-80) LBR (-81) LBR (-75) LBR (-61) LBR (-52) LBR (-51)
Tdept (-27) Tdept (-32) Tdept (-31) Tdept (-34) Tdept (-26) Tdept (-25) Tdept (-48) Tdept (-33) Tdept (-33) Tdept (-29) Tdept (-35) Tdept (-35)
AJIB Oinvt (19) Oinvt (11) TLn (29) TLn (27) TLn (82) TLn (35) Tln (2) TLn (19) TLn (8)
LBR (-78) LBR (-79) LBR (-68) LBR (-64) LBR (-72) LBR (-75) LBR (-66) LBR (-73) LBR (-67) LBR (-63) LBR (-59) LBR (-42)
Tdept (-65) Tdept (-69) Tdept (-60) Tdept (-56) Tdept (-35) Tdept (-46) Tdept (-33) Tdept (-49) Tdept (-36) Tdept (-38) Tdept (-28) Tdept (-25)
SGBJ Oinvt (200) Oinvt (120) Oinvt (55) Oinvt (68) Oinvt (67) Oinvt (78) Oinvt (528) Oinvt (23) Oinvt (789) Oinvt (677) Oinvt (3663) Oinvt (208)
LBR (-83) LBR (-85) LBR (-87) LBR (-88) LBR (-72) LBR (-87) LBR (-83) LBR (-83) LBR (-70) LBR (-61) LBR (-60) LBR (-56)
Tdept (-18) Tdept (-29) Tdept (-23) Tdept (-44) Tdept (-57) Tdept (-38) Tdept (-0.35) Tdept (-38) Tdept (-27) Tdept (-38) Tdept (-137) Tdept (-21)
Foreign
HSBC Oinvt (9) Oinvt (561) Oinvt (420) Oinvt (191) Oinvt (80) Oinvt (112) Oinvt (122) Oinvt (327) Oinvt (549) Oinvt (278) Oinvt (235) Oinvt (338)
LBR (-48) LBR (-40) LBR (-43) LBR (-53) LBR (-59) LBR (-63) LBR (-63) LBR (-61) LBR (-60) LBR (-60) LBR (-55) LBR (-52)
Tdept (-49) Tdept (-35) Tdept (-44) Tdept (-53) Tdept (-59) Tdept (-63) Tdept (-63) Tdept (-61) Tdept (-61) Tdept (-60) Tdept (-55) Tdept (-52)
BSC Oinvt (70) Oinvt (55) Oinvt (13) Oinvt (36) Oinvt (138) Oinvt (42) Oinvt (249) Oinvt (307) Oinvt (140)
LBR (-61) LBR (-53) LBR (-43) LBR (-42) LBR (-62) LBR (-63) LBR (-67) LBR (-61) LBR (-53) LBR (-49) LBR (-52) LBR (-39)
Tdept (-54) Tdept (-45) Tdept (-41) Tdept (-43) Tdept (-62) Tdept (-64) Tdept (-59) Tdept (-61) Tdept (-55) Tdept (-50) Tdept (-52) Tdept (-39)
CB Oinvt (32) Oinvt (279) Oinvt (51) Oinvt (89) Oinvt (26) Oinvt (98) Oinvt (105) Oinvt (101) Oinvt (18)
LBR (-55) LBR (-59) LBR (-57) LBR (-53) LBR (-70) LBR (-66) LBR (-55) LBR (-64) LBR (-64) LBR (-84) LBR (-78) LBR (-67)

Chapter Four: The Technical Efficiency of the Jordanian Banking Sector
132
Banks 1996 1997 1998 1999 2000 2001 2002 2003 2004 2005 2006 2007
Tdept (-57) Tdept (-60) Tdept (-57) Tdept (-53) Tdept (-70) Tdept (-66) Tdept (-56) Tdept (-64) Tdept (-66) Tdept (-84) Tdept (-79) Tdept (-68)
Source: author’s calculations.
Note: LBR: Labour, Tdept: Total Deposit, Oinvt: Other Investment, TLn: Total Loan Effnt: Fully Efficient banks. The numbers in parentheses are percentage
potential improvement: -ve for input contraction and +ve for output expansion.
Chapter Four: The Technical Efficiency of the Jordanian Banking Sector
133
4.6 Conclusions
This chapter has used DEA to examine technical efficiency in domestic and foreign
banks in Jordan during the entire deregulated period of 1996 to 2007. The results
were obtained by running an input-oriented DEA model to construct a grand frontier
that envelops all the input-output observations for all banks. In addition, estimates of
technical efficiency were divided into the product of pure technical efficiency and
scale efficiency. To the best of our knowledge, this is the first study that provides
estimates for both domestic and foreign banks over the entire deregulated period in
Jordan.
The empirical results reveal several interesting points. The average technical
efficiency for all banks is found to be 79.2%. This implies that inputs can be reduced
by 20.8% on average, relative to the best-practice banks during the sample period.
The Arab bank, one of the large banks, performed at the highest level of technical
efficiency (90%) during the sample period. Small banks were found to be more
efficient than medium sized banks, and foreign banks showed the lowest technical
efficiency, indicating a large scope for cost reduction.
The study reveals that only one bank, on average, was operating at MPSS exceptions
throughout the full time of the study. During 1997, 2001, 2002, 2004, 2006 and
2007, two banks operated at MPSS; in 2000 no bank did so. The number of banks

Chapter Four: The Technical Efficiency of the Jordanian Banking Sector
134
operating at IRS declined from 15 in 1996 to six banks in 2007, and most of the large
banks operated at DRS over the entire period. This indicates that large banks can
reduce the size of their operations to achieve efficiency improvements. On the other
hand, most small-sized banks operated at IRS over the sample period, indicating that
they should increase the size of their operations to reach optimal scale efficiency.
The study reveals that banks can be efficient at different sizes. This result is
consistent with banking studies conducted elsewhere (see, for example, Kourouche
(2008); Maghyereh (2004); Berg et al. (1991) for Australian, Jordanian, and
Norwegian Banks, respectively).
The banking sector as a whole has shown improvements in technical efficiency at an
average rate of 0.37% per year over the study period. This seems to be due to
substantial improvements in pure technical efficiency (0.64% per year). The
improvement in technical efficiency would have been higher had there been no
decline in scale efficiencies.
This DEA analysis also provides insights into the input-output inefficiencies
experienced by Jordanian banks during the sample period. The results suggest that
number of staff and total deposits are the most common sources of inefficiency.
Banks need to use deposits better and reduce staff to enhance efficiency.
Chapter Four: The Technical Efficiency of the Jordanian Banking Sector
135
The analysis of technical efficiency conducted in this chapter is based on two
assumptions: first that there are no allocative inefficiencies in the banking sector, and
second that the frontier remains the same throughout the sample period. The first
assumption was guided by the international literature, which suggested that allocative
inefficiency is negligible over a short sample period. This assumption is dropped in
the next chapter, which focuses on overall (cost) efficiency, which is the product of
technical and allocative efficiencies. The assumption of the same frontier over the
sample period enables a comparison of the estimates of technical efficiencies across
times and banks.
CHAPTER 5
Cost Efficiency in the Jordanian Banking Sector
5.1. Introduction
The previous chapter investigated the technical efficiency of banks using DEA,
assuming the absence of allocative efficiency. This chapter makes use of input
prices, which permit an investigation of cost efficiency and its decomposition into
allocative efficiency and technical efficiency. The empirical results for cost
efficiency are obtained by running an input-oriented DEA model, using the software
package DEAP Version 2.1 (Coelli, 1996).
A discussion of the concept of cost efficiency and its decomposition and estimation
using input oriented DEA model appears in Section 5.2. Data on two inputs and two
outputs for measuring technical efficiency in the previous chapter are used.
Measuring cost efficiency requires additional data on input prices. Section 5.3
discusses these data and presents a detailed analysis of cost efficiency for 17
Jordanian banks for the period 1996–2007. Section 5.4 summarises and brings
together the conclusions.
5.2 Cost Efficiency: Concept and Measurement
The previous chapter recorded the measurement and analysis of technical efficiency
(TE) and its components, PTE and SE, for the banking sector in Jordan by running an

Chapter Five: Cost Efficiency in the Jordanian Banking Sector
137
input-oriented DEA model. The technical efficiency of a production unit is defined
by the relationship between the optimal and observed levels of inputs and outputs. In
the input-oriented DEA model, as shown in previous chapter, the existence of
technical inefficiency means that some inputs can be reduced without affecting the
level of output. It was implicitly assumed in that chapter that the bank, given input
prices, allocates resources in such a way that costs of production are minimised. This
assumption may not hold. If input prices are taken into account, results for the other
important efficiency concept can be obtained. This concept is cost efficiency (CE),
which may be reached when the banks find a combination of inputs that enables
them to produce the desired outputs at minimum cost. CE is the product of technical
and allocative efficiencies. Allocative efficiency (AE) refers to the selection of inputs
to produce a certain level of outputs at a certain level of input prices, where the cost
of production is minimum (Al-Ani & Al-Delaimi, 2006). CE is defined as the ratio of
minimum (optimum) cost to the observed cost for producing a level of output by a
firm. Thus, if the cost efficiency score for a firm is 0.75, the firm is using only 75%
of its resources efficiently: in other words, the firm wastes 25% of its costs relative to
the best-practice firm (Berger & Mester, 1997).
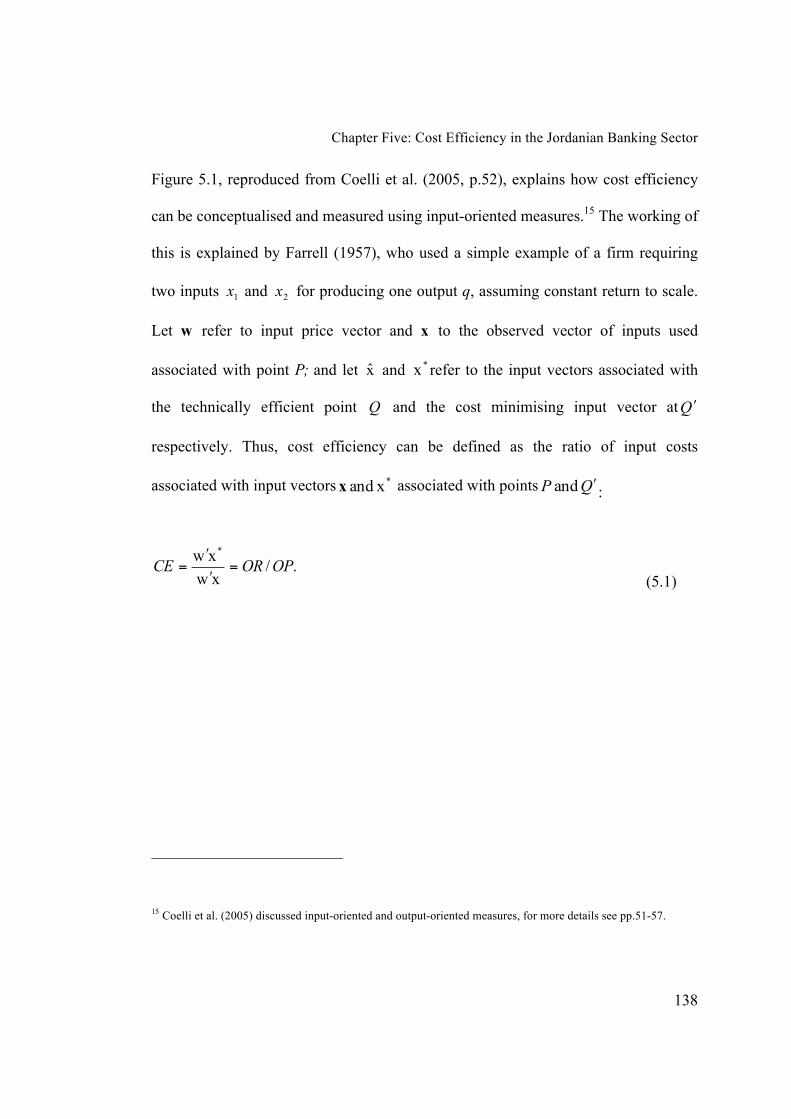
Chapter Five: Cost Efficiency in the Jordanian Banking Sector
138
Figure 5.1, reproduced from Coelli et al. (2005, p.52), explains how cost efficiency
can be conceptualised and measured using input-oriented measures.15
The working of
this is explained by Farrell (1957), who used a simple example of a firm requiring
two inputs 1x and
2x for producing one output q, assuming constant return to scale.
Let w refer to input price vector and x to the observed vector of inputs used
associated with point P; and let x̂ and *x refer to the input vectors associated with
the technically efficient point Q and the cost minimising input vector atQ′
respectively. Thus, cost efficiency can be defined as the ratio of input costs
associated with input vectors * xand x associated with points QP ′ and :
./xw
xw*
OPORCE =′
′=
(5.1)
15 Coelli et al. (2005) discussed input-oriented and output-oriented measures, for more details see pp.51-57.
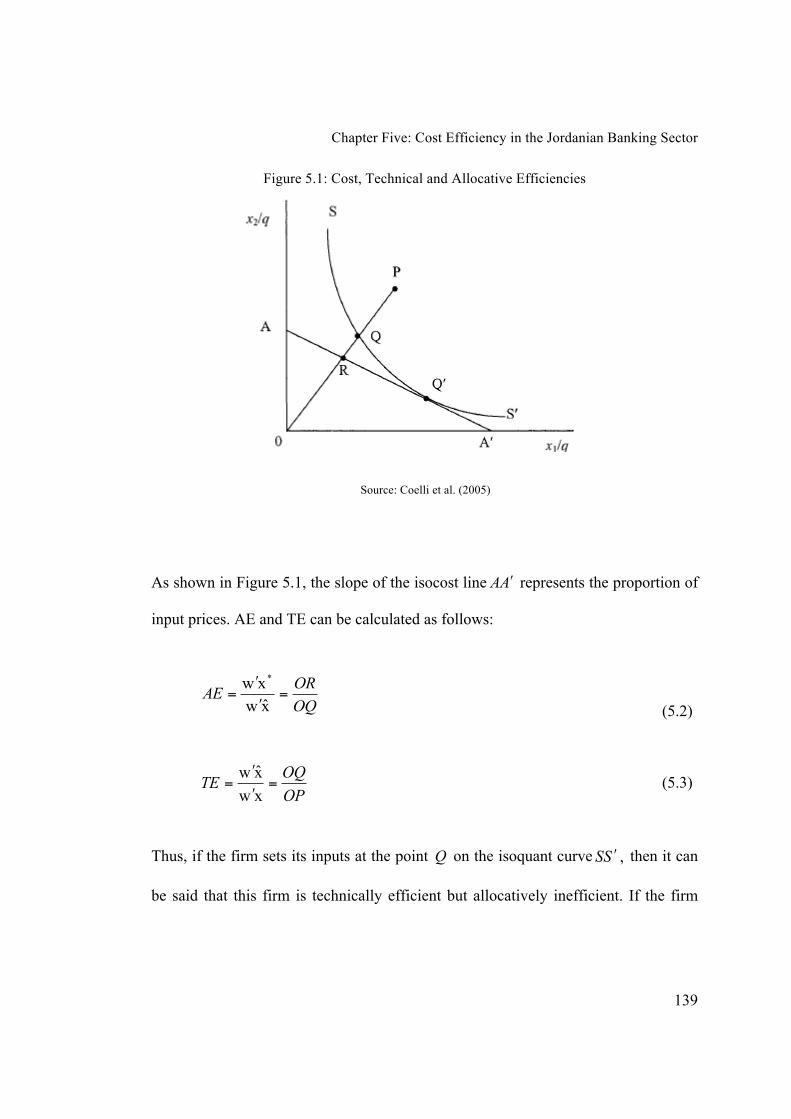
Chapter Five: Cost Efficiency in the Jordanian Banking Sector
139
Figure 5.1: Cost, Technical and Allocative Efficiencies
Source: Coelli et al. (2005)
As shown in Figure 5.1, the slope of the isocost line AA ′ represents the proportion of
input prices. AE and TE can be calculated as follows:
OQ
ORAE =
′
′=
x̂w
xw*
(5.2)
OP
OQTE =
′
′=
xw
x̂w (5.3)
Thus, if the firm sets its inputs at the point Q on the isoquant curve , SS ′ then it can
be said that this firm is technically efficient but allocatively inefficient. If the firm

Chapter Five: Cost Efficiency in the Jordanian Banking Sector
140
wishes to be technically and allocatively efficient it should reduce the production
cost represented by the distance , RQ which would occur at the allocatively (and
technically) efficient pointQ′, instead of at the technically efficient but allocatively
inefficient point .Q
It follows from this that cost efficiency can be expressed as the product of technical
and allocative efficiency measures:
.)/()/()/( CEOPOROQOROPOQAETE ==×=× (5.4)
DEA efficiency scores assign numerical values (between 0 and 1 or 0 and 100%) to
the cost efficiency level of a DMU relative to others. Cost efficiency (CE) of one
represents a fully cost efficient bank; (1-CE) represents the amount by which the
bank could reduce its costs and still produce at least the same amount of output.
To measure CE, two sets of linear programs are required, one to measure technical
efficiency and the other to measure cost efficiency. The cost efficiency is also often
called economic efficiency. A discussion on required linear programming is provided
in Coelli et al. (2005, p.184).
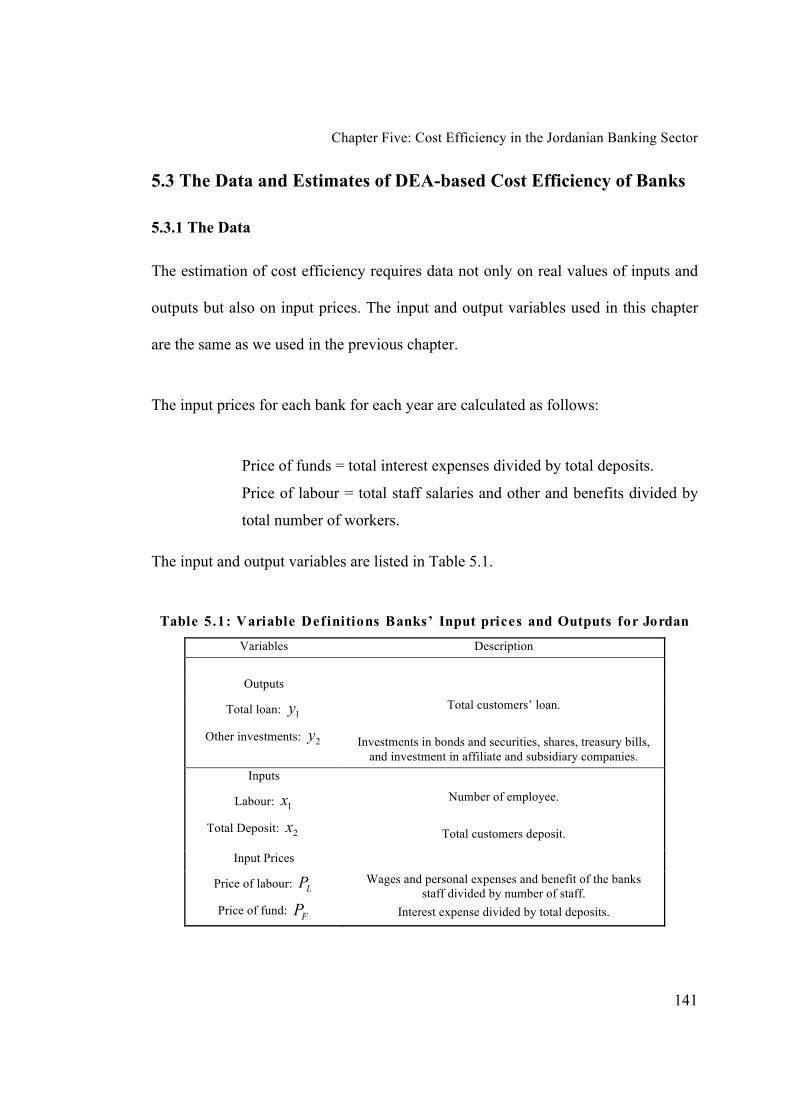
Chapter Five: Cost Efficiency in the Jordanian Banking Sector
141
5.3 The Data and Estimates of DEA-based Cost Efficiency of Banks
5.3.1 The Data
The estimation of cost efficiency requires data not only on real values of inputs and
outputs but also on input prices. The input and output variables used in this chapter
are the same as we used in the previous chapter.
The input prices for each bank for each year are calculated as follows:
Price of funds = total interest expenses divided by total deposits.
Price of labour = total staff salaries and other and benefits divided by
total number of workers.
The input and output variables are listed in Table 5.1.
Table 5.1: Variable Definitions Banks’ Input prices and Outputs for Jordan
Variables Description
Outputs
Total loan: 1y
Other investments: 2y
Total customers’ loan.
Investments in bonds and securities, shares, treasury bills,
and investment in affiliate and subsidiary companies.
Inputs
Labour: 1x
Total Deposit: 2x
Number of employee.
Total customers deposit.
Input Prices
Price of labour: LP
Price of fund: FP
Wages and personal expenses and benefit of the banks
staff divided by number of staff.
Interest expense divided by total deposits.
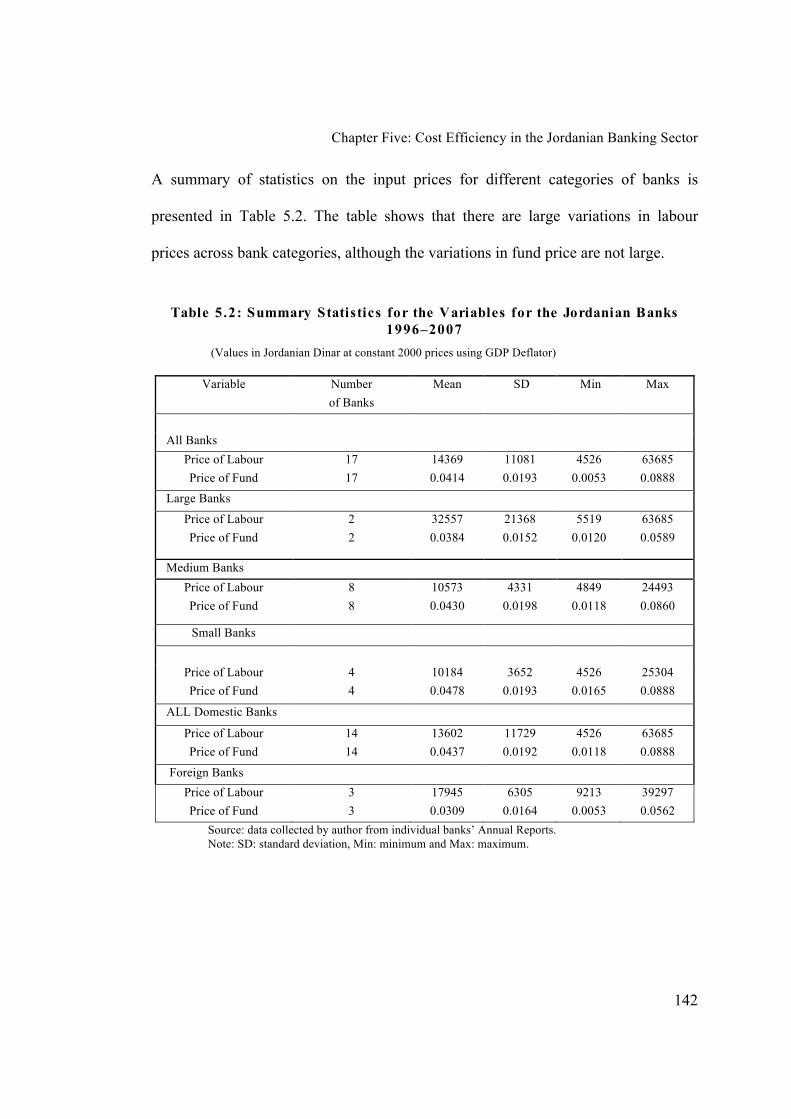
Chapter Five: Cost Efficiency in the Jordanian Banking Sector
142
A summary of statistics on the input prices for different categories of banks is
presented in Table 5.2. The table shows that there are large variations in labour
prices across bank categories, although the variations in fund price are not large.
Table 5.2: Summary Statistics for the Variables for the Jordanian Banks
1996–2007
(Values in Jordanian Dinar at constant 2000 prices using GDP Deflator)
Variable Number
of Banks
Mean SD Min Max
All Banks
Price of Labour
Price of Fund
17
17
14369
0.0414
11081
0.0193
4526
0.0053
63685
0.0888
Large Banks
Price of Labour
Price of Fund
2
2
32557
0.0384
21368
0.0152
5519
0.0120
63685
0.0589
Medium Banks
Price of Labour
Price of Fund
8
8
10573
0.0430
4331
0.0198
4849
0.0118
24493
0.0860
Small Banks
Price of Labour
Price of Fund
4
4
10184
0.0478
3652
0.0193
4526
0.0165
25304
0.0888
ALL Domestic Banks
Price of Labour
Price of Fund
14
14
13602
0.0437
11729
0.0192
4526
0.0118
63685
0.0888
Foreign Banks
Price of Labour
Price of Fund
3
3
17945
0.0309
6305
0.0164
9213
0.0053
39297
0.0562
Source: data collected by author from individual banks’ Annual Reports.
Note: SD: standard deviation, Min: minimum and Max: maximum.

Chapter Five: Cost Efficiency in the Jordanian Banking Sector
143
5.3.2. Empirical Results on Cost Efficiency
The estimates of cost efficiency are obtained by running an input-oriented DEA
model using the software package, DEAP Version 2.1 (Coelli, 1996).
Summary statistics on efficiency scores are presented in Table 5.3. The average
efficiency scores are the weighted geometric means of bank-specific scores where
weights are their shares in total output. The procedure is the same that used in the
previous chapter. The table reveals that the average cost efficiency scores vary from
48.7% in 2003 to 66.5% in 2007; this suggests that the average bank in the sample
could have reduced its costs by approximately 33% to 51%, to achieve ‘best practice’
performance. Similarly, the minimal cost efficiency scores range from 23.8% in 1998
to 40.8% in 2007.
The yearly average cost efficiency scores are plotted in Figure 6.2. The average cost
efficiency shows a declining trend with some fluctuations up to 2003 and an
improvement thereafter. This implies that the latter phase of financial deregulation
has had a positive effect on the cost efficiency of banks in Jordan.
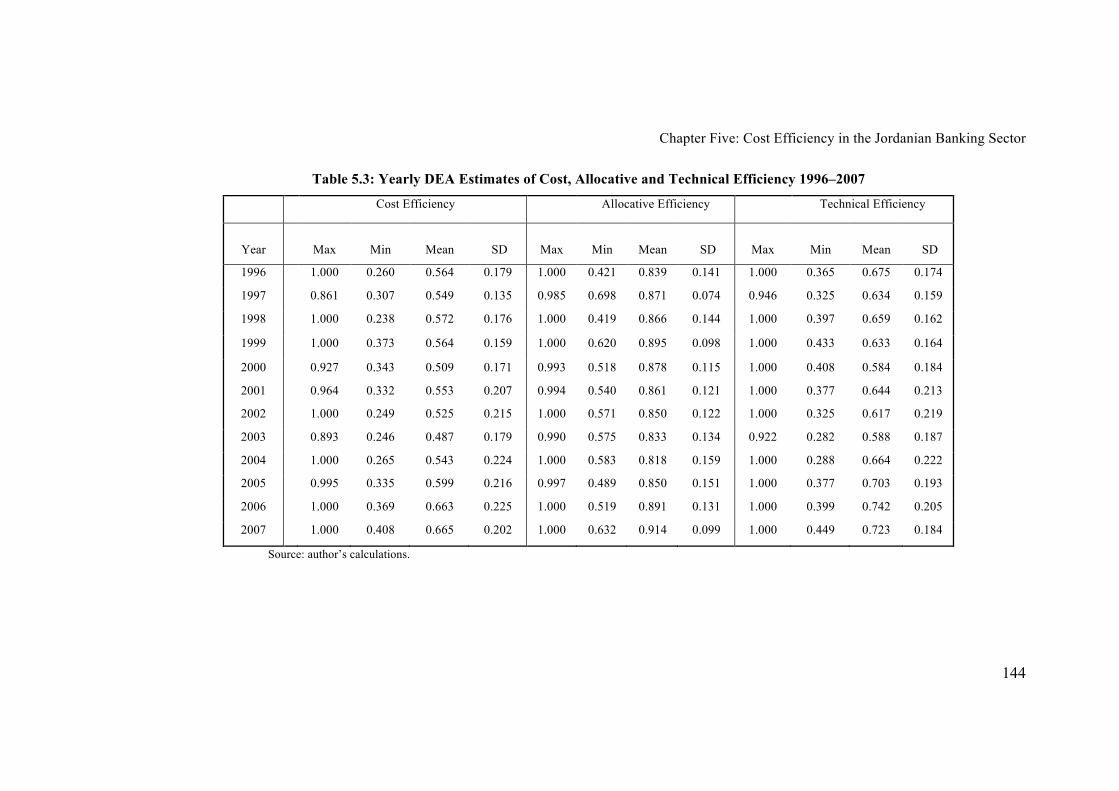
Chapter Five: Cost Efficiency in the Jordanian Banking Sector
144
Table 5.3: Yearly DEA Estimates of Cost, Allocative and Technical Efficiency 1996–2007
Cost Efficiency Allocative Efficiency Technical Efficiency
Year Max Min Mean SD Max Min Mean SD Max Min Mean SD
1996 1.000 0.260 0.564 0.179 1.000 0.421 0.839 0.141 1.000 0.365 0.675 0.174
1997 0.861 0.307 0.549 0.135 0.985 0.698 0.871 0.074 0.946 0.325 0.634 0.159
1998 1.000 0.238 0.572 0.176 1.000 0.419 0.866 0.144 1.000 0.397 0.659 0.162
1999 1.000 0.373 0.564 0.159 1.000 0.620 0.895 0.098 1.000 0.433 0.633 0.164
2000 0.927 0.343 0.509 0.171 0.993 0.518 0.878 0.115 1.000 0.408 0.584 0.184
2001 0.964 0.332 0.553 0.207 0.994 0.540 0.861 0.121 1.000 0.377 0.644 0.213
2002 1.000 0.249 0.525 0.215 1.000 0.571 0.850 0.122 1.000 0.325 0.617 0.219
2003 0.893 0.246 0.487 0.179 0.990 0.575 0.833 0.134 0.922 0.282 0.588 0.187
2004 1.000 0.265 0.543 0.224 1.000 0.583 0.818 0.159 1.000 0.288 0.664 0.222
2005 0.995 0.335 0.599 0.216 0.997 0.489 0.850 0.151 1.000 0.377 0.703 0.193
2006 1.000 0.369 0.663 0.225 1.000 0.519 0.891 0.131 1.000 0.399 0.742 0.205
2007 1.000 0.408 0.665 0.202 1.000 0.632 0.914 0.099 1.000 0.449 0.723 0.184
Source: author’s calculations.
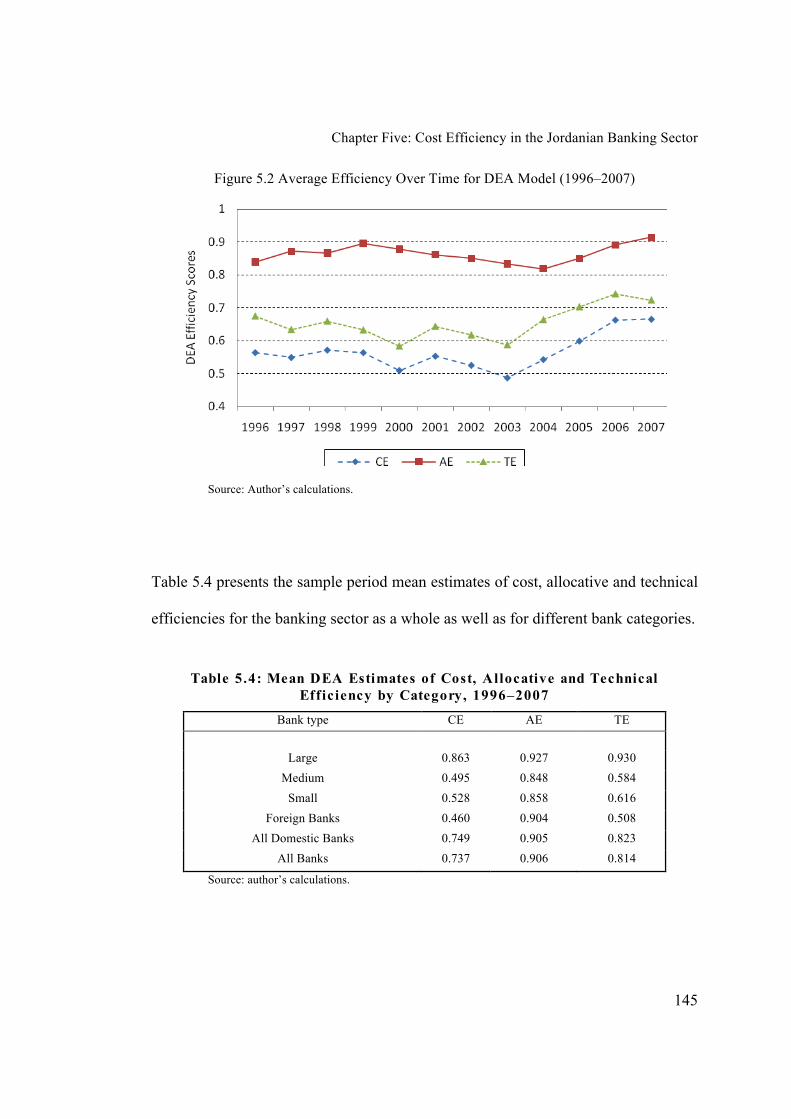
Chapter Five: Cost Efficiency in the Jordanian Banking Sector
145
Figure 5.2 Average Efficiency Over Time for DEA Model (1996–2007)
Source: Author’s calculations.
Table 5.4 presents the sample period mean estimates of cost, allocative and technical
efficiencies for the banking sector as a whole as well as for different bank categories.
Table 5.4: Mean DEA Estimates of Cost, Allocative and Technical
Efficiency by Category, 1996–2007
Bank type CE AE TE
Large 0.863 0.927 0.930
Medium 0.495 0.848 0.584
Small 0.528 0.858 0.616
Foreign Banks 0.460 0.904 0.508
All Domestic Banks 0.749 0.905 0.823
All Banks 0.737 0.906 0.814
Source: author’s calculations.
Chapter Five: Cost Efficiency in the Jordanian Banking Sector
146
The average cost efficiency of banks is 0.74, which implies that the banking sector
could reduce the cost of production by 26 percent without affecting the level of
output. This implies that banks have wasted 26 percent of resources in producing
their levels of output. The allocative efficiency is quite high (90%), consistent with
the estimates of allocative efficiency reported in studies on banking in other
countries.
The large banks were found to be most efficient in terms of cost efficiency (86%),
allocative efficiency (92.7%) and technical efficiency (93%) during the sample
period. The small banks ranked second in terms of their efficiency level. The cost
efficiency of foreign banks was much lower than that of domestic banks.
The average estimates of CE, AE and TE (weighted geometric mean over the period)
for individual banks are presented in Table 5.5. These estimates reveal that the
medium-sized bank CPB ranked first in terms of all three efficiencies; the Arab
Bank, the largest bank, ranked second and JIFB (a medium-sized bank) third. The
medium-sized banks CAB and BOS were found to be the lowest performers in cost
efficiency. It is worth noting that medium-sized banks showed wide variations in
efficiency, while the foreign banks seemed very similar in terms of their cost/
economic efficiency performance.
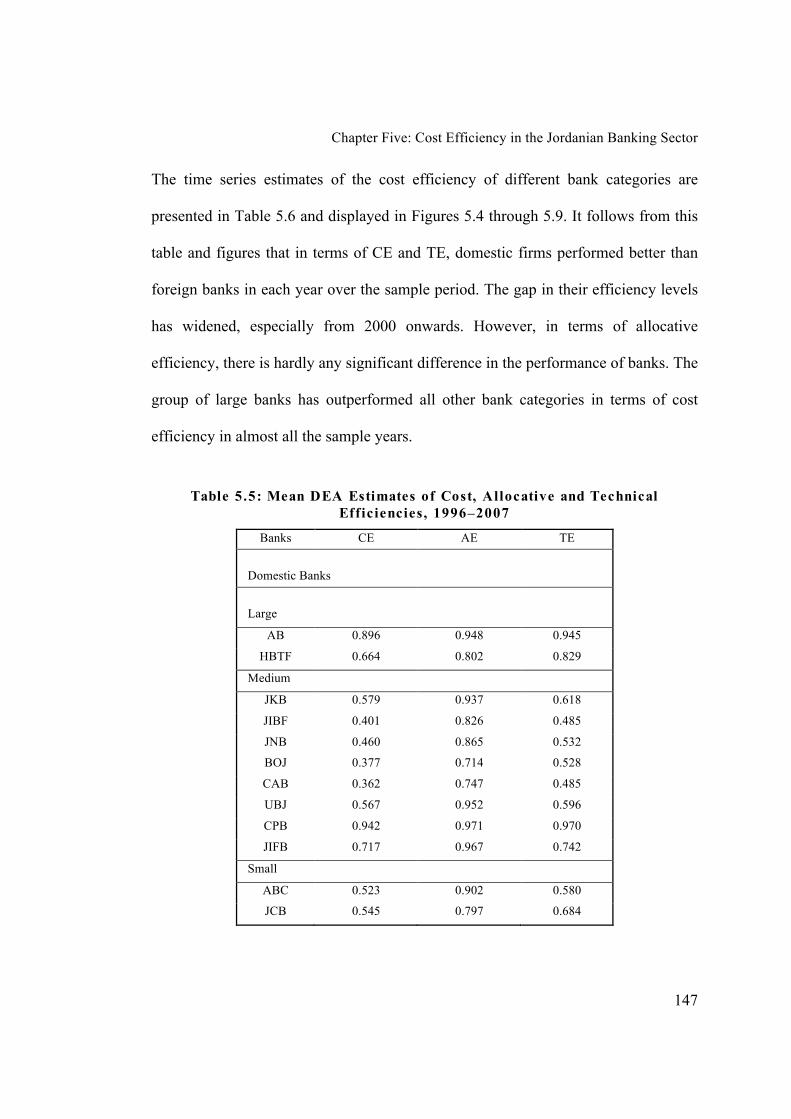
Chapter Five: Cost Efficiency in the Jordanian Banking Sector
147
The time series estimates of the cost efficiency of different bank categories are
presented in Table 5.6 and displayed in Figures 5.4 through 5.9. It follows from this
table and figures that in terms of CE and TE, domestic firms performed better than
foreign banks in each year over the sample period. The gap in their efficiency levels
has widened, especially from 2000 onwards. However, in terms of allocative
efficiency, there is hardly any significant difference in the performance of banks. The
group of large banks has outperformed all other bank categories in terms of cost
efficiency in almost all the sample years.
Table 5.5: Mean DEA Estimates of Cost, Allocative and Technical
Efficiencies, 1996–2007
Banks CE AE TE
Domestic Banks
Large
AB 0.896 0.948 0.945
HBTF 0.664 0.802 0.829
Medium
JKB 0.579 0.937 0.618
JIBF 0.401 0.826 0.485
JNB 0.460 0.865 0.532
BOJ 0.377 0.714 0.528
CAB 0.362 0.747 0.485
UBJ 0.567 0.952 0.596
CPB 0.942 0.971 0.970
JIFB 0.717 0.967 0.742
Small
ABC 0.523 0.902 0.580
JCB 0.545 0.797 0.684

Chapter Five: Cost Efficiency in the Jordanian Banking Sector
148
AJIB 0.481 0.894 0.539
SGBJ 0.561 0.791 0.709
Foreign
HSBC 0.440 0.981 0.449
BSC 0.480 0.947 0.507
CB 0.449 0.588 0.764
Source: author’s calculations.
Note: CE: cost efficiency, AE: allocative efficiency, TE: technical efficiency
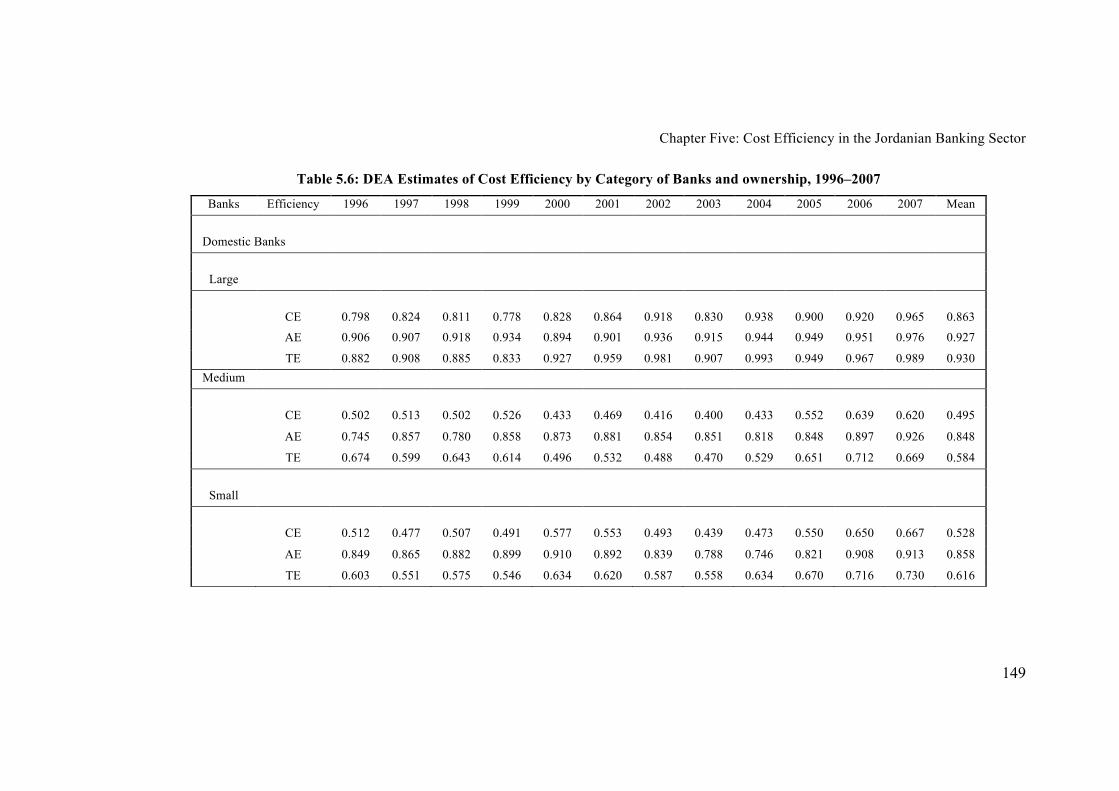
Chapter Five: Cost Efficiency in the Jordanian Banking Sector
149
Table 5.6: DEA Estimates of Cost Efficiency by Category of Banks and ownership, 1996–2007
Banks Efficiency 1996 1997 1998 1999 2000 2001 2002 2003 2004 2005 2006 2007 Mean
Domestic Banks
Large
CE 0.798 0.824 0.811 0.778 0.828 0.864 0.918 0.830 0.938 0.900 0.920 0.965 0.863
AE 0.906 0.907 0.918 0.934 0.894 0.901 0.936 0.915 0.944 0.949 0.951 0.976 0.927
TE 0.882 0.908 0.885 0.833 0.927 0.959 0.981 0.907 0.993 0.949 0.967 0.989 0.930
Medium
CE 0.502 0.513 0.502 0.526 0.433 0.469 0.416 0.400 0.433 0.552 0.639 0.620 0.495
AE 0.745 0.857 0.780 0.858 0.873 0.881 0.854 0.851 0.818 0.848 0.897 0.926 0.848
TE 0.674 0.599 0.643 0.614 0.496 0.532 0.488 0.470 0.529 0.651 0.712 0.669 0.584
Small
CE 0.512 0.477 0.507 0.491 0.577 0.553 0.493 0.439 0.473 0.550 0.650 0.667 0.528
AE 0.849 0.865 0.882 0.899 0.910 0.892 0.839 0.788 0.746 0.821 0.908 0.913 0.858
TE 0.603 0.551 0.575 0.546 0.634 0.620 0.587 0.558 0.634 0.670 0.716 0.730 0.616
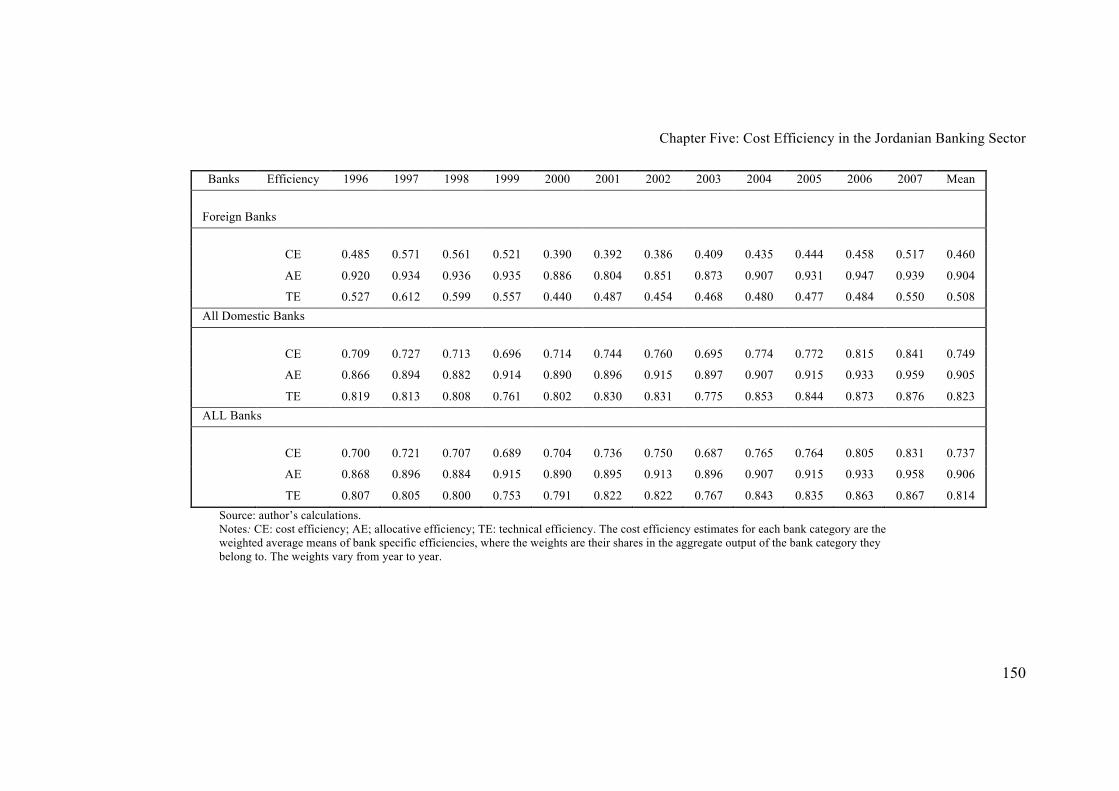
Chapter Five: Cost Efficiency in the Jordanian Banking Sector
150
Banks Efficiency 1996 1997 1998 1999 2000 2001 2002 2003 2004 2005 2006 2007 Mean
Foreign Banks
CE 0.485 0.571 0.561 0.521 0.390 0.392 0.386 0.409 0.435 0.444 0.458 0.517 0.460
AE 0.920 0.934 0.936 0.935 0.886 0.804 0.851 0.873 0.907 0.931 0.947 0.939 0.904
TE 0.527 0.612 0.599 0.557 0.440 0.487 0.454 0.468 0.480 0.477 0.484 0.550 0.508
All Domestic Banks
CE 0.709 0.727 0.713 0.696 0.714 0.744 0.760 0.695 0.774 0.772 0.815 0.841 0.749
AE 0.866 0.894 0.882 0.914 0.890 0.896 0.915 0.897 0.907 0.915 0.933 0.959 0.905
TE 0.819 0.813 0.808 0.761 0.802 0.830 0.831 0.775 0.853 0.844 0.873 0.876 0.823
ALL Banks
CE 0.700 0.721 0.707 0.689 0.704 0.736 0.750 0.687 0.765 0.764 0.805 0.831 0.737
AE 0.868 0.896 0.884 0.915 0.890 0.895 0.913 0.896 0.907 0.915 0.933 0.958 0.906
TE 0.807 0.805 0.800 0.753 0.791 0.822 0.822 0.767 0.843 0.835 0.863 0.867 0.814
Source: author’s calculations.
Notes: CE: cost efficiency; AE; allocative efficiency; TE: technical efficiency. The cost efficiency estimates for each bank category are the
weighted average means of bank specific efficiencies, where the weights are their shares in the aggregate output of the bank category they
belong to. The weights vary from year to year.

Chapter Five: Cost Efficiency in the Jordanian Banking Sector
151
The annual estimates of cost efficiency scores and the components for each bank,
presented in Table 5.7, show yearly fluctuations in cost efficiency over the
deregulation era from 1996 until 2007. Despite annual fluctuations, most estimates of
cost efficiency reveal an improvement after 2003, revealing that banking
deregulation had a positive impact on efficiency in the latter phase of deregulation.
Table 5.7: DEA Estimates of Cost Efficiency for Domestic and Foreign
Banks, 1996–2007
Bank Cost Efficiency 1996 1997 1998 1999 2000 2001 2002
Large
AB CE 0.827 0.861 0.840 0.799 0.854 0.878 0.953
AE 0.910 0.910 0.923 0.939 0.896 0.914 0.964
TE 0.909 0.946 0.911 0.851 0.953 0.960 0.989
HBTF CE 0.637 0.608 0.637 0.641 0.625 0.758 0.662
AE 0.879 0.888 0.882 0.902 0.872 0.799 0.727
TE 0.725 0.684 0.723 0.711 0.717 0.948 0.911
Medium
JKB CE 0.522 0.530 0.474 0.446 0.437 0.491 0.488
AE 0.877 0.883 0.900 0.909 0.944 0.952 0.935
TE 0.595 0.600 0.526 0.491 0.463 0.516 0.522
JIBF CE 0.712 0.684 0.595 0.564 0.371 0.350 0.249
AE 0.827 0.816 0.809 0.775 0.731 0.715 0.765
TE 0.861 0.838 0.736 0.728 0.508 0.489 0.325
JNB CE 0.563 0.558 0.681 0.602 0.458 0.428 0.359
AE 0.753 0.883 0.868 0.871 0.943 0.952 0.889
TE 0.748 0.632 0.784 0.691 0.486 0.450 0.404
BOJ CE 0.260 0.392 0.238 0.461 0.394 0.399 0.385
AE 0.421 0.819 0.419 0.816 0.818 0.785 0.786
TE 0.617 0.479 0.568 0.566 0.482 0.508 0.490
CAB CE 0.428 0.359 0.422 0.373 0.343 0.332 0.319
AE 0.822 0.864 0.838 0.851 0.821 0.836 0.728
TE 0.521 0.415 0.503 0.438 0.417 0.397 0.439
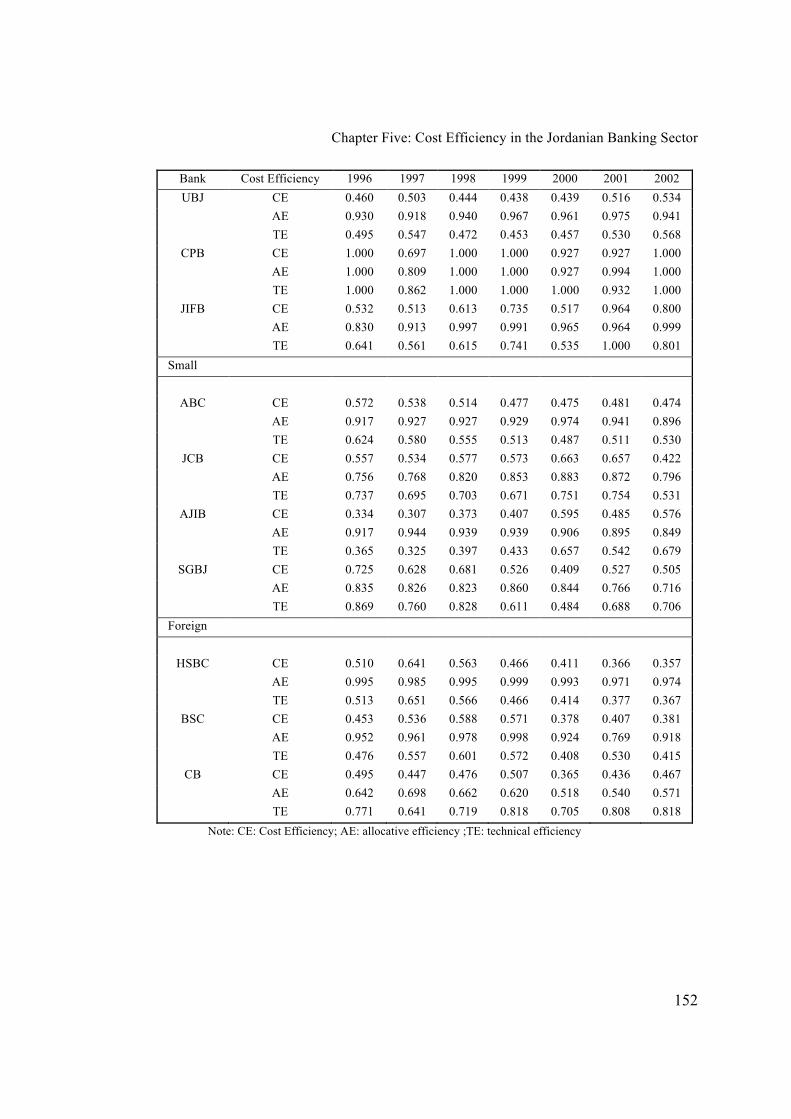
Chapter Five: Cost Efficiency in the Jordanian Banking Sector
152
Bank Cost Efficiency 1996 1997 1998 1999 2000 2001 2002
UBJ CE 0.460 0.503 0.444 0.438 0.439 0.516 0.534
AE 0.930 0.918 0.940 0.967 0.961 0.975 0.941
TE 0.495 0.547 0.472 0.453 0.457 0.530 0.568
CPB CE 1.000 0.697 1.000 1.000 0.927 0.927 1.000
AE 1.000 0.809 1.000 1.000 0.927 0.994 1.000
TE 1.000 0.862 1.000 1.000 1.000 0.932 1.000
JIFB CE 0.532 0.513 0.613 0.735 0.517 0.964 0.800
AE 0.830 0.913 0.997 0.991 0.965 0.964 0.999
TE 0.641 0.561 0.615 0.741 0.535 1.000 0.801
Small
ABC CE 0.572 0.538 0.514 0.477 0.475 0.481 0.474
AE 0.917 0.927 0.927 0.929 0.974 0.941 0.896
TE 0.624 0.580 0.555 0.513 0.487 0.511 0.530
JCB CE 0.557 0.534 0.577 0.573 0.663 0.657 0.422
AE 0.756 0.768 0.820 0.853 0.883 0.872 0.796
TE 0.737 0.695 0.703 0.671 0.751 0.754 0.531
AJIB CE 0.334 0.307 0.373 0.407 0.595 0.485 0.576
AE 0.917 0.944 0.939 0.939 0.906 0.895 0.849
TE 0.365 0.325 0.397 0.433 0.657 0.542 0.679
SGBJ CE 0.725 0.628 0.681 0.526 0.409 0.527 0.505
AE 0.835 0.826 0.823 0.860 0.844 0.766 0.716
TE 0.869 0.760 0.828 0.611 0.484 0.688 0.706
Foreign
HSBC CE 0.510 0.641 0.563 0.466 0.411 0.366 0.357
AE 0.995 0.985 0.995 0.999 0.993 0.971 0.974
TE 0.513 0.651 0.566 0.466 0.414 0.377 0.367
BSC CE 0.453 0.536 0.588 0.571 0.378 0.407 0.381
AE 0.952 0.961 0.978 0.998 0.924 0.769 0.918
TE 0.476 0.557 0.601 0.572 0.408 0.530 0.415
CB CE 0.495 0.447 0.476 0.507 0.365 0.436 0.467
AE 0.642 0.698 0.662 0.620 0.518 0.540 0.571
TE 0.771 0.641 0.719 0.818 0.705 0.808 0.818
Note: CE: Cost Efficiency; AE: allocative efficiency ;TE: technical efficiency

Chapter Five: Cost Efficiency in the Jordanian Banking Sector
153
Table 5.7 (Continued): DEA Estimates of Cost Efficiency for Domestic and
Foreign Banks, 1996–2007
Bank Cost
Efficiency
2003 2004 2005 2006 2007 Mean
Large
AB CE 0.877 1.000 0.947 0.942 1.000 0.896
AE 0.951 1.000 0.997 0.981 1.000 0.948
TE 0.922 1.000 0.950 0.960 1.000 0.945
HBTF CE 0.527 0.603 0.693 0.826 0.815 0.664
AE 0.665 0.636 0.736 0.826 0.870 0.802
TE 0.793 0.949 0.942 1.000 0.937 0.829
Medium
JKB CE 0.519 0.592 0.826 1.000 0.912 0.579
AE 0.936 0.953 0.992 1.000 0.967 0.937
TE 0.555 0.621 0.833 1.000 0.944 0.618
JIBF CE 0.246 0.265 0.335 0.369 0.408 0.401
AE 0.874 0.922 0.888 0.924 0.907 0.826
TE 0.282 0.288 0.377 0.399 0.449 0.485
JNB CE 0.361 0.329 0.387 0.451 0.477 0.460
AE 0.888 0.856 0.795 0.801 0.901 0.865
TE 0.406 0.384 0.487 0.563 0.529 0.532
BOJ CE 0.359 0.353 0.418 0.494 0.464 0.377
AE 0.714 0.633 0.792 0.869 0.941 0.714
TE 0.503 0.558 0.527 0.569 0.493 0.528
CAB CE 0.261 0.266 0.422 0.454 0.438 0.362
AE 0.689 0.583 0.590 0.683 0.741 0.747
TE 0.379 0.456 0.714 0.665 0.591 0.485
UBJ CE 0.526 0.710 0.859 0.828 0.765 0.567
AE 0.945 0.913 0.950 0.998 0.995 0.952
TE 0.557 0.778 0.904 0.830 0.768 0.596
CPB CE 0.893 0.947 0.995 0.974 1.000 0.942
AE 0.985 0.989 0.995 0.974 1.000 0.971
TE 0.907 0.957 1.000 1.000 1.000 0.970
JIFB CE 0.649 0.861 0.828 1.000 0.814 0.717
AE 0.990 0.974 0.995 1.000 0.998 0.967
TE 0.656 0.884 0.832 1.000 0.816 0.742
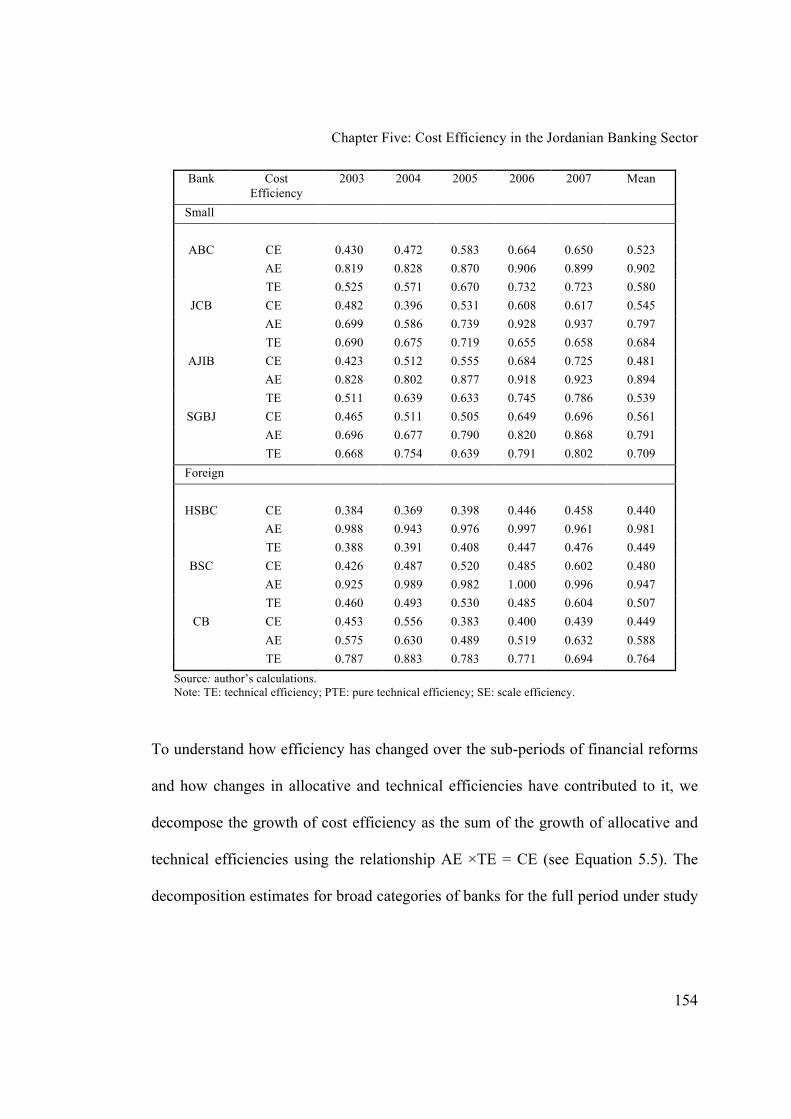
Chapter Five: Cost Efficiency in the Jordanian Banking Sector
154
Bank Cost
Efficiency
2003 2004 2005 2006 2007 Mean
Small
ABC CE 0.430 0.472 0.583 0.664 0.650 0.523
AE 0.819 0.828 0.870 0.906 0.899 0.902
TE 0.525 0.571 0.670 0.732 0.723 0.580
JCB CE 0.482 0.396 0.531 0.608 0.617 0.545
AE 0.699 0.586 0.739 0.928 0.937 0.797
TE 0.690 0.675 0.719 0.655 0.658 0.684
AJIB CE 0.423 0.512 0.555 0.684 0.725 0.481
AE 0.828 0.802 0.877 0.918 0.923 0.894
TE 0.511 0.639 0.633 0.745 0.786 0.539
SGBJ CE 0.465 0.511 0.505 0.649 0.696 0.561
AE 0.696 0.677 0.790 0.820 0.868 0.791
TE 0.668 0.754 0.639 0.791 0.802 0.709
Foreign
HSBC CE 0.384 0.369 0.398 0.446 0.458 0.440
AE 0.988 0.943 0.976 0.997 0.961 0.981
TE 0.388 0.391 0.408 0.447 0.476 0.449
BSC CE 0.426 0.487 0.520 0.485 0.602 0.480
AE 0.925 0.989 0.982 1.000 0.996 0.947
TE 0.460 0.493 0.530 0.485 0.604 0.507
CB CE 0.453 0.556 0.383 0.400 0.439 0.449
AE 0.575 0.630 0.489 0.519 0.632 0.588
TE 0.787 0.883 0.783 0.771 0.694 0.764
Source: author’s calculations.
Note: TE: technical efficiency; PTE: pure technical efficiency; SE: scale efficiency.
To understand how efficiency has changed over the sub-periods of financial reforms
and how changes in allocative and technical efficiencies have contributed to it, we
decompose the growth of cost efficiency as the sum of the growth of allocative and
technical efficiencies using the relationship AE ×TE = CE (see Equation 5.5). The
decomposition estimates for broad categories of banks for the full period under study

Chapter Five: Cost Efficiency in the Jordanian Banking Sector
155
as well as three sub-periods 1996–99, 1999–03 and 2003–07, are presented in Table
5.8. These sub-periods constitute the early, medium and latter phases of financial
deregulation/ reform in Jordanian economy.
+
=
−−− )1(
)(
)1(
)(
)1(
)( lnlnlnt
t
tVRS
tVRS
tCRS
tCRS
TE
TE
AE
AE
CE
CE
(5.5)
As Table 5.8 shows, the banking sector as a whole experienced a decline in cost
efficiency at the rate of 0.54 and 0.06 % per annum respectively in the early and
middle phases of financial deregulation. In the latter phase, cost efficiency increased
at the rate of 4.73 % per annum, two thirds of this improvement from an
improvement in technical efficiency. Over the entire sample period, cost efficiency
increased at the rate of 1.55% per annum; the improvement in allocative efficiency
contributed about 60% of this figure.
In the early phase of deregulation, all bank categories except foreign banks showed
deterioration in cost efficiency. However, in the latter phase, 2003–2007, small,
medium and foreign banks showed large improvements in cost, allocative and
technical efficiencies.
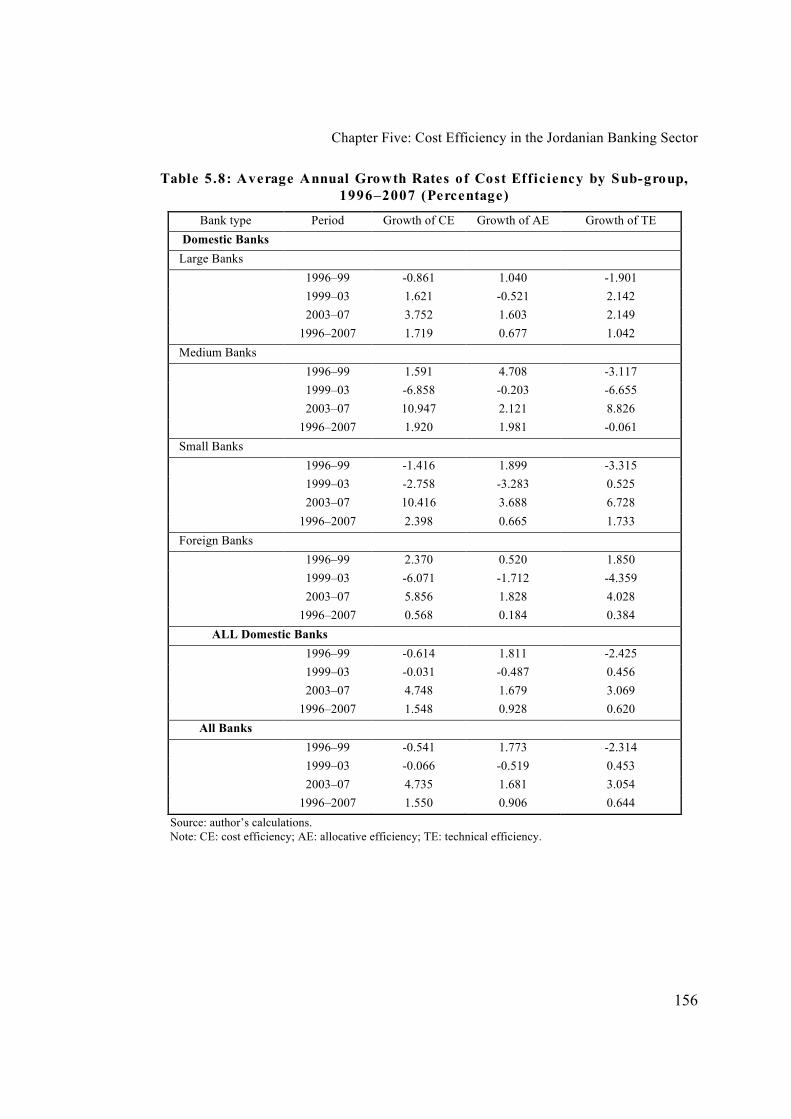
Chapter Five: Cost Efficiency in the Jordanian Banking Sector
156
Table 5.8: Average Annual Growth Rates of Cost Efficiency by Sub-group,
1996–2007 (Percentage)
Bank type Period Growth of CE Growth of AE Growth of TE
Domestic Banks
Large Banks
1996–99 -0.861 1.040 -1.901
1999–03 1.621 -0.521 2.142
2003–07 3.752 1.603 2.149
1996–2007 1.719 0.677 1.042
Medium Banks
1996–99 1.591 4.708 -3.117
1999–03 -6.858 -0.203 -6.655
2003–07 10.947 2.121 8.826
1996–2007 1.920 1.981 -0.061
Small Banks
1996–99 -1.416 1.899 -3.315
1999–03 -2.758 -3.283 0.525
2003–07 10.416 3.688 6.728
1996–2007 2.398 0.665 1.733
Foreign Banks
1996–99 2.370 0.520 1.850
1999–03 -6.071 -1.712 -4.359
2003–07 5.856 1.828 4.028
1996–2007 0.568 0.184 0.384
ALL Domestic Banks
1996–99 -0.614 1.811 -2.425
1999–03 -0.031 -0.487 0.456
2003–07 4.748 1.679 3.069
1996–2007 1.548 0.928 0.620
All Banks
1996–99 -0.541 1.773 -2.314
1999–03 -0.066 -0.519 0.453
2003–07 4.735 1.681 3.054
1996–2007 1.550 0.906 0.644
Source: author’s calculations.
Note: CE: cost efficiency; AE: allocative efficiency; TE: technical efficiency.

Chapter Five: Cost Efficiency in the Jordanian Banking Sector
157
Figure 5.3: DEA Estimates of Cost Efficiency by Bank Category, 1996–2007
Source: author’s calculations.
Note: CE: Cost Efficiency
Figure 5.4: DEA Estimates of Allocative Efficiency by Bank Category, 1996–2007
Source: author’s calculations.
Note: AE: Allocative Efficiency
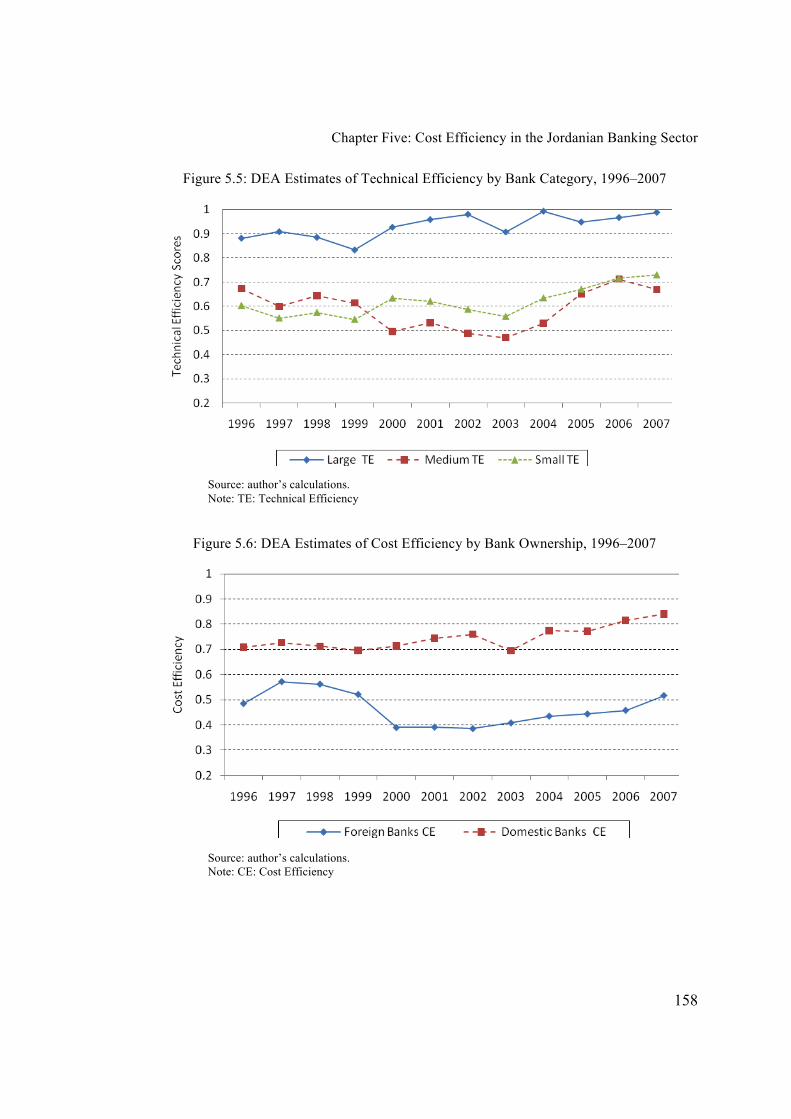
Chapter Five: Cost Efficiency in the Jordanian Banking Sector
158
Figure 5.5: DEA Estimates of Technical Efficiency by Bank Category, 1996–2007
Source: author’s calculations.
Note: TE: Technical Efficiency
Figure 5.6: DEA Estimates of Cost Efficiency by Bank Ownership, 1996–2007
Source: author’s calculations.
Note: CE: Cost Efficiency
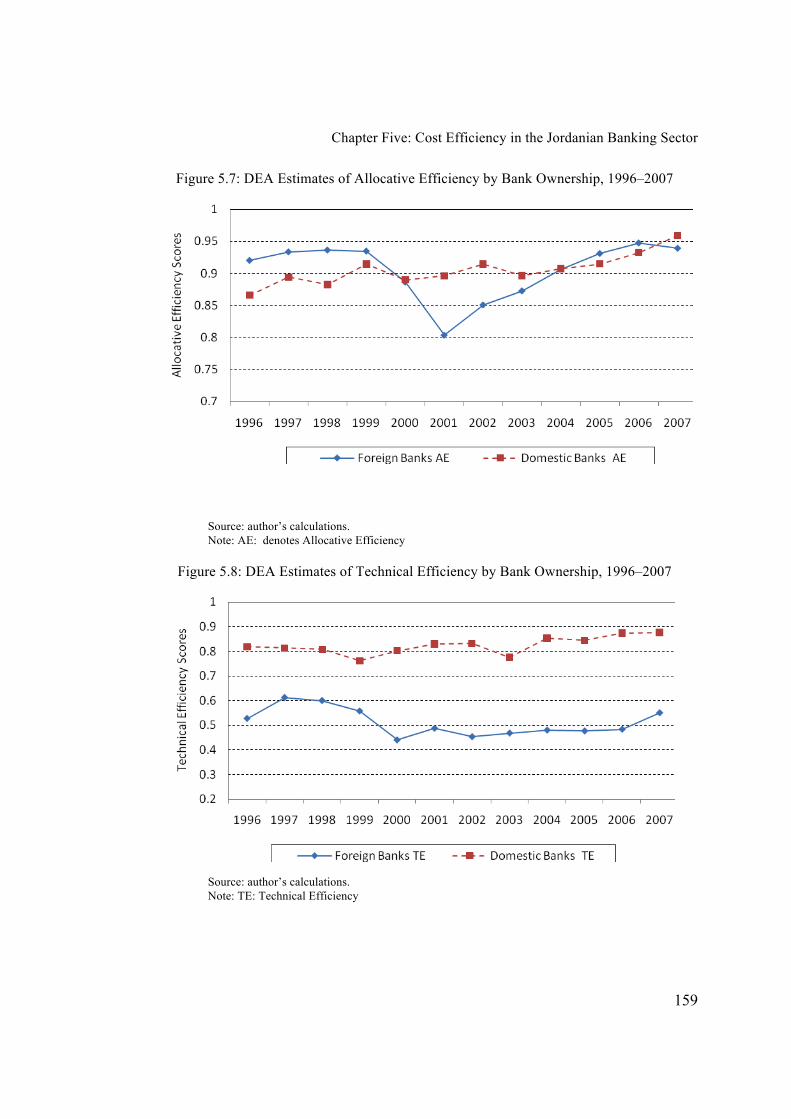
Chapter Five: Cost Efficiency in the Jordanian Banking Sector
159
Figure 5.7: DEA Estimates of Allocative Efficiency by Bank Ownership, 1996–2007
Source: author’s calculations.
Note: AE: denotes Allocative Efficiency
Figure 5.8: DEA Estimates of Technical Efficiency by Bank Ownership, 1996–2007
Source: author’s calculations.
Note: TE: Technical Efficiency

Chapter Five: Cost Efficiency in the Jordanian Banking Sector
160
5.4. Conclusions
This chapter has investigated the level of cost efficiency in Jordanian banks. The cost
efficiency scores for each bank are obtained using the input-oriented DEA model.
The cost efficiency is decomposed into allocative and technical efficiency levels.
Consistent with the existing literature, we find that the allocative efficiency is quite
high in the Jordanian banking sector. The average cost efficiency score of banks is
0.74, which implies that they could reduce the cost of production by 26 percent
without affecting the level of output.
The large banks are found most efficient in terms of cost efficiency (86%), allocative
efficiency (92.7%) and technical efficiency (93%) during the sample period. The
small banks rank second in terms of efficiency level. The cost efficiency of foreign
banks is much lower than that of the domestic banks.
Over the entire sample period, cost efficiency has increased at the rate of 1.55% per
annum; the improvement in allocative efficiency has contributed about 60% of this.
While cost efficiency shows a decline during the early and middle phase of
deregulation, it shows large improvements in the final phase of financial deregulation
in Jordan.
CHAPTER 6
Productivity Change in the Jordanian Banking
Sector
6.1 Introduction
The previous chapter investigated changes in efficiency levels of banks over the
study period. DEA methodology was used on the assumption that the efficiency
frontier did not shift over the sample period. The efficiency frontier can shift due to
technological progress (technological innovations). Technological progress should be
distinguished from gains in technical efficiency represented by units moving toward
the frontier (the ‘catching-up effect’). This chapter investigates changes in total
factor productivity (TFP) over time, whether due to technological change (TC) or
technical efficiency change (TEC) or a combination of both. The productivity change
of banks is estimated using the Malmquist Productivity Index (MPI). The MPI
provides a measure of total factor productivity (TFP) change, which is decomposed
into the product of technical efficiency change (TEC) and technological change
(TC). Technical efficiency change is further decomposed into the product of pure
technical efficiency change (PTEC) and scale efficiency change (SEC). This
decomposition is useful in that it provides information on the sources of productivity
change in banks.
Chapter Six: Productivity Change in the Jordanian Banking Sector
162
The concept of TFP change and its decomposition is discussed, and details on the
estimation of the MPI methodology using DEA-like methods provided, in Section
6.2. The data and variables employed in the present chapter to estimate the MPI are
those used in the investigation of efficiency in the previous chapters. Section 6.3
presents the results of TFP change and its decomposition into technical efficiency
change and technological change for all 17 Jordanian banks for the period 1996–
2007. Section 6.4 summarises the main findings.
6.2 The Malmquist Productivity Index (MPI): Decomposition and
Measurement
The Malmquist TFP index was first introduced in two very influential papers by
Caves, Christensen and Diewert (1982a, 1982b). These authors define the TFP index
using Malmquist distance functions; the resulting index is therefore known as the
Malmquist TFP index (MPI).
One of the important features of distance functions is that they allow description of a
multi-input, multi-output production technology without the need to specify a
behavioural objective such as cost minimisation or profit maximisation. Distance
functions are of two types: input distance functions and output distance functions.
Input distance functions look for a minimal proportional contraction of an input
vector, given an output vector; and output distance functions consider the maximum

Chapter Six: Productivity Change in the Jordanian Banking Sector
163
proportional expansion of output with a given set of inputs. Since banks have better
control over inputs than outputs, an input-orientated approach for computing TFP is
adopted in this study.
Let M
t Ry +∈ denotes an (Mx1) output vector, N
tRx +∈ an (Nx1) input vector, and
L(y) denote the input set representing the set of all input vectors, x, which can
produce the output vector, y. Then the input distance function, which involves the
scaling of input vector, is defined on input set, L(y), as
( ) ( ){ }yLxxyd ttttt
t
i ∈= )/(:max, ρρ (6.1)
where the subscript ‘i’ indicates ‘input oriented’ measure. The notation ( )tt
t
i xyd ,
stands for the distance from the period t observation to the period t technology. In
other words, this distance function represents the largest factor,t
ρ , by which an input
vector ( )tx is deflated to produce the output vector under period t technology.
Similarly, ( )tt
s
i xyd , indicates distance from period t observation to period s
technology. An input distance function can be illustrated using an example where
two inputs, x1 and x2, are used to produce a given output vector, y. For a given output
vector, the production technology is represented by the isoquant, L(y), in Figure 6.1.
The value of the distance function for the point, A, which defines the production
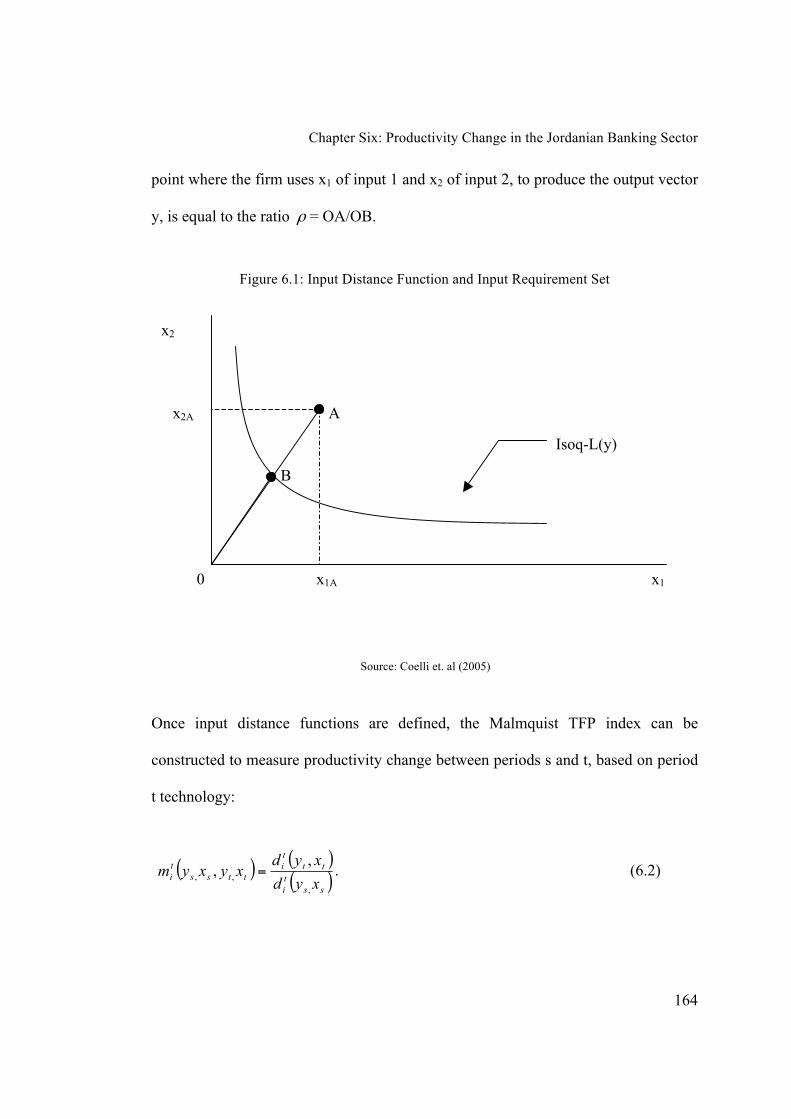
Chapter Six: Productivity Change in the Jordanian Banking Sector
164
point where the firm uses x1 of input 1 and x2 of input 2, to produce the output vector
y, is equal to the ratio ρ = OA/OB.
Figure 6.1: Input Distance Function and Input Requirement Set
Source: Coelli et. al (2005)
Once input distance functions are defined, the Malmquist TFP index can be
constructed to measure productivity change between periods s and t, based on period
t technology:
( ) ( )( )ss
t
i
tt
t
i
ttss
t
ixyd
xydxyxym
,
,,
,, = . (6.2)
x2
x1 0 x1A
x2A A
B
Isoq-L(y)
Chapter Six: Productivity Change in the Jordanian Banking Sector
165
A similar output-oriented Malmquist index can be obtained based on period s
technology as follows:
( ) ( )( )ss
s
i
tt
s
i
ttss
s
ixyd
xydxyxym
,
,,
,, = . (6.3)
Clearly, Equations (6.2) and (6.3) imply that the estimation of TFP change between
the two periods depends on the choice of technology. In order to avoid the effect of
any arbitrarily chosen technology, Färe et al. (1994) suggest estimating the output-
oriented TFP as the geometric mean of the indices based on periods t and s
technologies, as given by Equations (6.2) and (6.3) respectively. Hence we have
( ) ( )( )
( )( )
2
1
,,
,,,,,
=ss
t
i
tt
t
i
ss
s
i
tt
s
i
ttssixyd
xyd
xyd
xydxyxym . (6.4)
When the value of im exceeds unity, this indicates a positive TFP growth from period
s to period t, and a value of the index less than one indicates a decline in TFP growth.
Equation (6.4) can be re-written as
( ) ( )( )
( )( )
( )( )
2
1
,,,
,,,,,,
=ss
t
i
ss
s
i
tt
t
i
tt
s
i
ss
s
i
tt
t
i
ttssixyd
xyd
xyd
xyd
xyd
xydxyxym . (6.5)

Chapter Six: Productivity Change in the Jordanian Banking Sector
166
The ratio outside the square brackets measures the change in the input-oriented
measure of technical efficiency between periods s and t. This efficiency change is
equivalent to the ratio of the Farell technical efficiency in period t to the Farell
technical efficiency in period s. The remaining part of the index indicates the shift in
technology between the two periods. Thus, the Malmquist TFP index given by
Equation (6.5) shows that productivity change is the product of technical efficiency
change (catch-up) and technological change (shift in frontier). Figure 6.2 below
illustrates the decomposition.
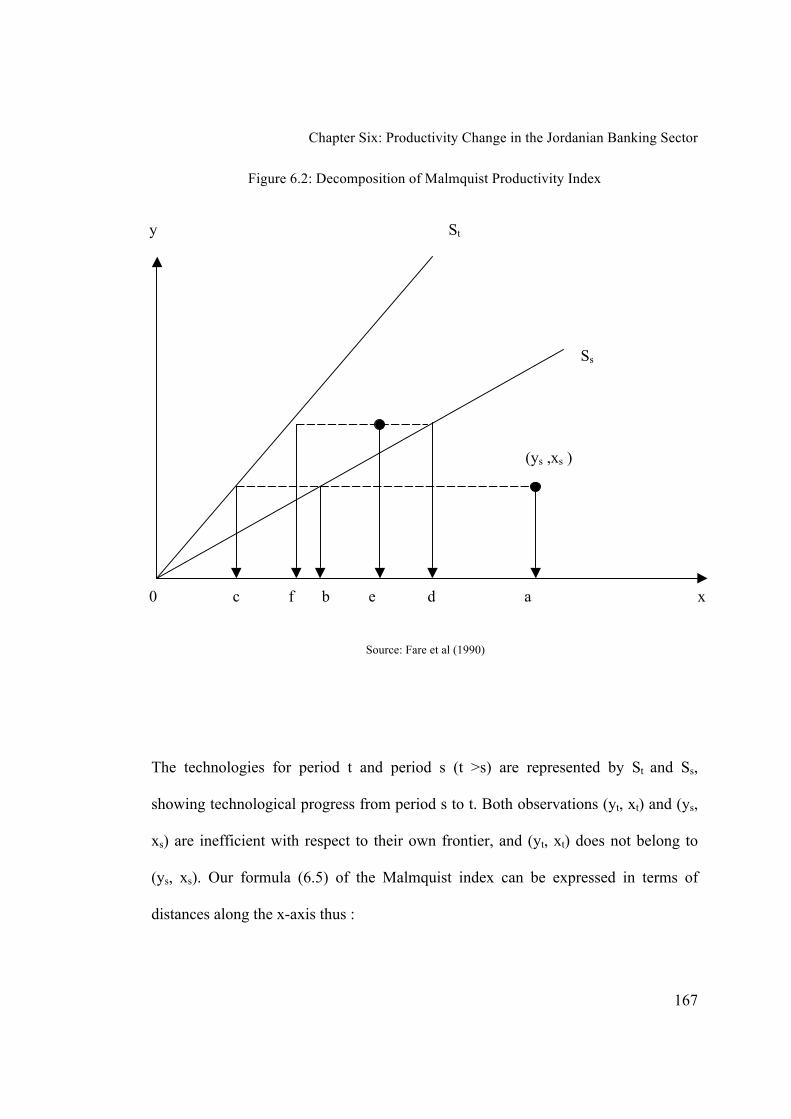
Chapter Six: Productivity Change in the Jordanian Banking Sector
167
Figure 6.2: Decomposition of Malmquist Productivity Index
Source: Fare et al (1990)
The technologies for period t and period s (t >s) are represented by St and Ss,
showing technological progress from period s to t. Both observations (yt, xt) and (ys,
xs) are inefficient with respect to their own frontier, and (yt, xt) does not belong to
(ys, xs). Our formula (6.5) of the Malmquist index can be expressed in terms of
distances along the x-axis thus :
Ss
(ys ,xs )
St y
x 0 c f b e d a
Chapter Six: Productivity Change in the Jordanian Banking Sector
168
( )2
1
/
/,,,
=ob
oc
od
of
oboa
ofoexyxym ttssi
(6.6)
To measure Malmquist TFP change between any two periods as defined in equation
(6.5), four distance functions have to be calculated. The decomposition of technical
efficiency change into changes in scale efficiency and pure technical efficiency
components requires the calculation of the distance functions with VRS technology.
The values obtained with CRS and VRS technology can be used to calculate the
scale efficiency change residually. The mathematics underlying the estimation
procedure is outlined in Fare and Grosskopf (1990) and Coelli et al. (2005).
6.3 Empirical Results
The data envelope approach described above is used to compute the input-oriented
Malmquist indices of productivity change based on the panel data for all 17 banks
(two large, eight medium, four small and three foreign) for the period 1996–2007.
The output and input variables are the same as in the previous chapters. The
computer software DEAP (Coelli, 1996) is used to calculate these indices. As
mentioned earlier, by definition DEA efficiency scores assign numerical values
(between 0 and 1 or 0 and 100%) to the efficiency level of a DMU relative to others;
but in the case of MPI, a value of the index greater than one indicates positive
productivity growth or productivity progress, while a value less than one indicates
Chapter Six: Productivity Change in the Jordanian Banking Sector
169
productivity decline or productivity regress. Percentage change in productivity is
given by (Productivity Change – 1) x 100. Where mean aggregate indices are
reported for the different groups of banks, these are weighted geometric means, in
this case using the shares of individual banks in the group output as weights. The
broad bank categories are the same as in previous chapters. The indices aggregated
over the period are also weighted geometric means, where shares of yearly outputs in
the total output for the period are used as weights.
The sample period mean results for TFP change and its components of technical
efficiency change, pure technical efficiency change, scale efficiency change and
technological change indices for each bank are presented in Table 6.1. The results
reveal that both the large banks, five medium-sized banks, two small and one foreign
bank have shown productivity improvements and the seven other banks showed
productivity regress over the years. The highest mean TFP growth per annum was
that of the Jordan Kuwait Bank (5.7%) and the lowest that of the Housing Bank for
Trade and Finance (HBTF). The observed improvement in mean TFP is largely
attributable to technological progress. About half of the banks showed a decline in
their technical efficiency. All the domestic banks showed either marginal
improvement (less than 1% per year) in their scale efficiency or remained at the
constant returns to scale during the entire period. The scale efficiency of foreign

Chapter Six: Productivity Change in the Jordanian Banking Sector
170
banks declined in their scale inefficiency; the highest decline (-7.6% per annum) was
observed for the Citi Bank.
Table 6.1: Mean MPI Estimates of Productivity Change and its Components,
1996–2007
Banks TFPC TC TEC PTEC SEC
Domestic Banks
Large
AB 1.044 1.044 1.000 1.000 1.000
HBTF 1.018 1.014 1.004 1.000 1.004
Medium
JKB 1.057 1.028 1.028 1.030 0.999
JIBF 0.968 1.025 0.945 0.946 0.998
JNB 0.967 1.010 0.957 0.955 1.002
BOJ 0.971 0.995 0.976 0.971 1.005
CAB 1.022 1.019 1.003 0.995 1.008
UBJ 1.038 1.047 0.992 0.984 1.007
CPB 1.032 1.032 1.000 1.000 1.000
JIFB 1.073 1.073 1.000 1.000 1.000
Small
ABC 1.033 1.032 1.002 1.009 0.992
JCB 0.984 0.996 0.988 0.989 0.999
AJIB 1.073 1.017 1.054 1.048 1.006
SGBJ 0.999 1.006 0.994 1.003 0.990
Foreign
HSBC 0.993 1.031 0.964 0.969 0.994
BSC 1.032 1.043 0.989 1.001 0.988
CB 0.977 1.041 0.938 1.015 0.924
Source: author’s calculations.
Note: TFP: total factor productivity; TEC: technical efficiency change; PTEC: pure
technical efficiency change; SE: scale efficiency change; TC: technological change.
Chapter Six: Productivity Change in the Jordanian Banking Sector
171
Table 6.2 records the mean MPI estimates for the broad groups of banks and the
banking sector as a whole. Over the sample period of the entire deregulation era, the
Jordanian banking sector as a whole showed a productivity growth of 3.5% per year,
largely due to technological improvement. The productivity change among domestic
banks was much higher than in foreign banks. Amongst the domestic banks, large
banks showed the highest productivity improvement.
It is worthwhile to compare these estimates of TFP growth with those for the
regulated period. Magayrah (2004) investigated the estimates of TFP for eight
domestic banks in the years prior to banking and financial liberalisation in Jordan.
Calculations of the geometric means of the TFP and its components, using his
estimates for the period 1985–1995, are presented in Table 6.3. While the estimates
presented in this table are not strictly comparable to the ones in this study, largely
because of the difference in the sample size, the comparison does provide a broad
and interesting picture. Productivity growth during the regulated period of 1985–
1995 was only 1.0% per annum, whereas the deregulated period showed (as noted
earlier) a growth of 3.5% per annum. The unregulated period showed a 3.8%
increase in technological progress, against no technological change during the
regulated and controlled regime. This comparison does reveal that deregulation or,
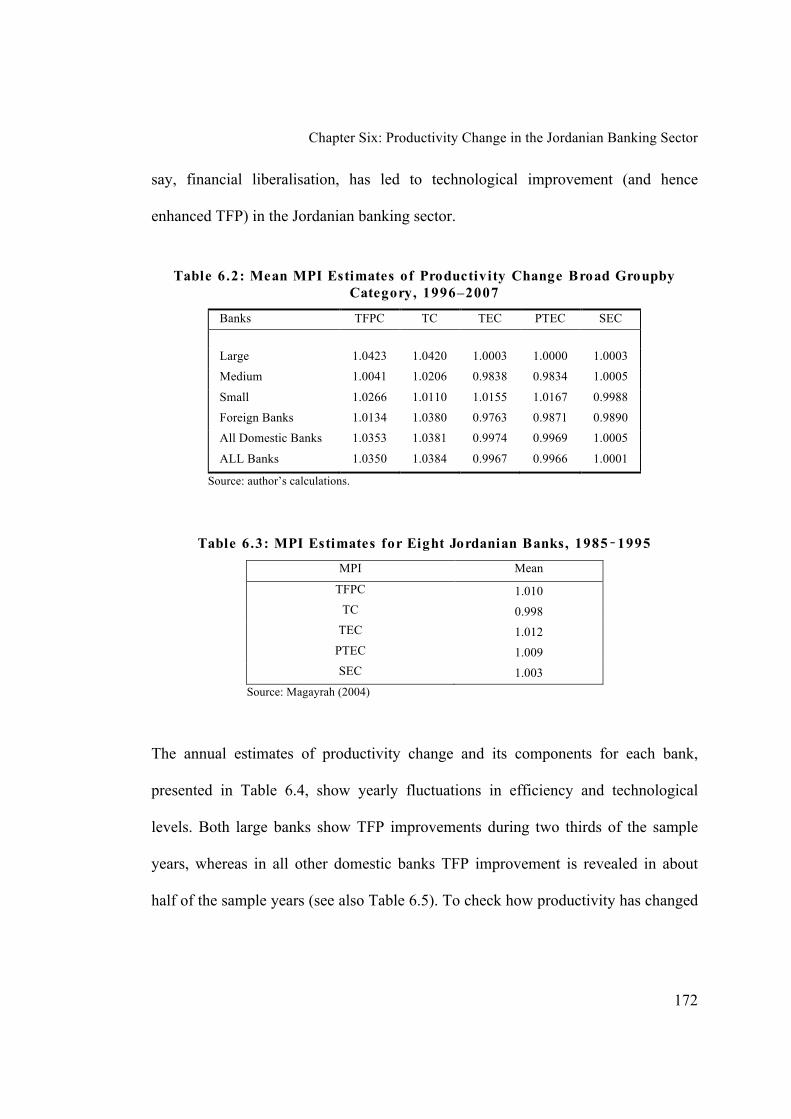
Chapter Six: Productivity Change in the Jordanian Banking Sector
172
say, financial liberalisation, has led to technological improvement (and hence
enhanced TFP) in the Jordanian banking sector.
Table 6.2: Mean MPI Estimates of Productivity Change Broad Groupby
Category, 1996–2007
Banks TFPC TC TEC PTEC SEC
Large 1.0423 1.0420 1.0003 1.0000 1.0003
Medium 1.0041 1.0206 0.9838 0.9834 1.0005
Small 1.0266 1.0110 1.0155 1.0167 0.9988
Foreign Banks 1.0134 1.0380 0.9763 0.9871 0.9890
All Domestic Banks 1.0353 1.0381 0.9974 0.9969 1.0005
ALL Banks 1.0350 1.0384 0.9967 0.9966 1.0001
Source: author’s calculations.
Table 6.3: MPI Estimates for Eight Jordanian Banks, 1985‒1995
MPI Mean
TFPC 1.010
TC 0.998
TEC 1.012
PTEC 1.009
SEC 1.003
Source: Magayrah (2004)
The annual estimates of productivity change and its components for each bank,
presented in Table 6.4, show yearly fluctuations in efficiency and technological
levels. Both large banks show TFP improvements during two thirds of the sample
years, whereas in all other domestic banks TFP improvement is revealed in about
half of the sample years (see also Table 6.5). To check how productivity has changed
Chapter Six: Productivity Change in the Jordanian Banking Sector
173
over the sub-periods of financial reforms, Table 6.6 presents the estimates of TFP for
the broad categories of banks for the three sub-periods that represent the early,
middle and late phases of financial liberalisation. In the early phase of deregulation,
TFP growth in none of the domestic bank subgroups was different from that of the
pre-deregulation period. All the bank categories except small and foreign banks
showed accelerated TFP growth in the second phase of deregulation. The large banks
showed the highest TFP growth (10.5%) per annum, largely due to technological
improvement. The medium-sized and foreign bank groups each showed TFP regress
of about 6.5% per annum and a decline in both technical and technological
efficiencies. The TFP growth across all bank categories except the large banks
improved in the latter phase of deregulation, implying that the banking sector
responded positively to the financial liberalisation policies initiated by the Jordanian
government.

Chapter Six: Productivity Change in the Jordanian Banking Sector
174
Table 6.4: MPI Estimates of Productivity Change and its Components, 1996–2007
Banks Prod 1996 1997 1998 1999 2000 2001 2002 2003 2004 2005 2006 2007 Mean
large
Arab
Bank TFPC 1.000 1.105 1.046 0.914 1.540 1.023 1.061 0.913 1.134 0.917 0.919 1.094 1.044
TC 1.000 1.105 1.046 0.914 1.540 1.023 1.061 0.913 1.134 0.917 0.919 1.094 1.044
TEC 1.000 1.000 1.000 1.000 1.000 1.000 1.000 1.000 1.000 1.000 1.000 1.000 1.000
PTEC 1.000 1.000 1.000 1.000 1.000 1.000 1.000 1.000 1.000 1.000 1.000 1.000 1.000
SEC 1.000 1.000 1.000 1.000 1.000 1.000 1.000 1.000 1.000 1.000 1.000 1.000 1.000
HBTF TFPC 1.000 1.001 1.040 0.889 1.019 1.345 0.968 0.882 1.168 0.983 1.059 0.945 1.018
TC 1.000 0.891 1.260 0.901 1.049 1.242 1.145 0.713 1.070 1.064 1.124 0.862 1.014
TEC 1.000 1.123 0.825 0.986 0.972 1.083 0.846 1.238 1.091 0.925 0.942 1.096 1.004
PTEC 1.000 1.000 1.000 1.000 0.975 1.026 1.000 1.000 1.000 1.000 1.000 1.000 1.000
SEC 1.000 1.123 0.825 0.986 0.997 1.055 0.846 1.238 1.091 0.925 0.942 1.096 1.004
medium
JKB TFPC 1.000 1.154 0.878 0.948 0.957 1.222 1.013 1.067 1.121 1.266 1.276 0.887 1.057
TC 1.000 0.893 1.185 1.167 0.872 0.987 0.867 1.248 1.095 1.061 1.131 0.925 1.028
TEC 1.000 1.293 0.740 0.812 1.098 1.238 1.169 0.855 1.023 1.193 1.128 0.959 1.028
PTEC 1.000 1.303 0.747 0.936 1.106 1.155 1.220 1.000 1.000 1.000 1.000 1.000 1.030
SEC 1.000 0.992 0.991 0.868 0.993 1.072 0.958 0.855 1.023 1.193 1.128 0.959 0.999
JIBF TFPC 1.000 0.973 0.930 1.021 0.693 0.909 0.791 0.940 1.025 1.318 1.031 1.128 0.968
TC 1.000 0.973 1.000 1.183 0.902 1.029 0.895 1.239 1.037 1.071 1.151 0.888 1.025
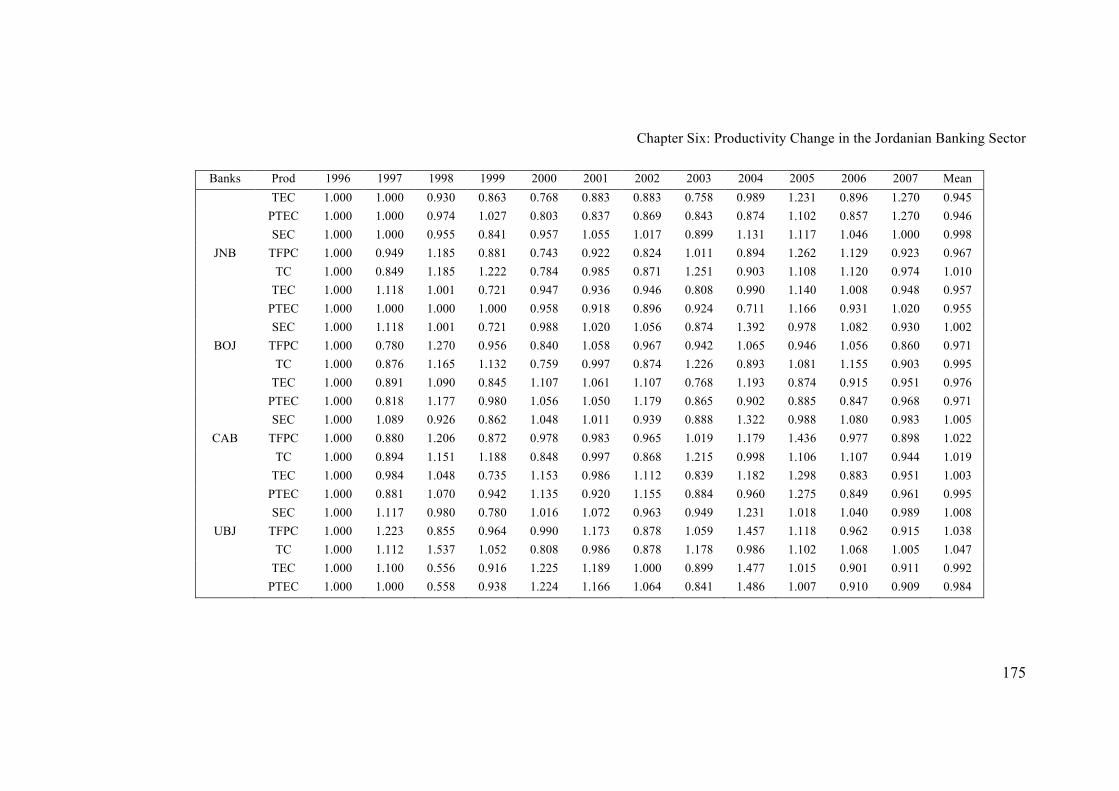
Chapter Six: Productivity Change in the Jordanian Banking Sector
175
Banks Prod 1996 1997 1998 1999 2000 2001 2002 2003 2004 2005 2006 2007 Mean
TEC 1.000 1.000 0.930 0.863 0.768 0.883 0.883 0.758 0.989 1.231 0.896 1.270 0.945
PTEC 1.000 1.000 0.974 1.027 0.803 0.837 0.869 0.843 0.874 1.102 0.857 1.270 0.946
SEC 1.000 1.000 0.955 0.841 0.957 1.055 1.017 0.899 1.131 1.117 1.046 1.000 0.998
JNB TFPC 1.000 0.949 1.185 0.881 0.743 0.922 0.824 1.011 0.894 1.262 1.129 0.923 0.967
TC 1.000 0.849 1.185 1.222 0.784 0.985 0.871 1.251 0.903 1.108 1.120 0.974 1.010
TEC 1.000 1.118 1.001 0.721 0.947 0.936 0.946 0.808 0.990 1.140 1.008 0.948 0.957
PTEC 1.000 1.000 1.000 1.000 0.958 0.918 0.896 0.924 0.711 1.166 0.931 1.020 0.955
SEC 1.000 1.118 1.001 0.721 0.988 1.020 1.056 0.874 1.392 0.978 1.082 0.930 1.002
BOJ TFPC 1.000 0.780 1.270 0.956 0.840 1.058 0.967 0.942 1.065 0.946 1.056 0.860 0.971
TC 1.000 0.876 1.165 1.132 0.759 0.997 0.874 1.226 0.893 1.081 1.155 0.903 0.995
TEC 1.000 0.891 1.090 0.845 1.107 1.061 1.107 0.768 1.193 0.874 0.915 0.951 0.976
PTEC 1.000 0.818 1.177 0.980 1.056 1.050 1.179 0.865 0.902 0.885 0.847 0.968 0.971
SEC 1.000 1.089 0.926 0.862 1.048 1.011 0.939 0.888 1.322 0.988 1.080 0.983 1.005
CAB TFPC 1.000 0.880 1.206 0.872 0.978 0.983 0.965 1.019 1.179 1.436 0.977 0.898 1.022
TC 1.000 0.894 1.151 1.188 0.848 0.997 0.868 1.215 0.998 1.106 1.107 0.944 1.019
TEC 1.000 0.984 1.048 0.735 1.153 0.986 1.112 0.839 1.182 1.298 0.883 0.951 1.003
PTEC 1.000 0.881 1.070 0.942 1.135 0.920 1.155 0.884 0.960 1.275 0.849 0.961 0.995
SEC 1.000 1.117 0.980 0.780 1.016 1.072 0.963 0.949 1.231 1.018 1.040 0.989 1.008
UBJ TFPC 1.000 1.223 0.855 0.964 0.990 1.173 0.878 1.059 1.457 1.118 0.962 0.915 1.038
TC 1.000 1.112 1.537 1.052 0.808 0.986 0.878 1.178 0.986 1.102 1.068 1.005 1.047
TEC 1.000 1.100 0.556 0.916 1.225 1.189 1.000 0.899 1.477 1.015 0.901 0.911 0.992
PTEC 1.000 1.000 0.558 0.938 1.224 1.166 1.064 0.841 1.486 1.007 0.910 0.909 0.984

Chapter Six: Productivity Change in the Jordanian Banking Sector
176
Banks Prod 1996 1997 1998 1999 2000 2001 2002 2003 2004 2005 2006 2007 Mean
SEC 1.000 1.100 0.997 0.977 1.000 1.021 0.940 1.069 0.994 1.007 0.990 1.001 1.007
CPB TFPC 1.000 0.816 1.622 1.033 1.026 0.978 1.041 0.898 1.020 1.057 1.002 1.053 1.032
TC 1.000 0.857 1.545 1.033 1.026 0.978 1.041 0.898 1.020 1.057 1.002 1.053 1.032
TEC 1.000 0.953 1.050 1.000 1.000 1.000 1.000 1.000 1.000 1.000 1.000 1.000 1.000
PTEC 1.000 1.000 1.000 1.000 1.000 1.000 1.000 1.000 1.000 1.000 1.000 1.000 1.000
SEC 1.000 0.953 1.050 1.000 1.000 1.000 1.000 1.000 1.000 1.000 1.000 1.000 1.000
JIFB TFPC 1.000 1.196 1.497 1.262 0.740 1.730 0.839 0.826 1.278 0.961 1.175 0.807 1.073
TC 1.000 1.196 1.497 1.262 0.978 1.309 1.066 0.650 1.278 0.961 1.175 0.807 1.073
TEC 1.000 1.000 1.000 1.000 0.756 1.322 0.786 1.272 1.000 1.000 1.000 1.000 1.000
PTEC 1.000 1.000 1.000 1.000 0.823 1.216 0.864 1.157 1.000 1.000 1.000 1.000 1.000
SEC 1.000 1.000 1.000 1.000 0.919 1.088 0.910 1.099 1.000 1.000 1.000 1.000 1.000
small
ABC TFPC 1.000 0.984 0.985 0.925 1.010 1.014 1.006 1.080 1.112 1.114 1.146 1.043 1.033
TC 1.000 0.984 1.132 1.222 0.796 0.992 0.874 1.241 1.054 1.064 1.134 0.979 1.032
TEC 1.000 1.000 0.870 0.757 1.269 1.022 1.152 0.870 1.056 1.047 1.011 1.066 1.002
PTEC 1.000 1.004 0.949 0.786 1.125 1.014 1.166 0.867 1.109 1.100 1.044 1.015 1.009
SEC 1.000 0.996 0.916 0.963 1.128 1.008 0.988 1.004 0.952 0.951 0.968 1.050 0.992
JCB TFPC 1.000 0.943 0.994 0.956 1.123 1.005 0.694 1.265 1.000 1.027 0.901 1.006 0.984
TC 1.000 0.938 0.965 1.222 0.772 1.005 0.841 1.192 1.019 1.069 1.146 0.888 0.996
TEC 1.000 1.006 1.029 0.782 1.456 1.000 0.825 1.061 0.981 0.961 0.787 1.133 0.988
PTEC 1.000 1.016 1.007 0.934 1.212 1.000 0.888 1.062 1.060 0.965 0.743 1.060 0.989
SEC 1.000 0.990 1.022 0.838 1.201 1.000 0.929 0.999 0.926 0.996 1.058 1.069 0.999
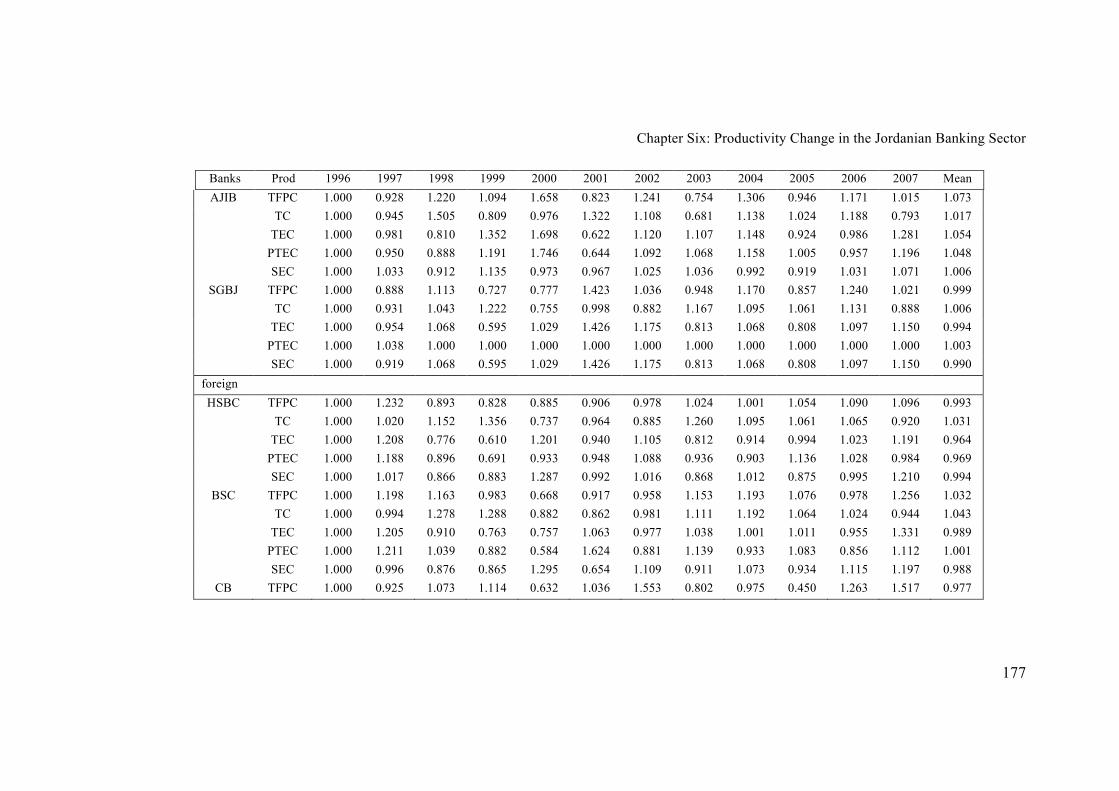
Chapter Six: Productivity Change in the Jordanian Banking Sector
177
Banks Prod 1996 1997 1998 1999 2000 2001 2002 2003 2004 2005 2006 2007 Mean
AJIB TFPC 1.000 0.928 1.220 1.094 1.658 0.823 1.241 0.754 1.306 0.946 1.171 1.015 1.073
TC 1.000 0.945 1.505 0.809 0.976 1.322 1.108 0.681 1.138 1.024 1.188 0.793 1.017
TEC 1.000 0.981 0.810 1.352 1.698 0.622 1.120 1.107 1.148 0.924 0.986 1.281 1.054
PTEC 1.000 0.950 0.888 1.191 1.746 0.644 1.092 1.068 1.158 1.005 0.957 1.196 1.048
SEC 1.000 1.033 0.912 1.135 0.973 0.967 1.025 1.036 0.992 0.919 1.031 1.071 1.006
SGBJ TFPC 1.000 0.888 1.113 0.727 0.777 1.423 1.036 0.948 1.170 0.857 1.240 1.021 0.999
TC 1.000 0.931 1.043 1.222 0.755 0.998 0.882 1.167 1.095 1.061 1.131 0.888 1.006
TEC 1.000 0.954 1.068 0.595 1.029 1.426 1.175 0.813 1.068 0.808 1.097 1.150 0.994
PTEC 1.000 1.038 1.000 1.000 1.000 1.000 1.000 1.000 1.000 1.000 1.000 1.000 1.003
SEC 1.000 0.919 1.068 0.595 1.029 1.426 1.175 0.813 1.068 0.808 1.097 1.150 0.990
foreign
HSBC TFPC 1.000 1.232 0.893 0.828 0.885 0.906 0.978 1.024 1.001 1.054 1.090 1.096 0.993
TC 1.000 1.020 1.152 1.356 0.737 0.964 0.885 1.260 1.095 1.061 1.065 0.920 1.031
TEC 1.000 1.208 0.776 0.610 1.201 0.940 1.105 0.812 0.914 0.994 1.023 1.191 0.964
PTEC 1.000 1.188 0.896 0.691 0.933 0.948 1.088 0.936 0.903 1.136 1.028 0.984 0.969
SEC 1.000 1.017 0.866 0.883 1.287 0.992 1.016 0.868 1.012 0.875 0.995 1.210 0.994
BSC TFPC 1.000 1.198 1.163 0.983 0.668 0.917 0.958 1.153 1.193 1.076 0.978 1.256 1.032
TC 1.000 0.994 1.278 1.288 0.882 0.862 0.981 1.111 1.192 1.064 1.024 0.944 1.043
TEC 1.000 1.205 0.910 0.763 0.757 1.063 0.977 1.038 1.001 1.011 0.955 1.331 0.989
PTEC 1.000 1.211 1.039 0.882 0.584 1.624 0.881 1.139 0.933 1.083 0.856 1.112 1.001
SEC 1.000 0.996 0.876 0.865 1.295 0.654 1.109 0.911 1.073 0.934 1.115 1.197 0.988
CB TFPC 1.000 0.925 1.073 1.114 0.632 1.036 1.553 0.802 0.975 0.450 1.263 1.517 0.977
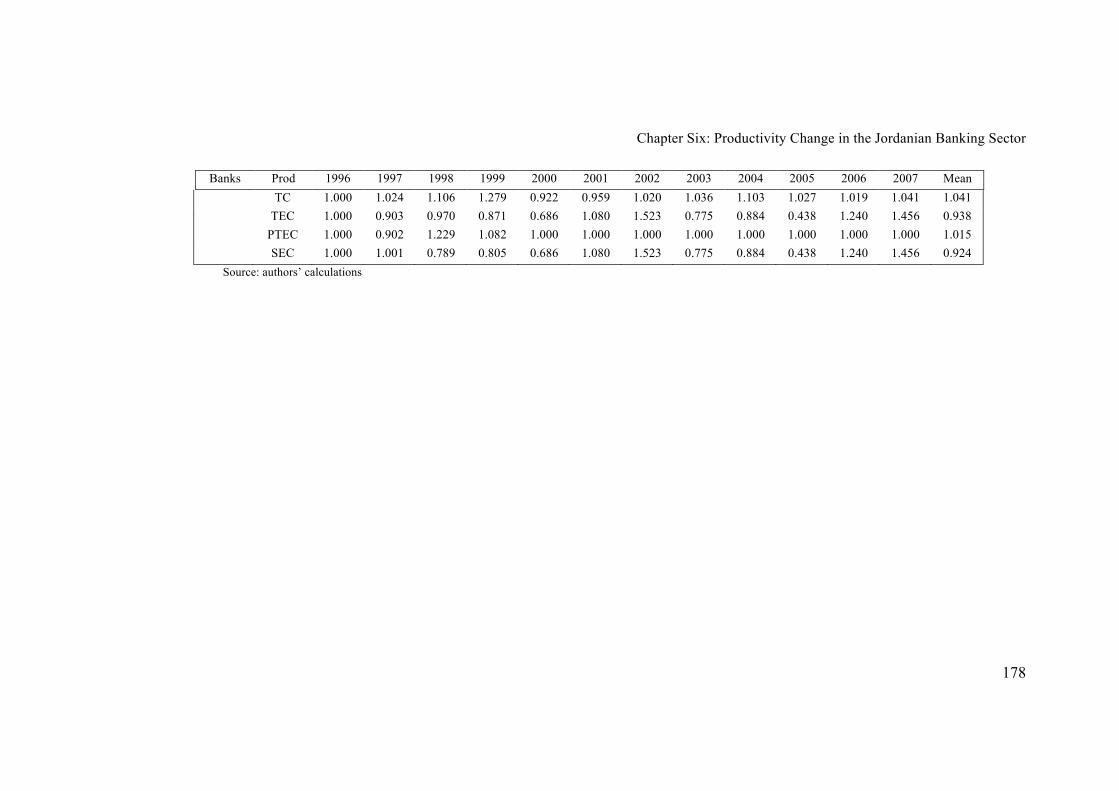
Chapter Six: Productivity Change in the Jordanian Banking Sector
178
Banks Prod 1996 1997 1998 1999 2000 2001 2002 2003 2004 2005 2006 2007 Mean
TC 1.000 1.024 1.106 1.279 0.922 0.959 1.020 1.036 1.103 1.027 1.019 1.041 1.041
TEC 1.000 0.903 0.970 0.871 0.686 1.080 1.523 0.775 0.884 0.438 1.240 1.456 0.938
PTEC 1.000 0.902 1.229 1.082 1.000 1.000 1.000 1.000 1.000 1.000 1.000 1.000 1.015
SEC 1.000 1.001 0.789 0.805 0.686 1.080 1.523 0.775 0.884 0.438 1.240 1.456 0.924
Source: authors’ calculations

Chapter Six: Productivity Change in the Jordanian Banking Sector
179
Table 6.5: MPI Productivity Change by Bank Category, 1996–2007
Banks Prod 1996 1997 1998 1999 2000 2001 2002 2003 2004 2005 2006 2007 Mean
Domestic Banks
Large
TFPC 1.000 1.091 1.045 0.911 1.479 1.054 1.051 0.910 1.138 0.927 0.943 1.066 1.0423
TC 1.000 1.076 1.071 0.912 1.484 1.045 1.069 0.889 1.126 0.940 0.953 1.049 1.0420
TEC 1.000 1.015 0.976 0.998 0.997 1.009 0.983 1.023 1.011 0.987 0.989 1.016 1.0003
PTEC 1.000 1.000 1.000 1.000 0.998 1.003 1.000 1.000 1.000 1.000 1.000 1.000 1.0000
SEC 1.000 1.015 0.976 0.998 1.000 1.006 0.983 1.023 1.011 0.987 0.989 1.016 1.0003
Medium
TFPC 1.000 0.959 1.123 0.959 0.831 1.061 0.902 0.979 1.091 1.185 1.087 0.930 1.0041
TC 1.000 0.924 1.171 1.178 0.842 1.024 0.899 1.152 0.998 1.075 1.115 0.937 1.0206
TEC 1.000 1.037 0.959 0.814 0.987 1.037 1.003 0.850 1.093 1.102 0.975 0.992 0.9838
PTEC 1.000 0.977 0.982 0.985 0.993 0.996 1.022 0.919 0.942 1.056 0.922 1.015 0.9834
SEC 1.000 1.061 0.976 0.826 0.993 1.041 0.982 0.925 1.161 1.044 1.057 0.977 1.0005
Small
TFPC 1.000 0.946 1.054 0.963 1.201 0.975 0.976 0.970 1.159 1.008 1.079 1.021 1.0266
TC 1.000 0.954 1.141 1.092 0.831 1.070 0.936 0.992 1.081 1.054 1.153 0.884 1.0110
TEC 1.000 0.992 0.923 0.882 1.445 0.911 1.042 0.978 1.073 0.957 0.936 1.156 1.0155
PTEC 1.000 0.998 0.957 0.952 1.309 0.902 1.047 0.980 1.104 1.020 0.913 1.078 1.0167
SEC 1.000 0.994 0.964 0.926 1.104 1.010 0.995 0.998 0.973 0.938 1.025 1.073 0.9988
Foreign Banks
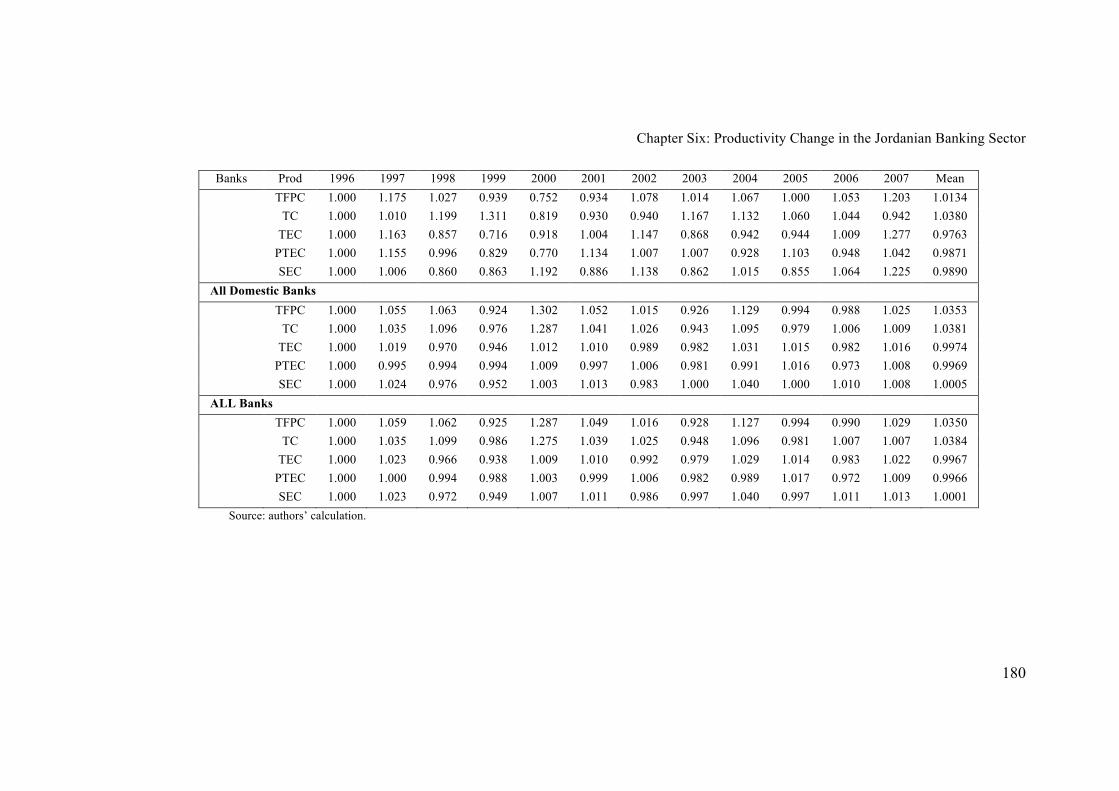
Chapter Six: Productivity Change in the Jordanian Banking Sector
180
Banks Prod 1996 1997 1998 1999 2000 2001 2002 2003 2004 2005 2006 2007 Mean
TFPC 1.000 1.175 1.027 0.939 0.752 0.934 1.078 1.014 1.067 1.000 1.053 1.203 1.0134
TC 1.000 1.010 1.199 1.311 0.819 0.930 0.940 1.167 1.132 1.060 1.044 0.942 1.0380
TEC 1.000 1.163 0.857 0.716 0.918 1.004 1.147 0.868 0.942 0.944 1.009 1.277 0.9763
PTEC 1.000 1.155 0.996 0.829 0.770 1.134 1.007 1.007 0.928 1.103 0.948 1.042 0.9871
SEC 1.000 1.006 0.860 0.863 1.192 0.886 1.138 0.862 1.015 0.855 1.064 1.225 0.9890
All Domestic Banks
TFPC 1.000 1.055 1.063 0.924 1.302 1.052 1.015 0.926 1.129 0.994 0.988 1.025 1.0353
TC 1.000 1.035 1.096 0.976 1.287 1.041 1.026 0.943 1.095 0.979 1.006 1.009 1.0381
TEC 1.000 1.019 0.970 0.946 1.012 1.010 0.989 0.982 1.031 1.015 0.982 1.016 0.9974
PTEC 1.000 0.995 0.994 0.994 1.009 0.997 1.006 0.981 0.991 1.016 0.973 1.008 0.9969
SEC 1.000 1.024 0.976 0.952 1.003 1.013 0.983 1.000 1.040 1.000 1.010 1.008 1.0005
ALL Banks
TFPC 1.000 1.059 1.062 0.925 1.287 1.049 1.016 0.928 1.127 0.994 0.990 1.029 1.0350
TC 1.000 1.035 1.099 0.986 1.275 1.039 1.025 0.948 1.096 0.981 1.007 1.007 1.0384
TEC 1.000 1.023 0.966 0.938 1.009 1.010 0.992 0.979 1.029 1.014 0.983 1.022 0.9967
PTEC 1.000 1.000 0.994 0.988 1.003 0.999 1.006 0.982 0.989 1.017 0.972 1.009 0.9966
SEC 1.000 1.023 0.972 0.949 1.007 1.011 0.986 0.997 1.040 0.997 1.011 1.013 1.0001
Source: authors’ calculation.
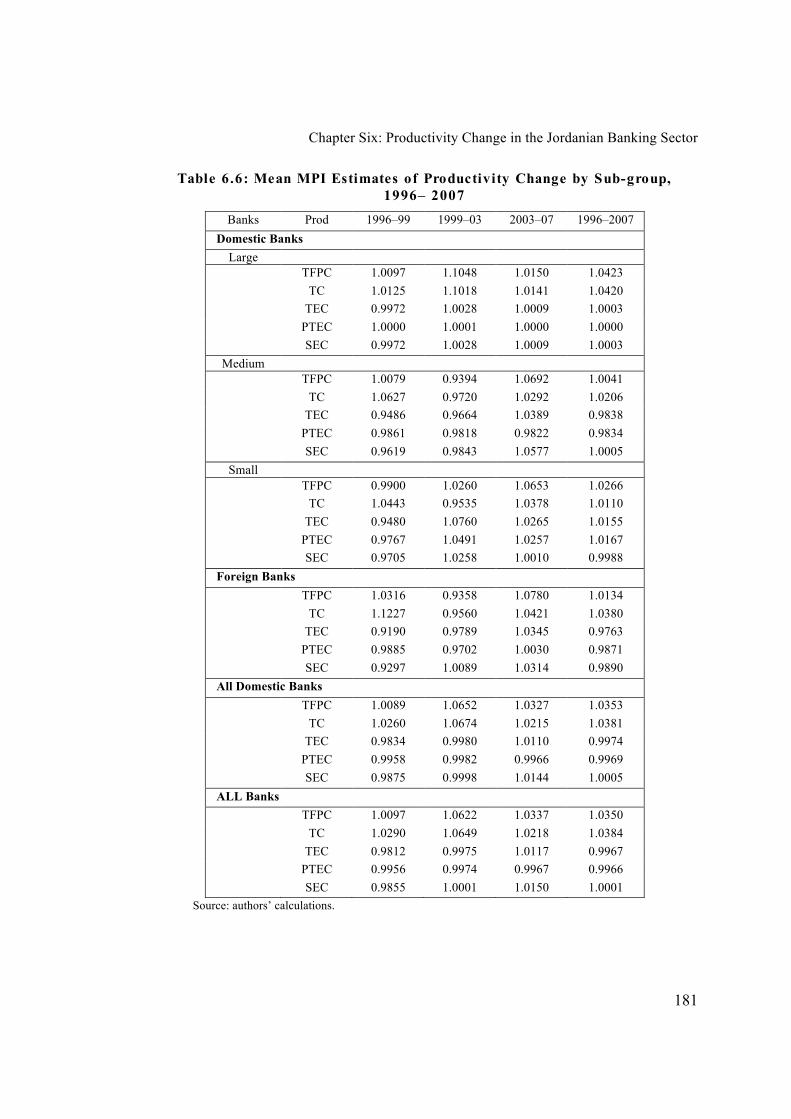
Chapter Six: Productivity Change in the Jordanian Banking Sector
181
Table 6.6: Mean MPI Estimates of Productivity Change by Sub-group,
1996– 2007
Banks Prod 1996–99 1999–03 2003–07 1996–2007
Domestic Banks
Large
TFPC 1.0097 1.1048 1.0150 1.0423
TC 1.0125 1.1018 1.0141 1.0420
TEC 0.9972 1.0028 1.0009 1.0003
PTEC 1.0000 1.0001 1.0000 1.0000
SEC 0.9972 1.0028 1.0009 1.0003
Medium
TFPC 1.0079 0.9394 1.0692 1.0041
TC 1.0627 0.9720 1.0292 1.0206
TEC 0.9486 0.9664 1.0389 0.9838
PTEC 0.9861 0.9818 0.9822 0.9834
SEC 0.9619 0.9843 1.0577 1.0005
Small
TFPC 0.9900 1.0260 1.0653 1.0266
TC 1.0443 0.9535 1.0378 1.0110
TEC 0.9480 1.0760 1.0265 1.0155
PTEC 0.9767 1.0491 1.0257 1.0167
SEC 0.9705 1.0258 1.0010 0.9988
Foreign Banks
TFPC 1.0316 0.9358 1.0780 1.0134
TC 1.1227 0.9560 1.0421 1.0380
TEC 0.9190 0.9789 1.0345 0.9763
PTEC 0.9885 0.9702 1.0030 0.9871
SEC 0.9297 1.0089 1.0314 0.9890
All Domestic Banks
TFPC 1.0089 1.0652 1.0327 1.0353
TC 1.0260 1.0674 1.0215 1.0381
TEC 0.9834 0.9980 1.0110 0.9974
PTEC 0.9958 0.9982 0.9966 0.9969
SEC 0.9875 0.9998 1.0144 1.0005
ALL Banks
TFPC 1.0097 1.0622 1.0337 1.0350
TC 1.0290 1.0649 1.0218 1.0384
TEC 0.9812 0.9975 1.0117 0.9967
PTEC 0.9956 0.9974 0.9967 0.9966
SEC 0.9855 1.0001 1.0150 1.0001
Source: authors’ calculations.

Chapter Six: Productivity Change in the Jordanian Banking Sector
182
6.4 Concluding Remarks
This chapter has used the DEA approach to estimate input-oriented Malmquist
indices to examine TFP changes in the Jordanian banking sector during the entire
deregulated period, 1996–2007. The TFP changes were decomposed into the product
of technological change and technical efficiency change (catch-up). The technical
efficiency change was further decomposed into the product of pure technical
efficiency change and the product of scale efficiency change. This is the first known
attempt to investigate TFP change in both domestic and foreign banks in Jordon over
the entire deregulated period.
The research reveals that over the sample period which covers the entire deregulation
era, the Jordanian banking sector as a whole showed a productivity growth of 3.5 per
year, largely due to technological improvement. The productivity change among
domestic banks was much higher than among foreign banks. Amongst the domestic
banks, large banks showed the highest productivity improvement.
The productivity growth during the regulated period of 1985–1995 was only 1.0%
per annum, which is much lower than the per annum productivity growth reported
here. This shows that the banking sector has responded positively to the deregulation
and liberalisation policies of the government, to achieve greater efficiency and
productivity.
CHAPTER 7
Summary and Conclusions
7.1 Summary and Conclusions
This study was undertaken to investigate efficiency and productivity changes in the
Jordanian banking sector during the financial deregulated period 1996–2007. In an
earlier study, Ahmad (2000) analysed the cost efficiency of 20 banks for 1990–1996.
In an unpublished paper, Maghyereh (2004) examines the efficiency and productivity
change in eight domestic banks over the period 1984–2001. This present study makes
a significant contribution to the literature on Jordanian banking efficiency and
productivity change by covering almost the entire sector and all of the deregulated
period, which has not been fully compassed in earlier studies. The results of this
study should help policy makers and bankers in understanding the ways regulatory
changes influence banks’ efficiency and productivity.
The study used an input-oriented DEA approach to analyse the levels of efficiency
and productivity change in seventeen banks, consisting of two large, eight medium,
four small and three foreign banks. Chapter 2 provided an overview of the
development of banking services in Jordan, beginning with a brief discussion of the
Jordanian economy and its financial sector. Since the study focused on the
performance of banks in terms of their efficiency and productivity, an overview of
the developments of the Jordanian banking sector was provided, with details about
Chapter Seven: Summary and Conclusions
184
the commercial, Islamic and foreign banks operating in Jordan during 1996–2007.
The historical developments that affected the Jordanian economy and financial
institutions and led to the financial liberalisation (deregulation) program were
highlighted.
Chapter 3 provided a selective review of previous studies of banking efficiency
conducted in the Middle East and the rest of the world. It reveals that the majority of
studies on banking efficiency in the Middle East have used a DEA approach; only a
few have used SFA methodology to compute efficiency estimates. These did not
compass the entire financial regulation period; the present study fills a gap in the
literature on the Jordanian banking sector by covering the entire deregulated period.
The main results of this research are provided in Chapters 4 through 6. An input-
oriented DEA model is used to obtain and analyse the estimates of technical
efficiency of 17 banks during 1996–2007, for which comparable data were available
from reliable sources. The efficiency scores for different categories of banks – small,
medium, large and foreign – were obtained as the weighted geometric means of the
bank-specific scores, with their output shares serving as weights. The same
procedure was adopted to obtain average scores over the entire period as well as
three sub-periods, 1996–1999, 1999–2003 and 2003–2007, representing the early,
middle and latter phases of financial deregulation in Jordan.
Chapter Seven: Summary and Conclusions
185
The results obtained in Chapter 4 reveal several interesting points. First, the average
technical efficiency for all banks is found to be 79.2%. This implies that inputs can
be reduced by 20.8% on average, relative to the best-practice banks during the
sample period.
Second, the Arab Bank, one of the two large banks involved in this study, performed
at the highest level of technical efficiency (90%) during the sample period. Small
banks were found to be more efficient than medium sized banks. Foreign banks
showed the lowest technical efficiency, indicating scope for cost reduction.
Third, the large banks operated at decreasing returns to scale (DRS) over the entire
period. This indicates that large banks must reduce the size of their operations to
achieve efficiency improvements. On the other hand, most of the small-sized banks
operated at increasing returns to scale (IRS) over the sample period. This indicates
that they must increase the size of their operations to reach optimal scale efficiency.
However, the results also reveal that banks can be efficient at different sizes. This is
consistent with studies conducted elsewhere.
Fourth, the banking sector as a whole has shown improvements in technical
efficiency at the average rate of 0.37% per year over the study period. This seems to
be due to substantial improvement in pure technical efficiency (0.64% per year). The
Chapter Seven: Summary and Conclusions
186
improvement in technical efficiency would have been higher had there been no
decline in scale efficiencies.
Finally the scores of technical efficiency provided insights into the input-output
inefficiencies experienced by Jordanian banks, suggesting that staff numbers and
total deposits are the most common sources of inefficiency. Banks need to use their
deposits more efficiently and reduce their staff to enhance efficiency.
The results described above were obtained by assuming that there are no allocative
inefficiencies in the banking sector, and that the frontier remains the same throughout
the sample period. The first assumption was guided by the international literature,
which suggests that allocative inefficiency is negligible during a short sample period.
This assumption was dropped in Chapter 5, which focused on overall (cost)
efficiency, the product of technical and allocative efficiencies. Assuming the frontier
remained unchanged over the sample period enabled a comparison of the estimates
of technical efficiencies across times and banks.
The results presented in Chapter 5 provide an average cost efficiency score of 0.74,
implying that the banking sector could reduce the costs of production by 26 per cent
without affecting the level of output. Again, large banks were found to be the most
efficient in terms of cost efficiency (86%), allocative efficiency (92.7%) and
technical efficiency (93%). Small banks ranked second in terms of efficiency levels.
Chapter Seven: Summary and Conclusions
187
While cost efficiency showed a decline during the early and middle phases of
deregulation, it made great improvement in the final phase of financial deregulation
in Jordan.
In Chapters 4 and 5, it was assumed that the efficiency frontier had not shifted over
the sample period. The efficiency frontier can shift due to technological progress
(technological innovations). The technological progress should be distinguished from
gains in technical efficiency represented by units moving toward the frontier
(commonly referred to as the ‘catching-up effect’). Chapter 6 investigated over-time
changes in total factor productivity (TFP) of banks, changes which could be due
either to technological change (TC) or technical efficiency change (TEC), or a
combination of both. The productivity changes of banks were measured by
estimating the Malmquist Productivity Indices. The results revealed that the
Jordanian banking sector as a whole showed a productivity growth of 3.5 per cent per
annum, largely due to technological improvement. Productivity growth during the
regulated period of 1985–1995, at 1.0% per annum, was less than the per annum
productivity growth reported here. This shows that the banking sector has responded
positively to the deregulation and liberalisation policies of the government to achieve
greater efficiency and productivity.
Chapter Seven: Summary and Conclusions
188
7.2 Limitations and Suggestions for Future Research
Like any other research, the current study is not free from limitations and there is
scope for refining and extending the results. The results presented in this study are
based on a DEA approach. The parametric approach, particularly the stochastic
frontier approach (SFA), provides additional avenues for efficiency analysis; for
example, SFA allows the application of statistical tools to test the significance of cost
or profit efficiencies. Further research based on flexible stochastic cost and profit
functions will add to our understanding of efficiency and productivity changes in the
Jordanian banking sector.
BIBLIOGRAPHY
Ahmad, AY 2001, ‘Contemporary Islamic Issues in Finance Banks and Money’, Al
Dar Al-Jameiah, Cairo, Egypt.
Ahmad, T 2000, The Efficiency of The Banking System in Jordan, PhD Thesis,
Colorado State University, Fort Collins, Colorado, US.
Aigner, DJ, Lovell, CAK & Schmidt, P 1977,‘Formulation and Estimation of
Stochastic Frontier Production Function Models’, Journal of Econometrics, 6,
21–37.
Akel, M 1996, ‘Jordanian Capital Market: Present and Future Outlook’, Seminar on
Asset and Liability Management, November, The Institute of Banking Studies,
Amman. Jordan. Available from http://www.muflehakel.com/part%
20one/Jordanian_Capital_Market.htm.
Al-Delaimi, KS & Al-Ani, AH 2006, ‘Using Data Envelopment Analysis to Measure
Cost Efficiency with an Application on Islamic Banks’, Scientific Journal of
Administrative Development, 4, 134–156.
Al-Faraj, TN, Alidi, AS & Bu-Bshait, KA 1993, ‘Evaluation of Bank Branches by
Means of Data Envelopment Analysis’, International Journal of Operations and
Production Management, 13, 45–52.
Al-Faraj, T, Bu-Bshait, K & Al-Muhammad, W 2006, ‘Evaluating the efficiency of
Saudi commercial banks using data envelopment analysis’, International
Journal of Financial Services Management, 1, 466–477.
Al-Farhan, I 2001, The implications of political and cultural globalization on the
Arab World, Middle East Studies Centre, Amman, Jordan.
Ali, AI & Seiford, LL 1993, ‘The Mathematical Programming Approach to
Efficiency Analysis’, in HO Fried, CAK Lovell & SS Schmidt (eds), The

Bibliography
190
Measurement of Productive Efficiency: Techniques and Applications, Oxford
University Press, New York, 3–67.
Al-Kafrawi, A 1998, ٬ البنوك الإسلامية مركز الاسكندرية للكتاب ٬ الأسكندرية ] Money and Banks
in Islamic system], Egyptian Universities, Dar, Alexandria, Egypt.
AlKhathlan, K & Malik, S 2010, ‘Are Saudi banks efficient? Evidence using data
envelopment analysis (DEA)’, International Journal of Economics and Finance,
2, 53–58.
Al-Muharrami, S 2007,‘The Causes of Productivity Change in GCC Banking
Industry’, International Journal of Productivity and Performance Management,
56, 731–743.
Al-Qeri, MB 1996, Introduction in Banks and Money, Dare Jeddah for publishing,
Jeddah, Saudi Arabia.
Al-Syed, MK 2006, القرار الاستثماري في البنوك الإسلامية ٬المكتب الجامعي الحديث ٬ الإسكندرية ٬
]Investment Decision in Islamic Banks], New University office, Alexandria,
Egypt.
Al-Shammari, M & Salimi, A 1998, ‘Modeling the Operating Efficiency of Banks: A
Nonparametric Methodology’, Logistics Information Management, 11, 5–17.
Al-Tamimi, H 2008, ‘The Use of Data Envelopment Analysis in Banking Institution:
Evidence from the UAE Commercial Banks’, Working Paper Series, American
University of Sharjah.
Altunbas, Y, Evans, L & Molyneux, P 1994, ‘Universal Banks, Ownership and
Efficiency– A Stochastic Frontier Analysis of the German Banking Market’,
Working Paper, Institute of European Finance.
Bibliography
191
Altunbas, Y, Evans, L & Molyneux, P 1995, ‘Universal Banks, Ownership and
Efficiency: A Stochastic Frontier Analysis of the German Banking Market’,
Working Paper 139, Institute of European Finance, University of Wales,
Bangor.
Altunbas, Y, Gardener, EPM, Molyneux, P & Moore, B 2001, ‘Efficiency in
European Banking’, European Economic Review, 45, 1931–1955.
Aly, HY, Grabowski, R, Pasurka, C & Rangan, N 1990, ‘Technical, Scale, and
Allocative Efficiencies in U.S. Banking: An Empirical Investigation’, The
Review of Economics and Statistics, 72, 211–218.
Arifat, SN 1972, ‘Efficiency Estimation of Production Functions’, International
Economic Review, 13, 568–598.
Ariss, R 2008, ‘Financial Liberalization and Bank Efficiency: Evidence from Post-
war Lebanon’, Applied Financial Economics, 18, 931–946.
Ashour, Y H 1998, ٬ فلسطين 1ناشر ٬ ط ٬ إدارة المصارف الإسلامية ٬ بدون [Islamic Banks
Management], Palestine).
Association of Banks in Jordan, Annual Reports, (various issues), Amman, Jordan.
Attaullah, A, Cockerill, T & Le, H 2004, ‘Financial Liberalization and Bank
Efficiency: A Comparative Analysis of India and Pakistan’, Applied
Economics, 36, 1915–1924.
Avkiran, NK 1999a. ‘The Evidence on Efficiency Gains: The Role of Mergers and
the Benefits to the Public’, Journal of Banking and Finance, 23, 991–1013.
————— 1999b. ‘Decomposing the Technical Efficiency of Trading Banks in the

Bibliography
192
Deregulated Period’, 12th Australasian Finance and Banking Conference, 16–
17 December, University of NSW, Sydney, Australia.
————— 2006, ‘Developing Foreign Bank Efficiency Models for DEA Grounded
in Finance Theory’, Socio-Economic Planning Sciences, 40, 275–296.
————— 2000, ‘Rising Productivity of Australian Trading Banks under
Deregulation 1986–1995’, Journal of Economics and Finance, 24, 122–140.
Banker, RD 1984, ‘Estimating most Productive Scale Size using Data Envelopment
Analysis’, European Journal of Operational Research, 17, 35–44.
Banker, RD, Charnes, A & Cooper, WW 1984, ‘Some Models for Estimating
Technical and Scale Efficiencies in Data Envelope Analysis’, Management
Science, 30, 1078–1092.
Barr, SR, Killgo, AK., Siems, FT & Zimmel, S 2002, ‘Evaluating the Productive
Efficiency and Performance of U.S. Commercial Banks, Journal of Managerial
Finance, 28, 3–25.
Batchelor, VB & Gerrard, P 2004, ‘The Productivity Growth of Commercial Banks
in Singapore from 1997–2001’, Working Paper, available
http://www.hicbusiness.org/biz2003proceedings/Valli%20Boobal%20Batchelo
r.pdf
Battese, GE & Coelli, TJ 1988, ‘Prediction of Firm-level Technical Efficiencies with
a Generalised Frontier Production Function and Panel Data’, Journal of
Econometrics, 38, 387–399.
————— 1992, ‘Frontier Production Functions, Technical Efficiency and panel
Data: With Application to Paddy Farmers in India’, Journal of Productivity
Bibliography
193
Analysis, 3, 153–169.
————— 1995, ‘A model for Technical Inefficiency Effects in a Stochastic
Frontier Production Function for Panel Data’, Empirical Economics, 20, 325–
332.
Battese, GE & Corra, GS 1977,‘Estimation of a Production Frontier Model: With
Application to the Pastoral Zone of Eastern Australia’, Australian Journal of
Agricultural Economics, 21, 169–179.
Bauer, PW, Berger, AN & Humphrey, DB 1993, ‘Efficiency and Productivity
Growth in US Banking’, In HO Fried, CAK Lovell & SS Schmidt (eds), The
Measurement of Productive Efficiency: Techniques and Applications, Oxford
University Press, Oxford, 386–413.
Bdour, J & Al-khoury, A 2008, ‘Predicting Change in Bank Efficiency in Jordan: A
Data Envelopment Analysis’, Journal of Accounting and Organizational
Change, 4, 162–181.
Bell, FW & Murphy, NB 1969, ‘Economies of Scale and Division of Labor in
Commercial Banking’, The National Banking Review, 6, 131–139.
Benston, GJ 1964, ‘Economies of Scale and Marginal Costs in Banking Operations’,
The National Banking Review, 2, 507–549.
————— 1965, ‘Branch Banking and Economies of Scale’, Journal of Finance,
20, 312–331.
Benston, GJ, Berger, AN, Hanweck, GA & Humphrey, DB 1983, ‘Economies of
Scale and Scope in Banking’, Proceedings of Conference on Bank Structure
and Competition, May, Federal Reserve Bank of Chicago, 432–461.
Bibliography
194
Benston, GJ, Hanweck, GA & Humphrey, DB 1982, ‘Scale Economies in Banking:
A Restructuring and Reassessment’, Journal of Money, Credit and Banking,
14, 435–456.
Berg, SA, Forsund, FR, Hjalmarsson, L & Suominem, M 1993, ‘Bank Efficiency in
the Nordic Countries’, Journal of Banking and Finance, 17, 371– 388.
Berg, SA, Forsund, FR & Jansen, E 1991, ‘Technical Efficiency of Norwegian
Banks: A Non-Parametric Approach to Efficiency Measurement’, Journal of
Productivity Analysis, 2, 127–142.
Berger, AN 1993, ‘Distribution-free Estimates of Efficiency in the US Banking
Industry and Tests of the Standard Distributional Assumptions’, Journal of
Productivity Analysis, 4, 261–292.
Berger, AN, Hanweck, GA & Humphrey, DB 1987,‘Competitive Viability in
Banking: Scale, Scope, and Product Mix Economies’, Journal of Monetary
Economics, 20, 501–520.
Berger, AN & Humphrey, DB 1997,‘Efficiency of financial Institutions:
International Survey and Directions for Future Research’, European Journal of
Operational Efficiency, 98, 175–212.
Berger, AN, Hunter, WC & Timme, SG 1993b. ‘The Efficiency of Financial
Institutions: A Review and Preview of Research Past, Present, and Future’,
Journal of Banking and Finance, 17, 221–249.
Berger, AN & Mester, LJ 1997,‘Inside the Black Box: What Explains Differences in
the Efficiencies of Financial Institutions?’, Journal of Banking and Finance, 21,
895–947.

Bibliography
195
Bhattacharya, A, Lovell, CAK & Sahay, P 1997,‘The Impact of Liberalisation on the
Productive Efficiency of Indian Commercial Banks’, European Journal of
Operational Research, 98, 332–345.
Bhattacharya, K 2003, ‘How Good is the BankScope database? A cross-validation
exercise with Correction Factors for Market Concentration Measures’, BIS
Working Paper 133, Basel: Bank for International Settlements.
Bonin, JP, Hasan, I & Wachtel, P 2005, ‘Bank Performance, Efficiency and
Ownership in Transition Countries’, Journal of Banking and Finance, 29, 31–
53.
Brynen, R 1992, ‘Economic Crisis and Post-rentier Democratization in the Arab
World: The Case of Jordan’, Canadian Journal of Political Science, 25, 69–97.
Bukh, PND, Berg, SA & Forsund, FR 1995, ‘Banking Efficiency in Nordic
Countries: A Four-Country Malmquist Index Analysis’, Working Paper,
University of Aarhus, Denmark.
Burki, AA & Niazi, GSK 2003, ‘The Effect of Privatization, Competition and
Regulation on Banking Efficiency in Pakistan, 1991–2000’, paper presented to
Regulatory Impact Assessment: Strengthening Regulation Policy and Practice,
Chancellor Conference Center, University of Manchester, Manchester, UK.
Canakci, D 1995, ‘Financial liberalization in the Middle East and North Africa: A
Case Study of Experiences in Egypt, Jordan and Tunisia’, Summer Intern
Project, IMF 1995. Available at SSRN: http://ssrn.com/abstract=1158173.
Caves DW, Christensen, LR & Diewert, WE 1982, ‘The Economic Theory of Index
Numbers and Measurement of Input, Output and Productivity’, Econometrica,
Bibliography
196
50, 1393–1414.
Casu, B, Girardone, C & Molyneux, P 2004, ‘Productivity Change in European
Banking’, Journal of Banking and Finance, 28, 2521–2540.
Casu, B & Molyneux, P 2003, ‘A Comparative Study of Efficiency in European
Banking’, Applied Economics, 35, 1865–1876.
Central Bank of Jordan, Monthly Statistical Bulletin, (various years), Amman
Jordan. Available from
http://www.cbj.gov.jo/pages.php?menu_id=11&local_type=0& local
_id=0&local_details=0&local_details1=0&localsite_branchname=CBJ
————— Annual Report (various issues), Amman, Jordan.
————— Law No.23 of 1971, available from http://www.cbj.gov.jo/pages.php.
————— Law No.28 of 2001, available from http://www.cbj.gov.jo/pages.php?
menu_id=123&local_type=0&local_id=0&local_details=0&local_details1=0&
localsite_branchname=CBJ.
————— 1990, Twenty–Sixth Annual Report 1989, Department of Research and
Studies, Amman, Jordan.
————— Annual Report 2007. Summary of Economic Development, Amman,
Jordan.
————— The Law of Jordanian Banking Sector, available from http://
www.cbj.gov.jo/pages.php?menu_id=178&local_type=0&local_id=0&local_d
etails=0&local_details1=0&localsite_branchname=CBJ.
————— 2007, Objective and Functions of the CBJ, Amman, Jordan.

Bibliography
197
————— 1990, Annual Report, 1990, Department of Research and Studies.
Available fromhttp://dsbb.imf.org/Pages/SDDS/DQAFBase.aspx? ctycode=
JOR&catcode=AAB00.
Chaffai, M 1997,‘Estimating Input-specific Technical Inefficiency: The Case of the
Tunisian Banking Industry’, European Journal of Operational Research, 98,
315–332.
Charnes, A, Cooper, WW & Rhodes, E 1978, ‘Measuring the Efficiency of Decision
Making Units’, European Journal of Operational Research, 2, 429–444.
Chauffour, J 1996, ‘Financial Liberalization and Monetary Reform. International
Monetary Fund (IMF)’, Jordan Strategy Adjustments and Growth, Central
Bank of Jordan, 34–48.
Chen, WY 2001, ‘An Estimation of X-inefficiency in Taiwan’s Banks’, Applied
Finance Economics, 11, 237–242.
Chen, X, Skully, M & Brown, K 2004, ‘Banking Efficiency in China: Application of
DEA to Pre- and Post-deregulation Eras: 1993–2000’, China Economic
Review, 16, 229–245.
Christensen, LR, Jorgenson, DW & Lau, LJ 1973, ‘Transcendental Logarithmic
Production Frontiers’, Review of Economics and Statistics, 55, 29–45.
Cinca, CS, Molinero, CM & Garcia, FC 2004, ‘Behind DEA Efficiency in Financial
Institutions’, Discussion Papers in Accounting and Finance AF02, University
of Southampton.
Cingi, S & Tarim, A 2000, ‘Turk Banka Sisteminde Performans Olcumu: DEA–
Malmquist TFP Endeksi Uygulamasi, Turkiye Bankalar Birligi Arastirma

Bibliography
198
Tebligleri Serisi, Eylul, 2000–02.
Coelli, T 1996, ‘A guide to DEAP version 2.1: A Data Envelopment Analysis
(Computer) Program’, CEPA Working Paper, 96/08. Department of
Economics, University of New England, Australia.
Coelli, TJ, Rao, DSP, & Battase, GE 1998, An Introduction to Efficiency and
Productivity Analysis, Kluwer Academic Publishers, Boston, Massachusetts.
Coelli, T & Perelman, S 1999, ‘A Comparison of Parametric and Non-parametric
Distance Functions: With Application to European Railways’, European
Journal of Operation Research, 117, 326–39.
Coelli, TJ, Rao, DSP, O’Donnell, CJ & Battese, GE 2005, An Introduction to
Efficiency and Productivity Analysis (2nd ed), Kluwer Academic Publishers,
Boston, Massachusetts.
Colwell, R & Davis, E 1992, ‘Output and Productivity in Banking’, Scandinavian
Journal of Economics, 94, 111–129.
Cooper, WW, Seiford, LM & Tone, K 2000, Data Envelopment Analysis; a
comprehensive text with models, application, references and DEA–Solver
software, Kluwer Academic Publishers, Boston.
Darrat, AF, Topuz, C & Yousef, T 2002). ‘Assessing Cost and Technical Efficiency
of Banks in Kuwait’, paper presented at the ERF 8th Annual Conference,
Cairo, Egypt.
————— 2003, ‘Assessing Bank Efficiency in an Emerging Market: The Kuwaiti
Experience in the 1990s’, Studies in Economics and Finance, 21, 1–21.
Bibliography
199
Daradkah, D & Miani, S 2008, ‘The Banking Industry in Jordan’, Transition Studies
Review, 15, pp, 171–191.
Das, A & Gho, S 2006, ‘Financial Deregulation and Efficiency: An Empirical
Analysis of Indian Banks during the Post Reform Period’, Review of Financial
Economics, 15, 193–221.
Delis, MD, Koutsomanoli-Filippaki, A, Staikouras, C & Gerogiannaki, K 2009,
‘Evaluating Cost and Profit Efficiency: A Comparison of Parametric and
Nonparametric Methodologies’, Applied Financial Economics, 19, 191–202.
Department of Statistics [Jordan] & Macro International Inc. 2008, Jordan
Population and Family Health Survey 2007, Department of Statistics & Macro
International Inc., Calverton, Maryland.
Deprins, D, Simar, L & Tulkens, H 1984, ‘Measuring Labor Inefficiency in Post
Offices’, in M Marchand, P Pestieau & H Tulkens (eds), The Performance of
Public Enterprises: Concepts and Measurements, 243–267.
Dong, Y 2009, Cost Efficiency in the Chinese Banking Sector: A Comparison of
Parametric and Non-parametric Methodologies, PhD Thesis, Loughborough
University, UK.
Dyson, RG, Allen R, Camanho, AS, Podinovski, VV, Sarrico, CS & Shale EA 2001,
‘Pitfalls and Protocols in DEA’, European Journal of Operational Research,
132, 245–59.
Dyson, RG, Thanassoulis, E & Boussofiane, A 1998, ‘Data Envelopment Analysis’,
Warwick Business School. Retrieved 21 April 2006 from http://www.
csv.warwick.ac.uk/~bsrlu/dea/deat/deat1.htm.
Bibliography
200
Ebrahim, MS & Joo, TK 2001, ‘Islamic Banking in Brunei Darussalam’,
International Journal of Social Economics, 28, 314–337.
‘Economic Trends and Impacts: Banking Sector Lending Behaviour and Efficiency
in Selected ESCWA Member Countries’, United Nations, 2005, New York, 3.
Edgar, RJ, Hatch, JH & Lewis, MK 1971, ‘Economies of Scale in Australian
Banking 1947–1968’, Economic Record, 47, 17–37.
Ehrmann, M, Gambacorta, L & Martinez-Pages, J 2001, ‘Financial Systems and the
Role of Banks in Monetary Policy Transmission in the Euro Area’, Discussion
Paper 432, Bank of Italy, Italy.
Eisenbeis, RA, Ferrier, GD & Kwan, SH 1996, ‘An Empirical Analysis of the
Informativeness of Programming and SFA Efficiency Scores: Efficiency and
Bank Performance’, Working Paper, University of North Carolina, Chapel Hill,
North Carolina.
————— 1997,‘The Informativeness of Linear Programming and Econometric
Efficiency Scores: An Analysis Using U.S. Banking Data’, working paper,
Bureau of Business and Economic Research, University of Arkansas.
ElSafti, A 2007,Financial Sector Reforms in the Arab Countries, Arab Monetary
Fund, Abu Dhabi, UAE.
Elyasiani, E & Mehdian, S 1995, ‘The Comparative Efficiency Performance of Small
and Large US. Commercial Banks in the Pre- and Post-deregulated Eras’,
Applied Economics, 27, 385–396.
Emrouznejad, A, Parker, B, & Tavares G 2008, Evaluation of Research in Efficiency
and Productivity: A Survey and Analysis of the First 30 years of Scholarly

Bibliography
201
Literature in DEA, Journal of Socio-Economics Planning Science, 42, 151–
157.
Färe, R, Grosskopf, S & Logan, J 1983, ‘The Relative Efficiency of Illinois
Electronic Utilities’, Resources and Energy, 5, 349–367.
Färe, R, Grosskopf, S & Lovell, CAK 1985, The Measurement of Efficiency of
Production, Kluwer-Nijhoff Publishing, Boston, Massachusetts.
————— 1994a. Production Frontiers, Cambridge University Press, Cambridge.
Färe, R, Grosskopf, S, Norris, M & Zhang, Z 1994, ‘Productivity Growth, Technical
Progress, and Efficiency Change in Industrialized Countries’, American
Economic Review, 84, 66–83.
Färe, R, Grosskopf, S, Yaisawarng, S, Li, S K & Wang, Z 1990, ‘Productivity
Growth in Illinois Electric Utilities’, Resources and Energy, 12, 383–398.
Farrell, MJ 1957,‘The Measurement of Productive Efficiency’, Journal of the Royal
Statistical Society, 120, 253–281.
Favero, CA & Papi, L 1995, ‘Technical Efficiency and Scale Efficiency in the Italian
Banking Sector: A Non-Parametric Approach’, Applied Economics, 27, 385–
395.
Fernandez-Castro, A & Smith, P 1994, ‘Towards a General Non-Parametric Model
of /, Omega, 22, 237–249.
Ferrier, GD & Lovell, CAK 1990, ‘Measuring Cost Efficiency in Banking:
Econometric and Linear Programming Evidence’, Journal of Econometrics, 46,
229–245.
Bibliography
202
Fried, HO, Lovell, CAK & Eechaut, PV 1993, ‘Evaluating the Performance of U.S
Credit Unions’, Journal of Banking and Finance, 17, 251–265.
Fukuyama, H, 1993, ‘Technical and Scale Efficiency of Japanese Commercial
Banks: A Non-Parametric Approach’, Applied Economics, 25, 1101–1112.
————— 1995, ‘Measuring Efficiency and Productivity Growth in Japanese
Banking: A Non-Parametric Frontier Approach’, Applied Financial
Economics, 5, 95–117.
Ghasan A 1993, Banks Management, Dar Saffa for printing and publishing, Amman,
Jordan.
Ghayad, R 2008, ‘Corporate Governance and the Global Performance of Islamic
Banks’, Humanomics, 24, 207–216.
Gilbert, RA & Wilson, PW 1998, ‘Effects of Deregulation on the Productivity of
Korean Banks’, Journal of Economics and Business, 50, 133–155.
Gilligan, T & Smirlock, ML 1984, ‘An Empirical Study of Joint Production and
Scale in Commercial Banking’, Journal of Banking and Finance, 8, 67–78.
Gilligan, T, Smirlock, M & Marshall, W 1984, ‘Scale and Scope Economies in the
Multi-product Banking Firm’, Journal of Monetary Economies, 13, 393–405.
Goldberg, LG & Rai, A 1996, ‘The Structure–Performance Relationship for
European Banking’, Journal of Banking and Finance, 20, 745–771.
Grabowski, R, Rangan, N & Rezvanian, R 1994, ‘The Effect of Deregulation on the
Efficiency of US Banking Firms’, Journal of Economics and Business, 46, 39–
54.
Bibliography
203
Grifell-Tatje, E, & Lovell, CAK 1996, ‘Deregulation and Productivity Decline: The
Case of Spanish Savings Banks’, European Economic Review, 40, 1281–1303.
Grigorian, DA & Manole, V 2006, ‘Determinants in Commercial Bank Performance
in Transition: An Application of Data Envelopment Analysis’, Comparative
Economic Studies, 48, 497–522.
Harrigan, J, El-Said, H & Wang, C 2006, The IMF and the World Bank in Jordan: A
Case of Over Optimism and Elusive Growth’, The Review of International
Organizations, 1, 263–292.
Hassan, M, Al-Sharkas, A & Samad, A 2004, ‘An Empirical Study of Relative
Efficiency of the Banking Industry in Bahrain’, Studies in Economics and
Finance, 22, 40–69.
Havrylchyk, O 2006, ‘Efficiency of the Polish banking Industry: Foreign Versus
Domestic Banks’, Journal of Banking and Finance, 30, 1975–1996.
Hemoud, S 1982, .٬ تطور الاعمال المصرفية بما يتفق والشريعة الاسلامية ٬ مطبعة 1982حمود ٬ س(
-Al ,[Banking Works Development Match with Islamic Law] الشرق ٬ عمان
Mashreq Press, Amman, Jordan).
Hunter, WC & Timme, SG 1986, ‘Technical Change, Organizational Form, and the
Structure of Bank Production’, Journal of Money, Credit and Banking, 18,
152–166.
Isik, I, Gunduz, L & Omran, M 2004, ‘Managerial and Scale Efficiency in the
MENA Banking: A Panel Study of the Jordanian Banking Sector’, Working
Paper Series. Available at http://papers.ssrn.com/sol3/papers.
cfm?abstract_id=494224.

Bibliography
204
Isik, I & Hssan, MK 2002a. ‘Cost and Profit Efficiency of the Turkish banking
Sector Industry: An Empirical Investigation’, The Financial Review, 37, 257–
280.
————— 2002b. ‘Technical, Scale and Allocative Efficiencies of Turkish
Banking Industry’, Journal of Banking and Finance, 26, 719–766.
Isik, I & Uysal, D 2006, ‘The Sources of Productivity Growth in Turkish Banks by
Ownership: The Initial Responses of Public, Private and Foreign Banks to
Liberalization’, Turkish Studies, 7, 365–403.
Jackson, PM & Fethi, MD 2000, ‘Evaluating the Technical Efficiency of Turkish
Commercial Banks: An Application of DEA and Tobit Analysis’, Efficiency
and Productivity Research Unit, University of Leicester, UK. Available at
https://lra.le.ac.uk:443/bitstream/2381/369 /1/dpno5.pdf.
Jackson, PM, Fethi, MD & Inal, G 1998, ‘Efficiency and Productivity Growth in the
Turkish Commercial Banking Sector: A Non-parametric Approach’,
Proceedings of the European Symposium on DEA – Recent Developments and
Applications, 16–18 October, Germany. Available at
https://lra.le.ac.uk/bitstream/2381/367/1/dpno1.pdf
Jordan Ministry of Planning 1990, Five Y ear Plan, 1986–90, Amman, Jordan.
Kalish, L & Gilbert, RA 1973, ‘An Analysis of Efficiency of Scale and
Organizational Form in Commercial Banking’, Journal of Industrial
Economics, 21, 292–307.
Kanaan, TH 2001, ‘Impact of the Jordan–USA Free Trade Agreement on the
Banking and Financial Services Sector’, The Arab Bank Review, 3, 45–51.

Bibliography
205
Karim, MZA 2001, ‘Comparative Bank Efficiency across Select ASEAN Countries’,
ASEAN Economic Bulletin, 18, 289–304.
Kasman, A 2002, ‘Cost Efficiency, Scale Economies, and Technological Progress in
Turkish Banking’, Central Bank Review, 2, 1–20.
Khalaf, FH 2006, Islamic Banks, Jadara Universal Books, Amman, Jordan.
Kiyota H 2009, Confronting the Global Financial Crises: Bank Efficiency,
Profitability and Banking System in Africa,’ The African Economic
Conference, Addis Ababa, Ethiopia.
Kolari, J & Zardhooki, A 1987, Bank Cost, Structure and Performance, Lexington
Books, Lexington, Massachusetts.
Kourouche, K 2008, Measuring Efficiency and Productivity in the Australian
Banking Sector, PhD Thesis, University of Western Sydney, NSW, Australia.
Kourouche, K & Paul, S 2008, ‘The Impact of Regulation on the Performance of the
Banking Industry in Australia and Future Policy Directions’, International
Journal of Applied Business and Economic Research, 6, 1–35.
Kraft, E & Tirtiroglu, D 1998, ‘Bank Efficiency in Croatia: A Stochastic-Frontier
Analysis’, Journal of Comparative Economics, 26, 282–300.
Krishnasamy, G, Ridzwa, AH & Perumal, V 2004, ‘Malaysian Post Merger Banks’
Productivity: Application of Malmquist Productivity Index’, Managerial
Finance, 30, 63–74.
Kumbhakar, SC & Lovell, CAK, eds 2000, Stochastic Frontier Analysis, Cambridge
University Press.
Bibliography
206
Lawrence, C & Shay, RP 1985, ‘Technology and Financial Intermediation in the
Multiproduct Banking Firm: An Econometric Study of United States Banks,
1979–1982’, Working Paper FB-85-11, Columbia First Boston Series in
Money, Economics and Finance.
Leong, WH & Dollery, B 2002, The Productive Efficiency of Singapore Banks: an
Application and Extension of the Barr et al. (1999) Approach’, Faculty of
Economics, Business & Law, University of New England.
Leong, WH, Dollery, B & Coelli, T 2002, ‘Measuring the Technical Efficiency of
Banks in Singapore for the Period 1993 to 1999: An Application and Extension
of the Bauer et al. (1997) Technique’, Working Paper 2002/10, University of
New England Working Paper Series in Economics, 1–28.
Lightener, JE & Lovell, CAK 1998, ‘The Impact of Financial Liberalisation on the
Performance of Thai banks’, Journal of Economics and Business, 50, 114–31.
Lim, G H & Chu-Chun-Lin, S 1998, ‘Efficiency and Returns: An Empirical Study of
Six Singapore-listed Banks’, Asia Pacific Journal of Finance, 1, 191–207.
Limam, I 2001, ‘Measuring Technical Efficiency of Kuwaiti Banks’, Arab Planning
Institute-Kuwait: Working Paper Series. Available at http://www.arab-
api.org/wps/wps0101.htm.
Longbrake, WA & Haslem, JA 1975, ‘Productive Efficiency in Commercial
Banking’, Journal of Money, Credit, and Banking, 7, 317–330.
Lovell, CAK 1993, ‘Production Frontiers and Productive Efficiency’, in HO Fried,,
CAK Lovell & SS Schmidt (eds), The Measurement of Productive Efficiency:
Techniques and Applications, Oxford University Press, New York, 3–67.
Bibliography
207
————— 1994, ‘Linear Programming Approaches to the Measurement and
Analysis of Productive Efficiency’, Top, 2, 175–248.
Maghyereh, A 2004, ‘The Effect of Financial Liberalization on the Efficiency of
Financial Institutions: The Case of Jordanian Commercial Banks’, Working
Paper Series. SSRN: http://ssrn.com/abstract=436420
Mahdi, FA 2001, ‘Economic Growth in Jordan: Recent Trends, Outlook for 2001’,
Arab Bank Review, 3, 6–20.
Malmquist, S 1953, ‘Index Numbers and Indifference Curves’, Trabajos de
Estatistica, 4, 209–42.
Mashaqbeh, A 2005, ‘National Education and the Political System of Jordan’, Dar
Al-Hamed for Publication and Distribution, Amman, Jordan.
Matthews, K & Mahadzir I 2006, ‘Efficiency and Productivity Growth of Domestic
and Foreign Commercial Banks in Malaysia’, Cardiff Economics Working
Papers No. E2006/2.
Melhim, MF 2006, اثر تواجد البنوك الاجنبية على القطاع المصرفي الاردني ٬ مجلة البنوك في تقييم
The Banking Journal in ,[’Evaluation of Foreign Banks in Jordan‘]الاردن ٬ مجلد
Jordan, 25, 19–25).
Miani, S & Daradkah, D 2008, ‘The Banking Industry in Jordan’, Transition Studies
Review, 15 171–191.
Miller, SM & Noulas, AG 1996, ‘The Technical Efficiency of Large Bank
Production’, Journal of Banking and Finance, 20, 495–509.
Mostafa, M 2007a. ‘Modeling the Efficiency of GCC banks: A Data Envelopment
Bibliography
208
Analysis Approach’, International Journal of Productivity and Performance
Management, 56, 623–643.
————— 2007b. ‘Benchmarking Top Arab Banks’ Efficiency through Efficient
Frontier Analysis’, Industrial Management & Data System, 107, 802–823.
Mouhsein, AI 1994, Bank and other Financial Institution in Jordan, Amman, Jordan.
Mukherjee, K, Ray, SC & Miller, SM 2001, ‘Productivity Growth in Large US
Commercial Banks: The Initial Post-Deregulation Experience’, Journal of
Banking and Finance, 25, 913–939.
Murjan, W & Ruza, C 2002, ‘The Competitive Nature of the Arab Middle Eastern
Banking Market, International A tlantic Economic Review, 8, 267–274.
Murray, JD & White, RW 1983, ‘Economies of Scale and Economies of Scope in
Multiproduct Financial Institutions: A Study of British Columbia Credit
Unions’, Journal of Finance, 38, 887–902.
Nathan, A & Neave, H 1989, ‘Competition and Contestability in Canada’s Financial
System: Empirical Results’, Canadian Journal of Economics, 22, 576–94.
Ncube, M 2009, ‘Efficiency of the Banking Sector in South Africa’, The African
Economic Conference, 11–13 November, United Nation Conference, Addis
Ababa, Ethiopia.
Neal, P 2004, ‘X-efficiency and Productivity Change in Australian Banking’,
Australian Economic Papers, 43, 174–91.
Noulas, AG 2001, ‘Deregulation and Operating Efficiency: The Case of the Greek
Banks’, Managerial Finance, 27, 35–47.
Bibliography
209
Paul, S & Kourouche, K 2008, ‘Regulatory Policy and the Efficiency of the Banking
Sector in Australia’, Australian Economic Review, 41, 260–271.
Perez, F & Quesada, J 1994, ‘Efficiency and Banking Strategies in Spain’, In D Fair
& R Raymond (eds), The Competitiveness of Financial Institutions and Centres
in Europe, Financial and Monetary Policy Studies 28, Kluwer Academic
Publishers, Dordrecht, 135–149.
Powers, JA 1969, ‘Branch Versus Unit Banking: Output and Cost Economies’,
Southern Economic Review, 36, 153–164.
Randhawa, DS & Lim, GH 2005, ‘Competition, Liberalization and Efficiency:
Evidence from a Two-stage Banking Model on Banks in Hong Kong and
Singapore’, Managerial Finance, 31, 52–77.
Rangan, N, Zardkoohi, A, Kolari, J & Fraser, D 1989, ‘Production Costs for
Consolidated Multibank Holding Companies Compared to one-bank
Organizational Forms’, Journal of Economics and Business, 41, 317–325.
Reynolds, D & Thompson, GM 2002, ‘Multiunit Restaurant-productivity
Assessment: A Test of Data Envelopment Analysis’, The Centre for
Hospitality Research, Cornell University, Cornell.
Rezvanian, R, & Mehdian, S 2002, ‘An Examination of cost Structure and
Production Performance of Conventional Banks in Singapore’, Journal of
Banking and Finance, 26, 79–98.
Rezvanian, R, Rao N & Mehdian S 2008, ‘Efficiency Change, Technological
Progress and Productivity Growth of Private, Public and Foreign Banks in
India: Evidence from the Post-liberalization Era’, Applied Financial

Bibliography
210
Economics, 18, 701–713.
Rihani, B 2000, ‘Financing and Investments Methods in Islamic Banks’, Journal of
Banks in Jordan, 8, 14–28.
Saleh, AS & Zeitun, R 2006, ‘Islamic Banking Performance in the Middle East: A
Case Study of Jordan’, Working Paper 06–21, Department of Economics,
University of Wollongong.
Sathye, M 2001, ‘X-efficiency in Australian Banking: An Empirical Investigation’,
Journal of Banking and Finance, 25, 613–30.
————— 2002, ‘Measuring Productivity Changes in Australian Banking: An
Application of Malmquist indices’, Managerial Finance, 28, 48–59.
Sealey, CW & Lindley, JT 1977. ‘Inputs, Outputs and a Theory of Production and
Cost at Depositary Financial Institutions’, The Journal of Finance, 32, 1251–
65.
Seiford, LM 1996, ‘Data Envelopment Analysis: The Evolution of the State of the
Art (1978–1995)’, Journal of Productivity Analysis, 7, 99–138.
Seiford, LM & Thrall, RM 1990, ‘Recent Developments in DEA: the Mathematical
Approach to Frontier Analysis’, Journal of Econometrics, 46, 7–38.
Seiford, LM & Zhu, J 1999). ‘An Investigation of Returns to Scale under Data
Envelopment Analysis’,Omega 27, 1–11.
Seyam, W & Seyam, A 1999, ‘Jordan Economy and Globalization Challenges’, Fifth
Economy Conference, Yarmouk University, Irbid, Jordan.
Shaffer, S 1981, ‘Empirical Test for Competitive Conduct’, Banking Studies
Bibliography
211
Department, Federal Reserve Bank of New York.
————— 1982, ‘Non-structural Test for Competition in Financial Markets’, Bank
Structure and Competition, Conference Proceedings, Federal Reserve Bank of
Chicago, 225–243.
Shehada, M 1978, ٬ تجربة البنك الاسلامي الاردني ٬ منشورات البنك الاسلامي الاردني ٬ عمان
[Jordan Islamic bank experience], Jordan Islamic bank publications, Amman,
Jordan).
Shehata, SI 1997, Islamic Banks, Dar Al- shoriqe, Jeddah, Saudi Arabia.
Sowan, H 2000, Basics of Islamic Banking, Dar Wael for Publishing, Amman,
Jordan.
Srairi, SA 2010, ‘Cost and Profit Efficiency of Conventional and Islamic Banks in
GCC Countries’, Journal of Productivity Analysis, 34, 45–62.
Sturm, J & Williams, B 2002, ‘Deregulation, Entry of Foreign Banks and Bank
Efficiency in Australia’, CESifo Working Paper 816/9. Retrieved 2 March
2006 http://www.CESifo.de.
Swan, PL, & Harper, IR 1982, ‘Economies of Scale in Australian Branch Banking’,
AGSM Working Paper Series 82–021, November, Australia.
Taylor, WM, Thompson, RG Thrall, RM & Dharmapala, PS 1997. ‘DEA/AR
Efficiency and Profitability of Mexican bANks: A Total Income Model’,
European Journal of Operational Research, 98, 332–342.
Thaher, AH & Sa’adeh, MY 2000, Financial Institutions Accounting, Tareq
University services, Amman, Jordan.

Bibliography
212
Tulkens, H 1993, ‘On FDH Efficiency Analysis: Some Methodological Issues and
Applications to Retail Banking, Courts, and Urban Transit’, Journal of
Productivity Analysis, 4, 183–210.
Vossen, R 1999, ‘Market Power, Industrial Concentration and Innovative Activity’,
Review of Industrial Organization, 15, 367-378.
Weill, L 2003, ‘Banking Efficiency in Transition Economies: The Role of Foreign
Ownership’, Economics of Transition, 11, 569–592.
————— 2004, ‘Measuring cost Efficiency in European Banking: A Comparison
of Frontier Techniques’, Journal of Productivity Analysis, 21, 133–152.
Weller, CE 2000, ‘Financial Liberalization, Multinational Banks and Credit Supply:
The Case of Poland,’ International Review of Applied Economics, 14, 193–
210.
Wheelock, DC & Wilson, PW 1995, ‘Evaluating the Efficiency of Commercial
Banks: Does Our View of what Banks Do Matter?’, Review, Federal Reserve
Bank of St Louis, 77, 39–52.
————— 1999, ‘Technical Progress, Inefficiency and / in U.S. Banking 1984–
1993’, Journal of Money, Credit and Banking, 31, 212–234.
Wu, D, Yang, Z, & Liang, L 2006, ‘Using DEA-neural Network Approach to
Evaluate Branch Efficiency of a Large Canadian Bank’, Expert Systems with
Applications, 31, 108–115.
Yeh QJ, 1996, ‘The Application of Data Envelopment Analysis in Conjunction with
Financial Ratios for Bank Performance Evaluation’, The Journal of the
Operational Research Society, 47, 980–988.
Bibliography
213
Yildirim, C 2002, ‘Evolution of Banking Efficiency within an Unstable
Macroeconomic Environment: The Case of Turkish Commercial Banking,
Applied Economics, 34, 2289–2301.
Yolalan, R 1996, ‘Turk Bankacilik Sektoru icin Goreli Mali Performans Olcumu’,
Turkiye Bankalar Birligi Bankacilar Dergisi, 19, 35–40.
Zaghloul, IS 1992, ‘Jordanian Remittances and their Effect on the Jordan Economy’,
Research and Studies Department, Central Bank of Jordan, Amman, Jordan.
Zaim, O 1995, ‘The Effect of Financial Liberalization on the Efficiency of Turkish
Commercial Banks’, Applied Financial Economics, 5, 257–264.