Embed Size (px)
Citation preview

EFFECTS OF WHITE LIGHT EMITTING DIODES
AND HALOGEN LAMP ON SPECTROSCOPIC
MEASUREMENT OF SALA MANGO INTRINSIC
QUALITIES
CHIONG WAN LONG
UNIVERSITI SAINS MALAYSIA
2017

EFFECTS OF WHITE LIGHT EMITTING DIODES
AND HALOGEN LAMP ON SPECTROSCOPIC
MEASUREMENT OF SALA MANGO INTRINSIC
QUALITIES
by
CHIONG WAN LONG
Thesis submitted in fulfilment of the requirements
for the Degree of
Master of Science
May 2017

ii
ACKNOWLEDGMENT
May all the glory and praise go to God the Almighty One for His grace and blessing
upon completion of this thesis. He is the source of knowledge and wisdom and from
Him, I received the strength to endure the whole research journey.
This thesis is possible with help and support from many individuals. I would like
to extend my sincerity to each and every one of them.
First and foremost, I would like to thank my supervisor, Dr. Ahmad Fairuz Omar
for his advice, support and encouragement throughout the research. Being more than a
supervisor, he is a mentor and great role-model especially his great passion in research
and education areas. Besides, special thanks to my co-supervisor, Professor Dr. Mohd.
Zubir Mat Jafri for his advice and at the same time, being caring and sensitive to
student’s needs.
I would like to acknowledge the support of Federal Agriculture Marketing
Authority (FAMA) (Perlis Branch) for their assistance in getting Sala Mango samples
and Department of Agriculture particularly Mr. Haji Ahmad Puat bin Mat Kassim for
sharing of his expertise regarding Sala Mango selection.
I am extremely thankful to Ministry of Higher Education and Universiti Sains
Malaysia for financial support under MyBrain 15 scholarship and USM Fellowship
scheme respectively.
I am also deeply indebted to lab assistants and technicians especially Mr. Mohtar
Sabdin, Mr. Muhammad Anis Ibnu Hajar and Mr. Mohd. Noor Fakarruddin Abdullah
for their full assistance while using the instruments and designing the lighting systems.

iii
To my friends Ms. Ting Hie Kwang, Ms. Joice Tham Sin Yi and Ms. Then Li
Yee, I am also thankful for your lending hand during experimental works especially
when I have only limited time to finish the experiment.
Last but not least, to my beloved family and friends, I am blessed to have all of
you in my life and thank you so much for the encouragement words and advices when I
faced difficulties in my journey.

iv
TABLE OF CONTENTS
ACKNOWLEDGEMENT ii
TABLE OF CONTENTS iv
LIST OF TABLES viii
LIST OF FIGURES x
LIST OF SYMBOLS AND ABBREVIATIONS xiii
ABSTRAK xiv
ABSTRACT xv
CHAPTER 1 – INTRODUCTION
1.1 Fruit Quality 1
1.2 Non-destructive Quality Measurement 3
1.3 Problem Statement 5
1.4 Research Objectives 6
1.5 Scope of the Research 6
1.6 Outline of the Thesis 7
CHAPTER 2 –THEORY AND LITERATURE REVIEW
2.1 Principle of Spectroscopy 8
2.2 Spectroscopic System 10
2.3 Lighting Fundamentals 11
2.3.1 Lighting Evolution 11
2.3.2 Light Emitting Diode 13

v
2.3.3 Application of White LED in Solid State Lighting 15
2.4 Chemometrics 16
2.4.1 Calibration and Prediction 17
2.4.2 Calibration Transfer 18
2.5 Fruit 19
2.5.1 Fruit Development and Physiology 20
2.5.2 Fruit Internal Quality 22
2.5.3 Optical Properties of Fruit 23
2.5.4 Colour and Appearance 24
2.5.5 Mango Overview 25
2.6 Application of Spectroscopy in Fruit Quality Analysis 26
CHAPTER 3 – METHODOLOGY
3.1 Overview of Research Methodology 29
3.2 Jaz Spectrometer 30
3.3 LED Lighting Panel Designation 32
3.4 Preliminary Study Using Colour Papers 33
3.4.1 Experimental Setup 33
3.4.2 Spectral Analysis 35
3.5 Real Case Study of Sala Mango 35
3.5.1 Fruit Material 36
3.5.2 Reflectance Measurement 37
3.5.3 Intrinsic Qualities Measurement 38

vi
3.5.4 Data Processing
39
CHAPTER 4 – RESULTS AND DISCUSSION
4.1 White Diffuse Reflectance 42
4.2 Influence of LED CCT in Visible Spectroscopic Observation of
RGB Sample
44
4.3 VIS Spectroscopic Measurement of Sala Mango Intrinsic
Properties under Different Lightings
49
4.3.1 VIS Spectroscopic Analysis of Sala Mango 50
4.3.2 Calibration Models for pH and SSC 53
4.3.2(a) Acidity 54
4.3.2(b) Soluble Solids Content 61
4.3.2(c) Summary 69
4.4 Direct Calibration Transfer of Sala Mango Visible Spectra
between Different Light Source
72
4.4.1 D35 as Master lighting 73
4.4.2 D45 as Master lighting 75
4.4.3 D57 as Master lighting 78
4.4.4 Halogen lamp as Master lighting
80
4.4.5 Summary 81
CHAPTER 5 – CONCLUSION AND FUTURE RECOMMENDATIONS
5.1 Conclusion 84
5.2 Future Recommendations 87

vii
REFERENCES 88

viii
LIST OF TABLES
Page
Table 1.1 Components of qualities 2
Table 1.2 Non-destructive methodologies in Quality
Measurement
3
Table 3.1 LED specifications 32
Table 3.2 Different Groups of Sala Mango Sample 36
Table 3.3 Properties of Sala Mango for 52 Samples 37
Table 4.1 Summary of Preliminary Study of Colour Papers 48
Table 4.2 Calibration and prediction results of Sala Mango
acidity through reflectance measurement under D35
lighting
55
Table 4.3 Calibration and prediction results of Sala Mango
acidity through reflectance measurement under D45
lighting
56
Table 4.4 Calibration and prediction results of Sala Mango
acidity through reflectance measurement under D57
lighting
58
Table 4.5 Calibration and prediction results of Sala Mango
acidity through reflectance measurement under
halogen lamp lighting
60
Table 4.6 Calibration and prediction results of Sala Mango
SSC through reflectance measurement under D35
lighting
62

ix
Table 4.7 Calibration and prediction results of Sala Mango
SSC through reflectance measurement under D45
lighting
64
Table 4.8 Calibration and prediction results of Sala Mango
SSC through reflectance measurement under D57
lighting
65
Table 4.9 Calibration and prediction results of Sala Mango
SSC through reflectance measurement under
halogen lamp lighting
67
Table 4.10 Summary of best predictive model for acidity
prediction of Sala Mango
69
Table 4.11 Summary of best predictive model for SSC
prediction of Sala Mango
72
Table 4.12 Calibration and prediction results after Calibration
Transfer using D35 as Master Lighting
74
Table 4.13 Calibration and prediction results after Calibration
Transfer using D45 as Master Lighting
76
Table 4.14 Calibration and prediction results after Calibration
Transfer using D57 as Master Lighting
78
Table 4.15 Calibration and prediction results after Calibration
Transfer using halogen lamp as Master Lighting
81
Table 4.16 Summary of best predictive model results after
direct calibration procedure between master and
slave lightings
83

x
LIST OF FIGURES
Page
Figure 1.1 Light Source Relative Irradiance vs. Spectral
Content
5
Figure 2.1 The electromagnetic spectrum 9
Figure 2.2 Schematic diagram on a spectroscopic system 10
Figure 2.3 Fiber optic cable which consists of core, cladding
and a supportive jacket. Refractive index of
cladding, ncladding is lower than refractive index of
inner core, ncore
11
Figure 2.4 Timeline of lighting evolution 12
Figure 2.5 A light-emitting diode 13
Figure 2.6 Correlated colour temperature scale and
illumination of white LEDs
14
Figure 2.7 Chemometric analyser consists of three linked and
interacting components
17
Figure 2.8 Interaction between Light and Fruit 23
Figure 3.1 Methodology flow of experiment 29
Figure 3.2 Jaz Spectrometer 30
Figure 3.3 Sampling System Overview by Jaz Spectrometer 31
Figure 3.4 (a) LED panel board and (b) cement type resistor 32
Figure 3.5 Colour series used in this study 33
Figure 3.6 Experimental setup for reflectance measurement of
colour papers using Jaz Spectrometer
34

xi
Figure 3.7 Green colour series (Non-Glossy) reflectance
spectra under D45 illumination(left) and scatter
plot of reflectance versus green values (right) with
spectral gradient bolded in the equation
35
Figure 3.8 Sala Mango samples 36
Figure 3.9 Instrumentations used in intrinsic quality
measurement; (a) refractometer and (b) pH meter
39
Figure 3.10 Direct Calibration Transfer Procedure 40
Figure 4.1 Spectra information showing (a) intensity of
halogen lamp and (b) reflectance of 3 LEDs with
halogen lamp as reference light source
43
Figure 4.2 Spectral gradient of red colour series for (a) glossy
and (b) non-glossy surfaces with peak wavelength
in bracket
44
Figure 4.3 Spectral gradients of green colour series for (a)
glossy and (b) non-glossy surfaces with peak
wavelength in bracket
46
Figure 4.4 Spectral gradient of blue colour series for (a)
glossy and (b) non-glossy surfaces with peak
wavelength in bracket
47
Figure 4.5 Reflectance spectra for Sala Mango Group 2 with
sample coding from 10 to 19 under different light
sources
51
Figure 4.6 Reflectance spectra for Sala Mango Group 4 with
sample coding from 30 to 38 under different light
sources
51
Figure 4.7 Reflectance spectra for Sala Mango Group 5 with
sample coding from 42 to 52 under different light
sources
52

xii
Figure 4.8 Scatter plots of mango acidity prediction using
D35 as light source
56
Figure 4.9 Scatter plots of mango acidity prediction using
D45 as light source
57
Figure 4.10 Scatter plots of mango acidity prediction using
D57 as light source
59
Figure 4.11 Scatter plots of mango acidity prediction using
halogen lamp as light source
61
Figure 4.12 Scatter plots of mango SSC prediction using D35
as light source
63
Figure 4.13 Scatter plots of mango SSC prediction using D45
as light source
65
Figure 4.14 Scatter plots of mango SSC prediction using D57
as light source
67
Figure 4.15 Scatter plots of mango SSC prediction using
halogen lamp as light source
68
Figure 4.16 Overview graph of 12 model performances for
acidity prediction of Sala Mango
70
Figure 4.17 Overview graph of 12 model performance for SSC
prediction of Sala Mango
71
Figure 4.18 Overview of model performance of different light
sources
82
Figure 4.19 Illustration of forward and backward directions of
direct calibration transfer
82

xiii
LIST OF SYMBOLS AND ABBREVIATIONS
CCT Correlated colour temperature
CO2 Carbon dioxide
CRI Colour rendering index
GaN Gallium nitride
Hg Mercury
InGaN Indium gallium nitride
K Kelvin
LED Light Emitting Diode
MLR Multiple Linear Regression
NIR Near infrared
R Correlation coefficient
R2
Coefficient of determination
RH Relative humidity
RMSEC Root mean square error of calibration
RMSEP Root mean square error of prediction
SO2 Sulphur dioxide
SSC Soluble solids content
SSC/TA Soluble solids to acid ratio
SD Standard deviation
TA Titratable acidity
U Uranium
UV Ultraviolet
VIS Visible

xiv
KESAN DIOD PEMANCAR CAHAYA PUTIH DAN LAMPU HALOGEN
TERHADAP PENGUKURAN SPEKTROSKOPI KUALITI INTRINSIK
MANGGA SALA
ABSTRAK
Spektroskopi merupakan salah satu teknik yang paling berkesan dalam penilaian
kualiti buah-buahan terutamanya mangga. Spektrum pantulan yang diperolehi daripada
sistem spektrometer sangat dipengaruhi oleh cahaya yang digunakan dalam system ini.
Dunia kian beralih kepada penggunaan diod pemancar cahaya putih (LED putih) kerana
manfaat-manfaatnya berbanding dengan sumber cahaya konvensional. Oleh itu, kajian
ini bertujuan untuk menggantikan sumber cahaya konvensional iaitu lampu halogen
dengan LED putih sebagai sumber cahaya dalam pengukuran spektroskopi parameter
intrinsik Sala Mango (keasidan dan kandungan pepejal larut). Pantulan spektrum
mangga dalam julat cahaya nampak diperolehi menggunakan Jaz spektrometer di bawah
pantulan lampu halogen dan LED putih dengan suhu warna 3500 K (D35), 4500 K
(D45) dan 5700 K (D57). Data spektrum dianalisis menggunakan kaedah pelbagai
regresi linear (MLR) untuk memilih model ramalan yang terbaik. Prosedur pemindahan
kalibrasi langsung juga diaplikasikan antara algoritma yang terbentuk menggunakan
lampu induk dan ramalan data yang diperoleh daripada lampu kerja. Prestasi yang baik
telah tercapai dalam ramalan pengukuran keasidan untuk semua LED putih dengan hasil
kajian yang setanding dengan lampu halogen. Hasil kajian juga menunjukkan prosedur
pemindahan kalibrasi langsung telah berjaya dipraktikkan antara LED putih dalam
ramalan keasidan Sala Mango.

xv
EFFECTS OF WHITE LIGHT EMITTING DIODES AND HALOGEN LAMP
ON SPECTROSCOPIC MEASUREMENT OF SALA MANGO INTRINSIC
QUALITIES
ABSTRACT
Spectroscopy is among one of the most promising techniques for assessment of
fruit quality particularly mango. Reflectance spectrum obtained from spectrometer
system is greatly affected by lighting used in the system. The world is turning to white
Light Emitting Diode (white LED) due to its benefits compared to conventional light
sources. This study is therefore to replace conventional halogen lamp with white LED as
light source in spectroscopic measurement of Sala Mango intrinsic parameters (acidity
and soluble solids content). Reflectance spectra of mangoes were acquired using Jaz
spectrometer over visible light range illuminated by halogen lamp and white LEDs with
CCTs of 3500 K (D35), 4500 K (D45) and 5700 K (D57). Spectral data were analyzed
using Multiple Linear Regression (MLR) method to choose the best predictive model.
Direct calibration transfer technique also was applied between developed algorithm by
master lighting and prediction data obtained from slave lightings. Good prediction
performance was achieved for acidity measurement for all white LEDs with comparable
results to halogen lamp. Results also showed direct calibration transfer procedure has
successfully being implemented between white LEDs in acidity prediction of Sala
Mango.
1
CHAPTER 1
INTRODUCTION
This chapter gives background of this research starting with fruit quality and
secondly introducing the non-destructive fruit quality assessment developed by
researchers including spectroscopy technique. Problem statement is included and
further extended to objectives of this research work. Scope of research where work
to be performed is described and lastly contents in every chapter are explained in
outline of thesis.
1.1 Fruit Quality
Fruit is an important component in a balanced diet known widely as the food
pyramid. Fruits are sources of mineral and certain vitamins especially vitamins A
and C to humans. Besides, fruit also supply both digestible carbohydrate in form of
sugar and starch and indigestible ones which are essential in prevention of
constipation. Literatures also showed the preventive role of fruits and vegetables
against health problems such as cancer, heart disease, stroke and Alzheimer disease
(Liu, 2003; Van Duyn & Pivonka, 2000). Therefore, there is high demand of fresh
fruit in market for regular supply of good quality, safe and nutritious fruit. Fresh fruit
get rotten in a short period of time after harvest regardless of how well the fruit is
stored or processed.
Quality control is vital in food industry to provide safe, acceptable and
nutritional products to consumers. The main concern to consumers in buying fruit
are the internal qualities such as sweetness, flavour and nutrition of the fruit although
purchases mainly are produced on the basis of appearance and textural quality.
Quality is defined to be the degree of preference or excellence. The term „quality‟ is

2
subjective and complex as it is a combination of characteristics, attributes and
properties which gives the overall value of the fruit (Siddiqui, 2015). Fruit quality
can differ from consumer to consumer depending on the consumer‟s own preference
and expectation. Repeated purchases are somehow dependent on the good eating
quality (Knee, 2002). Since the term „quality‟ is subjective, researchers have tried to
quantify the term and the parameters are divided into external and internal attributes
as shown in Table 1.1.
Table 1.1 Components of qualities (Titova et al., 2015)
External Qualities
Size Weight, Volume, Dimension
Shape Diameter/Depth ratio
Color Uniformity, Intensity
Defect Bruise, Stab, Spot
Internal Qualities
Flavour Sweetness, Sourness, Astringency, Aroma
Texture Firmness, Crispness, Juiciness
Nutrition Carbohydrates, Proteins, Vitamins, Functional Property
Defect Internal Cavity, Water Core, Frost damage, Rotten
There are wide variations in quality of fruit as quality can be affected by
external factors such as climate conditions, soil properties, cultivation techniques,
etc. Even fruits taken from the same tree may have different qualities. Besides, as the
number of fruit harvested each time is in large quantity, postharvest and grading of
fruit have been a great challenge to the agricultural sector. Most of the sorting is still
done in traditional way which is through manual sorting by farm workers. This
method usually takes up a longer time and requires a lot of labours. Manual sorting
is also unreliable because this method is subjective and inconsistent as the decision
made is always dependent on the eye of the observer. Another method is by taking
few fruits randomly from a tree as samples to make an overall assessment of the
qualities of the fruits. Not only this method is destructive, yet it is still unreliable as
each fruit would have different intrinsic qualities although obtained from the same
tree. For fruit quality measurement, the conventional methods include firmness

3
measurement using a penetrometer, soluble solids content measurement using
refractometer and acidity test using pH meter (Zerbini, 2006). These tests are all
destructive and consequently, cost losses to farmers.
Hence, various efforts have been made to introduce non-destructive
techniques for fruit quality assurance. Introduction of these non-destructive means of
measurement eliminates the need to destroy fruits before measurement is done, time-
saving and more reliable. Moreover, non-destructive quality evaluation can help to
reduce the reliance on experienced workers in picking and sorting products with
higher efficiency and better quality uniformity (Nip, 1993).
1.2 Non-destructive Quality Measurement
With advancement of science and technology, researchers have developed
non-destructive methods to measure quality attributes of fruit. Table 1.2 lists down
the methodology and techniques used in the measurement.
Table 1.2 Non-destructive methodologies in Quality Measurement (Nicolaï et al., 2014; Omar &
MatJafri, 2013)
Methodology Technique Components
Optics
(i) Image Analysis
(ii) Reflectance, transmittance and
absorbance Spectroscopy
(iii) Laser Spectroscopy
Size, shape, colour, external defects
Internal components, colour, defects Firmness, visco-elasticity, defects, shape
X-ray X-ray image and CT Internal cavity and structure, ripeness
Mechanics
(i) Vibrated Excitation
(ii) Sonic
(iii) Ultrasonic
Firmness, visco-elasticity, ripeness
Firmness, visco-elasticity, internal cavity,
density, sugar content
Internal cavity and structure, firmness,
tenderness
Electromagnetic
(i) Impedance
(ii) Magnetic Resonance Imaging
Moisture content, density, sugar content,
internal cavity
Sugar content, oil, moisture content,
internal defect and structure
Mass
Spectrometry
(i) Gas Chromatography
(ii) Advanced mass spectrometry Aroma
Gas Sensors and
Electronic noses Aroma

4
Among the techniques, spectroscopy is the most popular non-destructive
technique as it is the closest to practical use (Omar & MatJafri, 2013; Siddiqui,
2015). Reviews on this technique have been investigated by authors in publications
such as Blanco and Villarroya (2002), Nicolai et al. (2007), Lin and Ying (2009) and
(Ruiz-Altisent et al., 2010). Researchers have applied mostly Visible (VIS) / Near
Infrared (NIR) spectroscopy technique on different fruits such as apple (Bobelyn et
al., 2010; Luo et al., 2011), apricot (Camps & Christen, 2009; Chen et al., 2006),
pear (Li et al., 2013; Paz et al., 2009), orange (Cen et al., 2007; Jamshidi et al.,
2012), strawberry (Guo et al., 2013; Shao & He, 2008), mango (Delwiche et al.,
2008; Jha et al., 2012), banana (Davey et al., 2009; Liew & Lau, 2012), blueberry
(Sinelli et al., 2008; Wang et al., 2012), etc. This technique is proven to be
successful in measuring the intrinsic qualities of fruits. However, the standard light
sources used in all of these experiments were halogen lamps. Halogen lamp is
recognised as standard light source for its continuous spectrum coverage from
ultraviolet to infrared region in the electromagnetic spectrum (Figure 1.1) which is
comparable to the real sunlight. This light source is also a good compromise between
good performance and relatively low cost (Guidetti et al., 2012).

5
Figure 1.1 Light Source Relative Irradiance versus Spectral Content (Francis, 1995)
1.3 Problem Statement
Recently, white Light Emitting Diode (LED) has been invented and gradually
gained popularity in lighting system due to its stability, cost-saving and long shelf-
life (Narendran and Gu, 2005). It is also called as the 'smart' lighting application with
higher efficiency and better light quality as compared to standard light sources of
halogen lamp which give out a significant amount of heat during operation (Schubert
and Kim, 2005; Shur and Zukauskas, 2005). One of the important components in
spectroscopy system is the light source which is needed to provide light to illuminate
samples in the system. As mentioned by Behar-Cohen et al. (2011), there is a
probability for LED to be the main light source in the future. Thus, researches are
focused to explore more on applications of LED including in spectroscopy
technique.

6
1.4 Research Objectives
The main objective of this study is to replace the conventional halogen lamp with
white LED as light source in spectroscopy measurement. Sub-objectives are aligned
in order to achieve main objective of this research. The sub-objectives are:
1. To analyze the influence of different white LED correlated colour
temperatures (lightings) in relation to halogen lamp on VIS spectroscopic
measurement of acidity and soluble solids content of Sala Mango.
2. To determine the possibility of direct calibration transfer procedure in acidity
prediction of Sala Mango using different lightings.
1.5 Scope of the Research
This research work focuses on the investigation of influence of Correlated
Colour Temperature (CCT) of white LED on spectroscopic measurement. The
choice of sample is Sala Mango taken from Perlis, Malaysia with wide colour
variation (from green to yellow to orange) and wide pH and Soluble Solids Content
(SSC) ranges (low pH and SSC when it is green to higher values when it is riper).
The reflectance measurement using spectrometer is taken for all 52 samples and
imported to computer for statistical analysis. Multiple Linear Regression (MLR) is
then used to select few wavelengths that can generate the best combination giving
highest coefficient of determination, R2 and lowest Root Mean Square Error (RMSE)
values with intrinsic parameters of Sala Mango for white LEDs and halogen lamp
respectively. The focus of this study is assessment of acidity measurement of mango
samples using VIS spectroscopy under different light sources and particularly
investigation on the effect of LED CCT on spectroscopic measurement. Besides, this
work also explores on direct calibration transfer procedure between similar light

7
sources (LEDs with different CCTs) and different types of light source (halogen
lamp and LEDs).
1.6 Outline of the Thesis
This thesis is comprised of five chapters. Chapter 1 introduces the
fundamental of fruit quality and the non-destructive measurement of fruit and
subsequently associates to the objectives of the whole research. Chapter 2 discusses
basic concepts and principles of spectroscopy, fruit and lighting, focusing mainly on
several aspects that are relevant for this thesis. It starts with principle of
spectroscopy, spectroscopic system and its relation with multivariate analysis. Then,
it gives brief background on fruit and its properties, followed by reviews on
spectroscopic assessment of fruit quality. The lighting part is explained last with
Light Emitting Diode (LED) as the main light subject and its parameters. Chapter 3
explains detailed descriptions of steps and instruments used in this research in order
to achieve the objectives of research. The first part is preliminary study using colour
paper which is an initial work in discovering influence of LED spectra on colour
measurement. The second part is dealing with the experiment on Sala Mango, a real
case study for investigating influence of Correlated Colour Temperature of LED in
prediction of intrinsic qualities of the fruit. Chapter 4 presents the analysis of data
and discussion throughout the entire research. Similarly, this chapter is also divided
into two parts; first on preliminary study and latter part on Sala Mango. Last but not
least, Chapter 5 draws conclusion from this work and provides some suggestions for
future work developments.

8
CHAPTER 2
THEORY AND LITERATURE REVIEW
This chapter gives the theory and principles of spectroscopy and its system, the
lighting fundamentals and Light Emitting Diode (LED), chemometrics including
calibration and prediction method and calibration transfer, fruit and its properties and
colour and appearance. Literature review where past researches done by researchers
on application of LED in solid state lighting and spectroscopy in fruit quality
assessment are also discussed and elaborated in this chapter.
2.1 Principle of Spectroscopy
Spectroscopy technique works using optical methods at which matter will
respond on ultraviolet ray (UV) (180-380) nm, visible (VIS) light (380-780) nm or
near infrared ray (NIR) (780-2500) nm light to produce a range of wavelengths as
the output (Noh & Choi, 2006). The spectra are then processed using multiple
statistical analyses to obtain final results. The spectra are also correlated to
predefined quality attributes using wavelength which fits in the best, commonly in
terms of intensity (Omar & MatJafri, 2013). Spectroscopy is now widely used in
many fields such as agricultural, medicinal, chemistry and others. Despite its
advantages and contributions to science and technology, few know much about the
origin of spectroscopy. In “The Early History of Spectroscopy” by Thomas (1991),
the author discussed on the development of spectroscopy where science of
spectroscopy begins when Sir Isaac Newton observed how sunlight was scattered
into a series of colours after passed through a glass prism. He then reversed the
experiment by passing individual colours through prism and white light was once
again restored. From this simple experiment, Newton made a conclusion that white

9
light is actually composed of different colours which is known as the visible light
spectrum (VIS).
Light or electromagnetic radiation is categorized according to wavelength
into radiowaves, microwaves, infrared, visible light, ultraviolet ray, X-rays and
gamma rays with each group in increasing frequency. Visible light covers from
approximately 380 to 780 nm and is the only region which is observable to human
eye known as the colour. Figure 2.1 shows the illustration of electromagnetic
spectrum from gamma to radio waves.
Figure 2.1 The electromagnetic spectrum (Leader Tech, 2016)
Colour can be assessed either through vision analysis or instrumental help.
Eye is more flexible compared to instrument as eye is sensitive to geometric factors
such as direction, pattern and shape of the object. However, the drawbacks are that
evaluations are a subjective matter as different observers observe differently and
might even change according to viewing conditions. Instrument holds advantage on
these drawbacks as repeatable measurements are able to be made regardless time and
place although only a specific attribute can be taken at a time (Hunter, 1987).

10
2.2 Spectroscopic System
A spectroscopic system includes a light source, a spectrometer, and a fiber
optic cable. Light interacts with sample and sends back portion of the light via fiber
optic cable to be analyzed by spectrometer. Spectrometer is considered as the heart
of whole instrumentation system. Fiber optic sensor collects portion of the
electromagnetic radiation after interaction with internal structure of sample and then
transfers it to the spectrometer. The device will break down sample light beams into
their spectral components, digitize the signal as a function of wavelength and finally
data is shown in spectrum form on the screen of a computer. A simple diagram to
illustrate spectroscopy instrumentation is shown in Figure 2.2.
Figure 2.2 Schematic diagram on a spectroscopic system
Fiber optic cable consists of a core and a cladding with lower refractive index
and supportive jacket at the outer layer. Figure 2.3 shows the inner core and cladding
of an optical fiber. The core is usually made of pure silica but can also be plastics or
special glasses while inner cladding is made of material with lower refractive index.

11
Supportive jacket acts as protector to prevent fiber from mechanical, thermal and
chemical stress (Guidetti et al., 2012). Light is transported using principle of total
internal reflection where the refractive index of core is higher than refractive index
of cladding in order for the phenomenon to occur (Utzinger & Richards-Kortum,
2003). Total internal reflection is highly efficient, 99.999% at each reflection
compared to normal reflections from metallic or dielectric surface which may only
up to 99% efficient (Jha, 2010).
Figure 2.3 Fiber optic cable which consists of core, cladding and a supportive jacket. Refractive
index of cladding, ncladding is lower than refractive index of inner core, ncore (Utzinger & Richards-
Kortum, 2003)
2.3 Lighting Fundamentals
A basic understanding of lighting fundamentals is essential before we look into
application of LED in solid state lighting. This section provides a brief overview of
evolution of lighting since early ages, introduction to fundamentals of LED and
lastly linkage of LED in application of solid state lighting particularly in food
appearance.
2.3.1 Lighting Evolution
The sun is the main natural source of light in the world. Apart from keeping
human beings warm and enabling biological processes to be carried out, sun is the

12
light source for human to view things during the daylight. However, when the sun
sets and surroundings get dark, artificial light source is needed instead. From the
ancient, fire is the oldest artificial light source followed by oil lamps, candles and gas
lamps. The first invention of light bulb by Thomas Edison in 1879 marked a big
progress in the human lighting history and after several attempts, he managed to
replace electric bulb with a tungsten filament which is known as the incandescent
lamp. Optics field had progressed so advanced that various engineering fields
including lighting for illumination applications were improving from time to time as
shown in Figure 2.4.
Figure 2.4 Timeline of lighting evolution (De Almeida et al., 2014)
With light, human beings are provided with vision to see and perform out
daily tasks. Understanding of light at fundamental levels had been explored by
scientists at the past centuries. Sir Isaac Newton had claimed that light was made up
of little particles or simply called “corpuscles” in the late 1660s. Christian Huygens
found out in contraction that light behaves like wave instead which was validated by
Thomas Young and Augustin-Jean Fresnel later using interference experiment.
Riddle was solved when Max Planck and Albert Einstein used quantum mechanics
approach to prove that actually light has wave-particle dual nature. Subsequently,

13
major developments in physics had increased, particularly the optics field leading to
inventions such as light-emitting diodes (LEDs), lasers, fiber optics and etc.
2.3.2 Light Emitting Diode
A light-emitting diode (LED) is a p-n junction diode which emits light when
sufficient voltage is applied to perform recombination process between electrons and
holes and consequently, energy is released in the form of photons (light). LED which
operates like conventional diode, allows electrical current to pass through the device
in only one direction while blocking the current flow in opposite direction. Figure
2.5 shows the circuit symbol and real image of a LED.
Figure 2.5 A light-emitting diode
Several methods are commonly used to generate white light such as mixing
monochromatic LEDs of red, blue and green, addition of blue light and phosphor
coating and placing of red, green and blue phosphor coatings over UV LED chip
(Held, 2016; Prelovsek & Bizjak, 2006). White light illuminated from LED can be
classified into warm, natural or cold based on the standard reference of white light
emitted by ideal white light source, the Sun in particular expressed in Correlated
Colour Temperature (CCT). CCT of a light source is the temperature of a blackbody
radiator related to the appearance of the actual light source (Hunter, 1975).The

14
concept is derived from blackbody radiation at which colour of heated metal changes
accordingly with its temperature. As metal gets heated, the colour of the metal
changes from red, gradually to orange, yellow, white and then blue-white (Pode &
Diouf, 2011). CCT is used to describe „hot‟ or „cold‟ of a white light and is
expressed in Kelvin. Warm white light usually looks more reddish-yellow and often
in CCT below 3500 K. Cold white light is more bluish-white colour and ranges from
5500K and above with 6500 K as standard daylight illuminant (Behar-Cohen et al.,
2011). Higher CCT LED tends to have more leading blue peaks indicating more blue
radiation. This is one of the advantages of LED compared to incandescent and
halogen lamps which are limited to CCT range about 2700 K to 3000 K only
(Department of Energy, 2014). Figure 2.6 shows a correlated colour temperature
diagram used to describe colour appearance of a white LED.
Figure 2.6 Correlated colour temperature scale and illumination of white LEDs (Wonderful
Technology, 2016)

15
2.3.3 Application of White LED in Solid State Lighting
Solid State Lighting (SSL) based on LEDs is emerging fast with energy
efficiency as the primary advantage compared to conventional lighting technologies.
LEDs have already replaced traditional lamps in lighting systems such as traffic
lights, sign boards, mobile phones, computer monitors and automotive lighting (De
Almeida et al., 2014). The functions of LED are expanding to not be limited only
for display but also for lighting purpose as those traditional light sources such as
incandescent and fluorescent lamps (Taguchi, 2008). As the world is changing
towards the application of LEDs, researchers have made their efforts to discover
more on LED lighting applications.
Comparison works have been conducted to investigate the difference of white
LED and conventional light sources as lighting in colour perception of humans. It
has been reported that different illumination sources give different perception on
visual appearance of an object. As mentioned by Francis (1995) in “Quality as
Influenced by Colour”, the perception of colour will be affected by the type of
lighting falling on an object. Researchers have conducted researches on consumer
preferences and acceptability on food under different lightings. Barbut (2001)
investigated the effect of three most commonly used light sources which are
incandescent (INC), fluorescent (FL) and metal halide (MH) on appearance of fresh
beef, pork and chicken meat. All the three meats looked most desirable under
incandescent light. Jost-Boissard et al. (2009) also investigated the colour rendering
of fruit and vegetables under LED and also standard sources (fluorescent and
halogen) in terms of attractiveness, naturalness and suitability. It is found that LEDs
seems to offer a plausible alternative to standard source although some LED mixings
should be avoided. It is also mentioned that the colour temperature of the sources

16
does not seem to affect observers' preferences in term of attractiveness and
naturalness. Cho et al. (2015) demonstrated that colour of lighting (in this case,
white, yellow and blue lightings are used) in fact does alter meal size taken and blue
lighting decreases significantly amount of food eaten in men but not women. Yang et
al. (2015) also studied the effects of light colour on consumer‟s acceptability and
willingness to eat apples and bell peppers.
However, all these researches are limited to qualitative means rather than
quantitative ways with mostly using respondents for observation in food
appearances. Researchers have been conducting the studies on effect of lighting on
subjective parameters of food like attractiveness, naturalness and suitability,
acceptability and willingness to consume food but the correlation between lighting
and qualitative intrinsic qualities of food is still undetermined. Thus, further study
has to be carried out to find the influence of lighting and its correlation to intrinsic
qualities of food.
2.4 Chemometrics
Spectroscopic analysis is a technique to get information from spectra
obtained as a consequence to interaction of matter with electromagnetic radiation.
These spectra contain great deal of physical and chemical information about
molecules of a material. Chemometrics is an important part of electromagnetic
radiation spectroscopy analysis in food sector to correlate quality parameters with
spectral data obtained. The method is such that first, to collect spectra of calibration
set of samples for which the properties of interest are measured using conventional
means. After that, a mathematical function of these spectra is created to represent the
property using computer and regression software. Finally, prediction of property can
be done by evaluating this mathematical function at the unknown sample‟s spectrum.

17
In sum, chemometric analyzer consists of three components (hardware, software and
database) as shown schematically in Figure 2.7. Using chemometric modelling,
estimation of sample properties becomes increasingly attractive since it is less time-
consuming as spectra can often be collected in seconds.
Figure 2.7 Chemometric analyser consists of three linked and interacting components
2.4.1 Calibration and Prediction
The main part of chemometrics in predicting quality parameters of food is
building a calibration model and multivariate analysis has shown to be an effective
tool in constructing the model. There are several multivariate tools used in analysis
including multiple linear regression, principal component analysis, discriminant
analysis, cluster analysis and partial least square (Abdi, 2003; Rencher, 2003).
Multiple Linear Regression (MLR) is the most common multivariate technique
among all the techniques. It gives the relationship between one or more dependent
response variables (Y-variables) and two or more independent variables (X-
variables) (Richarme, 2002). The developed model will then be tested using
validation samples to verify the model accuracy. The statistic parameters involved
Hardware (Spectrometer)
Software (Mathematical
Modelling)
Database (Calibration Set)

18
are such as coefficient of determination (R2), root mean square error of calibration
(RMSEC) and root mean square of prediction (RMSEP).
MLR has been widely used as analysis method in fruit quality assessment.
For example, ElMasry et al. (2007) used MLR to obtain R2 for moisture content,
total soluble solids and acidity prediction of strawberry using hyperspectral imaging
with results of 0.87, 0.80, and 0.92 respectively. Similarly, Rajkumar et al. (2012)
utilized MLR models to predict quality attributes of banana using optimal
wavelengths. R2 found was to be 0.85, 0.87 and 0.91 for total soluble solids,
moisture and firmness of banana respectively. A good calibration model is the
crucial key in giving prediction of quality attributes and therefore, multivariate tool
is important and have to be wisely applied for full advantage.
2.4.2 Calibration Transfer
Despite the advantages of spectroscopy being simple, fast and easy to handle,
there is also limitation on multivariate calibration techniques when model generated
is applied with new spectra measured under new environments or using different
instruments. The solution to this limitation is recalibration process which is
expensive and time-consuming as reported by Peng et al. (2011). Thus, researchers
have tried to apply calibration transfer technique to avoid the need of generating
calibration model again. The term „calibration transfer‟ is mostly assumed to be
transfer of model between different instruments although generally the term actually
refers to transfer of model between different conditions.
Prior researches mostly are done for model transfer between different
instruments. Calibration model developed from master instrument is transferred to
predict quality parameter of second instrument (slave instrument). Fonollosa et al.

19
(2016) has successfully performed calibration transfer between chemical gas sensor
arrays using direct standardization where signals of slave unit is transferable to space
of a master unit. Salguero-Chaparro et al. (2013) also demonstrated calibration
model transfer between diverse NIR spectrometers in quality evaluation of intact
olives. Model transfer between two Fourier transform near infrared
spectrophotometers has been successfully implemented in prediction of vitamin C
Content of navel orange carried out by Hu and Xia (2011). Correlation coefficient
(R) was found to be 0.887 while root mean square error of prediction (RMSEP) was
3.01mg/100g.
Calibration transfer technique is proven to be beneficial as acquiring new
spectra for sample measurement and re-measuring is normally expensive and time-
consuming. While most of the studies generally focused on calibration transfer
between instruments, this method should be expanded to further explorations such as
calibration transfer between different light sources in spectroscopy instrumentation
system which are explored in this thesis.
2.5 Fruit
Understanding of fruit has been important in order to associate with its quality
assessment. From its growth and ripening process to compositional studies, optical
properties and comprehension of colour and appearance are all essential
characteristics to be taken into account for evaluation purpose. All these fundamental
properties are discussed throughout this whole section and lastly past literatures of
fruit quality analysis using spectroscopy is also included.

20
2.5.1 Fruit Development and Physiology
„Mature‟ term in fruit harvest is derived from Latin word „Maturus‟ by the
meaning of ripen. It is the stage of fruit development where the fruit has attains its
minimum edible quality at the ripening process on the tree. Ripe which is derived
from Saxon word „Ripi‟ and has the meaning of reap or gather. It is the condition
where the fruit has attains its maximum edible quality after harvest. Ripening is a
series of complex physiological processes involving increased rate of respiration,
ethylene production, loss of chlorophyll, continued expansion of cells and
conversion of complex metabolites into simple molecules (El-Ramady et al., 2015).
These processes take place within a week in fruit after maturity and result in physical
changes in colour, texture and other sensory attributes (Omar & MatJafri, 2013).
Ethylene is a plant hormone, particularly the fruit-ripening hormone responsible for
regulating many aspects of plant growth including ripening process in climacteric
fruits (Tharanathan et al., 2006). Fruit ripening is an irreversible process leading to
development of soft and edible fruit with desirable quality attributes (Seymour et al.,
2013).
One of the observations of fruit ripening is through the change in colour as a
consequence of chlorophyll degeneration and appearance of other pigments.
Therefore, fruit colour is often used as indicator to observe maturity for certain fruits
such as banana, mango and tomato (Ruiz-Altisent et al., 2010). Colour changes in
mango fruit occur when chloroplasts are transformed to chromoplasts containing red
or yellow pigments. Consequently, the reddish or yellowish colour of fruit eventually
becomes perceptible due to carotenoids. Some cultivars also developed into reddish
bluish colour, which has been attributed to anthocyanins (Singh et al., 2013).

21
Another significant feature of fruit ripening is change in soluble
carbohydrates mainly consist of sucrose, fructose and glucose. Ripening process
breaks down starch into these simpler sugars and therefore the sugar levels within
fruit tend to increase in this stage (Seymour et al., 2012). Ripe mango contains 10 to
20% of total sugars on fresh weight basis depending on the cultivars and stage of
ripeness of the fruit (Singh et al., 2013). The total sugar content determines the
sweetness of fruit and this attribute is one of the vital characteristics in determining
fruit quality (Seymour et al., 2013). It has been reported that the final eating quality
is actually can be linked to total soluble solids at fully ripe stage (Subedi & Walsh,
2011).
The next feature to be discussed is acidity, which is due to the presence of
organic acids, malic and citric acids found in most of the ripe fruits (Etienne et al.,
2013). The predominant organic acids in mature mango fruit are citric, succinic,
malic and with citric acid as the major organic acid present in mango fruit and
tartaric acid the lowest (Singh et al., 2013). Acidity usually increases at early growth
phase, reaches a peak and declines gradually until harvest. During ripening process,
levels of acids will decrease presumably used as respiratory substances. The increase
in sweetness and decrease in acidity simultaneously with accumulation of sugars and
organic acids are responsible for the taste development of fruit (Tharanathan et al.,
2006).
Decrease of flesh firmness or textural softening is also another observation
during fruit ripening, primarily due to the changes in cell-wall carbohydrate
metabolism that result in decrease of cell wall components (Ignat, 2012). The
softening process is part of the ripening in most of the fruits. Prior to ripening, fruit
has rigid and well-defined cellular structures but after ripening process, the cell wall

22
becomes soft and diffused (Brownleader et al., 1999). Mango also undergoes drastic
and extensive textural softening from hard to soft ripe stage due to degradation of
structural as well as storage polysaccharides (Tharanathan et al., 2006).
2.5.2 Fruit Internal Quality
Although fruit purchase is greatly influenced by external attributes
(appearance, colour, shape and size), the main concern to customers is actually the
internal qualities that eventually give satisfaction to the buyers. Fruit internal
qualities are often related to parameters such as soluble solids content (SSC),
titratable acidity (TA), soluble solids to acid (SSC/TA) ratio and texture (Romano et
al., 2006). Sugar content and acidity have become significant parameters in
determination of fruit internal quality as investigated by researchers (Gómez et al.,
2006; Li et al., 2013; Omar, 2013; Wang et al., 2012; Yuan et al., 2015; Zhang et
al., 2008).
Jha et al. (2010) had done a review paper on quality parameters of mango
and potential of non-destructive techniques for their measurement. According to the
paper, major quality parameters such as size, shape, colour and aroma are used to
define the overall quality of fruit. Major changes during ripening of mango are
reduction in fruit weight, volume, length, thickness and firmness. Sucrose and
fructose levels also increase relatively in all fruit with storage whereas
polysaccharides content, particularly starch decreased dramatically. Most of the
parameters mentioned are determined by wet chemistry method which destroy the
samples and make them unfit for consumption (Jha et al., 2010). Therefore, recent
techniques for non-destructive techniques have been introduced to overcome this
matter.

23
2.5.3 Optical Properties of Fruit
In order to evaluate the fruit quality, it is important to know the optical
properties of the fruit itself. The basic of food quality analysis using optical
properties is from the knowledge of interaction between light and fruit materials.
Figure 2.8 shows a diagram on how light interacts with a fruit. Most of the fruit
materials are not optically homogenous and therefore light is scattered in all
directions when entered the numerous tiny internal interfaces. When beam of light
strikes the fruit, roughly 4% of the incident light is reflected from the surface as
regular reflectance and the rest is transmitted into the surface where it is either
absorbed by the object, reflected back to the surface (body reflectance), or
transmitted through the fruit. The amount of radiant energy in each of the processes
depends on the properties of the fruit and the incident (Birth, 1976; Chen, 1978).
Figure 2.8 Interaction between Light and Fruit (Chen, 1978)
Measurement of body reflectance or generally known as reflectance is especially
suitable for measuring quality factors such as external colours, surface damages,
bruises and external differences between two objects. This technique measures the
radiation reflected from sample, not on the surface but penetrates into the sample a
few millimetres being absorbed partly and partly reflected back again (Guidetti et al.,

24
2012). This type of measurement can provide information of the region near surface
of incidence point according to (Chen, 1978).
2.5.4 Colour and Appearance
According to 'Colour and Appearance' by Lawless and Heymann (2010),
colour is defined to be "the perception in the brain that results from the detection of
light after it has interacted with object." Few conditions to be satisfied in order for an
object to be perceived by eyes are such that the source must be radiated in visible
spectrum between 380 and 770 nm with observer possesses at least the normal
colour vision and enclosure filled with clear optical medium and boundaries which
are capable to reveal the object character. Besides, colour of an object perceived by
an observer is also affected by type of lighting shines on the object, distance from
observer to object and the surrounding environment. When light strikes on an object,
it undergoes i) specular reflection due to gloss surface of the object skin, ii)
scattering due to diffuse reflection and sometimes diffuse transmission, iii)
absorption and iv) specular transmission which is directly through the object for
transparent object. Tominaga and Wandell (1989) also reported that the colour
appeared to our visual is actually both the light reflected from the object and nearby
objects. The spectral reflectance of the reflected object is defined by the surface
reflectance of the object and the light source shining on it.
Appearance is definitely one of the vital attributes of quality and colour is
one of the subset in describing appearance of food or an object. Colour has to be
within expected range else the other two major quality factors, flavour and texture
are unlikely to be judged at all. This is especially true for fruits and vegetables

25
(Francis, 1995). For example, try to imagine banana flesh in purple or green in
colour, the consumers would definitely reject to buy the fruit.
2.5.5 Mango Overview
Mango (Mangifera indica) is one of the popular tropical fruits produced in
Malaysia with average annual production of 20022 tonnes from year 2009 to 2013
(Ministry of Agriculture and Agro-Based Industry, 2015 ). The mango fruit is a
large, fleshy drupe which contains edible mesocarp with varying thickness (Litz,
2009). Mango is a climacteric fruit which continues to ripen even after detachment
from parent plant at mature stage. The fruit normally reaches maturity in 4 to 5
months from flowering and harvested at green mature stage and kept under normal
ripening. After that, it will take roughly 6 to 10 days to ripen depending on the
environmental conditions and becomes overripe and spoiled within 15 days after
harvest (Tharanathan et al., 2006). Mango fruit is famous for its sweet taste, smooth
texture, and juicy flesh with strong fragrant aroma. Mango is a natural source of
Vitamin A and C which are important to human health in daily fiber intake. A huge
variation exists among mango cultivars in fruit weight, shape and colour. There are
roughly 216 clones of mango in Malaysia but the varieties well-known among
consumers are such as Chokanan, Harumanis, Sala, Mas Muda, Siam Panjang and
Maha 65. Mango fruit can be utilized into different products like juice, candy,
pickles, jam and jelly although it is still preferably to be eaten fresh compared to
other fruits (Ministry of Agriculture and Agro-Based Industry, 2016). The ripening
process of a mango fruit can be assessed through correlation with skin colour
commercially (Subedi & Walsh, 2011).

26
2.6 Application of Spectroscopy in Fruit Quality Analysis
As mentioned in Chapter 1, spectroscopy has been one of the most rising
techniques in fruit quality analysis in the recent years. This non-destructive
technique is often implemented with respect to attributes such as SSC, acidity,
firmness, ripeness level and maturity. Examples of spectroscopy include Visible
(VIS) Spectroscopy, Visible/Near-Infrared (VIS/NIR) Spectroscopy, Near-Infrared
(NIR) Spectroscopy and Ultraviolet/Visible (UV/VIS) Spectroscopy. Each type of
spectroscopy corresponds to different wavelength used in range but choice of
spectroscopy usually dependent on properties of samples. The main focus would be
on VIS spectroscopy as it is the one relevant in the whole research work.
Visible (VIS) spectroscopy which covers from 380 to 780 nm usually are
used in assessment of fruit intrinsic quality through appearance especially skin
colour as colour is located within the visible range. Spectra measured by
spectroscopy show wavelengths in this range provide compositional information
regarding chemical bonds where the main absorbers are such as chlorophylls,
carotenoids, anthocyanins and other colour compounds. These pigments are those
which give colour and appearance to the fruits and vegetables. Colour is often used
as basis in sorting products into commercial grades, but it relates more directly to
consumer in appearance while pigment concentration is more related to maturity
(Abbott, 1999). Therefore, VIS spectroscopy is useful as it is able to evaluate fruit
ripening stage and gives vital information when combined with multivariate analysis
especially in prediction of fruits and vegetables quality.
Ziosi et al. (2008) introduced a new index based on absorbance difference
(IAD) between two wavelengths; 670 and 720 nm which are referred as chlorophyll-a
absorption peak in characterizing peach ripening progression using VIS

27
spectroscopy. The IAD obtained was proved to be able to identify physiological
changes occurring in peach fruit and was a reliable marker of fruit ageing.
Classification of durian maturity using visible spectroscopy of spine of durian was
investigated by Timkhum and Terdwongworakul (2012). Spectrophotometer with
wavelength region from 350 to 750 nm was used and best accuracy of classification
was identified at 94.7%. The result was attributable to the absorbance of chlorophyll
a, carotenoids and anthocyanins in the spine. Pholpho et al. (2011) applied visible
reflectance spectroscopy and succeed to classify bruised and non-bruised longan
accordingly. Reflectance of bruised fruits was lower than that of non-bruised fruits
but both groups had highest reflectance at 700 nm and chlorophyll absorption at 670
nm.
VIS spectroscopy can be utilized more as a non-destructive evaluation of
fruits and vegetables than just appearance attributes. Jha et al. (2005) used visible
spectroscopy in prediction of sweetness, measured in oBrix of mango samples.
Calibration models from different analyses were developed and MLR model of
original spectra in range from 440 to 480 nm was found to be the best. The results
obtained were good and convincing with standard error of calibration of 1.9oBrix,
validation (SEP) 1.98oBrix and correlation coefficient (R) of 0.90. Subsequent year,
same researchers applied the same technique to test on other attributes; namely
firmness and yellowness but using different mathematical analyses (Partial Least
Squares, Principal Component Regression and Multiple Linear Regression). All
models were found to perform equally well in wavelength range from 530 to 550 nm
but R for yellowness index was much better than that of firmness. The reasoning was
that wavelength in visible range was better for surface attribute (yellowness index)
than subsurface properties (firmness) (Jha et al., 2006).

28
Yahaya et al. (2015) also utilized this technique to determine the acidity of
Sala Mango using direct transfer calibration method between three different
spectrometers. Multiple wavelengths were selected within visible range using
Multiple Linear Regression (MLR) to develop calibration algorithm which
subsequently transferred to another instrument to obtain prediction results. It was
found that good results obtained for calibration transfer models despite different
instruments were used to develop the prediction results.
While spectroscopy technique has been successfully utilized in fruit quality
assessment in the past, no work has been published on white LED as substitute to
halogen lamp as lighting in spectroscopic measurement of fruit. Thus, it is the main
purpose of this research work in investigating the potential of substitution of halogen
lamp in intrinsic qualities measurement of Sala Mango using spectroscopy technique
and at the same time, checking on the influence of CCT of white LED in the
measurement.

29
CHAPTER 3
METHODOLOGY
This chapter describes the detailed procedures of methodology used in this work in
order to achieve objectives of the research. Among the steps include methodology
for preliminary study and case study from research design to sample preparation,
experimental work, data analysis and finally a conclusion is drawn.
3.1 Overview of Research Methodology
Figure 3.1 shows an overview of the research design of this experimental work.
Further procedures are to be further elaborated in the next few sections.
Figure 3.1 Methodology flow of experiment
LED Lighting Panel Designation
Preliminary Study using Colour Papers
Real Case Study on Sala Mango
Test for Intrinsic Qualities
(Soluble Solids Content, pH)
Analysis of data
i) Calibration Model
ii) Direct Calibration Transfer

30
3.2 Jaz Spectrometer
The main instrument used in this experiment is Jaz Spectrometer (Figure 3.2), a
product from Ocean Optics Inc., USA. Jaz is light and portable, therefore enabling
the spectrometer to be carried out for field work, lab or other process environment.
Figure 3.2 Jaz Spectrometer
In this research, however, Jaz was connected to computer via USB port since the
experiment was conducted in lab and controlled by the Spectra Suite software. Being
responsive from 200 to 1100 nm, Jaz has two different channels (Channel 0 and 1)
with each of them having different wavelength coverage. Channel 0 covers from 200
to 850 nm while Channel 1 ranges from 650 to 1100 nm. Channel 0 was used in this
work as it covers whole range of visible region. Basically, sampling system using
spectrometer is explained as flowchart in Figure 3.3.
Channel 0
Channel 1

31
Figure 3.3 Sampling System Overview by Jaz Spectrometer (Ocean Optics, 2010)
Optical measurement can be carried out in different modes such as transmittance,
absorbance and reflectance. In this research, reflectance mode which is reported to
be the easiest mode is used instead due to the reasons as stated below (Chen, 1978;
Hemming, 2013):
1. Its suitability to measure quality factor which is related to external colour
(skin colour) especially this research is taking the skin colour of mango under
influence of different lighting into account.
2. Its relative high intensity which make measurement easier to use for
quality evaluation. The source needs not to be of high intensity or the
detector to be very sensitive.
3. Reflectance measurement is not adversely to be affected by low-intensity
background.
Light transmittance
from light source to
sample
Dark current reduction
and reference
spectrum storage
Light reflected from
the sample
Collection and
transmittance of light
from sample surface
to spectrometer via
optical fiber
Measurement of light
and transformation of
collected data into
digital information by
spectrometer
Comparison of
sample measurement
with reference
spectrum by Spectra
Suite software
Display of processed
spectral information

32
3.3 LED Lighting Panel Designation
The main components in this research are the white LEDs with different CCTs. The
LEDs are products from Osram Opto Semiconductor with specifications of LEDs are
shown as in Table 3.1. For the sake of simplicity, each white LED is labeled
accordingly to CCT throughout whole thesis using shorthand where white LED with
CCT of 3500 K as D35, 4500 K white LED as D45 and 5700 K LED as D57. The
LED panels are designed to be 4 LEDs connected in series with 3 cement type
resistors of 10 Watt 2.2 Ω ±5% connected in parallel. Figure 3.4 shows the LED
panel designed and resistor used in this research.
Table 3.1 LED specifications (Osram Opto, 2011, 2015a, 2015b)
D35 D45 D57
Correlated Colour
Temperature (CCT) 3500 K 4500 K 5700 K
Product Type LCW W5AM-
KXKY-409Q
LCW W5AM-PC-
KRKT-4J8K
LUW W5AM-
KYLX-4E8G
Colour of Emission Warm White Natural White Cool White
Viewing angle 170o 170
o 170
o
Forward Current (mA) 350 350 350
Forward Voltage (V) 3.2 3.2 3.2
Luminous Flux (lm) 71-97 82-104 82-130
Colour Rendering Index 80 70 70
(a) (b)
Figure 3.4 (a) LED panel board and (b) cement type resistor

33
3.4 Preliminary Study Using Colour Papers
This study is an initial step in understanding the interactions between spectral
characteristics of light sources and basic colours. Colour papers were used as
representation of colour measurement with special RGB colour code. The colour
papers used were of monochromatic colour of red, blue and green colours with two
different surfaces; glossy and non-glossy. A monochromatic colour scheme is
scheme with only single hue in varying shades (McMurry, 2006). Each colour
series was in increasing values of 20, 40, 60, 80, 100, 120, 140, 160, 180, 200, 225
and 255 as viewed in laptop screen. Although printed version of these colour series
were no longer in RGB colour system, these numerical numbers were just being a
reference to increasing gradient in hue for colour measurement. Monochromatic
colours were investigated as changes in series can be observed significantly without
influence of the other two colour elements. Figure 3.5 shows the colours which
were used in this experiment. Two type surfaces were used to explore possibility of
different results obtained due to CCT of LED.
Figure 3.5 Colour series used in this study
3.4.1 Experimental Setup
Figure 3.6 shows the experimental setup for this experiment. The experiment was
conducted in a dark room using Jaz Spectrometer with spectral response of 200-850
nm. Reference spectrum was obtained by shining halogen lamp (ASD Inc.) as

34
standard light source at 45o onto WS-1-SL, a white diffuse reflectance standard with
reflectivity above 95% for wavelength coverage from 250 to 2000 nm. The probe
used in this experiment is R600-7-SR-125F with 600 µm core diameter. The height
between colour paper and fiber tip and the distance between LED panel and fiber
probe were kept constant throughout the experiment which were 1.0 cm and 23.5
cm respectively. The spectroscopy was then calibrated using the spectrum reference
and used for reflectance measurement. The colour paper was put under the fiber
optic probe perpendicularly with two LED panels supplied with 1.6 A illuminating
from both sides at the angle of 45o. The Spectra Suite software uses the following
Equation (3.1) to evaluate each pixel on the detector and produce the reflectance
spectra:
(3.1)
where Rλ= the reflectance at the wavelength of λ
Sλ=the sample intensity at the wavelength of λ
Dλ=the dark intensity at the wavelength of λ
Wλ= the reference intensity at the wavelength of λ
Figure 3.6 Experimental setup for reflectance measurement of colour papers using Jaz Spectrometer
23.0cm
1.0cm
Jaz Spectrometer
45o
LED Panel
Fiber Optic
Cable
Sample
Computer
LED Panel

35
3.4.2 Spectral Analysis
The spectral reflectance of colour papers were saved and further analysed using
mathematical analysis. For analysis of the spectra from colour papers, gradient of the
graph of reflectance against colour series for selected wavelengths was used. High
gradient indicates a small increase in colour series is sufficient to detect change in
reflectance of the colour paper (better responsivity). This analysis technique was
applied instead of direct interpretation from reflectance spectra due to the raw
spectra does contain peaks from white LED itself which is not useful in colour
measurement. Figure 3.7 shows an example of raw reflectance spectra with two
peaks at wavelength bands from (i) 420 to 460 nm for blue radiation from white
LED and ii) 500 to 600 nm for real colour spectrum measured. In order to eliminate
the former one, the gradient technique was utilized. Results are to be discussed in
Chapter 4, Results and Discussion.
400 500 600 7000
10
20
30
Ref
lect
ance
Wavelength (nm)
20
40
60
80
100
120
140
160
180
200
225
255
Figure 3.7 Green colour series (Non-Glossy) reflectance spectra under D45 illumination(left) and
scatter plot of reflectance versus green values (right) with spectral gradient bolded in the equation
3.5 Real Case Study of Sala Mango
For investigation of white LED as light source in spectroscopy system for fruit
quality assessment, the sample used in this research work is Sala Mango which has
0 50 100 150 200 2500
10
20
30
Ref
lect
ance
(%
)
Green value
y= 0.116x - 0.8114
R2 = 0.9432

36
wide variation in colour, Soluble Solids Content (SSC) and acidity. The wide
variations are to ensure extensive coverage in obtained results for higher reliability
results.
3.5.1 Fruit Material
52 Sala Mango (Figure 3.8) were harvested randomly and classified into different
groups according to ripeness levels as described in Table 3.2. The fruit samples were
collected and arranged by courtesy of Federal Agricultural Marketing Authority
(Perlis Branch) with assistance of expert from Department of Agriculture at an
orchard located in Perlis. The different categories are to investigate how reflectance
spectra differ from one group to another with large variations in samples covered.
Figure 3.8 Sala Mango samples
Table 3.2 Different Groups of Sala Mango Sample
Group Code Description
1 1-9 Immature, Green
2 10-19 Mature but still green in colour
3 20-29 Mature and turn into yellowish-green colour
4 30-38 Fruits wrapped in black paper (Free from bruises)
5 42-52 Artificially ripened using calcium carbide for 3 days
6 39-41 Artificially ripened using calcium carbide for 4 days

37
Subsequent to the harvest, the samples were transported to Engineering Lab,
School of Physics, Universiti Sains Malaysia where the experimental procedures
were carried out. 14 out of 52 samples were artificially ripened using calcium
carbide for 3 and 4 days respectively to get wider variation of sample groups. The
other samples were stored in air-conditioned room at 17oC and 65% relative
humidity (RH). After the samples were ready, each sample was labeled accordingly
in number from 1 to 52 and later was weighed using weighing balance. The diameter
of mangoes also was measured using thread and meter ruler to obtain the average
size of the mango samples. Table 3.3 gives the properties of Sala Mango samples.
Table 3.3 Properties of Sala Mango for 52 Samples
Min Max Mean Standard Deviation
Weight(kg) 0.232 1.009 0.539 0.156
Outer Diameter (cm) 19.3 30.2 25.3 2.2
SSC (oBrix) 7.3 15.5 10.5 2.0
Acidity (pH) 2.75 5.24 3.80 0.81
The weight and outer diameter of the whole samples were in the range of 0.232-
1.009 kg and 19.3-30.2 cm, respectively while the range of SSC and acidity were
from 7.3 to 15.5 oBrix and pH 2.75 to 5.24, respectively. The samples were wide in
range because different maturity levels of mango were used in this experiment.
3.5.2 Reflectance Measurement
For reflectance measurement of mango samples using Jaz Spectrometer, similar
experimental setup was used as shown in Figure 3.5, difference was just that the
colour papers were replaced with mango samples. The spectra of the 52 samples
were obtained using wavelength ranges of 200 to 850 nm (Channel 0) with custom
setup of integration time of 100 ms, spectra averaged of 5 and boxcar smoothing of
1. Channel 0 of the spectrometer covers visible light which is from the wavelength of

38
380 to 780 nm. The spectrometer was first calibrated using white diffuse reflectance
standard having halogen lamp as light source shining at 45o to the white diffuse. The
optical fiber probe was placed 1.5 cm directly perpendicular above the white diffuse.
After calibration was done, reflectance measurement on mango surface was taken for
mango samples with halogen lamp as light source. Three measurements were taken
randomly from one surface of each mango sample and later were averaged to obtain
a single spectrum which represents the sample. The overall set of data was used to
develop the calibration algorithm. Similar measurements were repeated from another
surface of mango sample and the obtained spectra were used for prediction purpose.
When the measurement was done, the light source was replaced with two LED
panels shining from two directions on mango surface as shown in Figure 3.5 and
reflectance measurement was repeated for D35, D45 and D57 lightings. The
acquired data were properly stored for analysis purpose.
3.5.3 Intrinsic Qualities Measurement
After spectroscopy measurement was done for all the mango samples, destructive
tests were carried out to obtain the intrinsic qualities of the samples. The fruits were
peeled off skin and blended using a blender to collect the juice for measurement. The
Soluble Solids Content (SSC) of mango juice was measured by using PAL-3
refractometer from Atago Co. (Tokyo, Japan) with range of measurement from 0 to
93 o
Brix, resolution of 0.1 oBrix and accuracy of ±0.2
oBrix as shown in Figure 3.9
(a). A refractometer basically is an optical device which applies the refraction of
light concept when light passes through a liquid. Denser liquid refracts more light
indicating higher SSC in the liquid. 1oBrix arbitrarily indicates 1 g of sucrose in 100
g of solution (Kenkel, 2010). Meanwhile, acidity of fruit was measured using Exstik

39
Measurement
Chamber
On / Off button
Calibration button
Measurement
probe
Calibration
button
pH meter (Figure 3.9 (b)) from Extech Instruments (Watham, Massachusetts, USA)
with range of measurement between 0-14 pH, resolution of 0.01 pH and accuracy of
±0.01 pH.
(a) (b)
Figure 3.9 Instrumentations used in intrinsic quality measurement; (a) refractometer and
(b) pH meter
3.5.4 Data Processing
Acquired spectral data were imported to OriginPro8.1 Service Release (Patch)
3(SR3) (OriginCorp., USA) and graphs were plotted as shown in Chapter 4. All the
statistical analyses to find the calibration algoritm correlating reflectance and
intrinsic qualities were run with Minitab 14 (Minitab Inc., USA), a statistical
software powerful for data analysis. Multiple Linear Regression (MLR) was applied
to selected wavelengths to get different models and performance of each model was
evaluated using several parameters such as coefficients of determination (R2) of
calibration and prediction, root mean square errors of calibration (RMSEC) and
prediction (RMSEP). High value of R2 for both calibration and prediction is
preferred to show stability of model developed. RMSEC and RMSEP are defined as
Equation (3.2) (Esbensen et al., 2002):

40
√∑ ( )
(3.2)
where = predicted value of ith observation
= measured value of ith observation
= number of observations in calibration (RMSEC)/ prediction set (RMSEP)
Both of these parameters are direct estimation of modeling error and a good model
possesses a small difference between them.
For second part of the analysis on real study of Sala Mango, direct calibration
transfer procedure was applied between halogen lamp and LEDs to observe
possibility of direct transfer of calibration model from master lighting to slave
lightings without recalibration process. Figure 3.10 shows an overview of direct
calibration transfer procedure between different lightings.
Figure 3.10 Direct Calibration Transfer Procedure
SLAVE LIGHTING
Halogen lamp
Prediction Data 3
SLAVE LIGHTING
D57
Prediction Data 2
SLAVE LIGHTING
D45
Prediction Data 1
MASTER LIGHTING
(Example: D35)
Calibration Model
Halogen lamp
Predicted R2
and RMSEP
D57
Predicted R2
and RMSEP
D45
Predicted R2
and RMSEP

41
From Figure 3.10, calibration model developed from master lighting (in this
case, D35) is transferred into prediction data measured by spectrometer under other
lightings or slave lightings (D45, D57 and halogen lamp) to get predicted R2 and
RMSEP results for all the three slave lightings. The performance of the model was
once again evaluated using the statistical parameters.

42
CHAPTER 4
RESULTS AND DISCUSSION
This chapter discusses both on preliminary study of colour papers and real case study
of Sala Mango including data analysis, graphs, and regression results. For real case
study on Sala Mango, the analysis is separated into two different parts which the part
part is on calibration and prediction models and second part is on direct calibration
transfer technique. After results are presented, discussions on the analyzed data are
elaborated and supported proof from literature review on the results obtained are also
given.
4.1 White Diffuse Reflectance
Since the main objective of this research work is to explore influence of LED
CCT on spectroscopic measurement of Sala Mango, it is important to first
understand the spectral data of LED itself before interaction with sample to obtain
reflectance data. White LEDs used in the study are of combination of blue light and
phosphor. However, there are differences in proportion which produce white LEDs
with different CCT. Figure 4.1(a) shows the intensity spectrum of halogen lamp and
Figure 4.1(b) is the spectra of white diffuse reflectance under illumination of three
different LEDs with halogen lamp as reference light source. As shown in Figure
4.1(b), there is slight shift in peaks between the LEDs. The high peaks at blue region
(400-480 nm) for D35 is at 445 nm, 446 nm for D45 and 440nm for D57 while slight
curves at the range of 500-700 nm indicating the component for yellow phosphor of
white LED. Increasing reflectance for D35 spectra to D57 explains very much
influence of the luminous intensity and flux of the LEDs under the same current
applied. It is notable that the differences in blue peaks are quite large between the
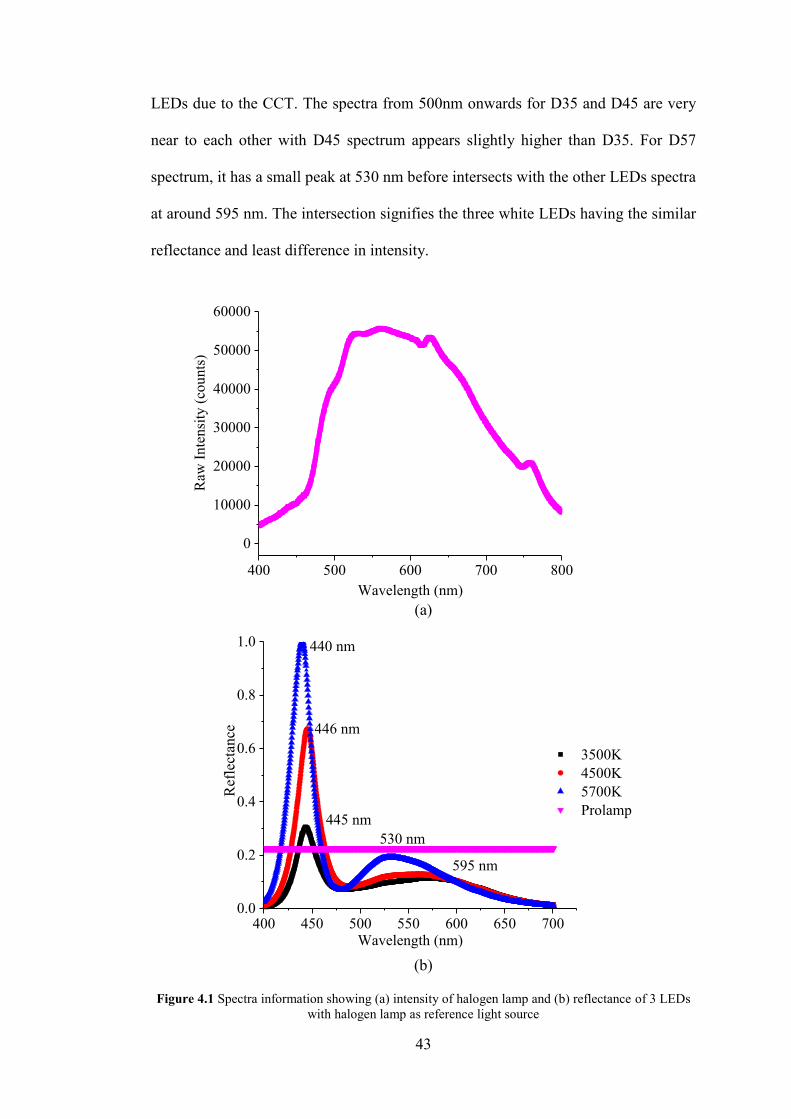
43
LEDs due to the CCT. The spectra from 500nm onwards for D35 and D45 are very
near to each other with D45 spectrum appears slightly higher than D35. For D57
spectrum, it has a small peak at 530 nm before intersects with the other LEDs spectra
at around 595 nm. The intersection signifies the three white LEDs having the similar
reflectance and least difference in intensity.
400 500 600 700 800
0
10000
20000
30000
40000
50000
60000
Raw
In
ten
sity
(co
un
ts)
Wavelength (nm) (a)
400 450 500 550 600 650 7000.0
0.2
0.4
0.6
0.8
1.0
530 nm
3500K
4500K
5700K
Prolamp
Ref
lect
ance
Wavelength (nm)
595 nm
445 nm
446 nm
440 nm
(b)
Figure 4.1 Spectra information showing (a) intensity of halogen lamp and (b) reflectance of 3 LEDs
with halogen lamp as reference light source

44
4.2 Influence of LED CCT in Visible Spectroscopic Observation of RGB Sample
As mentioned in Chapter 3, for analysis of spectra from colour papers,
gradient of the graph of reflectance against colour series for selected wavelengths
was used. Figure 4.2, 4.3, and 4.4 show the relationships between spectral gradient
and wavelengths for red, blue and green series of glossy and non-glossy surfaces.
Both type of surfaces basically have the same trend but differ in gradient values. For
red series, D35 has the highest spectral gradient followed by D45 and lastly D57.
400 450 500 550 600 650 700 7500.00
0.02
0.04
0.06
0.08
0.10
0.12
0.14
0.16
(606, 0.1117)
(607, 0.1340)
Sp
ectr
al G
rad
ient
3500K
4500K
5700K
Wavelength (nm)
(609, 0.1385)
(a)
400 450 500 550 600 650 700 7500.00
0.02
0.04
0.06
0.08
0.10
0.12
0.14
0.16
(614, 0.1226)
(611, 0.0997) 3500K
4500K
5700K
Spec
tral
Gra
die
nt
Wavelength (nm)
(615, 0.1296)
(b)
Figure 4.2 Spectral gradient of red colour series for (a) glossy and (b) non-glossy surfaces with peak
wavelength in bracket

45
The result obtained does not match with spectra of white diffuse reflectance
(Figure 4.1(b)). Therefore, it can be deduced that LED with lower CCT which looks
warmer has improved the observation of red colour compared to cool white LED
which in this case is D57. D35 has a little higher reflectance compared to D45 and
D57 with the lowest reflectance at wavelengths after the intersection point. Different
surfaces produce peaks at different wavelengths but in similar decreasing trend for
increasing CCT. For glossy surfaces, the peak wavelengths for the increasing CCT of
LEDs are of 609 nm, 607 nm and 606 nm while the peak wavelengths for non-glossy
surfaces are 615 nm, 614 nm and 611 nm. Spectrometer is indeed a powerful tool
which is able to detect small difference of the peak wavelengths. The difference of
peak wavelength between one LED to another is small (±3 nm) and hence, different
CCT of LED does not really affect the appearance of the colour. However, the
differences in peak wavelengths of the surfaces indicate that type of object‟s surface
does affect shifting of peak wavelength under spectroscopic view. As for the small
peaks at the blue region, it is noteworthy that the peaks for non-glossy surface are
less significant as compared to the glossy ones which matches with common
observation that glossy surface should have higher reflectance compared to non-
glossy surface.
For green colour series, Figure 4.3 shows the spectral gradient plotted for
both glossy and non-glossy surfaces. The green spectra demonstrate maximal
gradient at wavelengths of 537 nm (glossy) and 539 nm (non-glossy) for D35, 535
nm (glossy) and 537 nm (non-glossy) for D45 and 531 nm (glossy) and 533 nm
(non-glossy) for D57. By referring to Figure 4.3, the spectra at around 530nm also
have the same trends as in Figure 4.1 where D57 has leading reflectance and D45 has
slightly higher reflectance as compared to D35. For region of 400-470 nm, the small

46
peaks for both surfaces have similar trend and the difference in spectral gradient is
not as significant as in for the red colour series. This indicates the type of surfaces
for green colour series does not affect the blue component of white LED.
400 450 500 550 600 6500.00
0.02
0.04
0.06
0.08
0.10
0.12
0.14
0.16
0.18
0.20
(537, 0.1179)
(535, 0.1370) 3500K
4500K
5700K
Sp
ectr
al G
rad
ient
Wavelength (nm)
(531, 0.1952)
(a)
400 450 500 550 600 6500.00
0.02
0.04
0.06
0.08
0.10
0.12
0.14
0.16
0.18
0.20
(539, 0.1018)
(537, 0.1189)
(533, 0.1677)
3500K
4500K
5700K
Sp
ectr
al G
rad
ient
Wavelength (nm)
(b)
Figure 4.3 Spectral gradients of green colour series for (a) glossy and (b) non-glossy surfaces with
peak wavelength in bracket
Next, observation for blue colour series is discussed instead. The peak
wavelengths of white diffuse standard reflectance are 445 nm, 446 nm, and 440 nm

47
in increasing CCTs. D57 has peak at the smallest wavelength followed by D35 and
D45 in decreasing order.
400 450 500 5500.00
0.05
0.10
0.15
0.20
0.25
0.30
0.35
0.40
0.45
(444, 0.1581)
(446, 0.3105) 3500K
4500K
5700K
Sp
ectr
al G
rad
ient
Wavelength (nm)
(440, 0.4141)
(a)
400 450 500 5500.00
0.05
0.10
0.15
0.20
0.25
0.30
0.35
0.40
0.45
(445, 0.1656)
(447, 0.3285)
(440, 0.4255)
3500K
4500K
5700K
Ref
lect
ance
Wavelength(nm) (b)
Figure 4.4 Spectral gradient of blue colour series for (a) glossy and (b) non-glossy surfaces with
peak wavelength in bracket
For glossy surfaces, the peaks wavelengths are 444 nm, 446 nm and 440 nm
in increasing CCTs while in non-glossy case, the peak wavelength for D35 is 445
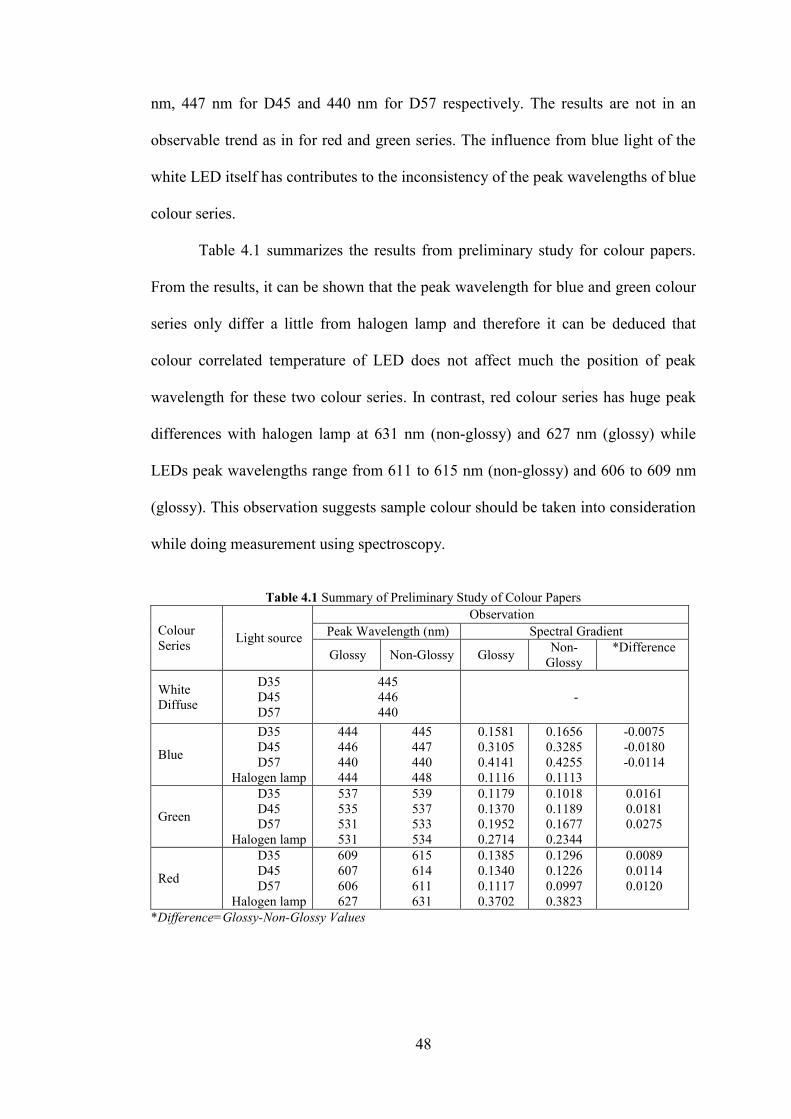
48
nm, 447 nm for D45 and 440 nm for D57 respectively. The results are not in an
observable trend as in for red and green series. The influence from blue light of the
white LED itself has contributes to the inconsistency of the peak wavelengths of blue
colour series.
Table 4.1 summarizes the results from preliminary study for colour papers.
From the results, it can be shown that the peak wavelength for blue and green colour
series only differ a little from halogen lamp and therefore it can be deduced that
colour correlated temperature of LED does not affect much the position of peak
wavelength for these two colour series. In contrast, red colour series has huge peak
differences with halogen lamp at 631 nm (non-glossy) and 627 nm (glossy) while
LEDs peak wavelengths range from 611 to 615 nm (non-glossy) and 606 to 609 nm
(glossy). This observation suggests sample colour should be taken into consideration
while doing measurement using spectroscopy.
Table 4.1 Summary of Preliminary Study of Colour Papers
Colour
Series Light source
Observation
Peak Wavelength (nm) Spectral Gradient
Glossy Non-Glossy Glossy Non-
Glossy
*Difference
White
Diffuse
D35
D45
D57
445
446
440
-
Blue
D35
D45
D57
Halogen lamp
444
446
440
444
445
447
440
448
0.1581
0.3105
0.4141
0.1116
0.1656
0.3285
0.4255
0.1113
-0.0075
-0.0180
-0.0114
Green
D35
D45
D57
Halogen lamp
537
535
531
531
539
537
533
534
0.1179
0.1370
0.1952
0.2714
0.1018
0.1189
0.1677
0.2344
0.0161
0.0181
0.0275
Red
D35
D45
D57
Halogen lamp
609
607
606
627
615
614
611
631
0.1385
0.1340
0.1117
0.3702
0.1296
0.1226
0.0997
0.3823
0.0089
0.0114
0.0120
*Difference=Glossy-Non-Glossy Values

49
On the other hand, spectral gradient gives more significant result compared to
peak wavelength. The increasing or decreasing values of spectral gradient with
increasing CCT gives result whether the colour observation has been improved or
vice versa. Blue and green series have increasing spectral gradient with increasing
CCT indicating better responsivity at higher LED CCT but red series is proved to
have higher responsivity using lower CCT LED. Besides, the difference between
spectral gradient values of glossy and non-glossy surfaces give an odd observation
for blue series as negative result is obtained. Glossy surface is expected to give
higher reflectance and indirectly contributes to higher spectral gradient and positive
difference value. Blue series which its wavelength band is located between 400 and
470 nm is obviously affected by the blue radiation from white LED contributing to
the odd result obtained. Therefore, it is recommended that blue colour object is not
measured under this type of white LED lighting. However, further studies are
required to confirm the fact.
4.3 VIS Spectroscopic Measurement of Sala Mango Intrinsic Properties under
Different Lightings
The main focus of this research is to investigate the effect of white LED CCT
on spectroscopy measurement and at the same time correlating it with the intrinsic
qualities of sample which is Sala Mango. The result from Section 4.2 has proven
successfully that different light sources would affect the spectroscopic view of RGB
samples. LED CCT does shift the peak wavelength of object though in insignificant
way and the spectral gradient would change order with increasing CCT depending on
the colour of the object. Therefore, in the next section, correlation between LED
CCT with intrinsic parameters of Sala Mango is investigated instead.

50
4.3.1 VIS Spectroscopic Analysis of Sala Mango
A detailed analysis on different groups of sample is done to discover possibility of
different observations. Mango is a climacteric fruit such that it continues to ripen
after harvesting with colour change (green to yellow) observable on the fruit skin
(Zhang et al., 2014). As the fruits starts to ripen, other external parameters such as
size, firmness and texture change as well apart from skin colour transition. Internal
changes involve change in absorbing pigments in mango such as chlorophylls,
carotenoid and anthocyanin pigments. These pigments would usually be indicated by
peaks and valleys in reflectance spectra.
Reflectance spectra for different groups of mango sample under D35, D45,
D57 and halogen lamp illuminations are shown as in Figure 4.5, 4.6 and 4.7. For
mango samples in Group 1 to 3, the spectra are similar to one another with only
difference is increasing reflectance from Group 1 to 3. Generally, the reflectance
spectra are observed to be in similar patterns with peaks in the (i) 420-470 nm, (ii)
540-580 nm range and a valley in the (iii) 650-690 nm range. The first peak range is
due to the blue radiation emitted from white LEDs with highest intensity by D57
followed by D45 and lastly D35. The second peak is related to carotenoid pigment
while the valleys indicate strong absorption which corresponds to the peak
absorbance of chlorophyll-a (Zerbini et al., 2015).

51
400 500 600 700 8000
10
20
30
40
50
10
11
12
13
14
15
16
17
18
19
Ref
lect
ance
(%
)
Wavelength (nm)400 500 600 700 800
0
10
20
30
40
50
Wavelength (nm)
Ref
lect
ance
(%
)
10
11
12
13
14
15
16
17
18
19
(a) D35 (b) D45
400 500 600 700 8000
10
20
30
40
50
Wavelength (nm)
Ref
lect
ance
(%
)
10
11
12
13
14
15
16
17
18
19
400 500 600 7000
10
20
30
40
50
Wavelength (nm)
Refl
ecta
nce (
%)
10
11
12
13
14
15
16
17
18
19
(c) D57 (d) Halogen lamp
Figure 4.5 Reflectance spectra for Sala Mango Group 2 with sample coding from 10 to 19 under
different light sources
400 500 600 700 8000
10
20
30
40
50
60
70
80
Wavelength (nm)
Ref
lect
ance
(%
)
30
31
32
33
34
35
36
37
38
400 500 600 700 800
0
10
20
30
40
50
60
70
80
Wavelength (nm)
Ref
lect
ance
(%
)
30
31
32
33
34
35
36
37
38
(a) D35 (b) D45

52
400 500 600 700 8000
10
20
30
40
50
60
70
80
Wavelength (nm)
Ref
lect
ance
(%
)
30
31
32
33
34
35
36
37
38
400 500 600 700 800
0
10
20
30
40
50
60
70
80
Wavelength (nm)
Ref
lect
ance
(%
)
30
31
32
33
34
35
36
37
38
(c) D57 (d) Halogen lamp
Figure 4.6 Reflectance spectra for Sala Mango Group 4 with sample coding from 30 to 38 under
different light sources
400 500 600 700 800
0
10
20
30
40
50
60
Wavelength (nm)
Ref
lect
ance
(%
)
42
43
44
45
46
47
48
49
50
51
52
400 500 600 700 8000
10
20
30
40
50
60
Wavelength (nm)
Ref
lect
ance
(%
) 42
43
44
45
46
47
48
49
50
51
52
(a) D35 (b) D45
400 500 600 700 8000
10
20
30
40
50
60
Wavelength (nm)
Ref
lect
ance
(%
)
42
43
44
45
46
47
48
49
50
51
52
400 500 600 700 800
0
10
20
30
40
50
60
Ref
lect
ance
(%
)
Wavelength (nm)
Ref
lect
ance
(%
)
42
43
44
45
46
47
48
49
50
51
52
(c) D57 (d) Halogen lamp
Figure 4.7 Reflectance spectra for Sala Mango Group 5 with sample coding from 42 to 52 under
different light sources

53
The spectral shapes clearly show that reflectance spectra can be used as
indicators to estimate chlorophyll content in fruit ripening. The peaks and valleys in
the spectra indicates dominancy of blueness in green colour and deficiency of red
colour in mango respectively (Jha et al., 2006). The raw reflectance spectra of
mangoes studies by Jha et al. (2012) and Yahaya et al. (2015) also showed the
similar pattern. According to Wanitchang et al. (2011), reflectance is found to
increase as the fruit is more mature in the 600-700 nm range. However, from all the
previous spectra, only halogen lamp spectra show the significant differences in
reflectance compared to LEDs spectra. Compositions from white LED have
influenced the reflectance spectra and this might be a drawback if maturity of mango
fruits is to be assessed. Moreover, spectra from halogen lamp seem to have more
specific curve than LEDs‟ which can be shown from small valleys around 600-640
nm. The valleys are the evidence of chlorophyll-b absorption in mango fruit (Spinelli
et al., 2013). Although not as weighty as carotenoid and chlorophyll-a pigments in
mango, halogen lamp spectra are the only ones which are able to show the valleys in
all different groups of samples. This may be an advantage for halogen lamp as
lighting in spectroscopy measurement as the spectra obtained are clearer, more
transparent and visible indicating more information can be extracted.
4.3.2 Calibration Models for pH and SSC
Multivariate analysis is performed to find quantitative relationship between
reflectance spectra and internal qualities of mango. Different wavelengths in the
visible range are selected to develop calibration models for predicting SSC and pH
of mango using Multiple Linear Regression (MLR). Visible range is split to its three
most dominant regions of red, green and blue. Models 1 to 3 are models developed

54
using wavelengths from only one region (blue (λB) , green (λG) or red(λR)) while
Models 4 to 6, developed from combination of two regions (blue-green ((λB+G), red-
green((λR+G), or red-blue (λR+B)) and the rest are from the three regions (λB+G+B). The
algorithms are compared in terms of coefficients of determination (R2) of calibration
and prediction, root mean square error of calibration (RMSEC) and prediction
(RMSEP). The best model is chosen based on highest R2
with lowest RMSEC and
RMSEP as well as small difference between RMSEC and RMSEP.
4.3.2(a) Acidity
Table 4.2 shows results for different wavelength selections in obtaining acidity
calibration models for the four light sources. The spectral range considered for this
work is in visible range as colour is only perceived in this special region. The acidity
values for samples ranged from 2.75 to 5.24 pH.
i. D35
Table 4.2 shows results for MLR analysis of acidity measurement of Sala
Mango under D35 illumination. The best predictive model is shown in highlight.
Wavelengths used in an algorithm indeed are important as variations of R2 obtained
are wide from 0.1657 to 0.9341.
For Models 1 to 3, only wavelengths from red, blue or green region are used
respectively. 5 wavelengths used from solely green or red region still able to produce
satisfactory results with R2
of 0.8479 and 0.8416. In contrast, wavelengths used from
only blue region produced very poor result with R2 of 0.1657. These results show
that blue wavelengths in an algorithm are not sufficient to predict the acidity of
mango samples as blue region only contains information from blue radiation of LED.

55
Table 4.2 Calibration and prediction results of Sala Mango acidity through reflectance measurement
under D35 lighting
Model Grouping Wavelength(nm)
Calibration Prediction
R2
RMSEC
(pH) R
2
RMSEP
(pH)
1 λB 400,410,420,430,440 0.1657 0.7783 0.0560 0.7940
2 λG 510,520,530,540,550 0.8479 0.3323 0.8621 0.3035
3 λR 600,625,650,670,700 0.8416 0.3391 0.8764 0.2873
4 λB+G 420,450,480,520,550 0.8630 0.3154 0.8557 0.3105
5 λG+R 520,540,580, 620, 670 0.8661 0.3118 0.8435 0.3233
6 λB+R 420,450,480, 620,670 0.8502 0.3298 0.8489 0.3185
7
λB+G+R
420,470,550,615,675 0.7887 0.3917 0.7768 0.3861
8 450,520,580,615,650 0.8866 0.2869 0.8987 0.2601
9 455,520,550,675,700 0.8971 0.2733 0.9189 0.2328
10 470,520,570,675,700 0.9030 0.2654 0.9227 0.2271
11 430,520,540,690,700 0.9117 0.2532 0.9192 0.2323
12 430,520,640,690,700 0.9341 0.2187 0.8939 0.2662
When two regions of wavelengths are used in algorithms (Models 4 to 6), the results
are almost similar but a slight lower for algorithm developed from blue and red
regions. This observation due to deficiency in green region wavelengths is justifiable
as the region contains information about skin colour of the mangoes. For the rest of
the models, results show R2
are all higher and therefore wavelengths from three
regions (red, green and blue) should be covered in acidity prediction algorithm of
Sala Mango. Despite having the highest R2 and lowest RMSEC, prediction R
2 of
Model 12 drops around 4% from 0.9341 to 0.8934 which might due to latent
variables in the model. Therefore, the best algorithm for D35 as lighting is found to
be Model 10 as highlighted in Table 4.2 which has smaller difference in R2 of
calibration and prediction with increment by 2%. Figure 4.8 presents the scatter plot
for this predictive model.
Calibration:
pH =2.332+ 0.370 R470- 0.4052 R520 + 0.1327 R570 - 0.4382 R675+ 0.769 R700 (4.1)
R2= 0.9030; RMSEC=0.2654 pH
Prediction:
R2= 0.9227; RMSEP= 0.2271 pH

56
Figure 4.8 Scatter plots of mango acidity prediction using D35 as light source
ii. D45
Table 4.3 shows the model performance of generated algorithm under D45
lighting illumination on acidity measurement of Sala Mango. The best predictive
model is shown in highlight.
Table 4.3 Calibration and prediction results of Sala Mango acidity through reflectance measurement
under D45 lighting
Model Grouping Wavelength(nm)
Calibration Prediction
R2
RMSEC
(pH) R
2
RMSEP
(pH)
1 λB 400,410,420,430,440 0.6293 0.5188 0.2933 0.6870
2 λG 510,520,530,540,550 0.8461 0.3343 0.8265 0.3404
3 λR 600,625,650,670,700 0.8674 0.3103 0.8384 0.3286
4 λB+G 420,450,480,520,550 0.8652 0.3128 0.8725 0.2919
5 λG+R 520,540,580, 620, 670 0.8634 0.3149 0.8615 0.3041
6 λB+R 420,450,480, 620,670 0.7752 0.4039 0.7885 0.3769
7
λB+G+R
420,470,550,615,675 0.7795 0.4001 0.7511 0.4078
8 450,520,580,615,650 0.8807 0.2943 0.9004 0.2579
9 455,520,550,675,700 0.8942 0.2772 0.9241 0.2251
10 470,520,570,675,700 0.9121 0.2526 0.9308 0.2150
11 430,520,540,690,700 0.8952 0.2758 0.9126 0.2417
12 410,560,570,690,700 0.9310 0.2238 0.9034 0.2540
For Models 1 to 3 (single region wavelengths), wavelengths from blue region
give surprisingly good calibration R2 (0.6293) compared to D35 result (0.1657). But
still, the predicted R2
gives a poor result of 0.2933 which rejects this model for
5.55.04.54.03.53.0
5.5
5.0
4.5
4.0
3.5
3.0
Actual pH
Pre
dic
ted p
H

57
acidity prediction of mango samples. For Models 2 and 3, similar results obtained as
compared to D35 with red wavelengths having slightly higher R2 and lower RMSEC
and RMSEP. For algorithms generated using two regions wavelengths (Models 4 to
6), Model 6 only possesses R2 of 0.7752 while Models 4 and 5 with quite
satisfactory results of 0.8652 and 0.8634 suggesting the significance of green region
wavelengths in correlating reflectance spectra of mango and acidity measurement.
Algorithms involving wavelengths from the three regions found to give better results
as in D35 case. The best predictive model is given by Model 10 (as highlighted)
which has lower R2 and bigger RMSEC compared to Model 12 but has better R
2 of
prediction and lower RMSEP. The algorithm and scatter plot for this model are
shown in Equation (4.2) and Figure (4.9) respectively.
Calibration:
pH =2.359+0.2650 R470- 0.3363 R520 +0.1223 R570 - 0.4634 R675+ 0.749 R700 (4.2)
R2= 0.9121; RMSEC=0.2526 pH
Prediction:
R2= 0.9308; RMSEP= 0.2150 pH
Figure 4.9 Scatter plots of mango acidity prediction using D45 as light source
5.55.04.54.03.53.0
5.5
5.0
4.5
4.0
3.5
3.0
Actual pH
Pre
dic
ted p
H
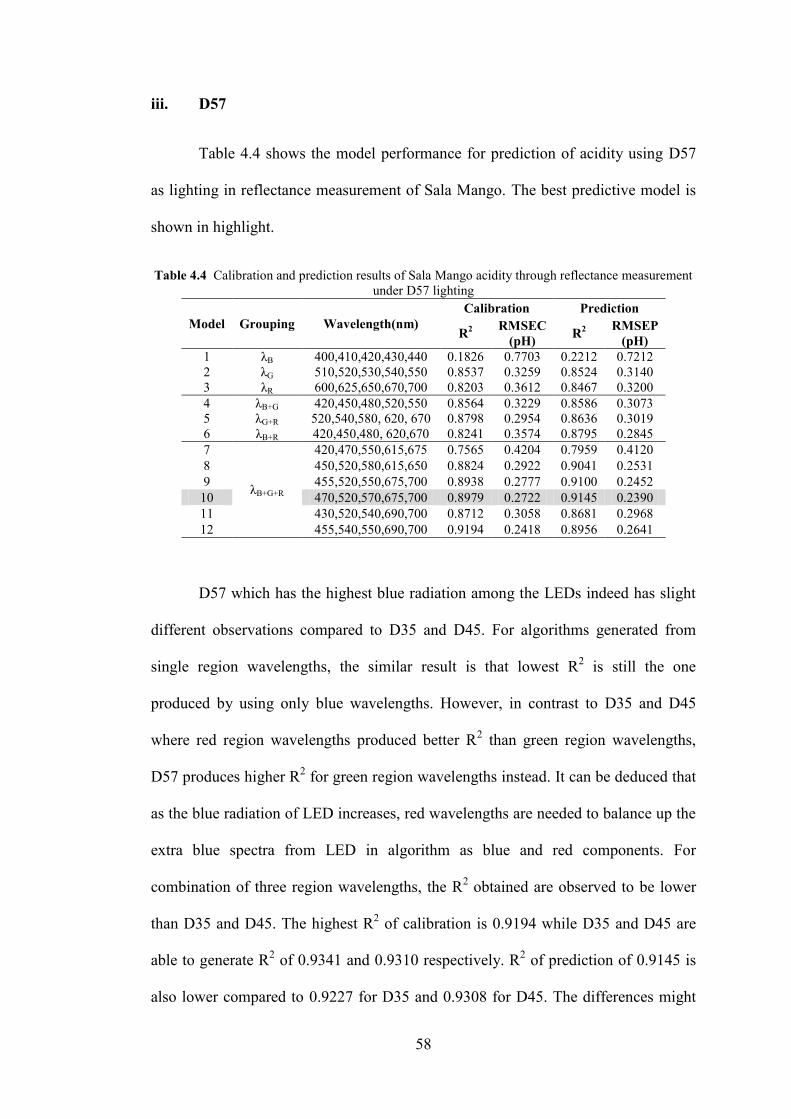
58
iii. D57
Table 4.4 shows the model performance for prediction of acidity using D57
as lighting in reflectance measurement of Sala Mango. The best predictive model is
shown in highlight.
Table 4.4 Calibration and prediction results of Sala Mango acidity through reflectance measurement
under D57 lighting
Model Grouping Wavelength(nm)
Calibration Prediction
R2
RMSEC
(pH) R
2
RMSEP
(pH)
1 λB 400,410,420,430,440 0.1826 0.7703 0.2212 0.7212
2 λG 510,520,530,540,550 0.8537 0.3259 0.8524 0.3140
3 λR 600,625,650,670,700 0.8203 0.3612 0.8467 0.3200
4 λB+G 420,450,480,520,550 0.8564 0.3229 0.8586 0.3073
5 λG+R 520,540,580, 620, 670 0.8798 0.2954 0.8636 0.3019
6 λB+R 420,450,480, 620,670 0.8241 0.3574 0.8795 0.2845
7
λB+G+R
420,470,550,615,675 0.7565 0.4204 0.7959 0.4120
8 450,520,580,615,650 0.8824 0.2922 0.9041 0.2531
9 455,520,550,675,700 0.8938 0.2777 0.9100 0.2452
10 470,520,570,675,700 0.8979 0.2722 0.9145 0.2390
11 430,520,540,690,700 0.8712 0.3058 0.8681 0.2968
12 455,540,550,690,700 0.9194 0.2418 0.8956 0.2641
D57 which has the highest blue radiation among the LEDs indeed has slight
different observations compared to D35 and D45. For algorithms generated from
single region wavelengths, the similar result is that lowest R2 is still the one
produced by using only blue wavelengths. However, in contrast to D35 and D45
where red region wavelengths produced better R2 than green region wavelengths,
D57 produces higher R2 for green region wavelengths instead. It can be deduced that
as the blue radiation of LED increases, red wavelengths are needed to balance up the
extra blue spectra from LED in algorithm as blue and red components. For
combination of three region wavelengths, the R2 obtained are observed to be lower
than D35 and D45. The highest R2 of calibration is 0.9194 while D35 and D45 are
able to generate R2 of 0.9341 and 0.9310 respectively. R
2 of prediction of 0.9145 is
also lower compared to 0.9227 for D35 and 0.9308 for D45. The differences might

59
deduce that acidity prediction of Sala Mango is the best using lower CCT of LED.
Thus, the best model for prediction of pH for D57 lighting is Model 10 and the
predictive model is plotted in scatter plot as shown in Figure 4.10.
Calibration:
pH =2.532+ 0.388R470- 0.233R520+ 0.144R570 - 0.712R675+ 0.712R700 (4.3)
R2= 0.8979; RMSEC=0.2722 pH
Prediction:
R2= 0.9145; RMSEP= 0.2390 pH
Figure 4.10 Scatter plots of mango acidity prediction using D57 as light source
iv. Halogen Lamp
Halogen lamp acts as the reference lighting and is the only light source
without significant blue radiation affecting reflectance spectra of mango sample as
the LEDs. Hence, the spectra obtained using halogen lamp lighting are truly from
spectra of mango samples without influence of the lighting spectrum. Table 4.5
shows the results for acidity measurement of Sala Mango under halogen lamp. The
best predictive model is shown in highlight.
5.55.04.54.03.53.0
5.5
5.0
4.5
4.0
3.5
3.0
Actual pH
Pre
dic
ted p
H

60
Table 4.5 Calibration and prediction results of Sala Mango acidity through reflectance measurement
under halogen lamp lighting
Model Grouping Wavelength(nm)
Calibration Prediction
R2
RMSEC
(pH) R
2
RMSEP
(pH)
1 λB 400,410,420,430,440 0.0652 0.8238 0.0865 0.7811
2 λG 510,520,530,540,550 0.8527 0.3270 0.8577 0.3083
3 λR 600,625,650,670,700 0.8506 0.3294 0.8589 0.3070
4 λB+G 420,450,480,520,550 0.8468 0.3335 0.8539 0.3124
5 λG+R 520,540,580, 620, 670 0.8566 0.3227 0.8542 0.3120
6 λB+R 420,450,480, 620,670 0.8296 0.3517 0.8668 0.2991
7
λB+G+R
420,470,550,615,675 0.8276 0.3538 0.8715 0.2929
8 450,520,580,615,650 0.8751 0.3012 0.8952 0.2646
9 455,520,550,675,700 0.8833 0.2911 0.8943 0.2658
10 470,520,570,675,700 0.8995 0.2702 0.9114 0.2432
11 430,520,540,690,700 0.8828 0.2917 0.8794 0.2838
12 430,520,640,690,700 0.9310 0.2238 0.9034 0.2540
From Table 4.5, for models developed using single region wavelengths
(Models 1 to 3), the algorithm generated solely using blue wavelengths seem to give
poorest result (R2 of 0.0652 and RMSEC of 0.8238 pH). Green and red region
wavelengths are able to produce satisfactory correlations with acidity with R2 of
0.8527 and 0.8506 respectively. For Models 4 to 6, the results are the same as D35
and D45 whereby combination of blue and red wavelengths gives the lowest R2 but
the differences are not as huge as D45. For the rest of the models, the results are also
better when three regions wavelengths are used to produce predictive models in
acidity measurement of mango. The best model chosen is plotted as shown in Figure
4.11.
Calibration:
pH =2.501+ 0.124 R470- 0.128R520+ 0.044 R570- 0.044R675+ 0.045 R700 (4.4)
R2= 0.8995; RMSEC=0.2702 pH
Prediction:
R2= 0.9114; RMSEP= 0.2432 pH

61
Figure 4.11 Scatter plots of mango acidity prediction using halogen lamp as light source
4.3.2(b) Soluble Solids Content
The following are the results of Soluble Solids Content (SSC) calibration and
prediction of Sala Mango using reflectance spectroscopic measurement under D35,
D45, D57 and halogen lamp illuminations. The SSC values in all samples ranged
from 7.3 to 15.5o Brix.
i. D35
Table 4.6 shows SSC spectroscopic measurement of Sala Mango under D35
lighting. The best predictive model is shown in highlight. From Table 4.6, it is
shown that overall results of calibration between SSC and reflectance spectra
(R2<0.7) is poorer compared to acidity (R
2>0.8). This might due to the fact that SSC
is better correlated in NIR region (1100-1250 nm) as reported by Cortés et al.
(2016) or mango itself is better correlated to acidity instead of SSC. This might due
to the fact that the range for SSC (7.3-15.5 oBrix) is wider compared to acidity (2.75
5.55.04.54.03.53.0
5.5
5.0
4.5
4.0
3.5
3.0
Actual pH
Pre
dic
ted p
H

62
to 5.24 pH). Therefore, the latent variables are higher and affecting the results
indirectly.
Table 4.6 Calibration and prediction results of Sala Mango SSC through reflectance measurement
under D35 lighting
Model Grouping Wavelength(nm)
Calibration Prediction
R2
RMSEC
(oBrix)
R2
RMSEP
(oBrix)
1 λB 400,410,420,430,440 0.1875 1.9011 0.0561 1.9655
2 λG 510,520,530,540,550 0.5795 1.3678 0.6593 1.1807
3 λR 600,625,650,670,700 0.5448 1.4231 0.5525 1.3533
4 λB+G 420,450,480,520,550 0.6199 1.3004 0.6935 1.1200
5 λG+R 520,540,580, 620, 670 0.5732 1.3779 0.5958 1.2862
6 λB+R 420,450,480, 620,670 0.5931 1.3454 0.7109 1.0877
7
λB+G+R
420,470,550,615,675 0.5901 1.3504 0.6220 1.2437
8 450,520,580,615,650 0.5876 1.3544 0.6500 1.1969
9 455,520,550,675,700 0.5909 1.3491 0.6627 1.1749
10 470,520,570,675,700 0.5899 1.3507 0.6670 1.1723
11 430,520,540,690,700 0.6361 1.2723 0.6903 1.1258
12 400,520,670,690,700 0.6830 1.1875 0.5932 1.2903
Munawar et al. (2013) also found acidity of mango to give better prediction
results (R = 0.98) compared to SSC (R= 0.82) while Fu et al. (2009) which
investigated on SSC and acidity of loquats showed SSC has better results than
acidity. For Model 1 to 3, model developed from blue region wavelengths (Model 1)
once again produces the lowest R2 of 0.1875 and RMSEC of 1.9011
o Brix. Green
wavelengths produce slightly better correlation than red wavelengths algorithm
showing SSC is more related to the skin colour of mango. For two region
wavelengths combination models (Model 4 to 6), the results varied significantly
compared to acidity (Table 4.2). It was surprising to find that combination of green
and red wavelengths (λG+R) give the lowest R2 as compared to other two
combinations. This observation suggests that blue wavelengths are important in
correlating SSC properties of Sala Mango rather than the other two regions. For
algorithms using combinations of three regions wavelengths, the results are observed
to be slightly better than one and two regions algorithms. The best predictive model
is given by scatter plot as shown in Figure 4.12.
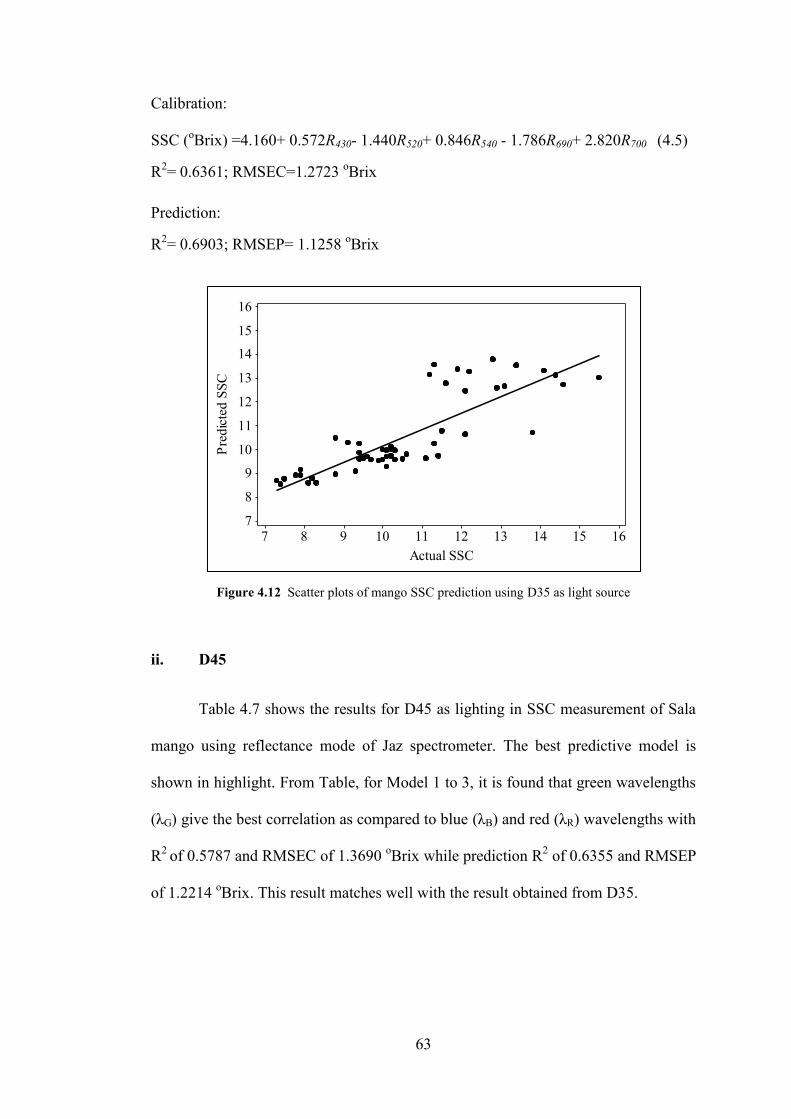
63
Calibration:
SSC (oBrix) =4.160+ 0.572R430- 1.440R520+ 0.846R540 - 1.786R690+ 2.820R700 (4.5)
R2= 0.6361; RMSEC=1.2723
oBrix
Prediction:
R2= 0.6903; RMSEP= 1.1258
oBrix
Figure 4.12 Scatter plots of mango SSC prediction using D35 as light source
ii. D45
Table 4.7 shows the results for D45 as lighting in SSC measurement of Sala
mango using reflectance mode of Jaz spectrometer. The best predictive model is
shown in highlight. From Table, for Model 1 to 3, it is found that green wavelengths
(λG) give the best correlation as compared to blue (λB) and red (λR) wavelengths with
R2
of 0.5787 and RMSEC of 1.3690 oBrix while prediction R
2 of 0.6355 and RMSEP
of 1.2214 oBrix. This result matches well with the result obtained from D35.
16151413121110987
16
15
14
13
12
11
10
9
8
7
Actual SSC
Pre
dic
ted
SS
C

64
Table 4.7 Calibration and prediction results of Sala Mango SSC through reflectance measurement
under D45 lighting
Model Grouping Wavelength(nm)
Calibration Prediction
R2
RMSEC
(oBrix)
R2
RMSEP
(oBrix)
1 λB 400,410,420,430,440 0.4669 1.5400 0.2101 1.7979
2 λG 510,520,530,540,550 0.5787 1.3690 0.6355 1.2214
3 λR 600,625,650,670,700 0.5366 1.4358 0.5737 1.3209
4 λB+G 420,450,480,520,550 0.6418 1.2624 0.5910 1.2938
5 λG+R 520,540,580,620,670 0.5384 1.4330 0.5847 1.3038
6 λB+R 420,450,480,620,670 0.5178 1.4646 0.4771 1.4629
7
λB+G+R
420,470,550,615,675 0.4776 1.5244 0.6007 1.2783
8 450,520,580,615,650 0.5699 1.3832 0.6751 1.1530
9 455,520,550,675,700 0.5690 1.3847 0.6686 1.1646
10 470,520,570,675,700 0.5970 1.3390 0.6955 1.1210
11 430,520,540,690,700 0.5842 1.3600 0.6518 1.1938
12 480,520,650,690,700 0.6602 1.2295 0.6404 1.2132
For combination of two region wavelengths, Model 6 (λB+R) is observed to have the
poorest result which is compatible with the previous result showing the importance
of green wavelengths in correlation to SSC property of Sala Mango. Meanwhile, R2
for Model 4 decreases from 0.6418 to 0.5910 with RMSEC of 1.2624 oBrix increases
to RMSEP of 1.2938 oBrix showing the importance of red wavelengths in the SSC
prediction algorithm of mango samples. For three-regions-combined-algorithms, all
the predicted results seem to be higher showing the stability of the algorithms. The
best predictive model is Model 10 which is chosen based on criteria explained earlier
with high R2
for calibration and prediction, low RMSEC and RMSEP with small
difference between the two variables and is presented as scatter plot in Figure 4.13.
Calibration:
SSC (oBrix) =7.500+0.700R470- 0.770R520+ 0.265R570- 0.896R675+1.431R700 (4.6)
R2= 0.5970; RMSEC=1.3390
oBrix
Prediction:
R2= 0.6955; RMSEP= 1.1210
oBrix

65
Figure 4.13 Scatter plots of mango SSC prediction using D45 as light source
iii. D57
Table 4.8 shows the results for different wavelength selections of algorithms
produced using MLR technique using reflectance spectroscopic measurement under
D57 lighting. The best predictive model is shown in highlight.
Table 4.8 Calibration and prediction results of Sala Mango SSC through reflectance measurement
under D57 lighting
Model Grouping Wavelength(nm)
Calibration Prediction
R2
RMSEC
(oBrix)
R2
RMSEP
(oBrix)
1 λB 400,410,420,430,440 0.1235 1.9746 0.1570 1.8574
2 λG 510,520,530,540,550 0.5598 1.3993 0.5949 1.2877
3 λR 600,625,650,670,700 0.5420 1.4274 0.5424 1.3685
4 λB+G 420,450,480,520,550 0.5587 1.4011 0.6346 1.2229
5 λG+R 520,540,580, 620, 670 0.5596 1.4000 0.5719 1.3236
6 λB+R 420,450,480, 620,670 0.5434 1.4252 0.6715 1.1595
7
λB+G+R
420,470,550,615,675 0.4871 1.5105 0.5136 1.4109
8 450,520,580,615,650 0.5860 1.3571 0.6424 1.2097
9 455,520,550,675,700 0.5957 1.3410 0.6322 1.2269
10 470,520,570,675,700 0.5951 1.3421 0.6159 1.2591
11 430,520,540,690,700 0.6127 1.3126 0.5845 1.3040
12 440,520,610,690,700 0.6849 1.1840 0.5348 1.3798
For models generated from single region wavelengths (Model 1 to 3), the highest R2
still belongs to green wavelengths (Model 2) with R2 calibration of 0.5598 increases
to predicted R2 of 0.5949 and RMSEC of 1.3993
oBrix decreases to RMSEP of
16151413121110987
16
15
14
13
12
11
10
9
8
7
Actual SSC
Pre
dic
ted
SS
C

66
1.2877 oBrix. Red wavelengths produce satisfactory result while blue wavelengths
solely produce inacceptable result just like as shown in D35 and D45 cases. For
Models 4 to 6, the lowest R2 is found to be combination of green and red
wavelengths. This result shows the significance of blue wavelengths in algorithm
correlated to mango SSC despite having poor result for single region wavelengths.
On the other hand, absence of green wavelengths in contrast gives the best results
with R2
calibration of 0.5434 increases to R2 prediction of 0.6715 while RMSEC of
1.4252 oBrix drops to RMSEP of 1.1595
oBrix. This observation can deduce that
combination of wavelengths in visible region is indeed independent and cannot be
accounted from just one view. Besides, for this lighting, three-region-combined-
algorithms only produce slightly better results compared to D35 and D45. It is
obvious that CCT of LED indeed does influence the correlation and prediction of
mango intrinsic quality. The best predictive model is Model 8 and is presented as
scatter plot in Figure 4.14.
Calibration:
SSC (oBrix) = 7.89 + 0.1280R450- 0.453R520+ 0.427R580+ 0.89R615- 2.42R650 (4.7)
R2= 0.5860; RMSEC=1.3571
oBrix
Prediction:
R2= 0.6424; RMSEP= 1.2097
oBrix

67
Figure 4.14 Scatter plots of mango SSC prediction using D57 as light source
iv. Halogen Lamp
Table 4.9 shows the results for different wavelength selections of algorithms
produced using MLR technique using reflectance spectroscopic measurement under
halogen lamp lighting. The best predictive model is shown in highlight. For halogen
lamp, overall results are better with R2 of some models reaching more 0.7 compared
to LEDs results as shown in Table 4.6, Table 4.7 and Table 4.8.
Table 4.9 Calibration and prediction results of Sala Mango SSC through reflectance measurement
under halogen lamp lighting
Model Grouping Wavelength(nm)
Calibration Prediction
R2
RMSEC
(oBrix)
R2
RMSEP
(oBrix)
1 λB 400,410,420,430,440 0.1365 1.9600 0.0197 2.0030
2 λG 510,520,530,540,550 0.6134 1.3113 0.7129 1.0839
3 λR 600,625,650,670,700 0.5155 1.4681 0.6390 1.2156
4 λB+G 420,450,480,520,550 0.6064 1.3232 0.6789 1.1464
5 λG+R 520,540,580, 620, 670 0.5862 1.3568 0.5999 1.2797
6 λB+R 420,450,480, 620,670 0.5561 1.4052 0.6813 1.1421
7
λB+G+R
420,470,550,615,675 0.5397 1.4310 0.7181 1.0741
8 450,520,580,615,650 0.6051 1.3253 0.6963 1.1149
9 455,520,550,675,700 0.6087 1.3193 0.7085 1.0922
10 470,520,570,675,700 0.6059 1.3241 0.7276 1.0603
11 430,520,540,690,700 0.6204 1.2995 0.7018 1.1047
12 430,540,570,620,670 0.6280 1.2864 0.6188 1.2491
16151413121110987
16
15
14
13
12
11
10
9
8
7
Actual SSC
Pre
dic
ted
SS
C

68
For single region algorithms (Models 1 to 3), the results also match with
other LEDs such that green wavelengths used solely are best in predicting SSC of
Sala Mango with R2 of calibration of 0.6134 increases to 0.7129 and RMSEC of
1.3113 oBrix decreases to RMSEP of 1.0839
oBrix. On the other hand, for two-
region-algorithms, the poorest result goes to combination of green and red
wavelengths algorithm (Model 5) with matching results for LED cases except D45.
Combinations for λB+G and λB+R give approximately similar prediction R2 suggesting
importance of blue wavelengths in an algorithm. For the rests of the model, better R2
are also observed when three regions wavelengths are used to generate an algorithm.
All the results are not much in differ but the best model is still chosen based on high
R2 of calibration and prediction and low RMSEC and RMSEP. The best predictive
model is Model 10 and is presented as scatter plot in Figure 4.15.
Calibration:
SSC(oBrix)=7.560+0.428R470- 0.326R520 +0.104R570- 0.087R675+0.083R700 (4.8)
R2= 0.6059; RMSEC=1.3241
oBrix
Prediction:
R2= 0.7276; RMSEP= 1.0603
oBrix
Figure 4.15 Scatter plots of mango SSC prediction using halogen lamp as light source
16151413121110987
16
15
14
13
12
11
10
9
8
7
Actual SSC
Pre
dic
ted
SS
C

69
4.3.2(c) Summary
This study showed the capability of VIS spectroscopy to predict acidity and
soluble solids content attributes of Sala Mango despite different light sources are
used. Calibration and prediction models‟ performance of these attributes are
accessed to observe influence of lighting on spectroscopic measurement using Jaz
spectrometer. Table 4.10 shows the list of best predictive model for acidity
measurement of Sala Mango.
Table 4.10 Summary of best predictive model for acidity prediction of Sala Mango
Light
Source Calibration Algorithm
Calibration Prediction
R2
RMSEC
(oBrix)
R2
RMSEP
(oBrix)
D35 pH = 2.332 + 0.370R470 - 0.405R520
+0.133R570 - 0.438R675 + 0.769R700
0.9030 0.2654 0.9227 0.2271
D45 pH = 2.359 + 0.265R470 - 0.336R520
+0.122R570 - 0.463R675 + 0.749R700
0.9121 0.2526 0.9308 0.2150
D57
pH =2.532 + 0.388R470 - 0.233R520
+ 0.144R570
- 0.712R675
+
0.712R700
0.8979 0.2722 0.9145 0.2390
Halogen
lamp
pH=2.501+ 0.124R470 - 0.128R520
+ 0.044R570 - 0.0440R675
+
0.045R700
0.8995 0.2702 0.9114 0.2432
From the Table, it was found that despite huge difference in reflectance spectra of
Sala Mango between LEDs and halogen lamp, performance of calibration and
prediction models for acidity measurement for LEDs are able to give comparable
results with the halogen lamp‟s. Wavelength selection of the best predictive models
for all light sources is the same (470,520,570,675,700 nm) proving LED spectra
didn‟t alter spectroscopic acidity measurement of Sala Mango. Wavelengths chosen
in this work also indicate prominent wavelengths that match with the colour
attributes of mango fruit. Figure 4.16 gives an overview on the 12 model
performances (Refer Table 4.2 - 4.5) of the four light sources plotted in bar graphs.

70
Figure 4.16 Overview graph of 12 model performances for acidity prediction of Sala Mango
It is observed that halogen lamp shows more stable performances compared
to LEDs indicating wavelength selection used in calibration model under LED
lighting is more limited. Regardless, the R2 of calibration and prediction produced by
LEDs are still high with proper wavelengths chosen and therefore, it can be deduced
that LED can be an alternative to halogen lamp as light source in spectroscopic
acidity measurement of Sala Mango.
On the other hand, the results obtained for SSC are not as good as pH with
lower R2 obtained for calibration and prediction. Figure 4.17 shows an overview of
the 12 model performances (Refer Table 4.6 - 4.9) of SSC prediction of the four light
sources. Halogen lamp shows better performance compared to LEDs showing
stability of the light source as lighting in SSC spectroscopic measurement of Sala
Mango.
0
0.1
0.2
0.3
0.4
0.5
0.6
0.7
0.8
0.9
1
3500K LED 4500K LED 5700K LED Pro lamp
Pre
dic
ted
R2
1
2
3
4
5
6
7
8
9
10

71
Figure 4.17 Overview graph of 12 model performances for SSC prediction of Sala Mango
Despite the results obtained are not satisfactory, the influence of lightings on
spectroscopic measurement are now significant with wavelength selections for best
predictive models of each of the lightings are different from one another unlike in pH
case. Table 4.11 shows list of the best predictive models for SSC measurement of
Sala Mango. Even wavelength selections for similar light source (LEDs with
different CCTs) are different proving the hypothesis.
Therefore, it can be concluded that LED CCT indeed does affect
spectroscopic measurement of Sala Mango and indirectly influence the calibration
and prediction models‟ performance in correlating quality attributes of mango
samples. The small difference in R2 of best predictive models between halogen lamp
and LEDs for pH shows potential of LED in replacing halogen lamp as lighting in
spectroscopic measurement of Sala Mango.
0
0.1
0.2
0.3
0.4
0.5
0.6
0.7
0.8
3500K LED 4500K LED 5700K LED Pro lamp
Pre
dic
ted
R2
1
2
3
4
5
6
7
8
9
10
11
12

72
Table 4.11 Summary of best predictive model for SSC prediction of Sala Mango
Light
Source Calibration Algorithm
Calibration Prediction
R2
RMSEC
(oBrix)
R2
RMSEP
(oBrix)
D35
SSC(oBrix)=4.160 + 0.572R430 -
1.440R520 +0.846R540 - 1.786R690+
2.820R700
0.6361 1.2723 0.6903 1.1258
D45
SSC(oBrix)=7.500 + 0.700R470 -
0.770R520 +0.265R570
-
0.896R675+1.431R700
0.5970 1.3390 0.6955 1.1210
D57
SSC(oBrix)=7.890 + 0.128R540 -
0.453R520 + 0.427R580 + 0.890R615 -
2.42R650
0.5860 1.3571 0.6424 1.2097
Halogen
lamp
SSC(oBrix)=7.560 + 0.428R470
-
0.326R520 + 0.104R570 -0.087R675+
0.083R700
0.6059 1.3241 0.7276 1.0603
4.4 Direct Calibration Transfer of Sala Mango Visible Spectra between
Different Light Sources
The section before discussed on the influence of LED CCT on visible
spectroscopic measurement of SSC and pH of Sala Mango involving different
lightings and the development of prediction models for respective quality attributes
of mango using MLR method. Next, this section aims to access the potential of
direct calibration transfer technique between calibration models generated from
master lighting and after that predicted data from other light sources (slave lightings)
are transferred directly into the models to get predicted R2
and RMSEP. Difference
in R2 is calculated as a reference to stability of results obtained. Positive difference
indicates increment in prediction accuracy while negative difference indicates
reduction in prediction accuracy if compared to calibration R2. The main purpose of
this technique is to observe potential of interchanging light sources without
recalibration process which is time-consuming, costly and energy-depleting. Only
pH measurement is involved in this section as the results are highly stable and

73
strongly correlated to reflectance spectra as shown in the previous section. The
results presented here along with the wavelength selection are chosen from
combination of three regions wavelengths across visible range as they are found to
give better results than one or two regions wavelengths algorithms.
4.4.1 D35 as Master lighting
For first calibration transfer set, D35 is treated as master lighting and thus,
calibration algorithm produced by MLR method is transferred to other lightings to
get prediction results as shown in Table 4.12. The best predictive model is shown in
highlight. From Table 4.12, it is found that the percentage difference between
calibrated R2
and predicted R2
are quite large after direct calibration transfer
procedure. Out of the ten models, none of them can be fitted perfectly with high R2
and low RMSEP for the other three slave lightings simultaneously. This shows that
different predictive models have to be used when data is transferred between master
and slave lightings. The best calibration model developed using master lighting for
D45 as slave lighting is Model 9 as presented in Equation (4.9). The predicted R2 has
improved by 2.9% with value of 0.9289 and RMSEP of 0.2179 pH. The high R2 (>
0.9) and low RMSEP has proven that this technique is workable in transferring
spectra data from D45 lighting measurement into D35 calibration model.
pH =2.332+ 0.370R470 - 0.405R520 + 0.133R570- 0.438R675+0.769R700 (4.9)
R2
cal =0.9030; RMSEC =0.2654 pH
R2pred =0.9289; RMSEP =0.2179 pH

74
Table 4.12 Calibration and prediction results after Calibration Transfer using D35 as
Master Lighting
Model Wavelength(nm) Light Source
Calibration Prediction *Diff. in
R2 (%)
R2 RMSEC
(pH) R
2
RMSEP
(pH)
1 400,430,480,520,620
Halogen lamp
0.7338 0.4396
0.4298 0.6171 -41.4
D45 0.4165 0.6243 -43.2
D57 0.0118 0.8124 -98.4
2 420,470,550,615,675
Halogen lamp
0.7887 0.3917
0.0076 0.8141 -99.0
D45 0.6140 0.5078 -22.2
D57 0.0096 0.8133 -98.8
3 455,480,585,625,700
Halogen lamp
0.8475
0.3327
0.8348 0.3322 -1.5
D45 0.1710 0.7441 -79.8
D57 0.1532 0.7521 -81.9
4 440,520,540,600,690
Halogen lamp
0.8559 0.3235
0.6884 0.4562 -19.6
D45 0.8573 0.3087 +0.2
D57 0.8586 0.3073 +0.3
5 435,470,510,620,670
Halogen lamp
0.8648
0.3133
0.0001 0.8172 -100.0
D45 0.8021 0.3636 -7.3
D57 0.5168 0.5681 -40.2
6 460,520,550,580,700
Halogen lamp
0.8839
0.2904
0.7469 0.4111 -15.5
D45 0.9166 0.2360 +3.7
D57 0.5917 0.5222 -33.1
7 450,520,580,615,650
Halogen lamp
0.8866
0.2869
0.0258 0.8066 -97.1
D45 0.8705 0.2941 -1.8
D57 0.4524 0.6048 -49.0
8 455,520,550,675,700
Halogen lamp
0.8971
0.2733
0.7962 0.3689 -11.2
D45 0.9149 0.2384 +2.0
D57 0.5745 0.5331 -36.0
9 470,520,570,675,700
Halogen lamp
0.9030
0.2654
0.7981 0.3672 -11.6
D45 0.9289 0.2179 +2.9
D57 0.3762 0.6455 -58.3
10 430,520,540,690,700
Halogen lamp
0.9117
0.2532
0.7407 0.4161 -18.8
D45 0.9096 0.2458 -0.2
D57 0.7759 0.3869 -14.9
For D57 as slave lighting, the best calibration algorithm developed using master
lighting is Model 4 as shown in Equation (4.10). The R2
of prediction has increased
by 0.3% from 0.8559 to 0.8586, just a slight increment but at least stability of results
is achieved.
pH = 1.808 +0.089R440 -1.010R520 +0.704R540 -0.008 R600 +0.058R690 (4.10)
R2
cal =0.8559; RMSEC =0.3235 pH
R2pred =0.8586; RMSEP =0.3073 pH

75
The third set is calibration transfer between D35 as master lighting and
halogen lamp as slave lighting. Early prediction is that result for halogen lamp is
worst as the difference in light source spectra should impact more than difference in
correlated colour temperature of LED. The best calibration model generated using
D35 is Model 3 as presented in Equation 4.11. R2 prediction has a slight decrease of
1.5% after direct calibration transfer procedure.
pH = 1.546 + 0.870R455 - 2.510R480+ 0.208R585- 0.255R625+ 0.860R700 (4.11)
R2
cal =0.8475; RMSEC =0.3327 pH
R2pred =0.8348; RMSEP =0.3322 pH
In summary, it is shown that direct calibration transfer technique is
successfully applied from slave lightings into D35 calibration model with
satisfactory results and acceptable R2 difference (<5%) for each transfer. D45
possesses the best results after direct calibration transfer with prediction R2 of 0.9289
and low RMSEP of 0.2179 pH. This might due to the smallest difference of its LED
spectrum with D35‟s as shown in Figure 4.12. D57 has slightly better R2 compared
to halogen lamp but overall results are still stable with R2 above 0.8.
4.4.2 D45 as Master lighting
For second set, D45 is considered as master lighting and the others (D35,
D57 and halogen lamp) are treated as slave lightings. The spectra data from each
slave lighting is transferred directly into calibration model generated by master
lighting to get prediction results. The results are shown in Table 4.13 and the best
predictive model is shown in highlight. From Table 4.13, similar to D35‟s results, it
is found that different calibration models would actually affect the predictive results
obtained. The range in difference of R2 is wide therefore wavelength selection is
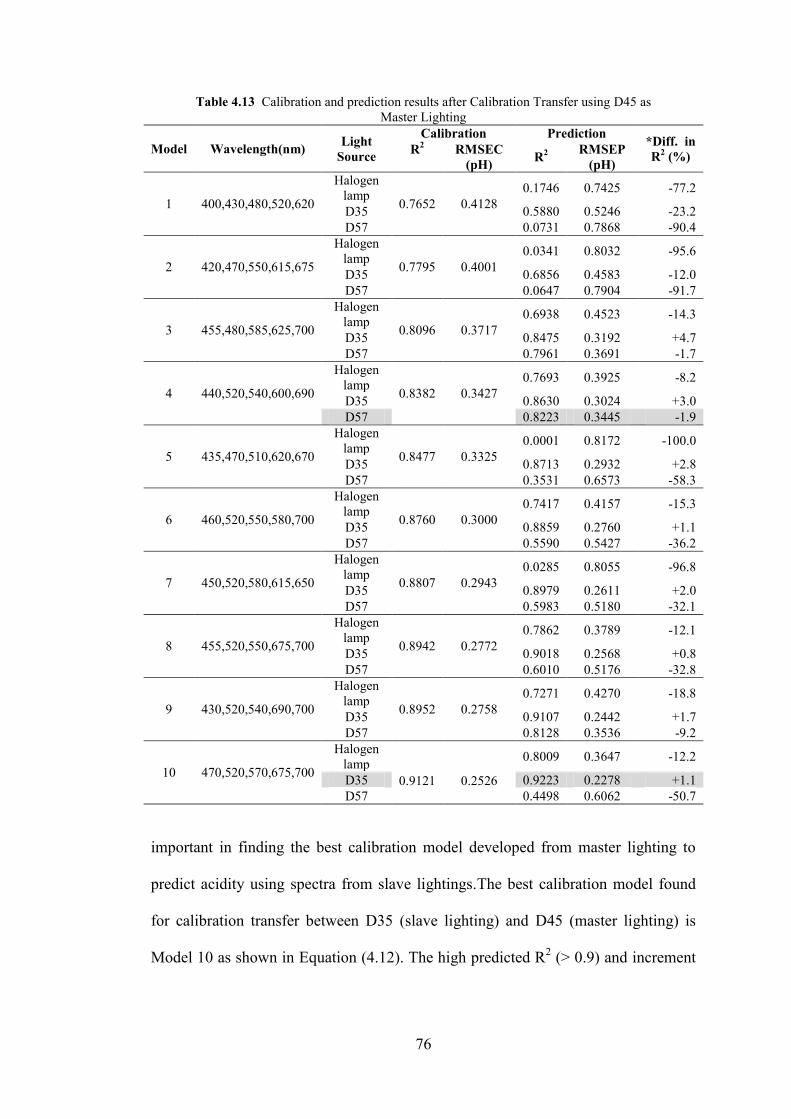
76
Table 4.13 Calibration and prediction results after Calibration Transfer using D45 as
Master Lighting
Model Wavelength(nm) Light
Source
Calibration Prediction *Diff. in
R2 (%)
R2 RMSEC
(pH) R
2
RMSEP
(pH)
1 400,430,480,520,620
Halogen
lamp 0.7652 0.4128
0.1746 0.7425 -77.2
D35 0.5880 0.5246 -23.2
D57 0.0731 0.7868 -90.4
2 420,470,550,615,675
Halogen
lamp 0.7795 0.4001
0.0341 0.8032 -95.6
D35 0.6856 0.4583 -12.0
D57 0.0647 0.7904 -91.7
3 455,480,585,625,700
Halogen
lamp 0.8096 0.3717
0.6938 0.4523 -14.3
D35 0.8475 0.3192 +4.7
D57 0.7961 0.3691 -1.7
4 440,520,540,600,690
Halogen
lamp 0.8382 0.3427
0.7693 0.3925 -8.2
D35 0.8630 0.3024 +3.0
D57 0.8223 0.3445 -1.9
5 435,470,510,620,670
Halogen
lamp 0.8477 0.3325
0.0001 0.8172 -100.0
D35 0.8713 0.2932 +2.8
D57 0.3531 0.6573 -58.3
6 460,520,550,580,700
Halogen
lamp 0.8760 0.3000
0.7417 0.4157 -15.3
D35 0.8859 0.2760 +1.1
D57 0.5590 0.5427 -36.2
7 450,520,580,615,650
Halogen
lamp 0.8807 0.2943
0.0285 0.8055 -96.8
D35 0.8979 0.2611 +2.0
D57 0.5983 0.5180 -32.1
8 455,520,550,675,700
Halogen
lamp 0.8942 0.2772
0.7862 0.3789 -12.1
D35 0.9018 0.2568 +0.8
D57 0.6010 0.5176 -32.8
9 430,520,540,690,700
Halogen
lamp
0.8952
0.2758
0.7271 0.4270 -18.8
D35 0.9107 0.2442 +1.7
D57 0.8128 0.3536 -9.2
10 470,520,570,675,700
Halogen
lamp
0.9121
0.2526
0.8009 0.3647 -12.2
D35 0.9223 0.2278 +1.1
D57 0.4498 0.6062 -50.7
important in finding the best calibration model developed from master lighting to
predict acidity using spectra from slave lightings.The best calibration model found
for calibration transfer between D35 (slave lighting) and D45 (master lighting) is
Model 10 as shown in Equation (4.12). The high predicted R2 (> 0.9) and increment

77
of 1.1% showing success of this technique in acidity measurement of Sala Mango
even when spectra measured using different lighting is used.
pH=2.359 +0.265R470 -0.336R520 + 0.122R570 - 0.463R675 +0.749R700 (4.12)
R2
cal =0.9121; RMSEC =0.2526 pH
R2pred =0.9223; RMSEP =0.2278 pH
For D57 as slave lighting, the best calibration model is Model 4 as presented
in Equation (4.13). R2
obtained for D57 as slave lighting is lower compared to D35
showing
pH= 1.803 + 0.042R440 - 0.738R520 + 0.525R540- 0.004R600+ 0.059R690 (4.13)
R2
cal =0.8382; RMSEC =0.3427 pH
R2pred =0.8223; RMSEP =0.3445 pH
Last but not least, calibration transfer between D45 as master lighting and
halogen lamp as slave lighting is observed. Results from Table 4.13 shows this
technique does not yield good results as the difference in R2 for the ten calibration
models are all decrement of more than 10%. The minimum decrement among the
models is from Model 10 which also produces a decrement of 12.2% giving
predicted R2 of 0.8009 and RMSEP of 0.3647 pH.
Therefore, for direct calibration transfer of slave lightings into calibration
models generated by D45 as master lighting, this technique is proved only successful
for LEDs lightings and not halogen lamp. Difference in the original light source
spectra is the key factor for this technique to be not applicable between these two
lightings.

78
4.4.3 D57 as Master lighting
Table 4.14 shows the predictive models after direct calibration transfer
procedure of spectra measured using slave lightings into calibration model generated
from D57 as master lighting. The best predictive model is shown in highlight. From
the table, once again, wide range in percentage difference of R2 is observed for all
the slave lightings as in D35 and D45 cases. Proper wavelength to generate
calibration model is important to obtain predictive model with high R2 and low
RMSE and small difference in percentage difference of R2.
Table 4.14 Calibration and prediction results after Calibration Transfer using D57 as
Master Lighting
Model Wavelength(nm) Light Source
Calibration Prediction *Diff. in
R2 (%)
R2 RMSEC
(pH) R
2
RMSEP
(pH)
1 400,430,480,520,620
Halogen lamp
0.7423 0.4325
0.0475 0.7976 -93.6
D35 0.4113 0.6271 -44.6
D45 0.2157 0.7238 -70.9
2 420,470,550,615,675
Halogen lamp
0.7565 0.4204
0.4782 0.5903 -36.8
D35 0.1936 0.7339 -74.4
D45 0.0216 0.8084 -97.1
3 455,480,585,625,700
Halogen lamp
0.8443 0.3362
0.8342 0.3328 -1.2
D35 0.3361 0.6659 -60.2
D45 0.5711 0.5352 -32.4
4 440,520,540,600,690
Halogen lamp
0.8482 0.3320
0.8325 0.3344 -1.9
D35 0.8880 0.2735 +4.7
D45 0.8779 0.2856 +3.5
5 435,470,510,620,670
Halogen lamp
0.8539 0.3256
0.0030 0.8160 -99.6
D35 0.8216 0.3452 -3.8
D45 0.7716 0.3906 -9.6
6 430,520,540,690,700
Halogen lamp
0.8712 0.3058
0.7377 0.4185 -15.3
D35 0.9059 0.2507 +4.0
D45 0.9080 0.2479 +4.2
7 460,520,550,580,700
Halogen lamp
0.8734 0.3032
0.6965 0.4503 -20.3
D35 0.8479 0.3187 -2.9
D45 0.7586 0.4015 -13.1
8 450,520,580,615,650
Halogen lamp
0.8824 0.2922
0.0828 0.7827 -90.6
D35 0.8401 0.3268 -4.8
D45 0.9000 0.2584 +2.0
9 455,520,550,675,700
Halogen lamp
0.8938 0.2777
0.7699 0.3921 -13.9
D35 0.8982 0.2608 +0.5
D45 0.8392 0.3277 -6.1
10 470,520,570,675,700
Halogen lamp
0.8979 0.2722
0.7950 0.3701 -11.5
D35 0.8075 0.3586 -10.1
D45 0.6766 0.4648 -24.6

79
Besides, calibration algorithm which produces high calibration R2 does not
necessarily produce high prediction R2 as shown by Model 10. The best calibration
algorithm developed using master lighting and produces the best results for D35 as
slave lighting is Model 6 as presented in Equation (4.14).
pH = 1.425 + 0.046R430- 0.411R520+ 0.273R540- 0.587R690+ 1.009R700 (4.14)
R2
cal =0.8712; RMSEC =0.3058 pH
R2pred =0.9059; RMSEP =0.2507 pH
Despite not having the highest RMSEC as compared to Model 7, 8, 9 and 10,
this model produces the highest predicted R2 and increment of 4.0% of R
2 showing
applicability of this model.
Next, for calibration set between D57 as master lighting and D45 as slave
lighting, the best calibration model is still Model 6 as presented in Equation (4.15).
Similar to D35 case, predicted R2 has increased by 4.2% to reach 0.9080 which is a
satisfactory result.
pH = 1.425 + 0.046R430- 0.411R520+ 0.273R540- 0.587R690+ 1.009R700 (4.15)
R2
cal =0.8712; RMSEC =0.3058 pH
R2pred =0.9080; RMSEP =0.2479 pH
For halogen lamp as slave lighting, the best calibration can be obtained is
Model 3 as presented in Equation (4.16). It is shown that results for halogen lamp is
poorer compared to results for calibration transfer between LEDs. The R2 obtained is
only roughly 0.8 compared to white LEDs which can reach up to 0.9. The percentage
difference in R2 is insignificant with decrement of only 1.2%.

80
pH = 1.753 + 0.355R455- 2.111R480+ 0.202R585- 0.305R625+ 0.967R700 (4.16)
R2
cal =0.8443; RMSEC =0.3362 pH
R2pred =0.8342; RMSEP =0.3328 pH
Therefore, it can be deduced that direct calibration transfer technique using D57 as
master lighting has successfully been applied to other slave lightings despite poorest
result is obtained for halogen lamp with R2 about 0.83 only. Most of the results show
positive responses when direct calibration technique is applied between LEDs. In the
next subsection, calibration transfer between halogen lamp as master lighting and
LEDs is investigated instead.
4.4.4 Halogen lamp as Master lighting
Table 4.15 shows the calibration models generated using halogen lamp as
master lighting and predictive results for white LEDs as slave lightings. From Table
4.15, it is shown that overall results for acidity prediction of Sala Mango after
transferring of spectra from slave lightings into calibration model generated by
master lighting has poorer results as compared to LEDs as master lighting. The
highest calibration R2 only reaches 0.8995 and difference in R
2 is also big (mostly
greater than 10% of decrement). The best calibration model for D35 and D45 is
Model 10 but their minimum percentages of decrement are big (7.3% for D35 and
10.7% for D45) hence, results are rejected for these two lightings. For D57 as slave
lighting, the result is worst with best calibration model having even lower calibrated
R2 (0.8388) compared to another two LEDs (0.8995) and greater percentage of
decrement up to 38.2% which is too big to be considered as true results. Thus, this
technique is not successfully applied when halogen lamp is used as master lighting

81
as percentage of difference in R2 between calibration and prediction values for the
entire three slave lightings are great.
Table 4.15 Calibration and prediction results after Calibration Transfer using halogen lamp as
Master Lighting
Model Wavelength(nm) Light
Source
Calibration Prediction *Diff. in
R2 (%)
R2 RMSEC
(pH) R
2
RMSEP
(pH)
1 400,430,480,520,620
D35
0.6485 0.5051
0.1535 0.7519 -76.3
D45 0.0532 0.7952 -91.8
D57 0.0072 0.8143 -98.9
2 455,480,585,625,700
D35
0.8039 0.3773
0.0914 0.7790 -88.6
D45 0.0069 0.8144 -99.1
D57 0.0072 0.8143 -99.1
3 420,470,550,615,675
D35
0.8276
0.3538
0.7034 0.4451 -15.0
D45 0.5885 0.5242 -28.9
D57 0.0716 0.7875 -91.3
4 440,520,540,600,690
D35
0.8388 0.3421
0.5979 0.5182 -28.7
D45 0.4463 0.6081 -46.8
D57 0.5183 0.5672 -38.2
5 435,470,510,620,670
D35
0.8401 0.3407
0.2964 0.6855 -64.7
D45 0.1064 0.7725 -87.3
D57 0.0128 0.8120 -98.5
6 460,520,550,580,700
D35
0.8616 0.3170
0.7669 0.3945 -11.0
D45 0.6441 0.4875 -25.2
D57 0.4007 0.6327 -53.5
7 450,520,580,615,650
D35
0.8751 0.3012
0.4586 0.6014 -47.6
D45 0.2520 0.7068 -71.2
D57 0.4990 0.5784 -43.0
8 430,520,540,690,700
D35
0.8828 0.2917
0.0849 0.7818 -90.4
D45 0.1671 0.7458 -81.1
D57 0.1181 0.7675 -86.6
9 455,520,550,675,700
D35
0.8833
0.2911
0.7621 0.3986 -13.7
D45 0.1902 0.7354 -78.5
D57 0.2589 0.7035 -70.7
10 470,520,570,675,700
D35
0.8995
0.2702
0.8335 0.3335 -7.3
D45 0.8032 0.3626 -10.7
D57 0.2095 0.7266 -76.7
4.4.5 Summary
From this section, it is proven that direct calibration transfer technique
involving different lightings in prediction of Sala Mango acidity has been
successfully applied between LEDs with different CCT. This technique can be
performed easily without any complex step yet at the same time can avoid the need
of recalibration.
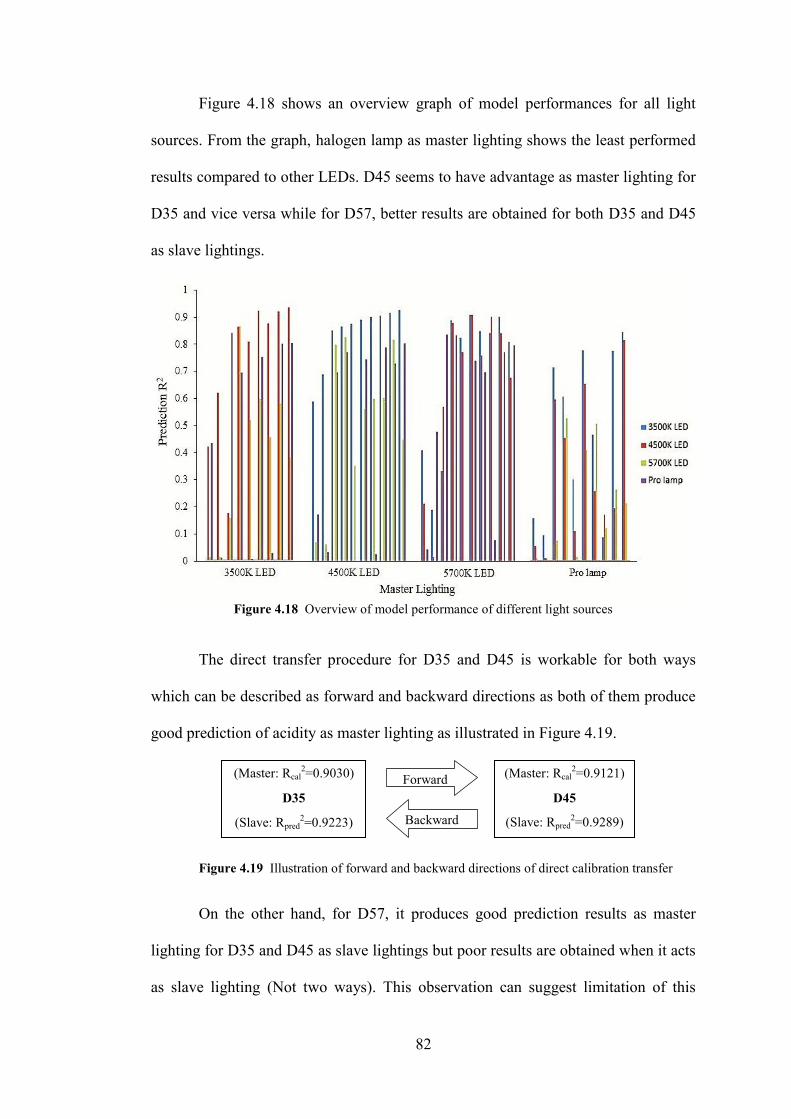
82
Figure 4.18 shows an overview graph of model performances for all light
sources. From the graph, halogen lamp as master lighting shows the least performed
results compared to other LEDs. D45 seems to have advantage as master lighting for
D35 and vice versa while for D57, better results are obtained for both D35 and D45
as slave lightings.
Figure 4.18 Overview of model performance of different light sources
The direct transfer procedure for D35 and D45 is workable for both ways
which can be described as forward and backward directions as both of them produce
good prediction of acidity as master lighting as illustrated in Figure 4.19.
Figure 4.19 Illustration of forward and backward directions of direct calibration transfer
On the other hand, for D57, it produces good prediction results as master
lighting for D35 and D45 as slave lightings but poor results are obtained when it acts
as slave lighting (Not two ways). This observation can suggest limitation of this
(Master: Rcal2=0.9121)
D45
(Slave: Rpred2=0.9289)
(Master: Rcal2=0.9030)
D35
(Slave: Rpred2=0.9223) Backward
Forward

83
procedure to be white LED of higher CCT should be master lighting rather than
lower CCT LED else the accuracy of results might have to be compromised. Table
4.16 lists the overall results of the best predictive models after direct calibration
transfer procedure between master and slave lightings. In summary, it can be
deduced that this procedure is more applicable for calibration transfer between two
similar light sources (LEDs with different CCTs) rather than two different spectra
light sources (LED and halogen lamp).
Table 4.16 Summary of best predictive model results after direct calibration procedure
between master and slave lightings
Master
Lighting
Slave
Lighting Calibration Algorithm
Calibration Prediction Diff. in
R2 (%) R2 RMSEC
(pH) R2
RMSEP
(pH)
D35
D45
pH=2.332+0.370R470
-
0.4052R520 +0.1327R570
-0.4382R675
+ 0.769R700
0.9030
0.2654
0.9289 0.2179 +2.9
D57
pH=1.808+0.0891R440 -
1.010R520 +0.704R540
-
0.008R600 +0.058R690
0.8559 0.3235 0.8573 0.3087 +0.2
Halogen
lamp
pH=1.546+0.870R455 -
2.510R480+ 0.208R585 -
0.255R625 +0.860R700
0.8475
0.3327
0.8348 0.3322 -1.5
D45
D35
pH=2.359+ 0.2650R470
-0.336R520+0.122R570 -
0.463R675 +0.749R700
0.9121 0.2526 0.9223 0.2278 +1.1
D57
pH= 1.803 +0.042R440 -
0.738R520 +0.525R540
-0.004R600 + 0.059R690
0.8382 0.3427 0.8223 0.3445 -1.9
Halogen
lamp - 0.8382 0.3427 0.7693 0.3925 -8.2
D57
D35
pH = 1.425 +0.046R430
- 0.411R520+ 0.273R540-
0.587R690+ 1.009R700
0.8712 0.3058 0.9059 0.2507 +4.0
D45
pH = 1.425 +0.046R430
- 0.411R520+ 0.273R540
- 0.587R690+ 1.009R700
0.8712 0.3058 0.9080 0.2479 +4.2
Halogen
lamp
pH = 1.753 + 0.355R455
- 2.111R480+ 0.202R585-
0.305R625+ 0.967R700
0.8443 0.3362 0.8342 0.3328 -1.2

84
CHAPTER 5
CONCLUSION AND FUTURE RECOMMENDATIONS
5.1 Conclusion
The present studies showed the investigation and application of the visible
spectroscopy system in accessing acidity and soluble solids content of Sala Mango.
This research can be summarized in such a way spectra of fruit samples are collected
using reflectance mode of Jaz spectrometer under different lightings and then
calibration algorithms are developed to correlate with the quality attributes. Prior to
study of real sample, study on colour samples are first performed to check on the
interaction of lighting with colour as measured by spectrometer.
The preliminary study is conducted to observe blue, red and green colour
series illuminated by D35, D45, D57 and halogen lamp as measured using Jaz
spectrometer. Results are given in peak wavelength and spectral gradient. Based on
the results obtained, the peak wavelength for green and blue colour series has a slight
difference but still consider near to halogen lamp‟s value. Red colour series is the
only one which has significant difference. Spectral gradient which indicates the
responsivity of colour measured by spectroscopy has more significant difference
than peak wavelength. Blue and green colour series have better responsivity at
higher CCT LED following the pattern of white diffuse reflectance spectra but in
contrast for red colour series observation, responsivity is better for lower CCT LED.
This has proven that composition of blue light and phosphor in white LED have
influence on spectroscopic measurement of colour samples.
Second part of this study is to investigate the influence of LED CCT on
visible spectroscopic measurement of intrinsic qualities of Sala Mango. From

85
preliminary study, lighting actually does change the colour measurement by
spectrometer but further work is done to prove correlation to acidity and soluble
solids content of mango samples. It was seen that LED spectra greatly altered the
reflectance spectra of mango sample with the obvious blue radiation at 400-480 nm.
Carotenoid pigments (~475-490 nm) are not observed from spectra due to the strong
blue radiation from the LED itself but anthocyanins and chlorophyll-a are still
observable which can be detected at roughly 550 nm and 675 nm. Despite the huge
difference in reflectance spectra, it was found that algorithms developed using MLR
are still able to produce good calibration and prediction performance for acidity and
lower accuracy for SSC measurement. Nevertheless, LED CCT has shown direct
influence on the model performance as represented in R2 and RMSE. The highest
prediction accuracy for acidity measurement produced using D35 is R2
= 0.9227 and
RMSEP = 0.2271 pH; for D45 is R2
= 0.9308 and RMSEP = 0.2150 pH; D57 with
R2
= 0.9145 and RMSEP = 0.2390 pH and lastly halogen lamp with R2 =
0.9114 and
RMSEP = 0.2432 pH. For SSC measurement, the best prediction accuracy developed
by best model for D35 is R2
= 0.6903 and RMSEP = 1.1258 oBrix; for D45 is R
2 =
0.6955 and RMSEP = 1.1210 oBrix; D57 with R
2 = 0.6424 and RMSEP = 1.2097
oBrix and halogen lamp with R
2 = 0.7276 and RMSEP = 1.0603
oBrix.
Last part of this study focuses on the exploration of possibility of direct
calibration transfer procedure between similar type of light sources (LEDs with
different CCT) and between different type of light sources (halogen lamp and
LEDs). The calibration algorithm developed using master lighting is transferred to
slave lightings for prediction of acidity measurement of Sala Mango. The best
prediction accuracy obtained with D35 as master lighting and D45 as slave lighting
is R2 = 0.9289 and RMSEP = 0.2179 pH, R
2 = 0.8586 and RMSEP = 0.3073 pH for

86
D57 and lastly for halogen lamp as slave lighting, R2 = 0.8348 and RMSEP = 0.3322
pH. For D45 as master lighting, the best prediction results are as follow. For D35 as
slave lighting, R2
= 0.9223 and RMSEP = 0.2278 pH are obtained, R2
= 0.8223 and
RMSEP = 0.3445 pH for D57 and lastly halogen lamp as slave lighting has a poor
result with decrement of 12.2% from the calibration R2
and hence, result is omitted.
Next, for D57 acts as master lighting and D35, D45 and halogen lamp act as slave
lightings. The results are as follow: R2 = 0.9059 and RMSEP = 0.2507 pH for D35,
R2 = 0.9080 and RMSEP = 0.2479 pH for D45 and R
2 = 0.8342 and RMSEP =
0.3328 pH for halogen lamp. Based on the results obtained, LED CCT indeed does
affect spectroscopic measurement of Sala Mango as poor results are obtained when
direct calibration procedures are applied between lower CCT LEDs (D35 and D45)
and high CCT LED (D57). D35 and D45 can be transferred perfectly in forward and
backward directions with excellent performance in prediction R2 while D57 only
gives good results when it acts as master lighting. Hence, from this observation, it
can be deduced that higher CCT can only be master lighting and its algorithm to be
transferred to lower CCT LED as slave lightings and not vice versa. Lastly, when
halogen lamp acts as master lighting, it was found that the results are not acceptable
with error up high to 99%. The best result is only found for D35 as slave lighting but
the percentage difference in R2 is also more than 5% (decrement of 7.3%). Hence, it
can be inferred that this procedure is not suitable for transfer between two different
types of light sources. Nevertheless, this direct calibration transfer procedure is
proven to be successfully utilized between LEDs with different CCT in prediction of
acidity of Sala Mango without requiring complicated steps.
In summary, this research has explored the influence of LED CCT on colour
measurement, confirmed the applicability of LED as lighting in spectroscopic

87
measurement of acidity and soluble solids content of Sala Mango and introduced the
direct transfer calibration transfer method between similar types of light source
(LEDs with different CCT).
5.2 Future Recommendations
This thesis has just presented the introduction of LED as lighting in spectroscopy
instrumentation in measuring RGB colour samples and intrinsic properties of Sala
Mango. However, further studies are still needed for future work to improve and
maximise the utilization of this technology to be useful and beneficial in the future.
Hence, several recommendations are suggested and enumerated as follows:
The methodology used in this work has only been applied to mango samples.
Therefore, it would be good to continue research line by testing on different
fruit samples to further verify the applicability of LED as lighting in
replacement of halogen lamp in spectroscopy instrumentation.
Different measurements setup such as interactance, transmittance or
fluorescence mode can be used to compare the results obtained in this thesis.
Different chemometrics method such as PLS and PCA can be tested in
dealing with spectral data. Area under curve analysis technique also can be
applied on colour paper spectra to differentiate between glossy and non-
glossy results.
Optical filter such as long pass filter can be tried out to filter the blue light
emitted from white LED and check on the differences in model performance
Different type of white LED can be used in spectroscopic measurement to
expand investigation and enhance practicability of LED for future prospect.
88
REFERENCES
Abbott, J. A. (1999). Quality measurement of fruits and vegetables. Postharvest biology
and technology, 15(3), 207-225.
Abdi, H. (2003). Multivariate analysis Encyclopedia for research methods for the social
sciences (pp. 699-702).
Barbut, S. (2001). Effect of illumination source on the appearance of fresh meat cuts.
Meat science, 59(2), 187-191.
Behar-Cohen, F., Martinsons, C., Viénot, F., Zissis, G., Barlier-Salsi, A., Cesarini, J.,
Enouf, O., Garcia, M., Picaud, S., & Attia, D. (2011). Light-emitting diodes
(LED) for domestic lighting: Any risks for the eye? Progress in retinal and eye
research, 30(4), 239-257.
Birth, G. (1976). How light interacts with foods. In “Quality Detection in Foods” Ed.
Gaffney, JJ: American Society of Agricultural Engineers, St. Joseph, MI.
Blanco, M., & Villarroya, I. (2002). NIR spectroscopy: a rapid-response analytical tool.
TrAC Trends in Analytical Chemistry, 21(4), 240-250.
Bobelyn, E., Serban, A.-S., Nicu, M., Lammertyn, J., Nicolai, B. M., & Saeys, W.
(2010). Postharvest quality of apple predicted by NIR-spectroscopy: study of the
effect of biological variability on spectra and model performance. Postharvest
biology and technology, 55(3), 133-143.
Brownleader, M., Jackson, P., Mobasheri, A., Pantelides, A., Sumar, S., Trevan, M., &
Dey, P. (1999). Molecular aspects of cell wall modifications during fruit
ripening. Critical Reviews in Food Science and Nutrition, 39(2), 149-164.

89
Camps, C., & Christen, D. (2009). Non-destructive assessment of apricot fruit quality by
portable visible-near infrared spectroscopy. LWT-Food Science and Technology,
42(6), 1125-1131.
Cen, H., Bao, Y., He, Y., & Sun, D.-W. (2007). Visible and near infrared spectroscopy
for rapid detection of citric and tartaric acids in orange juice. Journal of Food
Engineering, 82(2), 253-260.
Chen, J. Y., Zhang, H., & Matsunaga, R. (2006). Rapid determination of the main
organic acid composition of raw Japanese apricot fruit juices using near-infrared
spectroscopy. Journal of agricultural and food chemistry, 54(26), 9652-9657.
Chen, P. (1978). Use of optical properties of food materials in quality evaluation and
materials sorting. Journal of Food Process Engineering, 2(4), 307-322.
Cho, S., Han, A., Taylor, M. H., Huck, A. C., Mishler, A. M., Mattal, K. L., Barker, C.
A., & Seo, H.-S. (2015). Blue lighting decreases the amount of food consumed
in men, but not in women. Appetite, 85, 111-117.
Cortés, V., Ortiz, C., Aleixos, N., Blasco, J., Cubero, S., & Talens, P. (2016). A new
internal quality index for mango and its prediction by external visible and near-
infrared reflection spectroscopy. Postharvest biology and technology, 118, 148-
158.
Davey, M. W., Saeys, W., Hof, E., Ramon, H., Swennen, R. L., & Keulemans, J.
(2009). Application of visible and near-infrared reflectance spectroscopy
(Vis/NIRS) to determine carotenoid contents in banana (Musa spp.) fruit pulp.
Journal of agricultural and food chemistry, 57(5), 1742-1751.
De Almeida, A., Santos, B., Paolo, B., & Quicheron, M. (2014). Solid state lighting
review–Potential and challenges in Europe. Renewable and Sustainable Energy
Reviews, 34, 30-48.
90
Delwiche, S. R., Mekwatanakarn, W., & Wang, C. Y. (2008). Soluble solids and simple
sugars measurement in intact mango using near infrared spectroscopy.
HortTechnology, 18(3), 410-416.
Department of Energy, U. S. (2014). True Colors (E. E. a. R. Energy, Trans.) (pp. 8).
El-Ramady, H. R., Domokos-Szabolcsy, É., Abdalla, N. A., Taha, H. S., & Fári, M.
(2015). Postharvest Management of Fruits and Vegetables Storage Sustainable
Agriculture Reviews (pp. 65-152): Springer.
ElMasry, G., Wang, N., ElSayed, A., & Ngadi, M. (2007). Hyperspectral imaging for
nondestructive determination of some quality attributes for strawberry. Journal
of Food Engineering, 81(1), 98-107.
Esbensen, K. H., Guyot, D., Westad, F., & Houmoller, L. P. (2002). Multivariate Data
Analysis: In Practice : an Introduction to Multivariate Data Analysis and
Experimental Design: CAMO.
Etienne, A., Génard, M., Lobit, P., Mbeguié-A-Mbéguié, D., & Bugaud, C. (2013).
What controls fleshy fruit acidity? A review of malate and citrate accumulation
in fruit cells. Journal of experimental botany, 64(6), 1451-1469.
Fonollosa, J., Fernández, L., Gutiérrez-Gálvez, A., Huerta, R., & Marco, S. (2016).
Calibration transfer and drift counteraction in chemical sensor arrays using
Direct Standardization. Sensors and Actuators B: Chemical.
Francis, F. (1995). Quality as influenced by color. Food quality and preference, 6(3),
149-155.
Fu, X.-p., Li, J.-p., Zhou, Y., Ying, Y.-b., Xie, L.-j., Niu, X.-y., Yan, Z.-k., & Yu, H.-y.
(2009). Determination of soluble solid content and acidity of loquats based on
FT-NIR spectroscopy. Journal of Zhejiang University Science B, 10(2), 120-125.

91
Gómez, A. H., He, Y., & Pereira, A. G. (2006). Non-destructive measurement of acidity,
soluble solids and firmness of Satsuma mandarin using Vis/NIR-spectroscopy
techniques. Journal of Food Engineering, 77(2), 313-319.
Guidetti, R., Beghi, R., & Giovenzana, V. (2012). Chemometrics in food technology:
INTECH Open Access Publisher.
Guo, Z., Huang, W., Chen, L., Wang, X., & Peng, Y. (2013). Nondestructive evaluation
of soluble solid content in strawberry by near infrared spectroscopy. Paper
presented at the Third International Conference on Photonics and Image in
Agriculture Engineering (PIAGENG 2013).
Held, G. (2016). Introduction to light emitting diode technology and applications: CRC
Press.
Hemming, D. (2013). Plant Sciences Reviews 2012: CABI.
Hu, R., & Xia, J. (2011). Calibration transfer of near infrared spectroscopy based on
DS algorithm. Paper presented at the Electric Information and Control
Engineering (ICEICE), 2011 International Conference on.
Hunter, R. S. (1987). The measurement of appearance: John Wiley & Sons.
Ignat, T. (2012). Non-destructive methods for determination of quality attributes of bell
peppers. PhD Thesis, Corvinus University of Budapest.
Jamshidi, B., Minaei, S., Mohajerani, E., & Ghassemian, H. (2012). Reflectance
Vis/NIR spectroscopy for nondestructive taste characterization of Valencia
oranges. Computers and electronics in agriculture, 85, 64-69.
Jha, S., Chopra, S., & Kingsly, A. (2005). Determination of sweetness of intact mango
using visual spectral analysis. Biosystems engineering, 91(2), 157-161.
92
Jha, S., Jaiswal, P., Narsaiah, K., Gupta, M., Bhardwaj, R., & Singh, A. K. (2012). Non-
destructive prediction of sweetness of intact mango using near infrared
spectroscopy. Scientia Horticulturae, 138, 171-175.
Jha, S., Kingsly, A., & Chopra, S. (2006). Non-destructive determination of firmness
and yellowness of mango during growth and storage using visual spectroscopy.
Biosystems engineering, 94(3), 397-402.
Jha, S., Narsaiah, K., Sharma, A., Singh, M., Bansal, S., & Kumar, R. (2010). Quality
parameters of mango and potential of non-destructive techniques for their
measurement—a review. Journal of food science and technology, 47(1), 1-14.
Jha, S. N. (2010). Near infrared spectroscopy Nondestructive Evaluation of Food
Quality (pp. 141-212): Springer.
Jost-Boissard, S., Fontoynont, M., & Blanc-Gonnet, J. (2009). Perceived lighting quality
of LED sources for the presentation of fruit and vegetables. Journal of Modern
Optics, 56(13), 1420-1432.
Kenkel, J. (2010). Analytical Chemistry for Technicians, Third Edition: CRC Press.
Knee, M. (2002). Fruit Quality and Its Biological Basis: Sheffield Academic Press.
Lawless, H. T., & Heymann, H. (2010). Color and appearance Sensory Evaluation of
Food (pp. 283-301): Springer.
Leader Tech, I. (2016). The Basics of the Electromagnetic Spectrum Retrieved August
22, 2016, from https://leadertechinc.com/blog/basics-electromagnetic-spectrum/
Li, J., Huang, W., Zhao, C., & Zhang, B. (2013). A comparative study for the
quantitative determination of soluble solids content, pH and firmness of pears by
Vis/NIR spectroscopy. Journal of Food Engineering, 116(2), 324-332.

93
Liew, C., & Lau, C. (2012). Determination of quality parameters in Cavendish banana
during ripening by NIR spectroscopy. Int Food Res J, 19(2), 751-758.
Lin, H., & Ying, Y. (2009). Theory and application of near infrared spectroscopy in
assessment of fruit quality: a review. Sensing and instrumentation for food
quality and safety, 3(2), 130-141.
Litz, R. E. (2009). The mango: botany, production and uses: CABI.
Liu, R. H. (2003). Health benefits of fruit and vegetables are from additive and
synergistic combinations of phytochemicals. The American journal of clinical
nutrition, 78(3), 517S-520S.
Luo, W., Huan, S., Fu, H., Wen, G., Cheng, H., Zhou, J., Wu, H., Shen, G., & Yu, R.
(2011). Preliminary study on the application of near infrared spectroscopy and
pattern recognition methods to classify different types of apple samples. Food
chemistry, 128(2), 555-561.
McMurry, V. (2006). Mastering Color: North Light Books.
Ministry of Agriculture and Agro-Based Industry, M. (2015 ). Agrofood Statistics 2014
(pp. 22).
Ministry of Agriculture and Agro-Based Industry, M. (2016). Mango Retrieved January
4, 2016, from http://www.moa.gov.my/buah-buahan
Munawar, A. A., von Hörsten, D., Mörlein, D., Pawelzik, E., & Wegener, J. K. (2013).
Rapid and non-destructive prediction of mango sweetness and acidity using near
infrared spectroscopy. Paper presented at the GIL Jahrestagung.

94
Nicolai, B. M., Beullens, K., Bobelyn, E., Peirs, A., Saeys, W., Theron, K. I., &
Lammertyn, J. (2007). Nondestructive measurement of fruit and vegetable
quality by means of NIR spectroscopy: A review. Postharvest biology and
technology, 46(2), 99-118.
Nicolaï, B. M., Defraeye, T., De Ketelaere, B., Herremans, E., Hertog, M. L., Saeys, W.,
Torricelli, A., Vandendriessche, T., & Verboven, P. (2014). Nondestructive
measurement of fruit and vegetable quality. Annual review of food science and
technology, 5, 285-312.
Nip, W.-K. (1993). Determining Internal Quality of Mango Fruit. Paper presented at the
Conference on Mango in Hawaii, Honolulu, Hawaii.
Noh, S.-H., & Choi, K.-H. (2006). Nondestructive quality evaluation technology for
fruits and vegetables. Paper presented at the International Seminar on Enhancing
Export Competitiveness of Asian Fruits, Bangkok, Thailand.
Ocean Optics, I. (2010). Jaz Installation and Operation Manual. Retrieved from
http://oceanoptics.com///wp-content/uploads/Jazinstallationandoperation.pdf
Omar, A., & MatJafri, M. (2013). Principles, methodologies and technologies of fresh
fruit quality assurance. Quality Assurance and Safety of Crops & Foods, 5(3),
257-271.
Omar, A. F. (2013). Spectroscopic profiling of soluble solids content and acidity of
intact grape, lime, and star fruit. Sensor Review, 33(3), 238-245.
Osram Opto, S. (2011). LCW W5AM.PC - Golden Dragon Plus White
(English/Deutsch) (Datasheet). Retrieved 8 May 2017 http://uk.rs-
online.com/webdocs/102d/0900766b8102d17a.pdf

95
Osram Opto, S. (2015a). LCW W5AM - Golden Dragon Plus White (English/Deutsch)
(Datasheet). Retrieved 8 May 2017 http://www.osram-
os.com/Graphics/XPic6/00199188_0.pdf/LCW%20W5AM%20-
%20GD%20PLUS%20WHITE%20(EnglishDeutsch).pdf
Osram Opto, S. (2015b). LUW W5AM - Golden Dragon Plus White (English/Deutsch)
(Datasheet). Retrieved 8 May 2017 http://www.osram-
os.com/Graphics/XPic9/00197237_0.pdf/LUW%20W5AM%20-
%20GD%20PLUS%20WHITE%20(EnglishDeutsch).pdf
Paz, P., Sánchez, M.-T., Pérez-Marín, D., Guerrero, J. E., & Garrido-Varo, A. (2009).
Instantaneous quantitative and qualitative assessment of pear quality using near
infrared spectroscopy. Computers and electronics in agriculture, 69(1), 24-32.
Peng, J., Peng, S., Jiang, A., & Tan, J. (2011). Near-infrared calibration transfer based
on spectral regression. Spectrochimica Acta Part A: Molecular and
Biomolecular Spectroscopy, 78(4), 1315-1320.
Pholpho, T., Pathaveerat, S., & Sirisomboon, P. (2011). Classification of longan fruit
bruising using visible spectroscopy. Journal of Food Engineering, 104(1), 169-
172.
Pode, R., & Diouf, B. (2011). Solar Lighting: Springer London.
Prelovsek, M., & Bizjak, G. (2006). Variations of color correlated temperature of white
led light. INFORMACIJE MIDEM-JOURNAL OF MICROELECTRONICS
ELECTRONIC COMPONENTS AND MATERIALS, 36(3), 134-139.
Rajkumar, P., Wang, N., EImasry, G., Raghavan, G., & Gariepy, Y. (2012). Studies on
banana fruit quality and maturity stages using hyperspectral imaging. Journal of
Food Engineering, 108(1), 194-200.

96
Rencher, A. C. (2003). Methods of multivariate analysis (Vol. 492): John Wiley &
Sons.
Richarme, M. (2002). Eleven Multivariate Analysis Techniques: Key Tools In Your
Marketing Research Survival Kit.
Romano, G. S., Cittadini, E. D., Pugh, B., & Schouten, R. (2006). Sweet cherry quality
in the horticultural production chain. Stewart Postharvest Review, 2(6), 1-9.
Ruiz-Altisent, M., Ruiz-Garcia, L., Moreda, G., Lu, R., Hernandez-Sanchez, N., Correa,
E., Diezma, B., Nicolaï, B., & García-Ramos, J. (2010). Sensors for product
characterization and quality of specialty crops—A review. Computers and
Electronics in Agriculture, 74(2), 176-194.
Salguero-Chaparro, L., Palagos, B., Peña-Rodríguez, F., & Roger, J. (2013). Calibration
transfer of intact olive NIR spectra between a pre-dispersive instrument and a
portable spectrometer. Computers and Electronics in Agriculture, 96, 202-208.
Seymour, G., Tucker, G. A., Poole, M., & Giovannoni, J. (2013). The Molecular
Biology and Biochemistry of Fruit Ripening: Wiley.
Seymour, G. B., Taylor, J. E., & Tucker, G. A. (2012). Biochemistry of Fruit Ripening:
Springer Netherlands.
Shao, Y., & He, Y. (2008). Nondestructive measurement of acidity of strawberry using
Vis/NIR spectroscopy. International Journal of Food Properties, 11(1), 102-
111.
Siddiqui, M. W. (2015). Postharvest Biology and Technology of Horticultural Crops.

97
Sinelli, N., Spinardi, A., Di Egidio, V., Mignani, I., & Casiraghi, E. (2008). Evaluation
of quality and nutraceutical content of blueberries (Vaccinium corymbosum L.)
by near and mid-infrared spectroscopy. Postharvest biology and technology,
50(1), 31-36.
Singh, Z., Singh, R. K., Sane, V. A., & Nath, P. (2013). Mango-postharvest biology and
biotechnology. Critical Reviews in Plant Sciences, 32(4), 217-236.
Spinelli, L., Rizzolo, A., Vanoli, M., Grassi, M., Zerbini, P. E., de Azevedo Pementel,
A. M., & Torricelli, A. (2013). Nondestructive assessment of fruit biological age
in Brazilian mangoes by time-resolved reflectance spectroscopy in the 540-900
nm spectral range. Paper presented at the InsideFood Symposium, 9-12 April
2013, Leuven, Belgium.
Subedi, P., & Walsh, K. B. (2011). Assessment of sugar and starch in intact banana and
mango fruit by SWNIR spectroscopy. Postharvest biology and technology,
62(3), 238-245.
Taguchi, T. (2008). Present status of energy saving technologies and future prospect in
white LED lighting. IEEJ Transactions on Electrical and Electronic
Engineering, 3(1), 21-26.
Tharanathan, R., Yashoda, H., & Prabha, T. (2006). Mango (Mangifera indica L.),―The
king of fruits‖—An overview. Food Reviews International, 22(2), 95-123.
Thomas, N. C. (1991). The early history of spectroscopy. Journal of chemical
education, 68(8), 631.
Timkhum, P., & Terdwongworakul, A. (2012). Non-destructive classification of durian
maturity of ‗Monthong‘cultivar by means of visible spectroscopy of the spine.
Journal of Food Engineering, 112(4), 263-267.

98
Titova, T. P., Nachev, V. G., & Damyanov, C. I. (2015). Food quality evaluation
according to their color characteristics. Facta Universitatis, Series: Automatic
Control and Robotics, 14(1), 1-10.
Tominaga, S., & Wandell, B. A. (1989). Standard surface-reflectance model and
illuminant estimation. JOSA A, 6(4), 576-584.
Utzinger, U., & Richards-Kortum, R. R. (2003). Fiber optic probes for biomedical
optical spectroscopy. Journal of Biomedical Optics, 8(1), 121-147.
Van Duyn, M. A. S., & Pivonka, E. (2000). Overview of the health benefits of fruit and
vegetable consumption for the dietetics professional: selected literature. Journal
of the American Dietetic Association, 100(12), 1511-1521.
Wang, S.-s., Sun, H.-n., Chen, J., & Sun, A.-d. (2012). Determination of soluble solids
content of blueberries with near infrared spectroscopy [J]. Science and
Technology of Food Industry, 1, 093.
Wanitchang, P., Terdwongworakul, A., Wanitchang, J., & Nakawajana, N. (2011). Non-
destructive maturity classification of mango based on physical, mechanical and
optical properties. Journal of Food Engineering, 105(3), 477-484.
Wonderful Technology, C. L. (2016). LED Color Temperature Correlation Example
Retrieved October 7, 2016, from http://www.wonderfulled.com/led-color-
temperature-correlation-example/
Yahaya, O., MatJafri, M., Aziz, A., & Omar, A. (2015). Visible spectroscopy calibration
transfer model in determining pH of Sala mangoes. Journal of Instrumentation,
10(05), T05002.
Yang, F. L., Cho, S., & Seo, H. S. (2015). Effects of Light Color on Consumers‘
Acceptability and Willingness to Eat Apples and Bell Peppers. Journal of
Sensory Studies.

99
Yuan, L. m., Sun, L., Cai, J. r., & Lin, H. (2015). A Preliminary Study on Whether the
Soluble Solid Content and Acidity of Oranges Predicted by Near Infrared
Spectroscopy Meet the Sensory Degustation. Journal of Food Process
Engineering, 38(4), 309-319.
Zerbini, P. E. (2006). Emerging technologies for non-destructive quality evaluation of
fruit. Journal of fruit and ornamental plant research, 14, 13.
Zerbini, P. E., Vanoli, M., Rizzolo, A., Grassi, M., de Azevedo Pimentel, R. M.,
Spinelli, L., & Torricelli, A. (2015). Optical properties, ethylene production and
softening in mango fruit. Postharvest biology and technology, 101, 58-65.
Zhang, H., Huang, J., Li, T., Wu, X., Svanberg, S., & Svanberg, K. (2014). Studies of
tropical fruit ripening using three different spectroscopic techniques. Journal of
Biomedical Optics, 19(6), 067001-067001.
Zhang, H., Wang, J., & Ye, S. (2008). Predictions of acidity, soluble solids and firmness
of pear using electronic nose technique. Journal of Food Engineering, 86(3),
370-378.
Ziosi, V., Noferini, M., Fiori, G., Tadiello, A., Trainotti, L., Casadoro, G., & Costa, G.
(2008). A new index based on vis spectroscopy to characterize the progression of
ripening in peach fruit. Postharvest biology and technology, 49(3), 319-329.