Embed Size (px)
Citation preview
Interim Report 930-466-1
EFFECTS OF TRAFFIC LOADS DURING FRP STRENGTHENING OF WAR MEMORIAL BRIDGE
Prepared by
Michael W. Reed Robert W. Barnes
Prepared for
Alabama Department of Transportation Montgomery, Alabama
October 2004
ii
ACKNOWLEDGEMENT
Material contained herein was obtained in connection with a research study, “Repair of the
Uphapee Creek Bridge with FRP Laminates”, ALDOT 930-466, conducted by the Auburn
University Highway Research Center. Funding for the project was provided by the Alabama
Department of Transportation using funds from the Federal Highway Administration’s
Innovative Bridge Research and Construction (IBRC) program. The funding, cooperation,
and assistance of many people from each of these organizations are gratefully acknowledged.
FRP materials for this portion of the study were donated by Fyfe Co., LLC and R.J. Watson,
Inc.
DISCLAIMER
The contents of this report reflect the views of the authors who are responsible for the facts
and accuracy of the data presented. The contents do not necessarily reflect the official views
or policies of the Federal Highway Administration or the Alabama Department of
Transportation. The report does not constitute a standard, specification, or regulation.
iii
ABSTRACT
While strengthening the War Memorial Bridge, it was unfeasible to close the bridge to
traffic. This brought forth the concern of how the load cycles, caused by traffic, affected the
bond of the FRP to the concrete. To examine this, eight RC beams were used to test the
flexural performance of beams externally reinforced with epoxy-bonded FRP and exposed to
load cycles during the curing of epoxy. One beam was unstrengthened and used as a control
specimen. Variables introduced to the strengthened specimens included: cycle intensity and
amplitude, epoxy thickness, and FRP thickness.
Comparisons of the experimental data demonstrated that the effects cycles have on the
ultimate strength of the FRP-reinforced beams were minimal. However, the load cycles
applied during curing of the epoxy seemed to increase the ductility of the specimens over
those not exposed to load cycles.
Failure of all strengthened specimens resulted from FRP debonding at a flexural crack
under one of the load points; the debonding then propagated out to the curtailment of the
FRP. ACI-recommended limits on the FRP strain to prevent this debonding were found to be
unconservative for the type of FRP used in this study.
The capacity of the War Memorial Bridge was calculated based on the measured limiting
FRP strain to prevent debonding. The capacity was also calculated based on limiting strains
calculated from various theories and design recommendations. The capacity of the
strengthened bridge is not sufficient to remove all load restrictions.
iv
CONTENTS LIST OF TABLES.................................................................................................................. vii LIST OF FIGURES ................................................................................................................. ix CHAPTER ONE: INTRODUCTION........................................................................................1 1.1 Background ..............................................................................................................1 1.2 Project Objectives ....................................................................................................2 1.3 Scope........................................................................................................................2 CHAPTER TWO: LITERATURE REVIEW............................................................................4 2.1 Effect of Load Cycles during Adhesive Cure ..........................................................4 2.1.1 MacDonald (1981) ....................................................................................4 2.1.2 Barnes and Mays (2001) ...........................................................................5 2.2 Failure Modes ..........................................................................................................6 2.2.1 Ductility ....................................................................................................7 2.3 FRP Anchorage........................................................................................................7 2.3.1 ACI 440.2R-02..........................................................................................8 2.3.2 De Lorenzis et al. (2001) ..........................................................................9 2.3.3 Harmon et al............................................................................................11 2.4 Summary................................................................................................................13 CHAPTER THREE: SPECIMEN DESIGN AND FABRICATION ......................................15 3.1 Beam Design..........................................................................................................15 3.1.1 Steel Reinforcement................................................................................16 3.1.2 Concrete ..................................................................................................17 3.1.3 FRP Reinforcement.................................................................................17 3.2 Material Properties.................................................................................................18 3.2.1 Concrete ..................................................................................................18 3.2.2 Steel Reinforcement................................................................................20 3.2.3 Epoxy and FRP .......................................................................................21 3.3 Specimen Fabrication.............................................................................................22 3.3.1 Formwork................................................................................................22 3.3.2 Steel Reinforcement................................................................................23 3.3.3 Casting and Curing of Specimens...........................................................25 3.4 Loading Equipment................................................................................................26 3.5 Instrumentation and Data Acquisition ...................................................................27
v
CHAPTER FOUR: TEST PROGRAM .............................................................................33 4.1 Cracking of Specimens ....................................................................................34 4.2 Application of Pre-Repair Cycles ....................................................................36 4.3 Surface Preparation..........................................................................................37 4.4 Application of Cycles during Epoxy Cure.......................................................38 4.5 Application of Saturant Epoxy.........................................................................41 4.6 Application of FRP ..........................................................................................43 4.7 Curing of Epoxy...............................................................................................46 4.8 Instrumentation of the FRP..............................................................................46 4.9 Application of Post-Repair Cycles...................................................................48 4.10 Test to Failure ................................................................................................48 CHAPTER FIVE: DISCUSSION OF RESULTS .............................................................50 5.1 Failure Modes ..................................................................................................50 5.2 Failure Characteristics .....................................................................................52 5.2.1 Control Beam....................................................................................53 5.2.2 Strengthened Beams..........................................................................53 5.2.3 Ductility ............................................................................................54 5.3 Anchorage Failure Mechanism........................................................................54 5.4 Specimens with Thin Epoxy and FRP Thickness of 0.055 in..........................58 5.4.1 Ultimate Strength and Deflection of Group 1...................................59 5.4.2 Yield Strength and Deflection of Group 1........................................61 5.5 Specimens with Thick Epoxy and FRP Thickness of 0.055 in........................62 5.5.1 Ultimate Strength and Deflection of Group 2...................................63 5.5.1.1 Performance of Thicker Epoxy..........................................64 5.5.2 Yield Strength and Deflection of Group 2........................................64 5.6 Specimens with Thin Epoxy and FRP Thickness of 0.075 in..........................65 5.6.1 Ultimate Strength and Deflection of Group 3...................................66 5.6.1.1 Performance of Thicker FRP .............................................66 5.6.2 Yield Strength and Deflection of Group 3........................................67 5.7 Effects of Different Levels of Cycles on the Stiffening of Epoxy...................67 5.8 Theoretical Results...........................................................................................69 5.8.1 Limiting Strain ..................................................................................69 5.8.2 Yield Strength ...................................................................................70 5.8.3 Ultimate Capacity .............................................................................71 CHAPTER SIX: IMPLICATIONS FOR THE WAR MEMORIAL BRIDGE.................75 6.1 Ultimate Capacity Using Measured Debonding FRP Strain ...........................75 6.2 Ultimate Capacity Using Theoretical Limiting FRP Strains ...........................79
vi
CHAPTER SEVEN: CONCLUSIONS AND RECOMMENDATIONS..........................82 7.1 Summary..........................................................................................................82 7.2 Conclusions......................................................................................................83 7.3 Recommendations............................................................................................84 REFERENCES ..................................................................................................................85 APPENDIX A: MATERIAL PROPERTIES ....................................................................87 A.1 Concrete ..........................................................................................................87 A.2 Reinforcing Steel.............................................................................................89 A.3 Epoxy and FRP Plates.....................................................................................96 APPENDIX B: APPARENT STRAIN CONVERSION ...................................................98 B.1 Conversion Factor ...........................................................................................98 APPENDIX C: NOTATION ...........................................................................................100
vii
LIST OF TABLES
Table 3.1 Concrete Material Properties ...........................................................................20
Table 3.2 Steel Reinforcement Properties........................................................................21
Table 3.3 Properties of Tyfo® UC Composite Laminate Strip System as
Reported by the Manufacturer .........................................................................21
Table 3.4 Mechanical Properties of Tyfo® TC Epoxy as Reported by the
Manufacturer....................................................................................................22
Table 3.5 Strain Gauge Information ................................................................................28
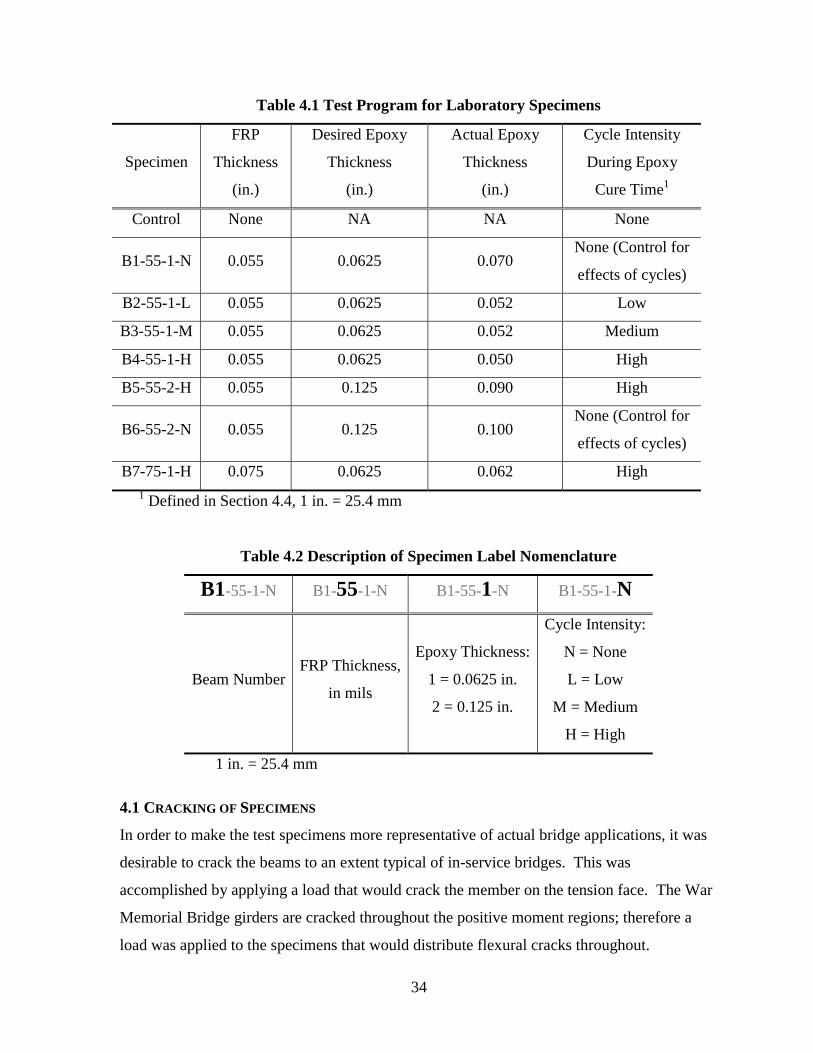
Table 4.1 Test Program for Laboratory Specimens .........................................................34
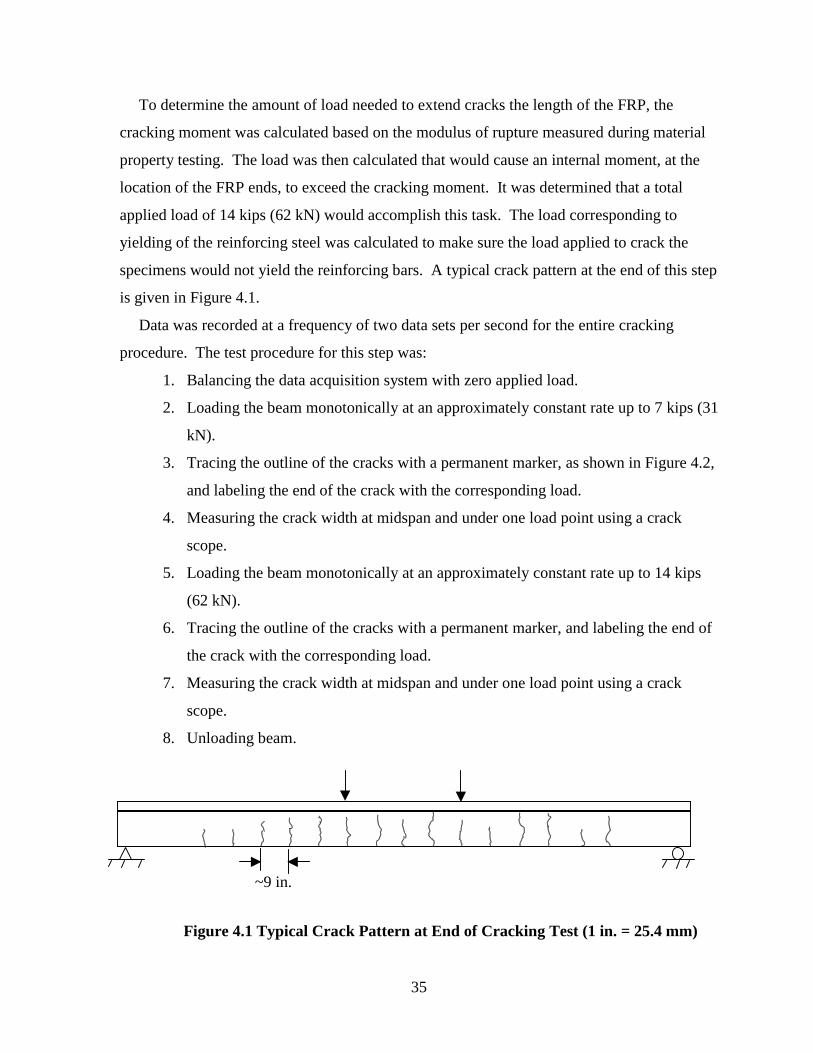
Table 4.2 Description of Specimen Label Nomenclature ................................................34
Table 5.1 Ductility Indices...............................................................................................51
Table 5.2 Flexural Test Results for Group 1....................................................................59
Table 5.3 Comparison of Ultimate Strength and Deflection of Group 1 to Control........60
Table 5.4 Comparison of Ultimate Strength and Deflection of Group 1 Specimens.......60
Table 5.5 Comparison of Yield Strength and Deflection of Group 1 to Control.............61
Table 5.6 Comparison of Yield Strength and Deflection of Group 1 Specimens............62
Table 5.7 Flexural Test Results for Group 2....................................................................63
Table 5.8 Comparison of Ultimate Strength and Deflection of Group 2 to Control........63
Table 5.9 Comparison of Ultimate Strength and Deflection of Group 2 Specimens.......63
Table 5.10 Comparison of Yield Strength and Deflection of Group 2 to Control.............65
Table 5.11 Comparison of Yield Strength and Deflection of Group 2 Specimens............65
Table 5.12 Flexural Test Results for Group 3....................................................................65
Table 5.13 Comparison of Ultimate Strength and Deflection of Group 3 to Control........66
Table 5.14 Comparison of Yield Strength and Deflection of Group 3 to Control.............67
Table 5.15 Increase in Flexural Resistance Due to FRP....................................................72
Table 6.1 Values Used in Analysis ..................................................................................78
Table 6.2 Design Strength of the War Memorial Bridge.................................................79
Table 6.3 Theoretical Limiting FRP Strains ....................................................................79
Table 6.4 Design Moment Capacities ..............................................................................80
Table A.1 Concrete Compression Tests and Modulus of Elasticity Results ....................89
viii
Table A.2 Tensile Strength of Concrete Determined by Splitting Tensile and Modulus of Rupture Tests.........................................................................89
Table A.3 Yield Stress and Modulus of Elasticity Tests for Steel Reinforcement...........96
Table A.4 Properties of Tyfo® UC Composite Laminate Strip System as Reported by the Manufacturer .........................................................................96
Table A.5 Mechanical Properties of Tyfo® TC Epoxy as Reported by the Manufacturer....................................................................................................97
Table B.1 Conversion Factors from Measured to Apparent Strain ..................................99
ix
LIST OF FIGURES
Figure 2.1 De Lorenzis et al. (2001) Test Specimen...........................................................9
Figure 3.1 Cross Section of Laboratory Test Specimens ..................................................16
Figure 3.2 Beam Geometry, Reinforcement, and Applied Loads .....................................19
Figure 3.3 Formwork for Laboratory Specimens..............................................................23
Figure 3.4 Bending of Stirrups ..........................................................................................24
Figure 3.5 Construction of Reinforcing Cage ...................................................................24
Figure 3.6 Steel Reinforcement Strain Gauges .................................................................25
Figure 3.7 Casting of Laboratory Specimens....................................................................26
Figure 3.8 Beams after Casting .........................................................................................26
Figure 3.9 Testing Set-up ..................................................................................................27
Figure 3.10 Strain Gauge Layout for Steel Reinforcement.................................................30
Figure 3.11 Typical FRP Strain Gauge ...............................................................................31
Figure 3.12 Strain Gauge Layout for FRP ..........................................................................32
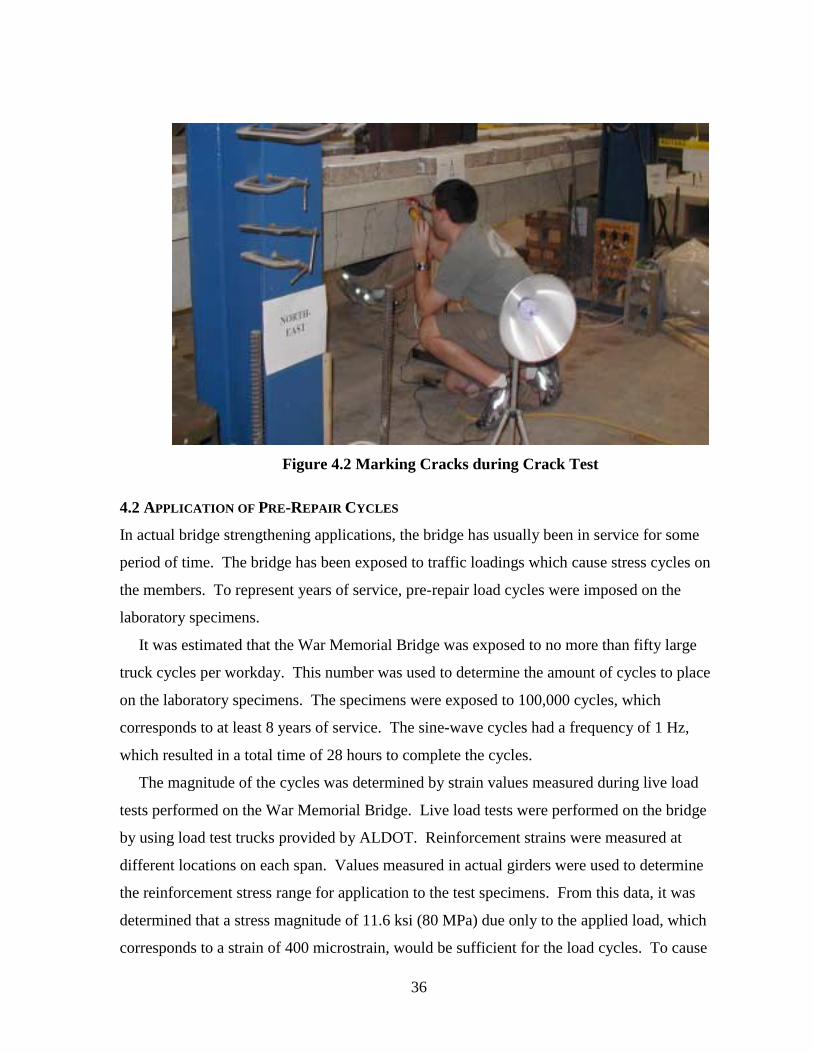
Figure 4.1 Typical Crack Pattern at End of Cracking Test ...............................................35
Figure 4.2 Marking Cracks during Crack Test..................................................................36
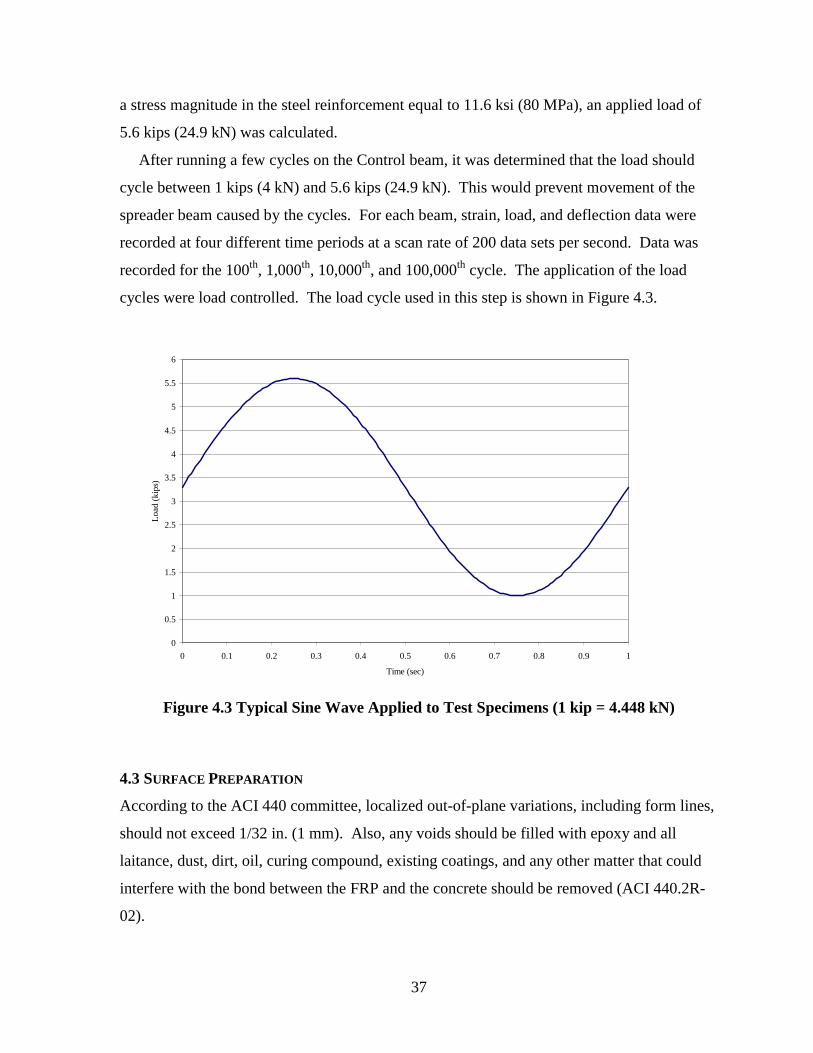
Figure 4.3 Typical Sine Wave Applied to Test Specimens...............................................37
Figure 4.4 “Low” Cycle Applied during Repair ...............................................................39
Figure 4.5 “Medium” Cycle Applied during Repair .........................................................40
Figure 4.6 “High” Cycle Applied during Repair...............................................................40
Figure 4.7 Comparison of the Three Levels of Repair Cycles..........................................42
Figure 4.8 Mixing of Tyfo® S Saturant Epoxy..................................................................43
Figure 4.9 Application of Tyfo® S Saturant Epoxy ..........................................................43
Figure 4.10 Application of Tyfo® TC Epoxy to FRP..........................................................45
Figure 4.11 Application of Tyfo® TC Epoxy to Beam........................................................45
Figure 4.12 Application of Glass Beads to Tyfo® TC Epoxy on FRP ................................46
Figure 4.13 Application of FRP to Beam............................................................................47
Figure 4.14 Alignment of the FRP ......................................................................................47
Figure 4.15 Seating of FRP Using a J-Roller......................................................................48
Figure 5.1 Control Beam at Displacement Capacity of Loading Equipment....................51
x
Figure 5.2 Local Debonding of FRP .................................................................................51
Figure 5.3 Total Debonding of FRP..................................................................................52
Figure 5.4 Concrete Substrate after FRP Debonding ........................................................52
Figure 5.5 Load vs. Deflection for Beam B4 ....................................................................55
Figure 5.6 Load vs. FRP Strain under Load Point ............................................................56
Figure 5.7 Load vs. FRP Strain at FRP Curtailment .........................................................56
Figure 5.8 Load vs. Steel Strain for Beam B4...................................................................57
Figure 5.9 Load vs. Deflection for Test Group 1 ..............................................................58
Figure 5.10 Load vs. Deflection for Test Group 1 at Cessation of Test .............................59
Figure 5.11 Comparison of Debonding Strain to Level of Epoxy Cycles for Group 1.......61
Figure 5.12 Load vs. Deflection for Test Group 2 ..............................................................62
Figure 5.13 Comparison of Debonding Strain to Level of Epoxy Cycles for Group 2.......64
Figure 5.14 Load vs. Deflection for Test Group 3 ..............................................................66
Figure 5.15 Stiffening of Epoxy..........................................................................................68
Figure 5.16 Typical Load Cycle for Beam B7-75-1-H .......................................................68
Figure 5.17 Limiting Strain for Delamination Prevention ..................................................70
Figure 5.18 Yield Moment of the Specimens......................................................................71
Figure 5.19 Ultimate Capacity of the Specimens................................................................74
Figure 6.1 Design Moment Capacity and Moment Demand for an Exterior Girder.........76
Figure 6.2 Strain and Stress Profiles for Analysis.............................................................77
Figure 6.3 Comparison of Design Moment Capacities to Factored Moment ...................81
Figure A.1 Development of Concrete Compressive Strength with Age ............................88
Figure A.2 Stress-Strain Curves for #5 Bars......................................................................91
Figure A.3 Stress-Strain Curve for #3 Bar.........................................................................92
Figure A.4 Stress-Strain Curves in Elastic Region Using Extensometer...........................93
Figure A.5 Stress-Strain Curves in Elastic Region Using Strain Gauge FLA-6................94
Figure A.6 Stress-Strain Curves in Elastic Region Using Strain Gauge FLA-3................95
1
CHAPTER 1: INTRODUCTION
The need for strengthening (or stiffening of) reinforced concrete (RC) structures is becoming
more apparent, particularly when there is an increase in load requirements, a change in use, a
degradation problem, or some design/construction defects (Arduini and Nanni 1997). The
concept of bonding material to the RC member is a proven method to combat some of these
symptoms (Mukhopadhyaya and Swamy 2001). This material was typically steel plates, but
more recently there has been a shift to the use of fiber reinforced polymer (FRP) composites.
FRP has become a more efficient alternative to steel because steel has several disadvantages.
Some disadvantages are corrosion, difficulty in handling the plates, deterioration of bond at
the steel-concrete interface, and the need for massive scaffolding or heavy lifting equipment
during installation (Stallings et al. 2000). For this reason, much research has been performed
on the use of FRP as a strengthening alternative. This research has produced many positive
results. However, there are several areas that still need further research.
Many studies in this area have been done on the effects of FRP strengthening on highway
bridges. This brings forth an area of research that needs to be addressed. Unless the bridge
is completely shut down, loading cycles due to traffic are imposed on the member while the
epoxy used to attach the FRP is curing. There is concern that deformation during epoxy
curing may inhibit strength development of the adhesive, which may affect the bond strength.
This report presents a study performed to determine the effects of loading cycles during
epoxy cure time on the ultimate strength of externally reinforced RC bridges, and to verify
the strengthening of the War Memorial Bridge performed by researchers from Auburn
University.
1.1 BACKGROUND
Due to a structural deficiency, the War Memorial Bridge in Macon County, Alabama was
chosen for structural rehabilitation. The Alabama Department of Transportation (ALDOT)
and Auburn University researchers put forth a joint effort to accomplish this task.
Over the years of its service life, truck loads on the bridge have continually increased,
creating greater stresses and deflections than those for which the bridge was designed. This
2
brought forth a need for load postings for certain types of vehicles. To facilitate the removal
of the load restrictions, Auburn University researchers proposed the use of externally bonded
FRP material to be applied to the bridge.
Members of the ALDOT bridge maintenance group and researchers from Auburn
University began the design in the spring of 2001 (Swenson and Barnes 2002), and
completed the installation during November of the same year. At the time of installation, the
FRP manufacturer recommended that the bridge be closed for several hours to allow the
epoxy to set, but ALDOT personnel decided that closing the bridge for any length of time
would be unfeasible. Instead, efforts were made to limit the effects of traffic loads during
epoxy curing. Because the ultimate strength of the bridge is most likely controlled by the
bond of the FRP to the concrete, it is critical that the bond capacity of the FRP under actual
installation conditions be examined.
At this time, very little is known about the effects that traffic loads during epoxy curing
time have on the bond capacity of the concrete/FRP system. For this reason, an experimental
study was undertaken to determine these effects.
1.2 PROJECT OBJECTIVES
The research project objectives were: (1) to use laboratory test specimens to estimate the
ultimate strength of the repaired War Memorial Bridge girders; and (2) to study the effects of
load cycles during epoxy curing time on the ultimate strength of concrete beams externally
reinforced with FRP plates.
1.3 SCOPE
The focus of this report is to evaluate the effects of load cycles during epoxy curing time on
the ultimate strength of externally reinforced RC beams.
The literature review presented in Chapter Two highlights recent studies in the use of FRP
in structural rehabilitation. In addition, the literature review includes the limited research
performed on loading cycles as well as bond characteristics of FRP to concrete.
Chapter Three discusses several key topics: the design and fabrication of eight reinforced
T-beams used for laboratory testing, material testing and properties, the method used for
bonding the plates to the concrete surface, and the instrumentation implemented during beam
tests.
3
The testing program used for all laboratory specimens is discussed in Chapter Four. The
program included: cracking the member, applying pre-repair load cycles, installing FRP,
applying post-repair cycles, and testing to failure.
A discussion of results for one unstrengthened beam and seven beams strengthened with
FRP is presented in Chapter Five. The original test program was devised to test the effects of
loading cycles on the epoxy during cure, but after testing several beams, it was decided that
other variables should be introduced. These included: epoxy thickness, cycle frequency and
amplitude, and FRP thickness.
Chapter Six discusses ramifications that the present study has on the War Memorial
Bridge. Chapter Seven provides a summary, conclusions drawn from the results of the
various tests, and concludes with recommendations.
4
CHAPTER 2: LITERATURE REVIEW
A review of previous investigations on the strengthening of reinforced concrete beams using
FRP composites is presented in this chapter. The effects observed during previous testing on
load cycles during epoxy cure time and the conclusions drawn from these programs are
presented. The main failure modes observed during previous testing and the characteristics of
bond are discussed.
2.1 EFFECT OF LOAD CYCLES DURING ADHESIVE CURE
The use of FRP as a strengthening alternative for RC bridge members is a proven method
(Stallings et al. 2000, Fanning and Kelly 2001). However, the effects of traffic cycles
imposed to the bridge while the epoxy is curing have been given little attention. A search
through available literature uncovered two studies pertaining to this subject.
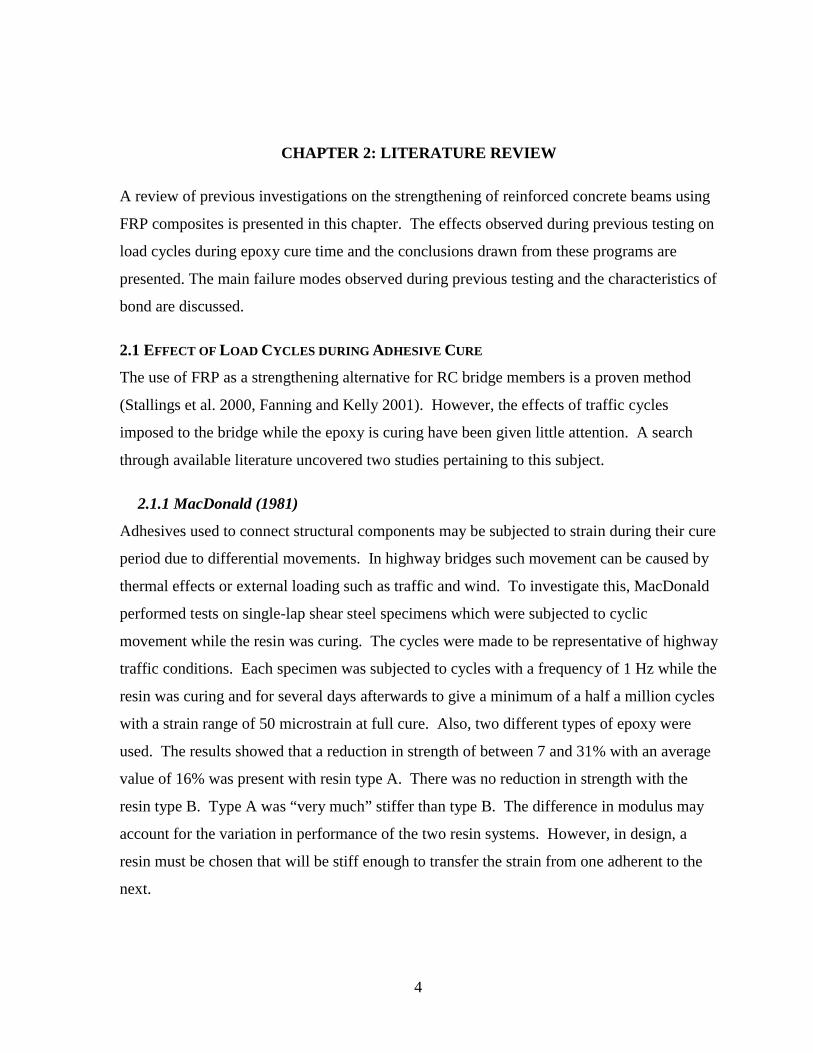
2.1.1 MacDonald (1981)
Adhesives used to connect structural components may be subjected to strain during their cure
period due to differential movements. In highway bridges such movement can be caused by
thermal effects or external loading such as traffic and wind. To investigate this, MacDonald
performed tests on single-lap shear steel specimens which were subjected to cyclic
movement while the resin was curing. The cycles were made to be representative of highway
traffic conditions. Each specimen was subjected to cycles with a frequency of 1 Hz while the
resin was curing and for several days afterwards to give a minimum of a half a million cycles
with a strain range of 50 microstrain at full cure. Also, two different types of epoxy were
used. The results showed that a reduction in strength of between 7 and 31% with an average
value of 16% was present with resin type A. There was no reduction in strength with the
resin type B. Type A was “very much” stiffer than type B. The difference in modulus may
account for the variation in performance of the two resin systems. However, in design, a
resin must be chosen that will be stiff enough to transfer the strain from one adherent to the
next.
5
2.1.2 Barnes and Mays (2001)
Barnes and Mays also tested steel and CFRP lap joint specimens and the results were similar
to those of MacDonald. It was found that vibration during cure caused a progressive
reduction in strength with increasing strain levels. An 8% strength reduction for steel joints
was found at the 50 microstrain level. This value is midway between the 0% and 16%
reduction reported by MacDonald (1981).
Another testing program in the study included the adhering of a thin plate to an I-section
steel beam. A steel beam was chosen to assure the failure plane occurred in the adhesive
layer. The assembly was subjected to vibration in four-point bending. Vibrations at 2 Hz
and varying levels of strain were introduced to the different specimens for 48 hours. At the
end of this time period, the specimens were tested to failure. The results from this study
showed that although the strength of the plated beams decreased with increasing amplitude of
cyclic strain, there was an unexpected strength increase as compared with the control
specimens. The researchers concluded that a possible explanation for this strength increase
was that heat generated during the vibration could have improved the curing and hence the
strength of the adhesive.
A third investigation by Barnes and Mays involved the use of larger-scale concrete beams.
The dimensions of the test beams were at a scale of 1:4 of full-sized beams. Both steel and
carbon-fiber reinforced polymer (CFRP) plates were tested. Load cycles at a frequency of 1
Hz and a strain range of 150 microstrain were imposed onto the beams. The load cycles were
imposed for 48 hours, and the beams tested to failure at 7 days after strengthening. It was
discovered that each vibrated beam failed at the same load as its respective control beam.
The conclusion drawn was that the ultimate load capacity of the plated beams was not
affected by vibration during curing of the adhesives. The modes of failure between the two
types of strengthening were dramatically different. The beams strengthened with steel plates
failed by yielding of the plate followed by crushing of the concrete in the compression zone.
The CFRP-plated beams failed by debonding of the plate in the cover concrete approximately
beneath one of the load points. The CFRP plate then ripped the concrete cover away from
the beam on either side of the load point and rapidly “unzipped” itself towards the beam at
one end. The main difference in the two failure modes was that the steel-plated beams
behaved in a ductile manner, while the CFRP plated beams failed in a sudden and dramatic
6
fashion. From this, the conclusion was drawn that the failures in the concrete masked any
effect of vibration during cure of the adhesive.
2.2 FAILURE MODES
Beams strengthened with FRP introduce new failure modes that are not present in
conventional RC members. Various failure modes are reported in the literature (ACI
440.2R-02, El-Mihilmy and Tedesco 2001, GangaRao and Vijay 1998). RC beams
strengthened with externally bonded FRP laminates may exhibit one of the following modes
of failure:
1. Strengthened RC flexural failures
a. FRP rupture—The FRP plate stress exceeds its tensile strength in the
maximum moment zone (before or after yielding of the reinforcing steel).
b. Crushing of concrete in compression before yielding of the reinforcing
steel.
c. Yielding of the reinforcing steel followed by concrete crushing.
2. Non-flexural failures common to unstrengthened RC members
a. Shear
b. Bond failure of reinforcing steel
3. Shear/tension delamination of the concrete cover (cover delamination)—a crack
initiates in the vicinity of one of the FRP plate ends at the level of the tension steel
reinforcement and propagates horizontally either towards midspan, or upward
toward the location of the concentrated load; and
4. Debonding of the FRP from the concrete substrate (FRP debonding)
a. The interface shear stress between the concrete and adhesive exceeds the
shear strength of the concrete-adhesive interface. At debonding, the
adhesive remains on the FRP with little damage to the concrete.
b. The interface shear stress between the FRP and the adhesive exceeds the
shear strength of the FRP-adhesive interface. At debonding, the adhesive
remains on the concrete and the FRP detaches.
c. The interface stresses between the concrete and adhesive exceeds the
capacity of the concrete. At debonding, a thin layer of concrete is removed
with the adhesive and FRP.
7
The failure modes numbered 3 and 4c are the most commonly reported, while failures 4a
and 4b rarely occur. It has been demonstrated that the rupture strength of the FRP cannot
usually be attained because of either debonding of the FRP plate from the concrete or
development of horizontal cracking and subsequent separation of the concrete cover at the
level of the reinforcing steel (El-Mihilmy and Tedesco 2001). The main cause for concern
with failures labeled 3 and 4 is the change from ductile to brittle behavior (Arduini and Nanni
1997, Barnes and Mays 2001, Breña et al. 2003, Mukhopadhyaya and Swamy 2001).
2.2.1 Ductility
It is generally assumed that gains in strength and stiffness are usually associated with a
decrease in ductility. The ductility of a beam can be defined as its ability to sustain inelastic
deformation without loss in load-carrying capacity prior to failure. It is usually calculated for
conventional reinforced concrete structures as the ratio of curvature, deflection, or rotation at
ultimate to that at yielding of the steel. In the case of beams strengthened with FRP, there is
usually no clear yield point. However, deflection and energy based on tension steel yielding
can be used as a criterion of ductility to evaluate comparative structural performance of plate-
bonded RC beams (Almusallam and Al-Salloum 2001).
In tests performed by Almusallam and Al-Salloum (2001), it was found that strengthened
beams had ductility indices smaller than the corresponding control beam. Beams
strengthened with glass FRP (GFRP) gave ductility indices between 2.25 and 3.94. Beams
strengthened with carbon FRP (CFRP) had ductility indices between 2.22 and 2.78. The
control beam (unstrengthened) showed a ductility index of 4.32. However, the researchers
concluded that the reduction in ductility was insignificant.
Similar results were reported in studies performed by Arduini and Nanni (1997), Barnes
and Mays (2001), Breña et al. (2003), Mukhopadhyaya and Swamy (2001), and Nguyen et al.
(2001). This change from a ductile to brittle failure is undesirable and needs to be taken into
consideration in design.
2.3 FRP ANCHORAGE
Anchorage of the external FRP reinforcement to the concrete substrate is of critical
importance for the effectiveness of the strengthening technique, because it is the means to
develop composite action by the stress transfer between the concrete and FRP. In order to
8
prevent the brittle failure discussed previously, many studies on the anchorage of FRP to
concrete have been performed. Several theories exist on what should be used to reduce the
likelihood of this brittle failure mode.
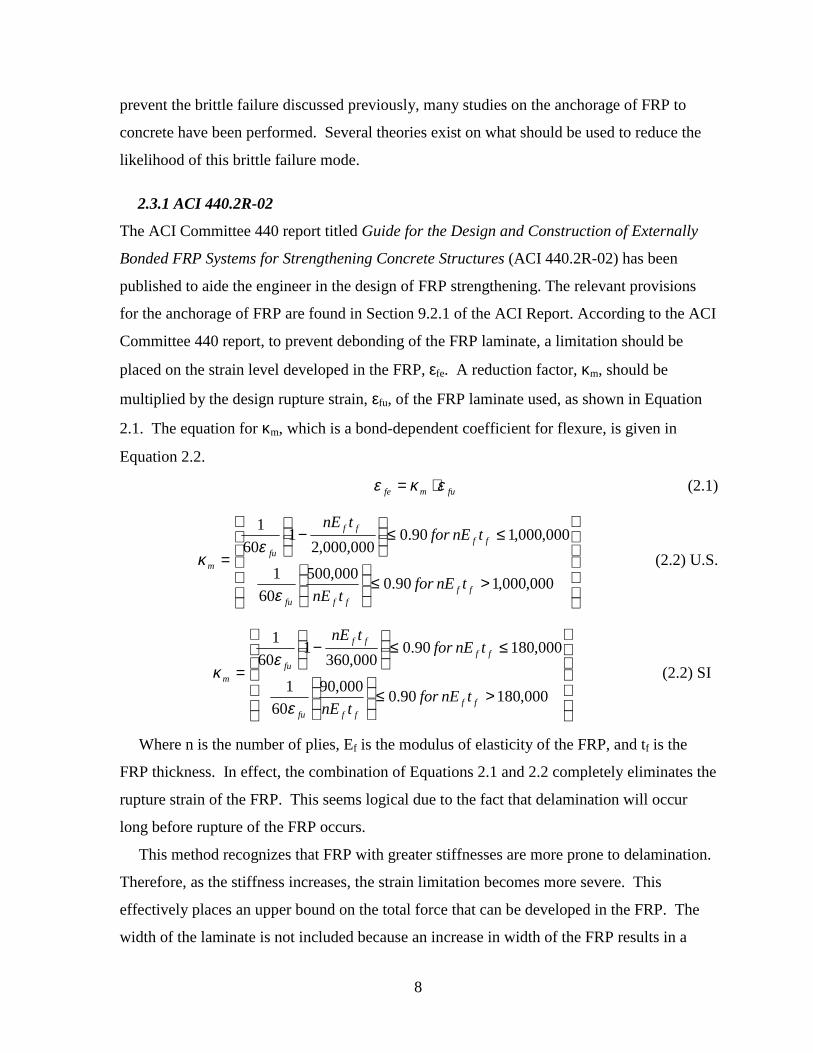
2.3.1 ACI 440.2R-02
The ACI Committee 440 report titled Guide for the Design and Construction of Externally
Bonded FRP Systems for Strengthening Concrete Structures (ACI 440.2R-02) has been
published to aide the engineer in the design of FRP strengthening. The relevant provisions
for the anchorage of FRP are found in Section 9.2.1 of the ACI Report. According to the ACI
Committee 440 report, to prevent debonding of the FRP laminate, a limitation should be
placed on the strain level developed in the FRP, εfe. A reduction factor, κm, should be
multiplied by the design rupture strain, εfu, of the FRP laminate used, as shown in Equation
2.1. The equation for κm, which is a bond-dependent coefficient for flexure, is given in
Equation 2.2.
fumfe εκε ⋅= (2.1)
>≤
≤≤
−
=000,000,190.0000,500
601
000,000,190.0000,000,2
160
1
fffffu
ffff
fum
tnEfortnE
tnEfortnE
ε
εκ (2.2) U.S.
>≤
≤≤
−
=000,18090.0000,90
601
000,18090.0000,360
160
1
fffffu
ffff
fum
tnEfortnE
tnEfortnE
ε
εκ (2.2) SI
Where n is the number of plies, Ef is the modulus of elasticity of the FRP, and tf is the
FRP thickness. In effect, the combination of Equations 2.1 and 2.2 completely eliminates the
rupture strain of the FRP. This seems logical due to the fact that delamination will occur
long before rupture of the FRP occurs.
This method recognizes that FRP with greater stiffnesses are more prone to delamination.
Therefore, as the stiffness increases, the strain limitation becomes more severe. This
effectively places an upper bound on the total force that can be developed in the FRP. The
width of the laminate is not included because an increase in width of the FRP results in a
9
proportional increase in bonded area. However, this method does not take into account
several variables. The strength and stiffness of the concrete and the mechanical properties of
the epoxy are not used.
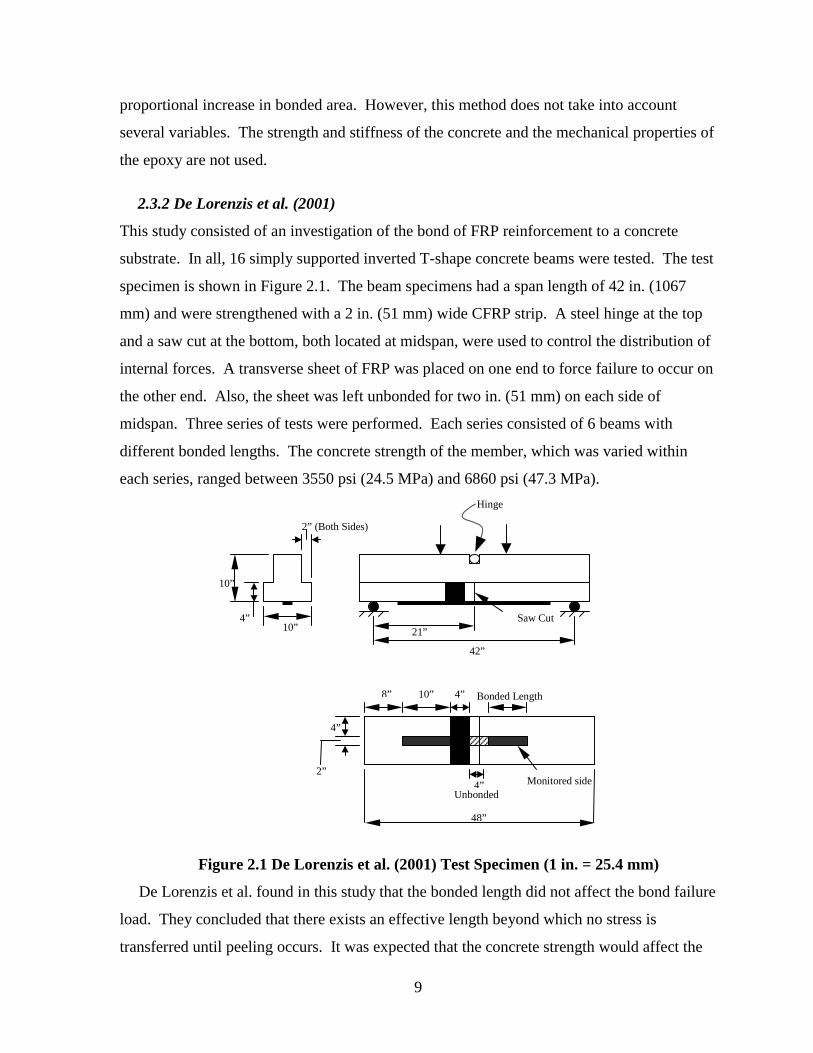
2.3.2 De Lorenzis et al. (2001)
This study consisted of an investigation of the bond of FRP reinforcement to a concrete
substrate. In all, 16 simply supported inverted T-shape concrete beams were tested. The test
specimen is shown in Figure 2.1. The beam specimens had a span length of 42 in. (1067
mm) and were strengthened with a 2 in. (51 mm) wide CFRP strip. A steel hinge at the top
and a saw cut at the bottom, both located at midspan, were used to control the distribution of
internal forces. A transverse sheet of FRP was placed on one end to force failure to occur on
the other end. Also, the sheet was left unbonded for two in. (51 mm) on each side of
midspan. Three series of tests were performed. Each series consisted of 6 beams with
different bonded lengths. The concrete strength of the member, which was varied within
each series, ranged between 3550 psi (24.5 MPa) and 6860 psi (47.3 MPa).
Figure 2.1 De Lorenzis et al. (2001) Test Specimen (1 in. = 25.4 mm)
De Lorenzis et al. found in this study that the bonded length did not affect the bond failure
load. They concluded that there exists an effective length beyond which no stress is
transferred until peeling occurs. It was expected that the concrete strength would affect the
10”
2” (Both Sides)
4” 10” 21”
42”
Hinge
Saw Cut
4”
2”
8” 10” 4” Bonded Length
4”Unbonded
48”
Monitored side
10
bond, but there was no evidence from this investigation. This is due to the fact that the
failure of the specimens occurred in the concrete-epoxy interface, with very little or no sign
of damage in the concrete surface, i.e. failure mode 4a (Section 2.2). Two specimens were
tested with a CFRP strip that was 4 in. (102 mm) wide. The failure load was twice that of the
specimens with 2 in. (51 mm) widths. Also, the failure mode and the strain distribution was
the same. Hence, it was concluded that the width of the sheet did not influence the bond
strength.
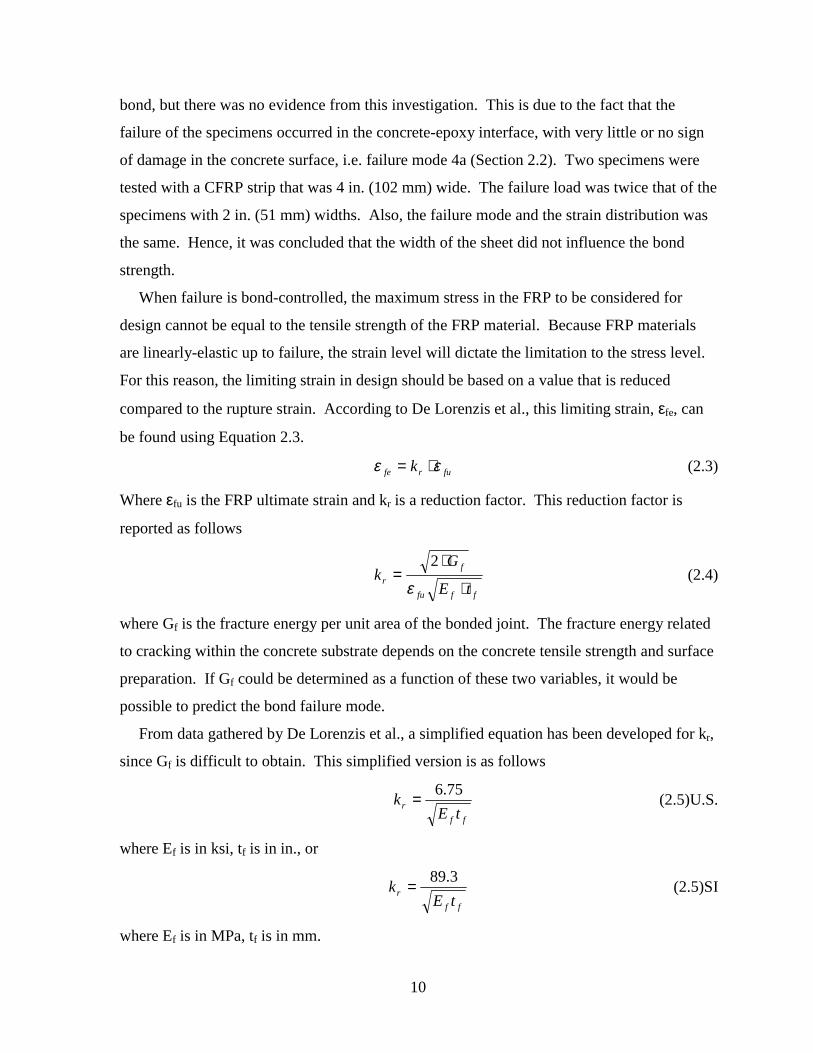
When failure is bond-controlled, the maximum stress in the FRP to be considered for
design cannot be equal to the tensile strength of the FRP material. Because FRP materials
are linearly-elastic up to failure, the strain level will dictate the limitation to the stress level.
For this reason, the limiting strain in design should be based on a value that is reduced
compared to the rupture strain. According to De Lorenzis et al., this limiting strain, εfe, can
be found using Equation 2.3.
furfe k εε ⋅= (2.3)
Where εfu is the FRP ultimate strain and kr is a reduction factor. This reduction factor is
reported as follows
fffu
fr tE
Gk
⋅
⋅=
ε
2 (2.4)
where Gf is the fracture energy per unit area of the bonded joint. The fracture energy related
to cracking within the concrete substrate depends on the concrete tensile strength and surface
preparation. If Gf could be determined as a function of these two variables, it would be
possible to predict the bond failure mode.
From data gathered by De Lorenzis et al., a simplified equation has been developed for kr,
since Gf is difficult to obtain. This simplified version is as follows
ffr tE
k 75.6= (2.5)U.S.
where Ef is in ksi, tf is in in., or
ffr tE
k 3.89= (2.5)SI
where Ef is in MPa, tf is in mm.
11
It appears that the laminate stiffness per unit of bonded width is the parameter that most
influences the bond failure load. The limiting strain used in design is suggested to be the one
found in the combination of Equations 2.3 and 2.5. Similar to the provisions in the ACI
440.2R-02 report, the rupture strain is eliminated with the combination of Equations 2.3 and
2.4. Likewise, the stiffness of the concrete is not taken into account.
2.3.3 Harmon et al. (2003)
The premise of this study is that the properties of the resin layer between surface-mounted
FRP materials and a concrete substrate are critical factors in determining the bond strength.
Similar to De Lorenzis et al. (2001) and the ACI 440.2R-02 report, Harmon et al. concluded
that the design of FRP should be based on a threshold stress or strain in the FRP that is
inversely related to the FRP stiffness. However, the value of the threshold strain depends on
more parameters than just the stiffness of the FRP. A model for bond failure that takes into
account the properties of the bond layer, the concrete strength, the FRP stiffness, and the
extent of flexural cracking, as well as the shear and bending moments at critical sections has
been proposed.
The analytical models presented are based on the assumption that bond failure, or
delamination, is due to excessive bond stress. The distribution of bond stresses between the
FRP and the concrete depends on the relative stiffness of the concrete, the FRP, and the bond
transfer mechanism between the FRP and the substrate. The bond transfer mechanism
depends on the shear stiffness of the bond resin layer and the effective shear stiffness of an
undetermined thickness of a concrete shear layer that transfers the force in the FRP into the
substrate.
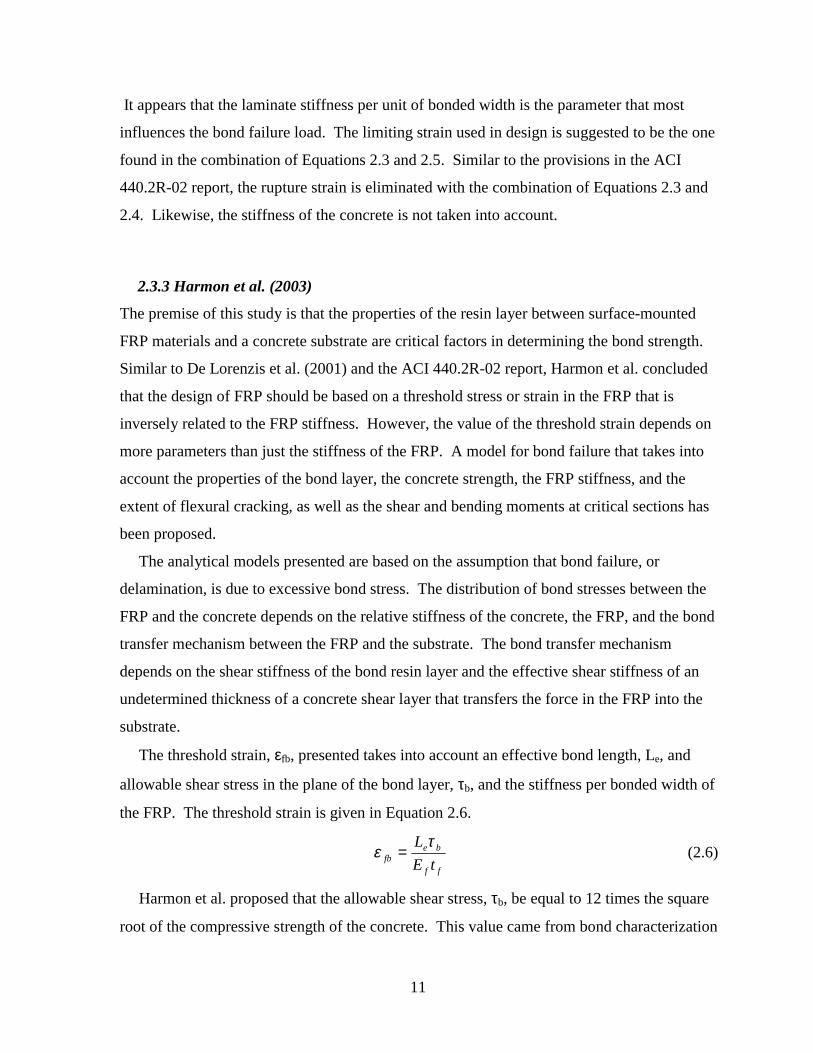
The threshold strain, εfb, presented takes into account an effective bond length, Le, and
allowable shear stress in the plane of the bond layer, τb, and the stiffness per bonded width of
the FRP. The threshold strain is given in Equation 2.6.
ff
befb tE
L τε = (2.6)
Harmon et al. proposed that the allowable shear stress, τb, be equal to 12 times the square
root of the compressive strength of the concrete. This value came from bond characterization
12
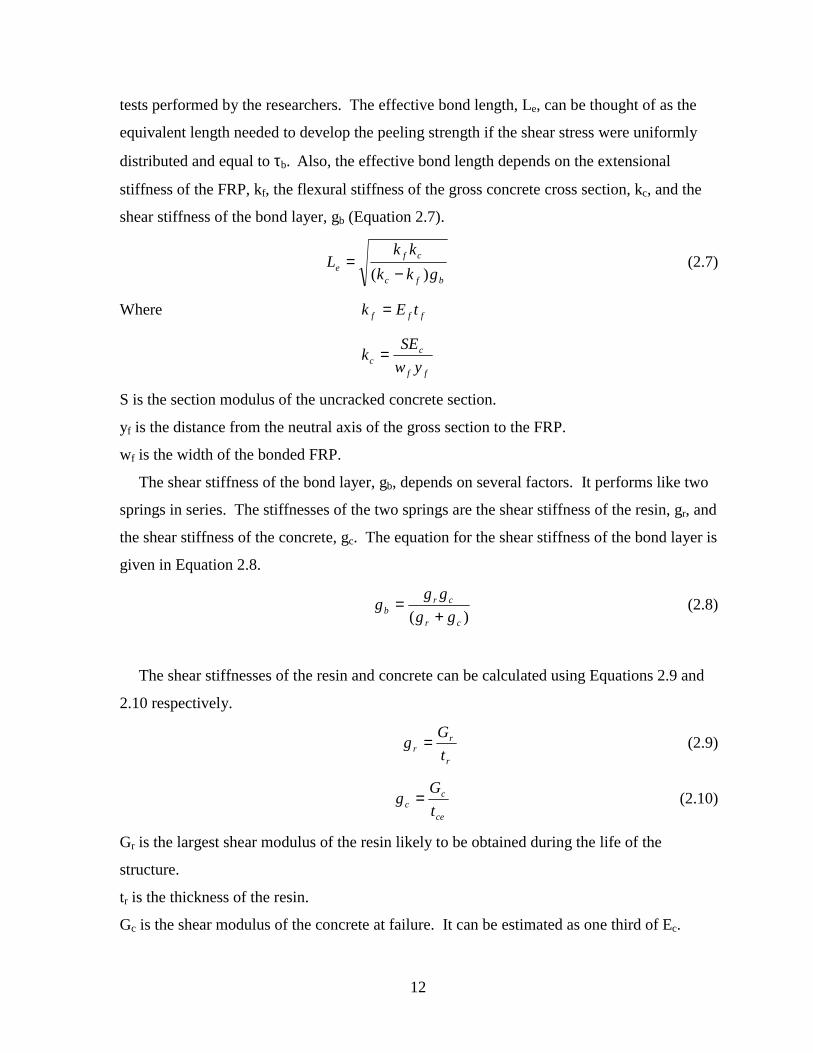
tests performed by the researchers. The effective bond length, Le, can be thought of as the
equivalent length needed to develop the peeling strength if the shear stress were uniformly
distributed and equal to τb. Also, the effective bond length depends on the extensional
stiffness of the FRP, kf, the flexural stiffness of the gross concrete cross section, kc, and the
shear stiffness of the bond layer, gb (Equation 2.7).
bfc
cfe gkk
kkL
)( −= (2.7)
Where fff tEk =
ff
cc yw
SEk =
S is the section modulus of the uncracked concrete section.
yf is the distance from the neutral axis of the gross section to the FRP.
wf is the width of the bonded FRP.
The shear stiffness of the bond layer, gb, depends on several factors. It performs like two
springs in series. The stiffnesses of the two springs are the shear stiffness of the resin, gr, and
the shear stiffness of the concrete, gc. The equation for the shear stiffness of the bond layer is
given in Equation 2.8.
)( cr
crb gg
ggg
+= (2.8)
The shear stiffnesses of the resin and concrete can be calculated using Equations 2.9 and
2.10 respectively.
r
rr t
Gg = (2.9)
ce
cc t
Gg = (2.10)
Gr is the largest shear modulus of the resin likely to be obtained during the life of the
structure.
tr is the thickness of the resin.
Gc is the shear modulus of the concrete at failure. It can be estimated as one third of Ec.
13
tce is the effective thickness of the concrete shear layer. It can be taken as the width of the
FRP plus 2 in. (51 mm).
Experimental beam tests were performed to insure the validity of the proposed model.
Five beams reinforced with conventional reinforcement plus surface-bonded CFRP were
tested. Two different bond shear stiffnesses were tested. From the experimental tests, the
following conclusions were drawn:
1. The thickness and shear modulus of the bond layer are critical in determining bond
performance. Premature failure may occur if the thickness of the bond layer is not
controlled.
2. The bond transfer stress is limited by the concrete strength, and is probably
proportional to the square root of f’c.
3. Stiff bond layers perform poorly in beam tests.
2.4 SUMMARY
The design strength of members strengthened with FRP is usually controlled by the
anchorage of the FRP to the substrate. Many factors can affect this anchorage. It has been
found by researchers that strain cycles introduced while the epoxy was curing had a
detrimental affect to the strength of steel reinforced materials. However, concrete members
reinforced with FRP did not show this trend. Failures within the concrete masked any effects
of vibration during epoxy cure.
The strengthening of RC with FRP introduces several new failure modes. Many of the
new failure modes occur at the concrete/FRP interface. The additional failure modes change
the behavior of the members from ductile to brittle. The brittle behavior is undesirable and
must be taken into account in design. Many methods have been introduced to prevent this
behavior.
Previous research shows that design to prevent this brittle failure can be accomplished by
limiting the amount of stress in the FRP. In these studies, the threshold stress or strain in the
FRP is inversely related to the FRP stiffness. However, there are disagreements in what
other factors should be involved. The ACI 440.2R (2002) report reduces the rupture strain of
the FRP by a factor that only includes the FRP stiffness per bonded width. De Lorenzis et al.
(2001) also reduced the rupture strain of the FRP. However, the factor used for the reduction
included the FRP stiffness per bonded width and the fracture energy of the bonded joint.

14
Harmon et al. (2003) proposed that the limiting strain should take into account the properties
of the bond layer, the concrete strength, the FRP stiffness, and the extent of flexural cracking,
as well as the shear and bending moments at critical sections.
15
CHAPTER 3: SPECIMEN DESIGN AND FABRICATION
3.1 BEAM DESIGN
The specimens used in this study are representative of the design-critical T-beams found in
the War Memorial Bridge. The girders are cast-in-place reinforced concrete members. By
linear dimension, the laboratory specimens were designed to be approximately half-scale
models of the positive moment region of a typical exterior end span of the three-span
continuous bridge. This bridge segment was chosen due to the fact that it needed the most
strengthening in the bridge. Eight RC beams with simply supported span lengths of 15.5 ft
(7.72 m) were tested under a four-point loading.
By opting to use a two inch (51 mm) wide strip of FRP, the cross section of the beam
could be determined using the FRP reinforcement ratio, ρFRP. The FRP reinforcement ratio
for the actual bridge was determined to be 0.000248 (Swenson and Barnes 2002), as found
using Equation 3.1.
hbAFRP
FRP =ρ (3.1)
Where AFRP is the cross-sectional area of the FRP, b is the width of the compression zone of
the member, and h is the height of the member. Using this quantity and by matching the
original geometric proportions, it was determined that a combination of b = 30 in. (762 mm)
and h = 15 in. (381 mm) would be an acceptable section. To determine the width of the web,
analysis into the amount of dead load needed to cause bottom fiber strains, εbi, representative
of the bridge was needed. εbi is the strain level in the concrete substrate at the time of the
FRP installation due to the dead weight of the members, as denoted in the ACI 440 report. It
was concluded that a web width of 12 in. (305 mm), as well as a superimposed uniformly
distributed load of 28 lb/ft (0.41 kN/m) would satisfy this criterion. The cross section
including dimensions is shown in Figure 3.1.
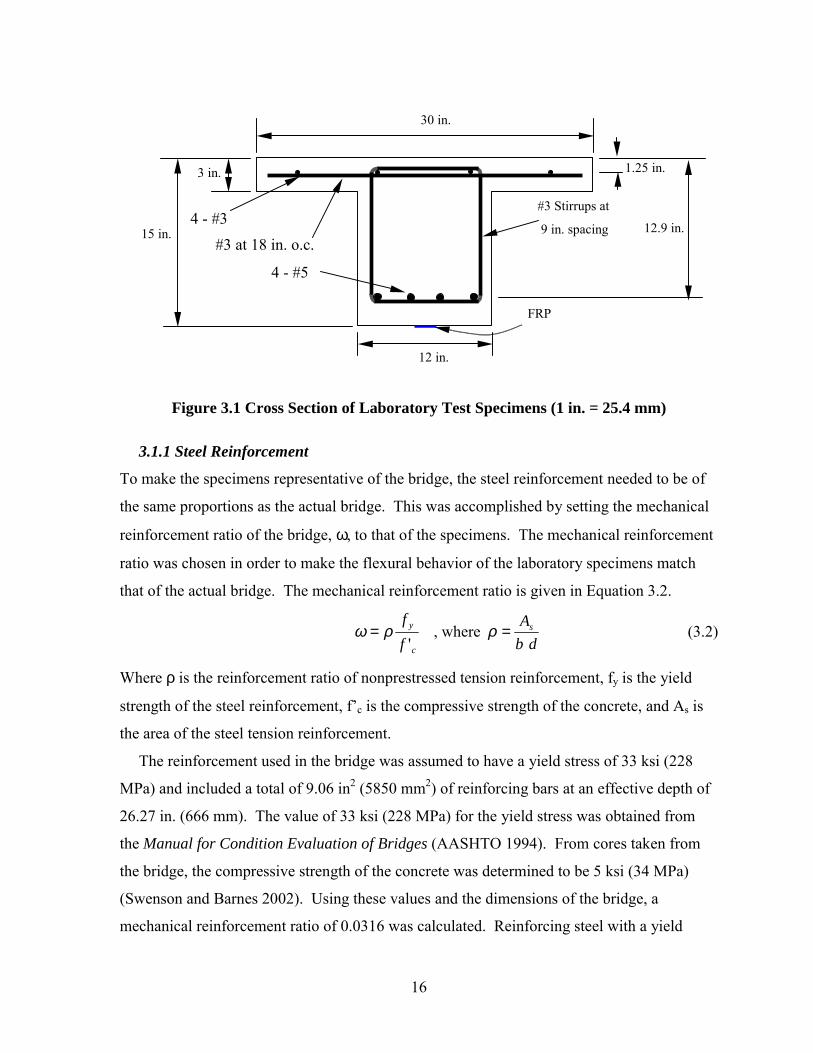
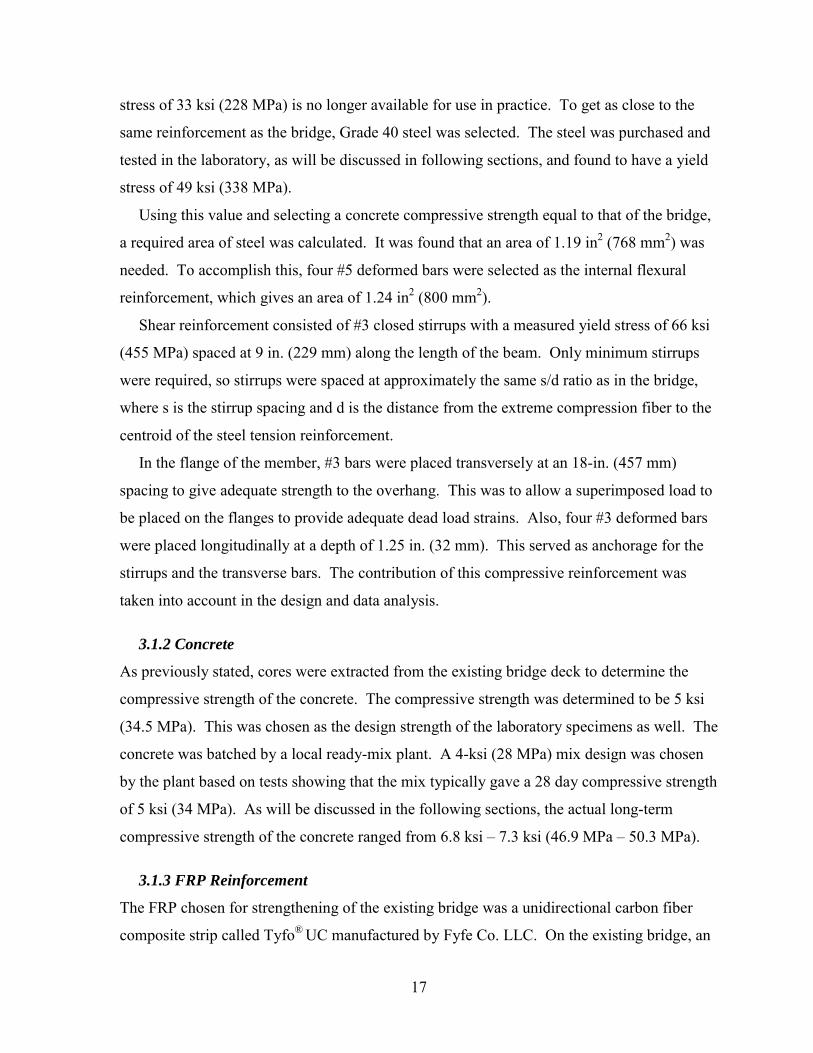
16
Figure 3.1 Cross Section of Laboratory Test Specimens (1 in. = 25.4 mm)
3.1.1 Steel Reinforcement
To make the specimens representative of the bridge, the steel reinforcement needed to be of
the same proportions as the actual bridge. This was accomplished by setting the mechanical
reinforcement ratio of the bridge, ω, to that of the specimens. The mechanical reinforcement
ratio was chosen in order to make the flexural behavior of the laboratory specimens match
that of the actual bridge. The mechanical reinforcement ratio is given in Equation 3.2.
c
y
ff'
ρω = , where db
As=ρ (3.2)
Where ρ is the reinforcement ratio of nonprestressed tension reinforcement, fy is the yield
strength of the steel reinforcement, fc is the compressive strength of the concrete, and As is
the area of the steel tension reinforcement.
The reinforcement used in the bridge was assumed to have a yield stress of 33 ksi (228
MPa) and included a total of 9.06 in2 (5850 mm2) of reinforcing bars at an effective depth of
26.27 in. (666 mm). The value of 33 ksi (228 MPa) for the yield stress was obtained from
the Manual for Condition Evaluation of Bridges (AASHTO 1994). From cores taken from
the bridge, the compressive strength of the concrete was determined to be 5 ksi (34 MPa)
(Swenson and Barnes 2002). Using these values and the dimensions of the bridge, a
mechanical reinforcement ratio of 0.0316 was calculated. Reinforcing steel with a yield
12.9 in.
30 in.
3 in.
15 in.
12 in.
1.25 in.
FRP
#3 Stirrups at
9 in. spacing
4 - #5
4 - #3 #3 at 18 in. o.c.
17
stress of 33 ksi (228 MPa) is no longer available for use in practice. To get as close to the
same reinforcement as the bridge, Grade 40 steel was selected. The steel was purchased and
tested in the laboratory, as will be discussed in following sections, and found to have a yield
stress of 49 ksi (338 MPa).
Using this value and selecting a concrete compressive strength equal to that of the bridge,
a required area of steel was calculated. It was found that an area of 1.19 in2 (768 mm2) was
needed. To accomplish this, four #5 deformed bars were selected as the internal flexural
reinforcement, which gives an area of 1.24 in2 (800 mm2).
Shear reinforcement consisted of #3 closed stirrups with a measured yield stress of 66 ksi
(455 MPa) spaced at 9 in. (229 mm) along the length of the beam. Only minimum stirrups
were required, so stirrups were spaced at approximately the same s/d ratio as in the bridge,
where s is the stirrup spacing and d is the distance from the extreme compression fiber to the
centroid of the steel tension reinforcement.
In the flange of the member, #3 bars were placed transversely at an 18-in. (457 mm)
spacing to give adequate strength to the overhang. This was to allow a superimposed load to
be placed on the flanges to provide adequate dead load strains. Also, four #3 deformed bars
were placed longitudinally at a depth of 1.25 in. (32 mm). This served as anchorage for the
stirrups and the transverse bars. The contribution of this compressive reinforcement was
taken into account in the design and data analysis.
3.1.2 Concrete
As previously stated, cores were extracted from the existing bridge deck to determine the
compressive strength of the concrete. The compressive strength was determined to be 5 ksi
(34.5 MPa). This was chosen as the design strength of the laboratory specimens as well. The
concrete was batched by a local ready-mix plant. A 4-ksi (28 MPa) mix design was chosen
by the plant based on tests showing that the mix typically gave a 28 day compressive strength
of 5 ksi (34 MPa). As will be discussed in the following sections, the actual long-term
compressive strength of the concrete ranged from 6.8 ksi 7.3 ksi (46.9 MPa 50.3 MPa).
3.1.3 FRP Reinforcement
The FRP chosen for strengthening of the existing bridge was a unidirectional carbon fiber
composite strip called Tyfo® UC manufactured by Fyfe Co. LLC. On the existing bridge, an
18
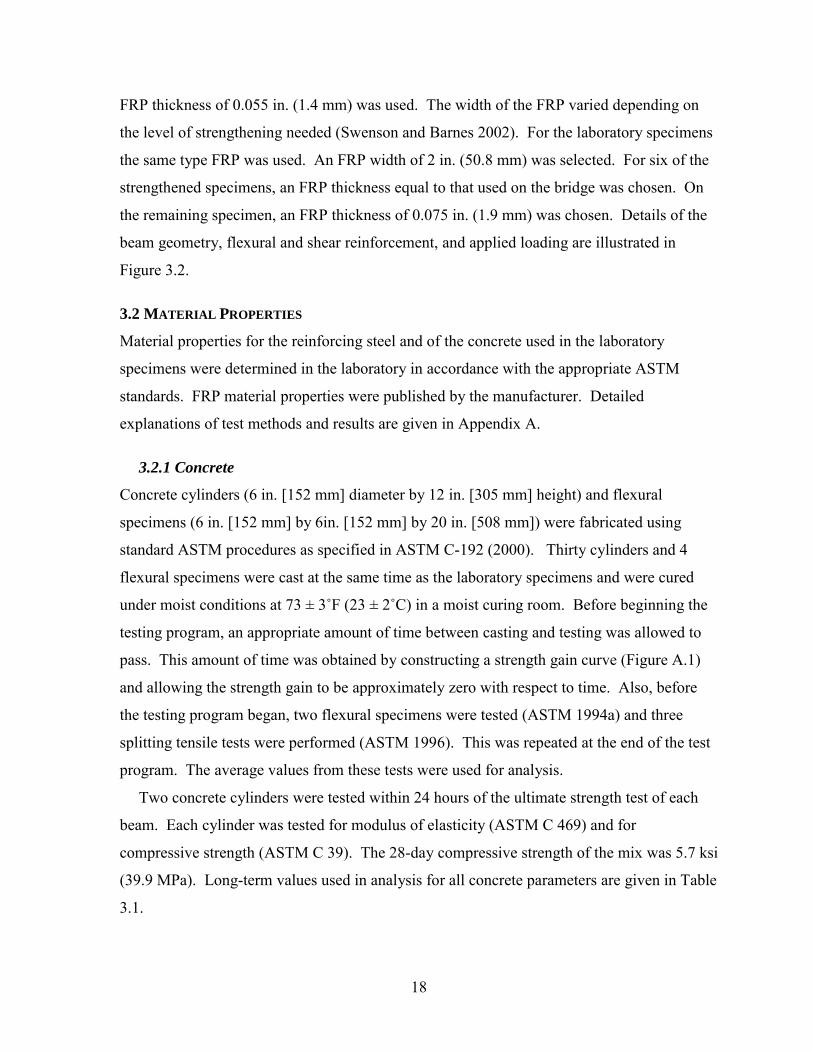
FRP thickness of 0.055 in. (1.4 mm) was used. The width of the FRP varied depending on
the level of strengthening needed (Swenson and Barnes 2002). For the laboratory specimens
the same type FRP was used. An FRP width of 2 in. (50.8 mm) was selected. For six of the
strengthened specimens, an FRP thickness equal to that used on the bridge was chosen. On
the remaining specimen, an FRP thickness of 0.075 in. (1.9 mm) was chosen. Details of the
beam geometry, flexural and shear reinforcement, and applied loading are illustrated in
Figure 3.2.
3.2 MATERIAL PROPERTIES
Material properties for the reinforcing steel and of the concrete used in the laboratory
specimens were determined in the laboratory in accordance with the appropriate ASTM
standards. FRP material properties were published by the manufacturer. Detailed
explanations of test methods and results are given in Appendix A.
3.2.1 Concrete
Concrete cylinders (6 in. [152 mm] diameter by 12 in. [305 mm] height) and flexural
specimens (6 in. [152 mm] by 6in. [152 mm] by 20 in. [508 mm]) were fabricated using
standard ASTM procedures as specified in ASTM C-192 (2000). Thirty cylinders and 4
flexural specimens were cast at the same time as the laboratory specimens and were cured
under moist conditions at 73 ± 3ûF (23 ± 2ûC) in a moist curing room. Before beginning the
testing program, an appropriate amount of time between casting and testing was allowed to
pass. This amount of time was obtained by constructing a strength gain curve (Figure A.1)
and allowing the strength gain to be approximately zero with respect to time. Also, before
the testing program began, two flexural specimens were tested (ASTM 1994a) and three
splitting tensile tests were performed (ASTM 1996). This was repeated at the end of the test
program. The average values from these tests were used for analysis.
Two concrete cylinders were tested within 24 hours of the ultimate strength test of each
beam. Each cylinder was tested for modulus of elasticity (ASTM C 469) and for
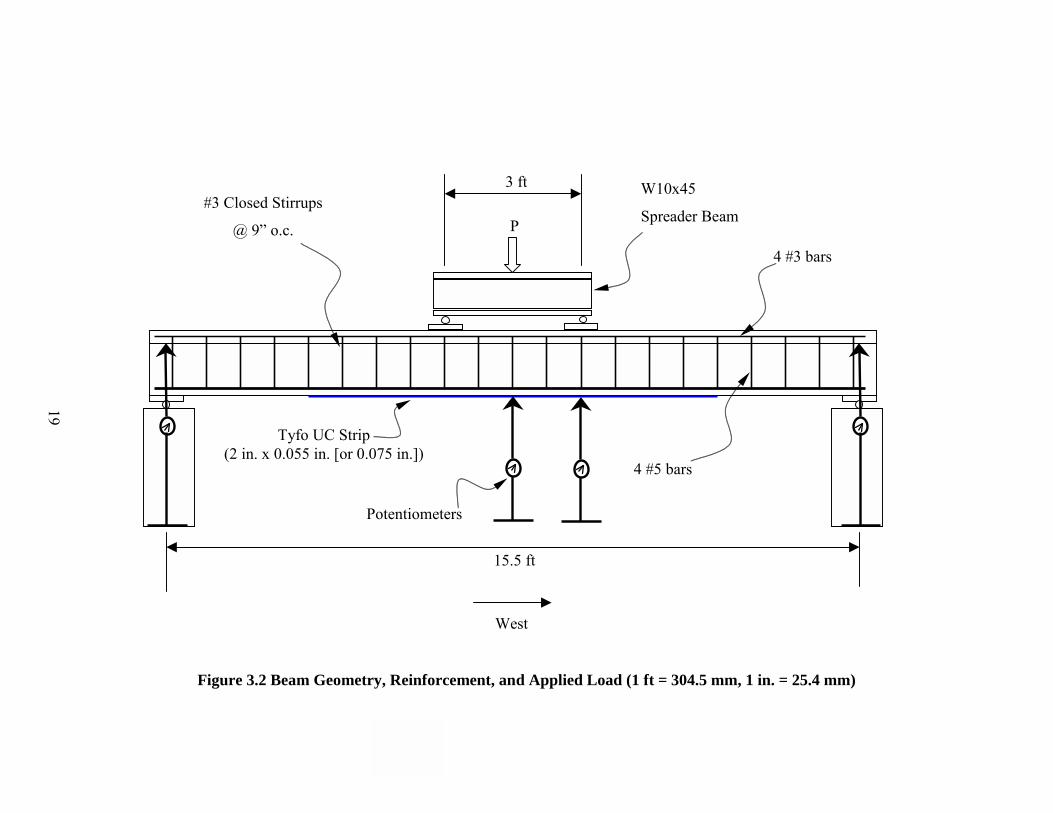
compressive strength (ASTM C 39). The 28-day compressive strength of the mix was 5.7 ksi
(39.9 MPa). Long-term values used in analysis for all concrete parameters are given in Table
3.1.
19
Figure 3.2 Beam Geometry, Reinforcement, and Applied Load (1 ft = 304.5 mm, 1 in. = 25.4 mm)
19
3 ft
15.5 ft
P
West
Tyfo UC Strip (2 in. x 0.055 in. [or 0.075 in.])
4 #5 bars
4 #3 bars
W10x45
Spreader Beam #3 Closed Stirrups
@ 9 o.c.
Potentiometers
20
Table 3.1 Concrete Material Properties
Parameter Value
ft , psi 560
fr, psi 920
Ec, ksi 6470
fc, psi 7100 1 ksi = 6.895 MPa
3.2.2 Steel Reinforcement
Tension tests were performed to determine the stress-strain curves for all sizes of reinforcing
bars used to fabricate the laboratory specimens. To determine the yield strength of the
reinforcing steel, bar elongation was measured using a clip-on extensometer with a 6-in. (152
mm) gage length. For the tension reinforcement, a strain gauge matching the ones used in
the test beams was also attached to the bars to determine the modulus of elasticity. The bars
were tested in a 60-kip (267- kN) Tinius Olsen universal testing machine.
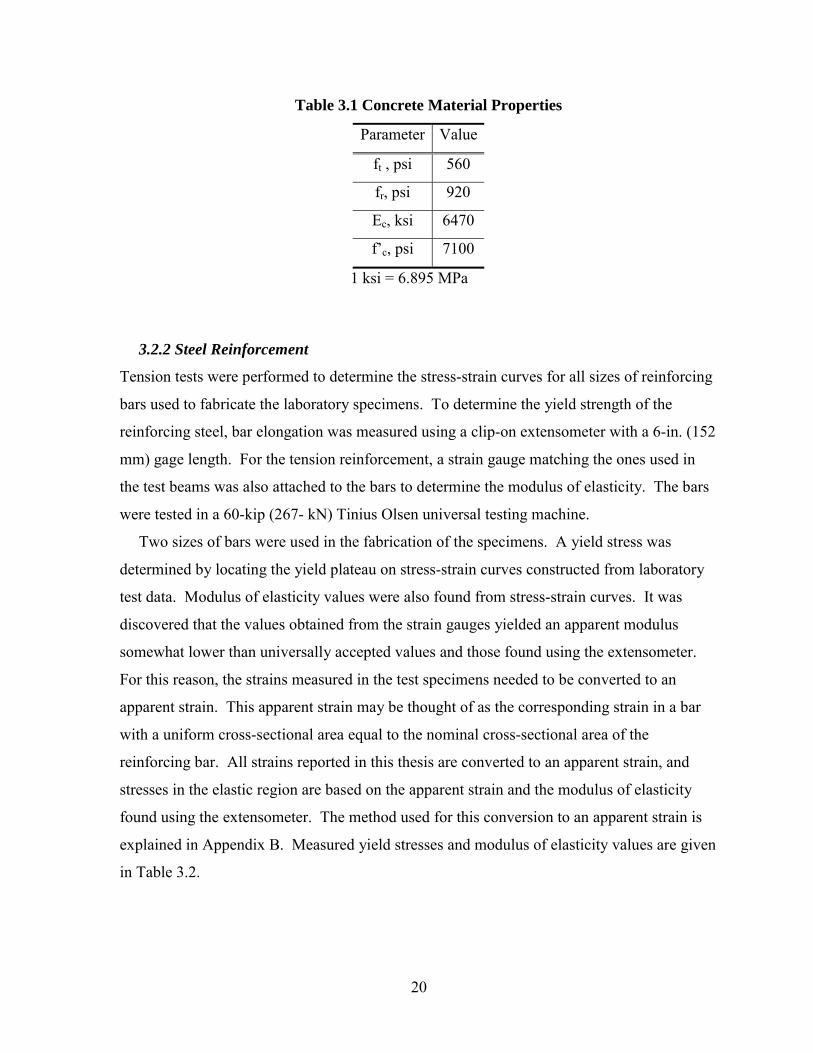
Two sizes of bars were used in the fabrication of the specimens. A yield stress was
determined by locating the yield plateau on stress-strain curves constructed from laboratory
test data. Modulus of elasticity values were also found from stress-strain curves. It was
discovered that the values obtained from the strain gauges yielded an apparent modulus
somewhat lower than universally accepted values and those found using the extensometer.
For this reason, the strains measured in the test specimens needed to be converted to an
apparent strain. This apparent strain may be thought of as the corresponding strain in a bar
with a uniform cross-sectional area equal to the nominal cross-sectional area of the
reinforcing bar. All strains reported in this thesis are converted to an apparent strain, and
stresses in the elastic region are based on the apparent strain and the modulus of elasticity
found using the extensometer. The method used for this conversion to an apparent strain is
explained in Appendix B. Measured yield stresses and modulus of elasticity values are given
in Table 3.2.
21
Table 3.2 Steel Reinforcement Properties
Bar Yield Stress
(ksi)
Modulus of Elasticity
(ksi)
#3 66 29000
#5 49 29700
1 ksi = 6.895 MPa
3.2.3 Epoxy and FRP
Properties for the epoxy and FRP were not determined in the laboratory. The values for the
FRP properties used in calculations are listed in Table 3.3 and are the values reported by the
manufacturer. The mechanical properties of the epoxy used to attach the FRP to the
laboratory specimens are listed in Table 3.4.
Table 3.3 Properties of Tyfo® UC Composite Laminate Strip System as Reported by the
Manufacturer (Fyfe 2000b)
Ultimate Tensile Strength (ksi) 405
Elongation at failure 1.80%
Tensile Modulus (ksi) 22500
Laminate Thickness (in) 0.055 or 0.075
Fiber Volumetric Content > 60%
1 ksi = 6.895 MPa, 1 in. = 25.4 mm
22
Table 3.4 Mechanical Properties of Tyfo ® TC Epoxy as Reported by the Manufacturer
Flexural Modulus (ksi) 245
Flexural Strength (ksi) 5.9
Elongation at failure 5.00%
1 ksi = 6.895 MPa
3.3 SPECIMEN FABRICATION
The eight test beams were fabricated in Auburn University Structural Engineering
Laboratory by students and faculty. The formwork, bending of reinforcing bars, construction
of rebar cages, instrumentation, and casting of concrete was performed on site. This section
will describe each step of the process.
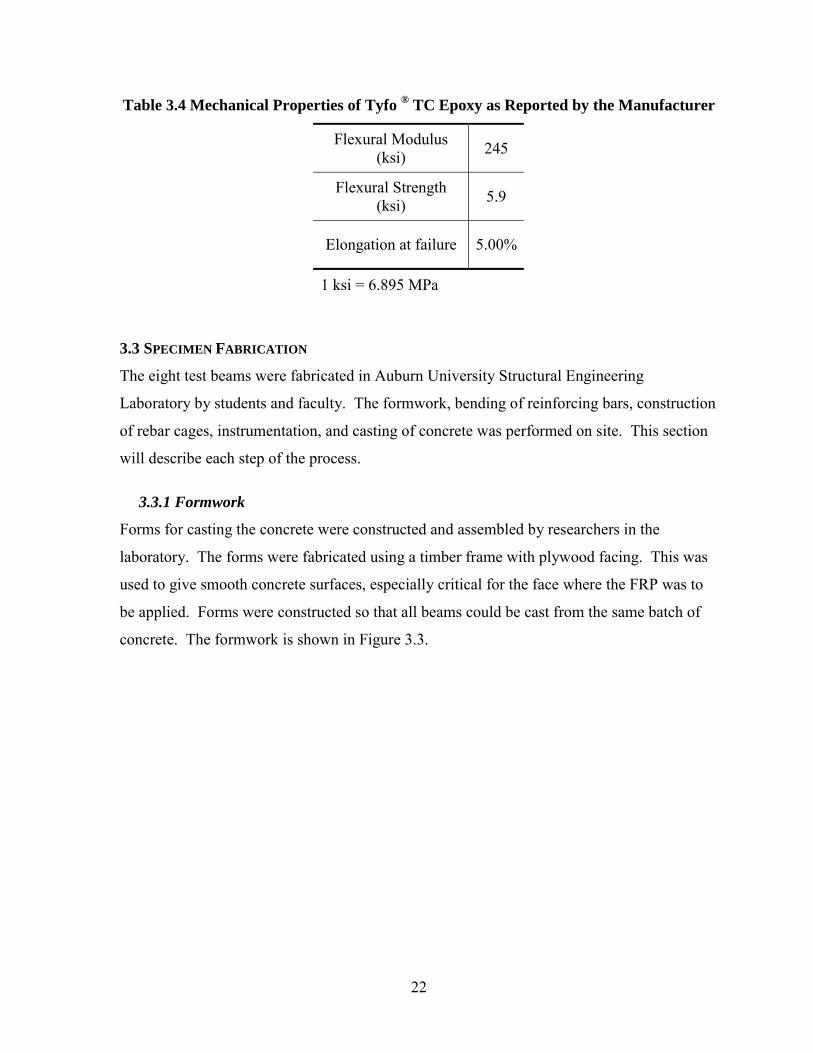
3.3.1 Formwork
Forms for casting the concrete were constructed and assembled by researchers in the
laboratory. The forms were fabricated using a timber frame with plywood facing. This was
used to give smooth concrete surfaces, especially critical for the face where the FRP was to
be applied. Forms were constructed so that all beams could be cast from the same batch of
concrete. The formwork is shown in Figure 3.3.
23
Figure 3.3 Formwork for Laboratory Specimens
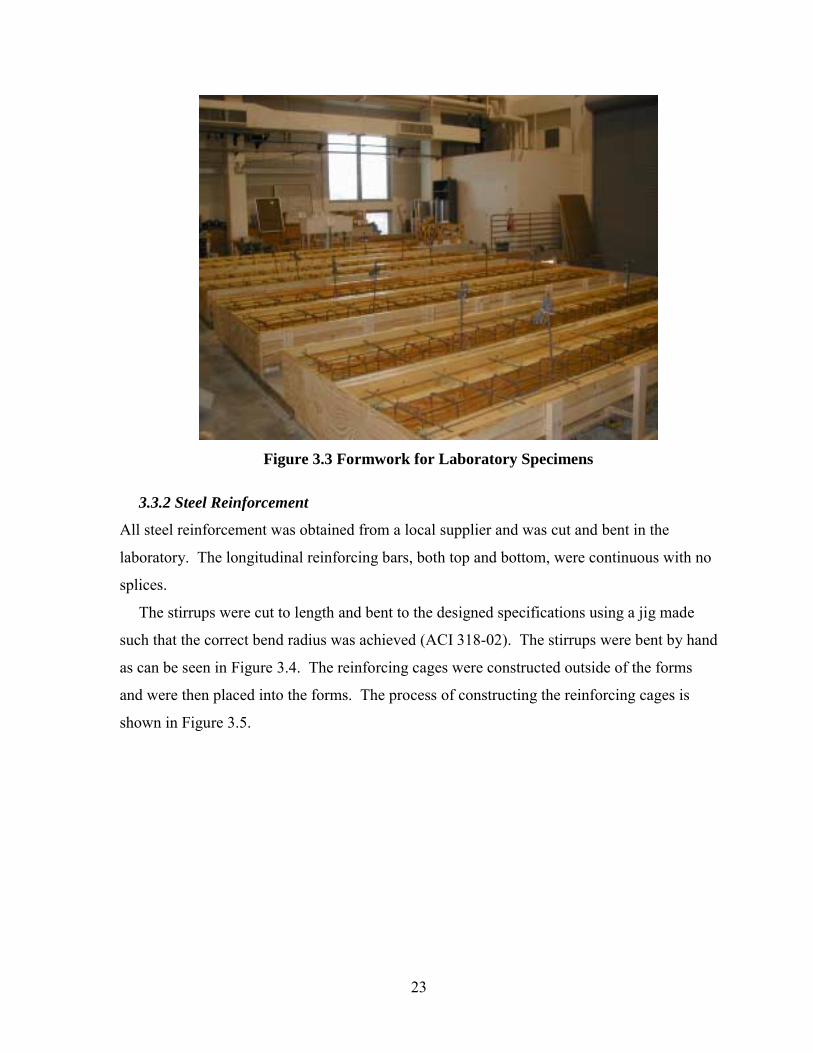
3.3.2 Steel Reinforcement
All steel reinforcement was obtained from a local supplier and was cut and bent in the
laboratory. The longitudinal reinforcing bars, both top and bottom, were continuous with no
splices.
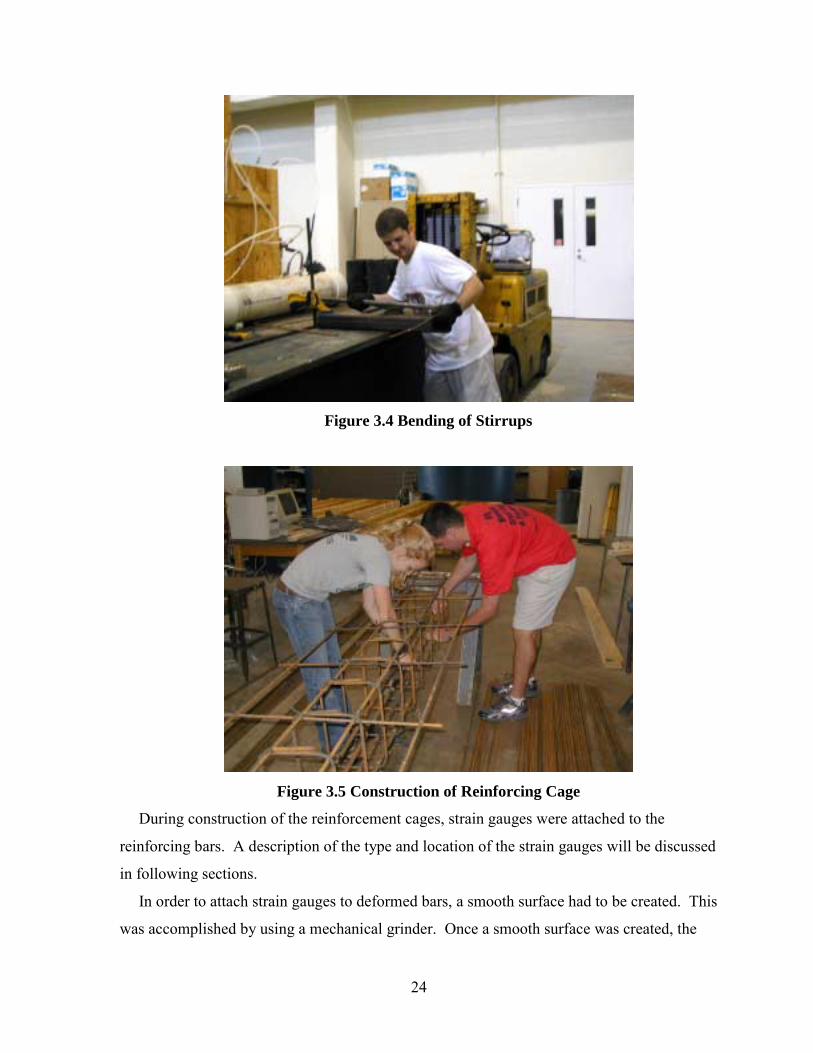
The stirrups were cut to length and bent to the designed specifications using a jig made
such that the correct bend radius was achieved (ACI 318-02). The stirrups were bent by hand
as can be seen in Figure 3.4. The reinforcing cages were constructed outside of the forms
and were then placed into the forms. The process of constructing the reinforcing cages is
shown in Figure 3.5.
24
Figure 3.4 Bending of Stirrups
Figure 3.5 Construction of Reinforcing Cage
During construction of the reinforcement cages, strain gauges were attached to the
reinforcing bars. A description of the type and location of the strain gauges will be discussed
in following sections.
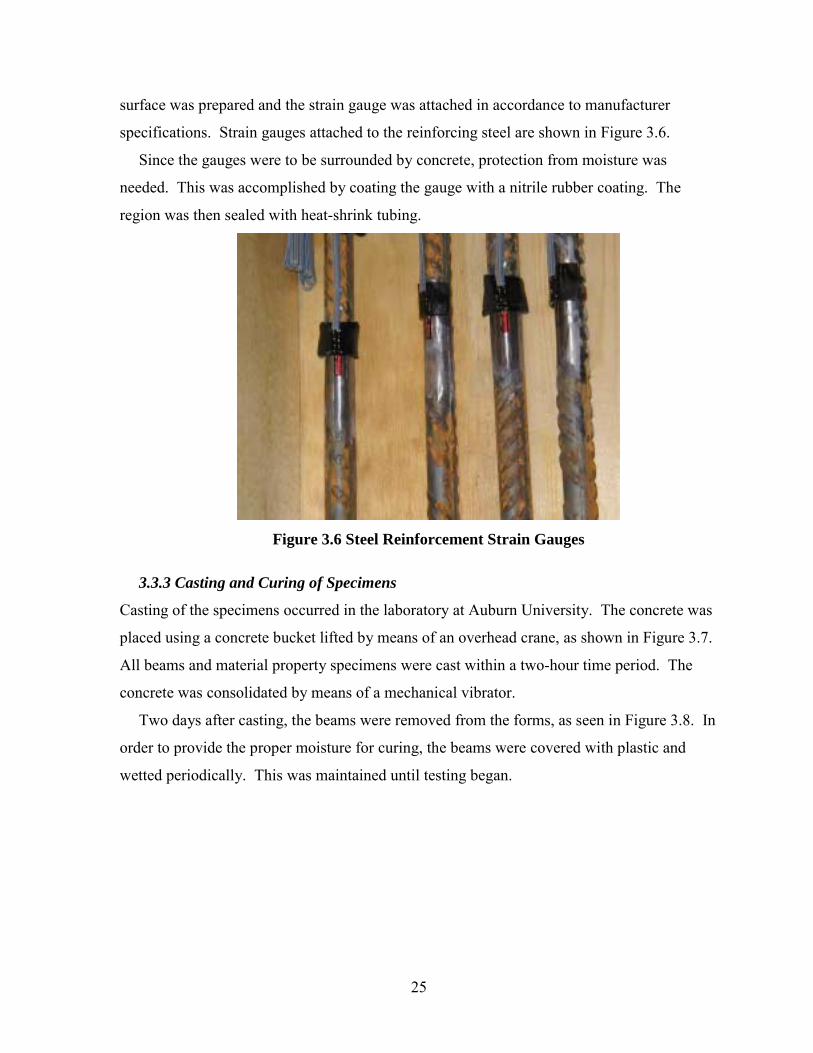
In order to attach strain gauges to deformed bars, a smooth surface had to be created. This
was accomplished by using a mechanical grinder. Once a smooth surface was created, the
25
surface was prepared and the strain gauge was attached in accordance to manufacturer
specifications. Strain gauges attached to the reinforcing steel are shown in Figure 3.6.
Since the gauges were to be surrounded by concrete, protection from moisture was
needed. This was accomplished by coating the gauge with a nitrile rubber coating. The
region was then sealed with heat-shrink tubing.
Figure 3.6 Steel Reinforcement Strain Gauges
3.3.3 Casting and Curing of Specimens
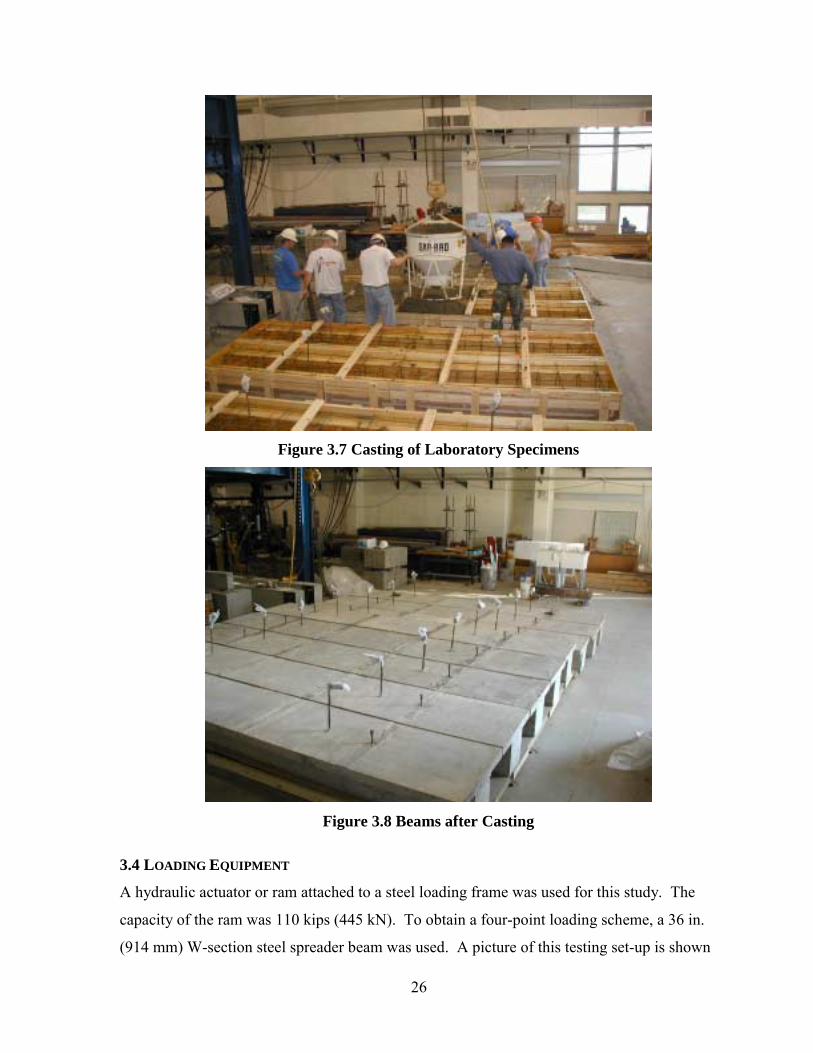
Casting of the specimens occurred in the laboratory at Auburn University. The concrete was
placed using a concrete bucket lifted by means of an overhead crane, as shown in Figure 3.7.
All beams and material property specimens were cast within a two-hour time period. The
concrete was consolidated by means of a mechanical vibrator.
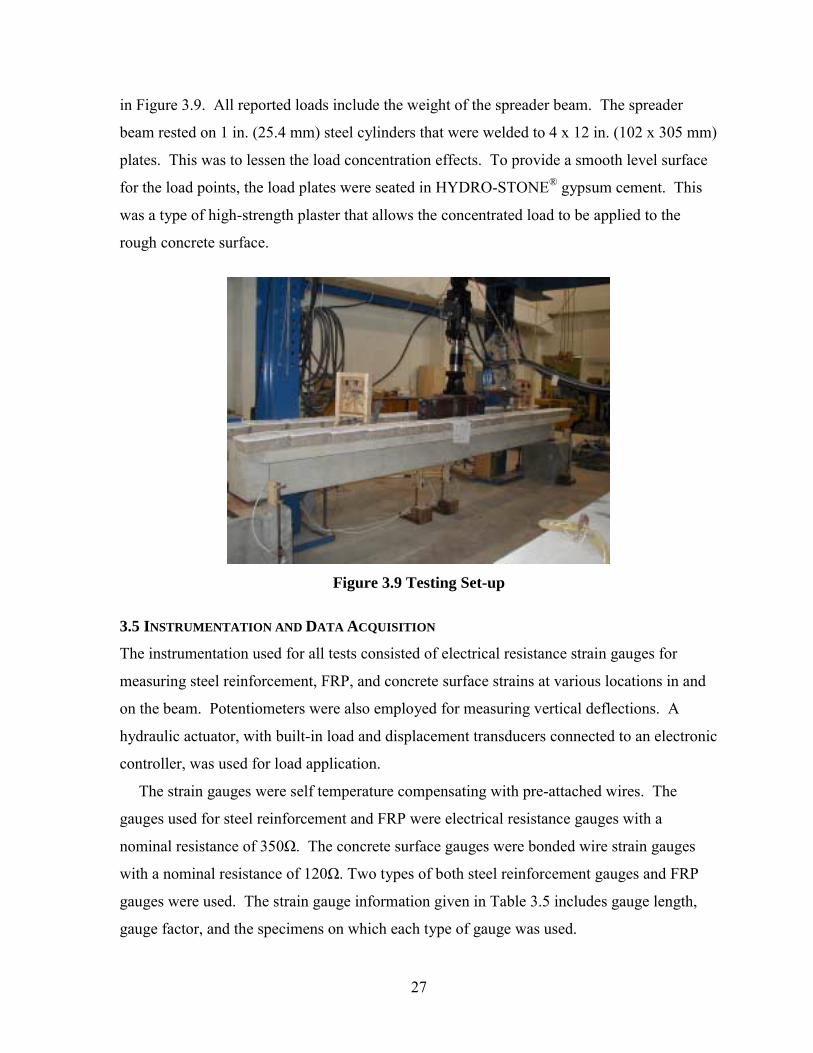
Two days after casting, the beams were removed from the forms, as seen in Figure 3.8. In
order to provide the proper moisture for curing, the beams were covered with plastic and
wetted periodically. This was maintained until testing began.
26
Figure 3.7 Casting of Laboratory Specimens
Figure 3.8 Beams after Casting
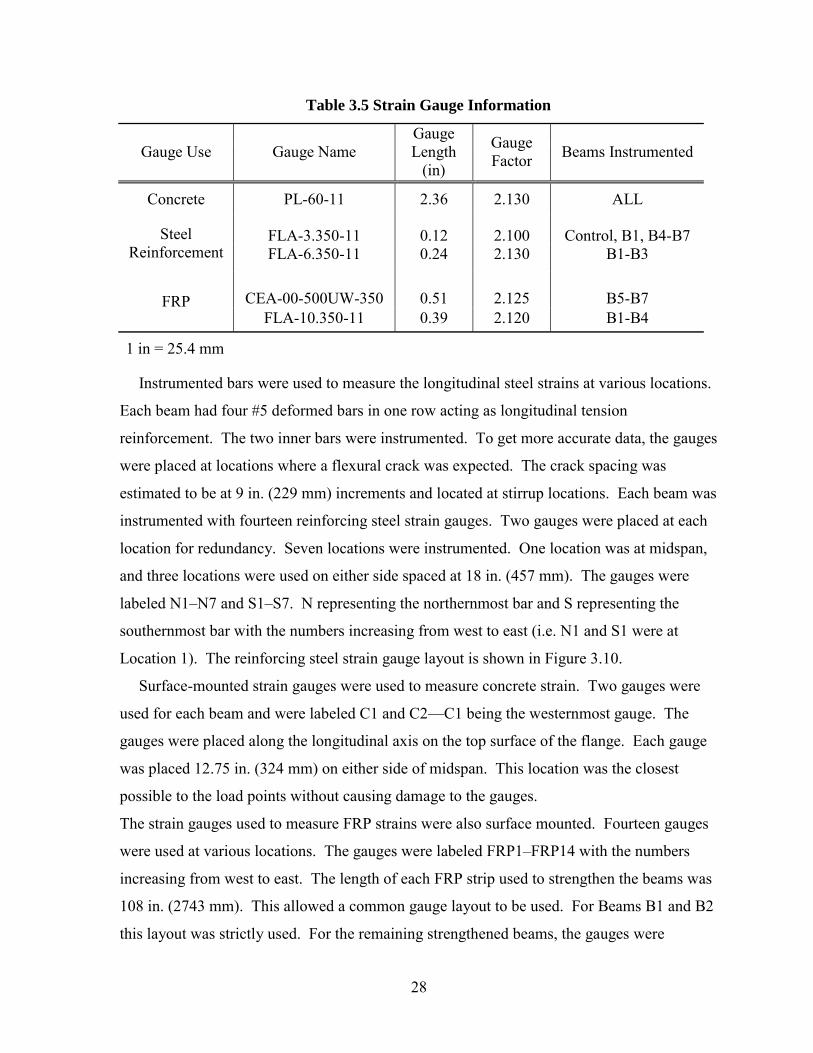
3.4 LOADING EQUIPMENT
A hydraulic actuator or ram attached to a steel loading frame was used for this study. The
capacity of the ram was 110 kips (445 kN). To obtain a four-point loading scheme, a 36 in.
(914 mm) W-section steel spreader beam was used. A picture of this testing set-up is shown
27
in Figure 3.9. All reported loads include the weight of the spreader beam. The spreader
beam rested on 1 in. (25.4 mm) steel cylinders that were welded to 4 x 12 in. (102 x 305 mm)
plates. This was to lessen the load concentration effects. To provide a smooth level surface
for the load points, the load plates were seated in HYDRO-STONE® gypsum cement. This
was a type of high-strength plaster that allows the concentrated load to be applied to the
rough concrete surface.
Figure 3.9 Testing Set-up
3.5 INSTRUMENTATION AND DATA ACQUISITION
The instrumentation used for all tests consisted of electrical resistance strain gauges for
measuring steel reinforcement, FRP, and concrete surface strains at various locations in and
on the beam. Potentiometers were also employed for measuring vertical deflections. A
hydraulic actuator, with built-in load and displacement transducers connected to an electronic
controller, was used for load application.
The strain gauges were self temperature compensating with pre-attached wires. The
gauges used for steel reinforcement and FRP were electrical resistance gauges with a
nominal resistance of 350Ω. The concrete surface gauges were bonded wire strain gauges
with a nominal resistance of 120Ω. Two types of both steel reinforcement gauges and FRP
gauges were used. The strain gauge information given in Table 3.5 includes gauge length,
gauge factor, and the specimens on which each type of gauge was used.
28
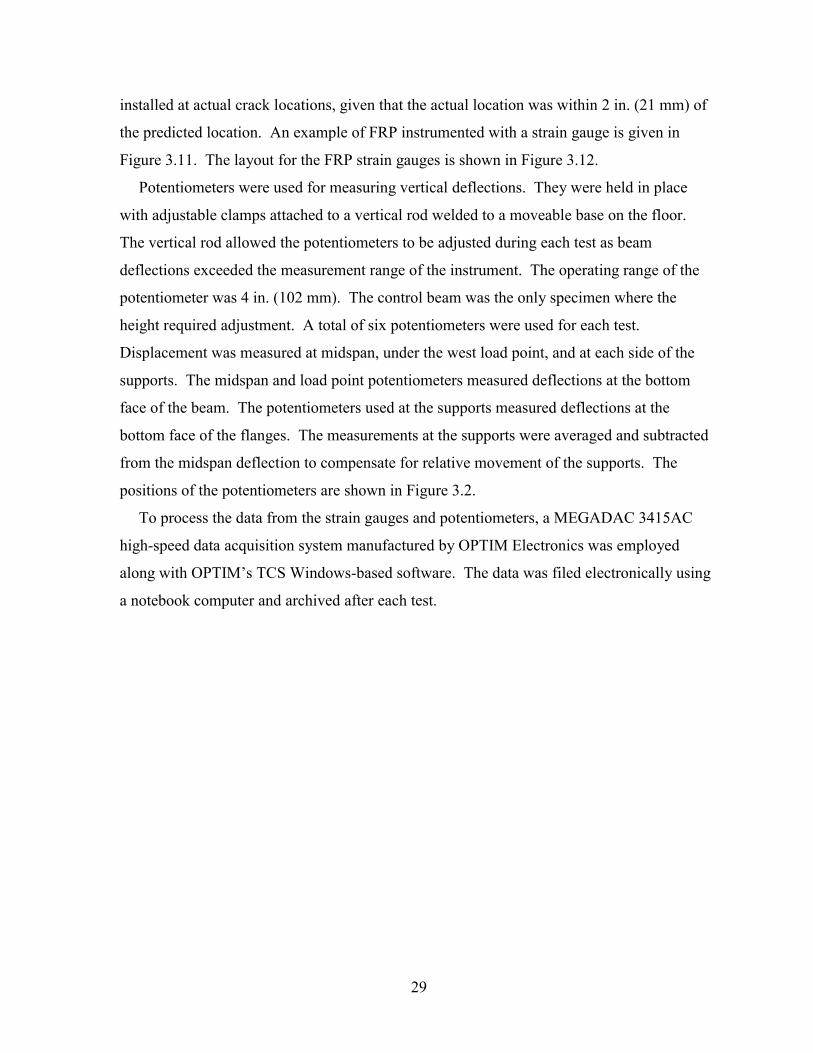
Table 3.5 Strain Gauge Information
Gauge Use Gauge Name Gauge Length
(in)
Gauge Factor Beams Instrumented
Concrete PL-60-11 2.36 2.130 ALL
FLA-3.350-11 0.12 2.100 Control, B1, B4-B7 Steel Reinforcement FLA-6.350-11 0.24 2.130 B1-B3
CEA-00-500UW-350 0.51 2.125 B5-B7 FRP FLA-10.350-11 0.39 2.120 B1-B4
1 in = 25.4 mm
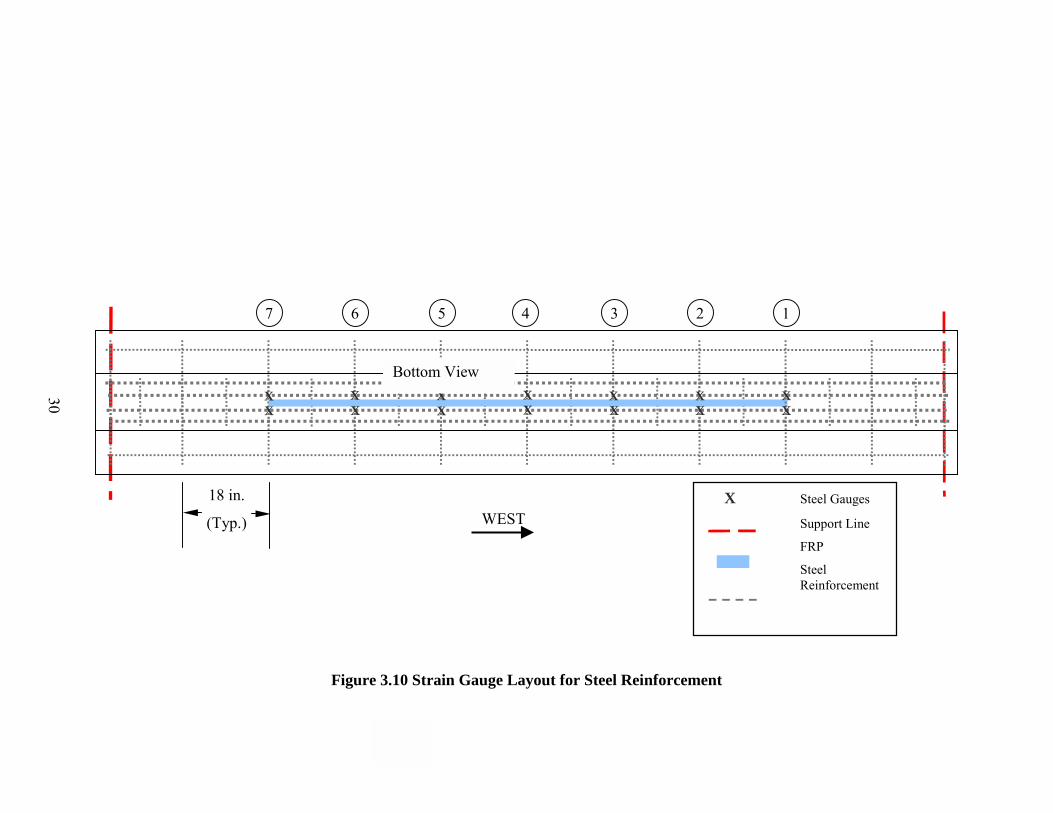
Instrumented bars were used to measure the longitudinal steel strains at various locations.
Each beam had four #5 deformed bars in one row acting as longitudinal tension
reinforcement. The two inner bars were instrumented. To get more accurate data, the gauges
were placed at locations where a flexural crack was expected. The crack spacing was
estimated to be at 9 in. (229 mm) increments and located at stirrup locations. Each beam was
instrumented with fourteen reinforcing steel strain gauges. Two gauges were placed at each
location for redundancy. Seven locations were instrumented. One location was at midspan,
and three locations were used on either side spaced at 18 in. (457 mm). The gauges were
labeled N1N7 and S1S7. N representing the northernmost bar and S representing the
southernmost bar with the numbers increasing from west to east (i.e. N1 and S1 were at
Location 1). The reinforcing steel strain gauge layout is shown in Figure 3.10.
Surface-mounted strain gauges were used to measure concrete strain. Two gauges were
used for each beam and were labeled C1 and C2C1 being the westernmost gauge. The
gauges were placed along the longitudinal axis on the top surface of the flange. Each gauge
was placed 12.75 in. (324 mm) on either side of midspan. This location was the closest
possible to the load points without causing damage to the gauges.
The strain gauges used to measure FRP strains were also surface mounted. Fourteen gauges
were used at various locations. The gauges were labeled FRP1FRP14 with the numbers
increasing from west to east. The length of each FRP strip used to strengthen the beams was
108 in. (2743 mm). This allowed a common gauge layout to be used. For Beams B1 and B2
this layout was strictly used. For the remaining strengthened beams, the gauges were
29
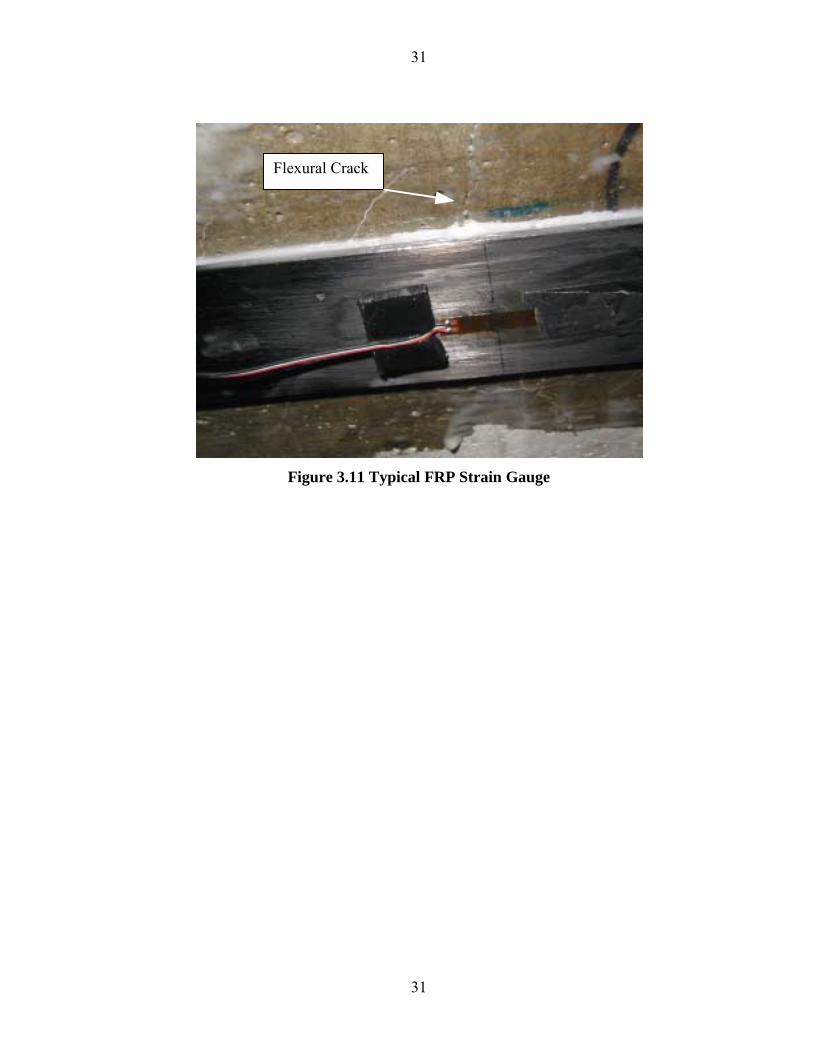
installed at actual crack locations, given that the actual location was within 2 in. (21 mm) of
the predicted location. An example of FRP instrumented with a strain gauge is given in
Figure 3.11. The layout for the FRP strain gauges is shown in Figure 3.12.
Potentiometers were used for measuring vertical deflections. They were held in place
with adjustable clamps attached to a vertical rod welded to a moveable base on the floor.
The vertical rod allowed the potentiometers to be adjusted during each test as beam
deflections exceeded the measurement range of the instrument. The operating range of the
potentiometer was 4 in. (102 mm). The control beam was the only specimen where the
height required adjustment. A total of six potentiometers were used for each test.
Displacement was measured at midspan, under the west load point, and at each side of the
supports. The midspan and load point potentiometers measured deflections at the bottom
face of the beam. The potentiometers used at the supports measured deflections at the
bottom face of the flanges. The measurements at the supports were averaged and subtracted
from the midspan deflection to compensate for relative movement of the supports. The
positions of the potentiometers are shown in Figure 3.2.
To process the data from the strain gauges and potentiometers, a MEGADAC 3415AC
high-speed data acquisition system manufactured by OPTIM Electronics was employed
along with OPTIMs TCS Windows-based software. The data was filed electronically using
a notebook computer and archived after each test.
30
Figure 3.10 Strain Gauge Layout for Steel Reinforcement
30
X X
X X
X X
X X
X X
X X X
X
X Steel Gauges
Support Line
FRP
Steel Reinforcement
WEST 18 in.
(Typ.)
1 2 3 4 5 6 7
Bottom View
31
31
Figure 3.11 Typical FRP Strain Gauge
Flexural Crack
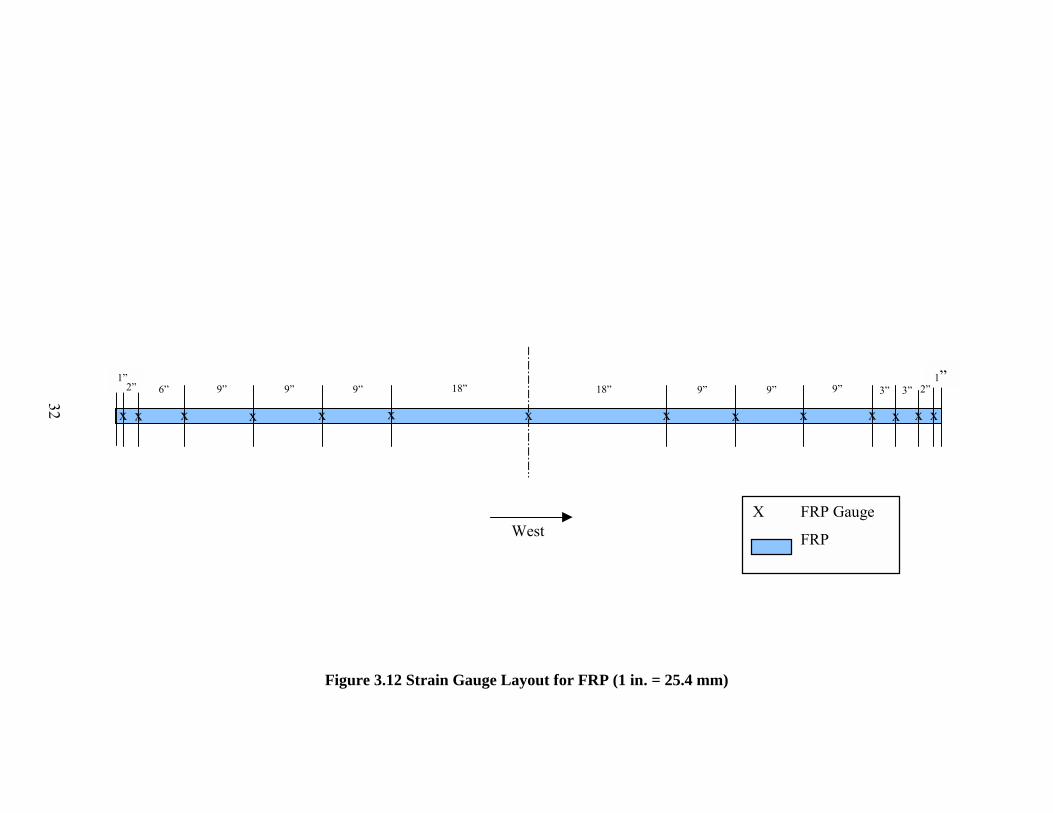
Figure 3.12 Strain Gauge Layout for FRP (1 in. = 25.4 mm)
32
West
x x x x x x x x x x x x x x
2 6 9 9 9 18 18 9 9 9 3 3
X FRP Gauge
FRP
1 1 2 2
33
CHAPTER 4: TEST PROGRAM
In order to represent actual in-service bridge conditions, a detailed test program was
designed. The different steps of the test program will be discussed in this chapter. The
various steps included:
1. Loading the member to induce flexural cracking.
2. Applying 100,000 pre-repair service load cycles to the member.
3. Preparing the concrete surface of the member where the FRP would be applied.
4. Initiating cycles representative of traffic loads to those beams exposed to cycles
during epoxy cure time.
5. Applying Tyfo® S saturant epoxy to the concrete surface.
6. Applying Tyfo® TC epoxy and bonding FRP to the member.
7. Allowing epoxy to cure for 48 hours while undergoing load cycles (if applicable).
8. Stopping load cycles and attaching strain gauges to FRP surfaces.
9. Applying 20,000 post-repair service load cycles to the member.
10. Loading member quasi-statically to failure.
The testing procedure was the same for all beams with a few exceptions: the control beam
was not strengthened using FRP; and two other beams were not exposed to cycles during
epoxy cure time, thus serving as control beams for the effects of load cycling during curing.
The variables for each test beam in the testing program are given in Table 4.1. The specimen
label nomenclature is described in Table 4.2. The results from the various tests will be
discussed in the following chapter.
34
Table 4.1 Test Program for Laboratory Specimens
Specimen
FRP
Thickness
(in.)
Desired Epoxy
Thickness
(in.)
Actual Epoxy
Thickness
(in.)
Cycle Intensity
During Epoxy
Cure Time1
Control None NA NA None
B1-55-1-N 0.055 0.0625 0.070 None (Control for
effects of cycles)
B2-55-1-L 0.055 0.0625 0.052 Low
B3-55-1-M 0.055 0.0625 0.052 Medium
B4-55-1-H 0.055 0.0625 0.050 High
B5-55-2-H 0.055 0.125 0.090 High
B6-55-2-N 0.055 0.125 0.100 None (Control for
effects of cycles)
B7-75-1-H 0.075 0.0625 0.062 High 1 Defined in Section 4.4, 1 in. = 25.4 mm
Table 4.2 Description of Specimen Label Nomenclature
B1-55-1-N B1-55-1-N B1-55-1-N B1-55-1-N
Beam Number FRP Thickness,
in mils
Epoxy Thickness:
1 = 0.0625 in.
2 = 0.125 in.
Cycle Intensity:
N = None
L = Low
M = Medium
H = High
1 in. = 25.4 mm
4.1 CRACKING OF SPECIMENS
In order to make the test specimens more representative of actual bridge applications, it was
desirable to crack the beams to an extent typical of in-service bridges. This was
accomplished by applying a load that would crack the member on the tension face. The War
Memorial Bridge girders are cracked throughout the positive moment regions; therefore a
load was applied to the specimens that would distribute flexural cracks throughout.
35
To determine the amount of load needed to extend cracks the length of the FRP, the
cracking moment was calculated based on the modulus of rupture measured during material
property testing. The load was then calculated that would cause an internal moment, at the
location of the FRP ends, to exceed the cracking moment. It was determined that a total
applied load of 14 kips (62 kN) would accomplish this task. The load corresponding to
yielding of the reinforcing steel was calculated to make sure the load applied to crack the
specimens would not yield the reinforcing bars. A typical crack pattern at the end of this step
is given in Figure 4.1.
Data was recorded at a frequency of two data sets per second for the entire cracking
procedure. The test procedure for this step was:
1. Balancing the data acquisition system with zero applied load.
2. Loading the beam monotonically at an approximately constant rate up to 7 kips (31
kN).
3. Tracing the outline of the cracks with a permanent marker, as shown in Figure 4.2,
and labeling the end of the crack with the corresponding load.
4. Measuring the crack width at midspan and under one load point using a crack
scope.
5. Loading the beam monotonically at an approximately constant rate up to 14 kips
(62 kN).
6. Tracing the outline of the cracks with a permanent marker, and labeling the end of
the crack with the corresponding load.
7. Measuring the crack width at midspan and under one load point using a crack
scope.
8. Unloading beam.
Figure 4.1 Typical Crack Pattern at End of Cracking Test (1 in. = 25.4 mm)
~9 in.
36
Figure 4.2 Marking Cracks during Crack Test
4.2 APPLICATION OF PRE-REPAIR CYCLES
In actual bridge strengthening applications, the bridge has usually been in service for some
period of time. The bridge has been exposed to traffic loadings which cause stress cycles on
the members. To represent years of service, pre-repair load cycles were imposed on the
laboratory specimens.
It was estimated that the War Memorial Bridge was exposed to no more than fifty large
truck cycles per workday. This number was used to determine the amount of cycles to place
on the laboratory specimens. The specimens were exposed to 100,000 cycles, which
corresponds to at least 8 years of service. The sine-wave cycles had a frequency of 1 Hz,
which resulted in a total time of 28 hours to complete the cycles.
The magnitude of the cycles was determined by strain values measured during live load
tests performed on the War Memorial Bridge. Live load tests were performed on the bridge
by using load test trucks provided by ALDOT. Reinforcement strains were measured at
different locations on each span. Values measured in actual girders were used to determine
the reinforcement stress range for application to the test specimens. From this data, it was
determined that a stress magnitude of 11.6 ksi (80 MPa) due only to the applied load, which
corresponds to a strain of 400 microstrain, would be sufficient for the load cycles. To cause
37
a stress magnitude in the steel reinforcement equal to 11.6 ksi (80 MPa), an applied load of
5.6 kips (24.9 kN) was calculated.
After running a few cycles on the Control beam, it was determined that the load should
cycle between 1 kips (4 kN) and 5.6 kips (24.9 kN). This would prevent movement of the
spreader beam caused by the cycles. For each beam, strain, load, and deflection data were
recorded at four different time periods at a scan rate of 200 data sets per second. Data was
recorded for the 100th, 1,000th, 10,000th, and 100,000th cycle. The application of the load
cycles were load controlled. The load cycle used in this step is shown in Figure 4.3.
0
0.5
1
1.5
2
2.5
3
3.5
4
4.5
5
5.5
6
0 0.1 0.2 0.3 0.4 0.5 0.6 0.7 0.8 0.9 1
Time (sec)
Load
(kip
s)
Figure 4.3 Typical Sine Wave Applied to Test Specimens (1 kip = 4.448 kN)
4.3 SURFACE PREPARATION
According to the ACI 440 committee, localized out-of-plane variations, including form lines,
should not exceed 1/32 in. (1 mm). Also, any voids should be filled with epoxy and all
laitance, dust, dirt, oil, curing compound, existing coatings, and any other matter that could
interfere with the bond between the FRP and the concrete should be removed (ACI 440.2R-
02).
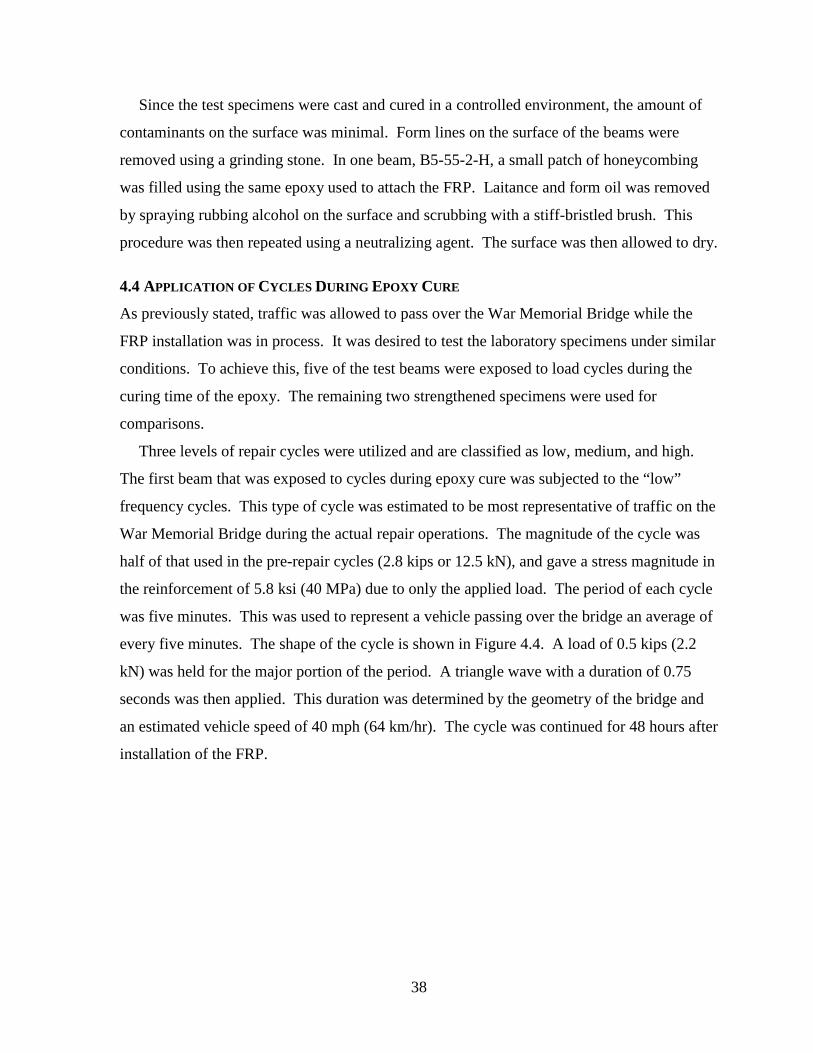
38
Since the test specimens were cast and cured in a controlled environment, the amount of
contaminants on the surface was minimal. Form lines on the surface of the beams were
removed using a grinding stone. In one beam, B5-55-2-H, a small patch of honeycombing
was filled using the same epoxy used to attach the FRP. Laitance and form oil was removed
by spraying rubbing alcohol on the surface and scrubbing with a stiff-bristled brush. This
procedure was then repeated using a neutralizing agent. The surface was then allowed to dry.
4.4 APPLICATION OF CYCLES DURING EPOXY CURE
As previously stated, traffic was allowed to pass over the War Memorial Bridge while the
FRP installation was in process. It was desired to test the laboratory specimens under similar
conditions. To achieve this, five of the test beams were exposed to load cycles during the
curing time of the epoxy. The remaining two strengthened specimens were used for
comparisons.
Three levels of repair cycles were utilized and are classified as low, medium, and high.
The first beam that was exposed to cycles during epoxy cure was subjected to the “low”
frequency cycles. This type of cycle was estimated to be most representative of traffic on the
War Memorial Bridge during the actual repair operations. The magnitude of the cycle was
half of that used in the pre-repair cycles (2.8 kips or 12.5 kN), and gave a stress magnitude in
the reinforcement of 5.8 ksi (40 MPa) due to only the applied load. The period of each cycle
was five minutes. This was used to represent a vehicle passing over the bridge an average of
every five minutes. The shape of the cycle is shown in Figure 4.4. A load of 0.5 kips (2.2
kN) was held for the major portion of the period. A triangle wave with a duration of 0.75
seconds was then applied. This duration was determined by the geometry of the bridge and
an estimated vehicle speed of 40 mph (64 km/hr). The cycle was continued for 48 hours after
installation of the FRP.
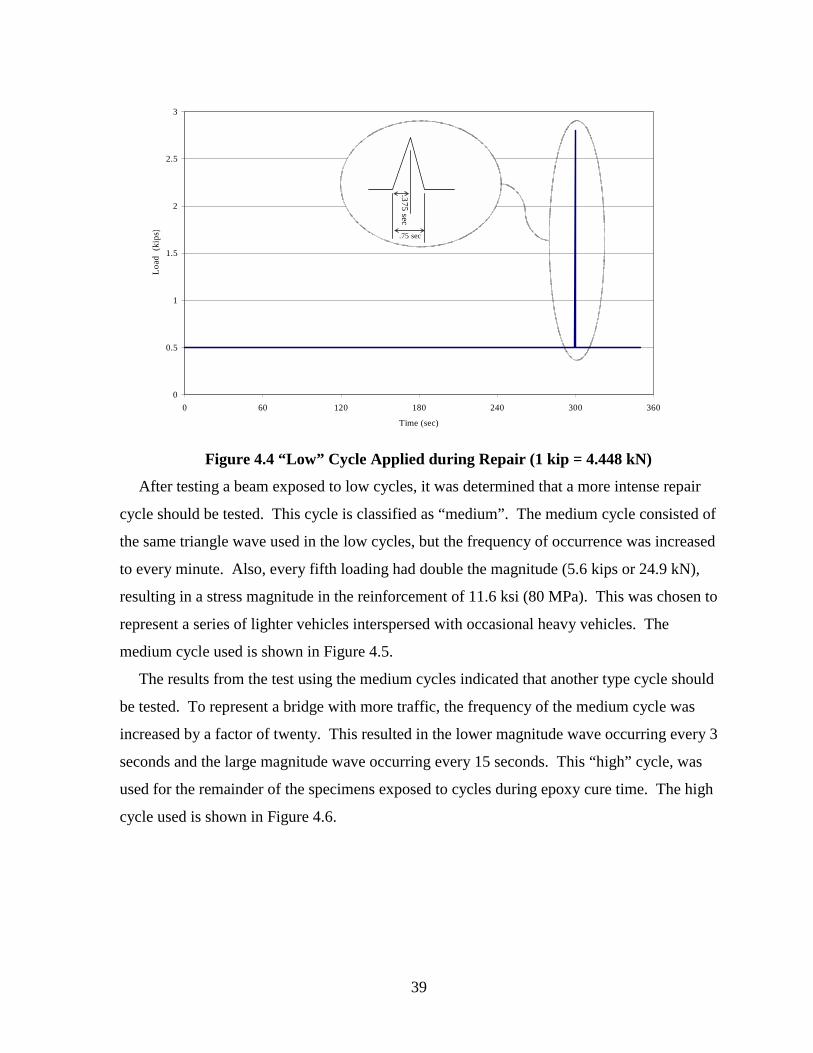
39
0
0.5
1
1.5
2
2.5
3
0 60 120 180 240 300 360
Time (sec)
Load
(ki
ps)
.375 sec
.75 sec
Figure 4.4 “Low” Cycle Applied during Repair (1 kip = 4.448 kN)
After testing a beam exposed to low cycles, it was determined that a more intense repair
cycle should be tested. This cycle is classified as “medium”. The medium cycle consisted of
the same triangle wave used in the low cycles, but the frequency of occurrence was increased
to every minute. Also, every fifth loading had double the magnitude (5.6 kips or 24.9 kN),
resulting in a stress magnitude in the reinforcement of 11.6 ksi (80 MPa). This was chosen to
represent a series of lighter vehicles interspersed with occasional heavy vehicles. The
medium cycle used is shown in Figure 4.5.
The results from the test using the medium cycles indicated that another type cycle should
be tested. To represent a bridge with more traffic, the frequency of the medium cycle was
increased by a factor of twenty. This resulted in the lower magnitude wave occurring every 3
seconds and the large magnitude wave occurring every 15 seconds. This “high” cycle, was
used for the remainder of the specimens exposed to cycles during epoxy cure time. The high
cycle used is shown in Figure 4.6.
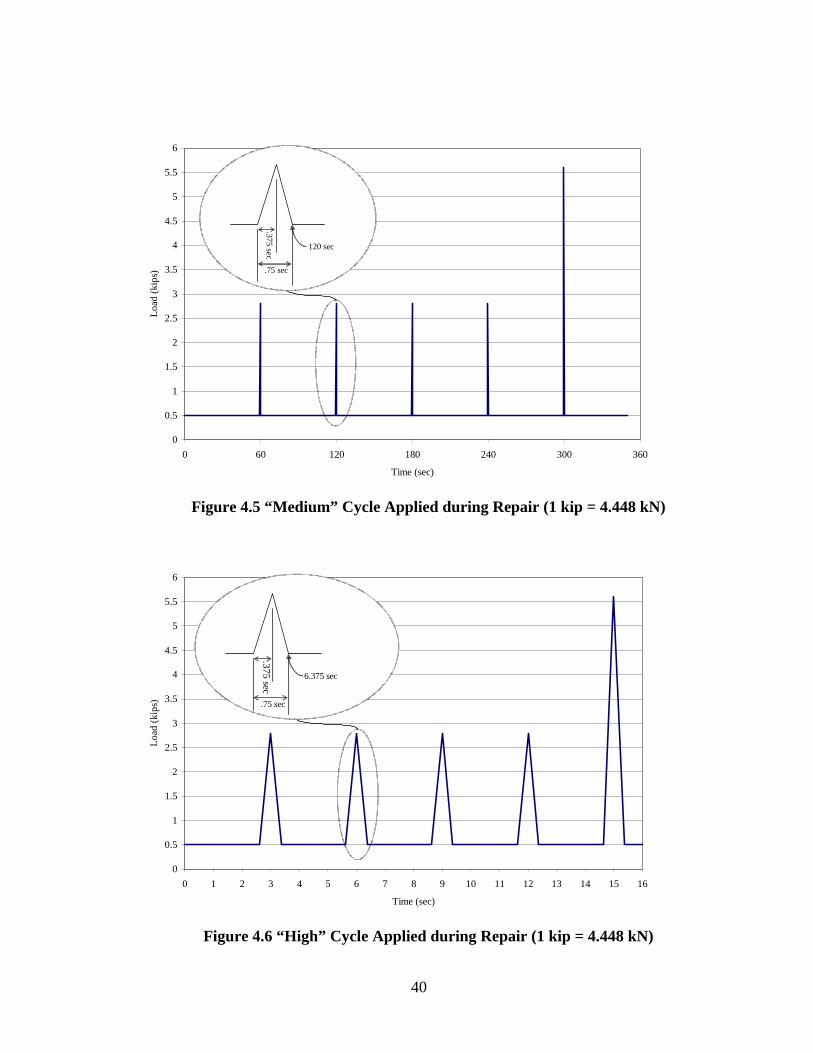
40
0
0.5
1
1.5
2
2.5
3
3.5
4
4.5
5
5.5
6
0 60 120 180 240 300 360
Time (sec)
Load
(kip
s)
.375 sec
.75 sec
120 sec
Figure 4.5 “Medium” Cycle Applied during Repair (1 kip = 4.448 kN)
0
0.5
1
1.5
2
2.5
3
3.5
4
4.5
5
5.5
6
0 1 2 3 4 5 6 7 8 9 10 11 12 13 14 15 16
Time (sec)
Load
(kip
s)
.375 sec
.75 sec
6.375 sec
Figure 4.6 “High” Cycle Applied during Repair (1 kip = 4.448 kN)
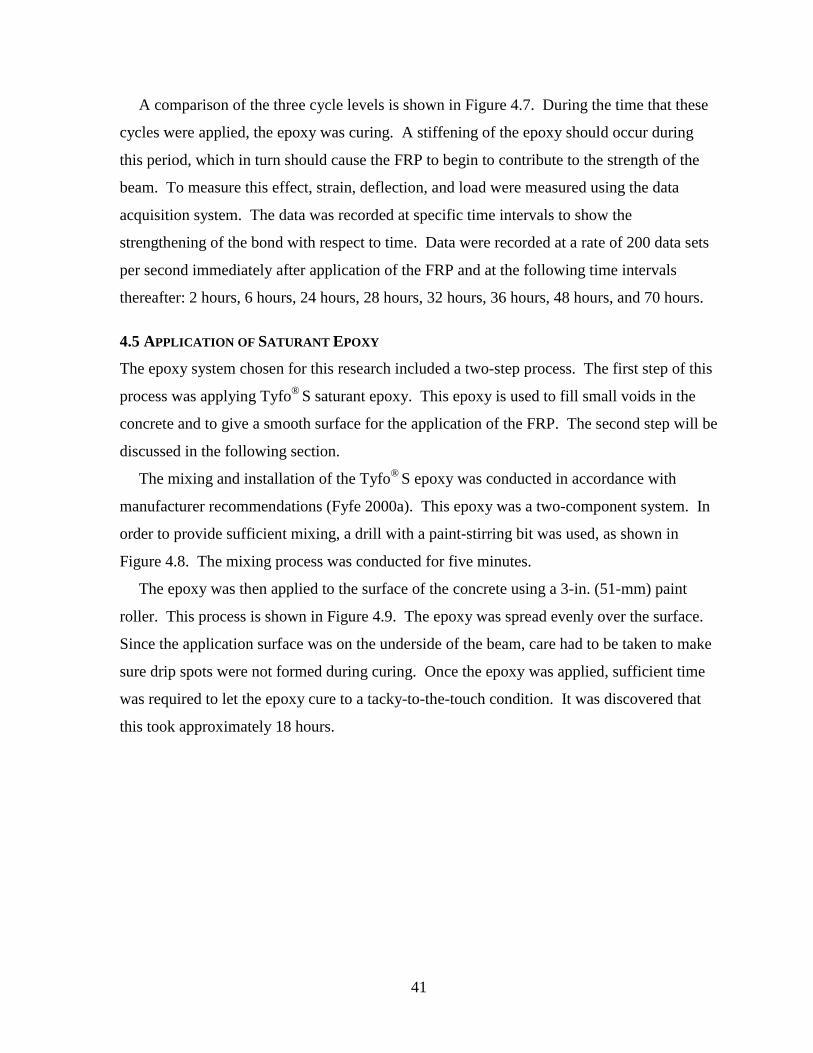
41
A comparison of the three cycle levels is shown in Figure 4.7. During the time that these
cycles were applied, the epoxy was curing. A stiffening of the epoxy should occur during
this period, which in turn should cause the FRP to begin to contribute to the strength of the
beam. To measure this effect, strain, deflection, and load were measured using the data
acquisition system. The data was recorded at specific time intervals to show the
strengthening of the bond with respect to time. Data were recorded at a rate of 200 data sets
per second immediately after application of the FRP and at the following time intervals
thereafter: 2 hours, 6 hours, 24 hours, 28 hours, 32 hours, 36 hours, 48 hours, and 70 hours.
4.5 APPLICATION OF SATURANT EPOXY
The epoxy system chosen for this research included a two-step process. The first step of this
process was applying Tyfo® S saturant epoxy. This epoxy is used to fill small voids in the
concrete and to give a smooth surface for the application of the FRP. The second step will be
discussed in the following section.
The mixing and installation of the Tyfo® S epoxy was conducted in accordance with
manufacturer recommendations (Fyfe 2000a). This epoxy was a two-component system. In
order to provide sufficient mixing, a drill with a paint-stirring bit was used, as shown in
Figure 4.8. The mixing process was conducted for five minutes.
The epoxy was then applied to the surface of the concrete using a 3-in. (51-mm) paint
roller. This process is shown in Figure 4.9. The epoxy was spread evenly over the surface.
Since the application surface was on the underside of the beam, care had to be taken to make
sure drip spots were not formed during curing. Once the epoxy was applied, sufficient time
was required to let the epoxy cure to a tacky-to-the-touch condition. It was discovered that
this took approximately 18 hours.
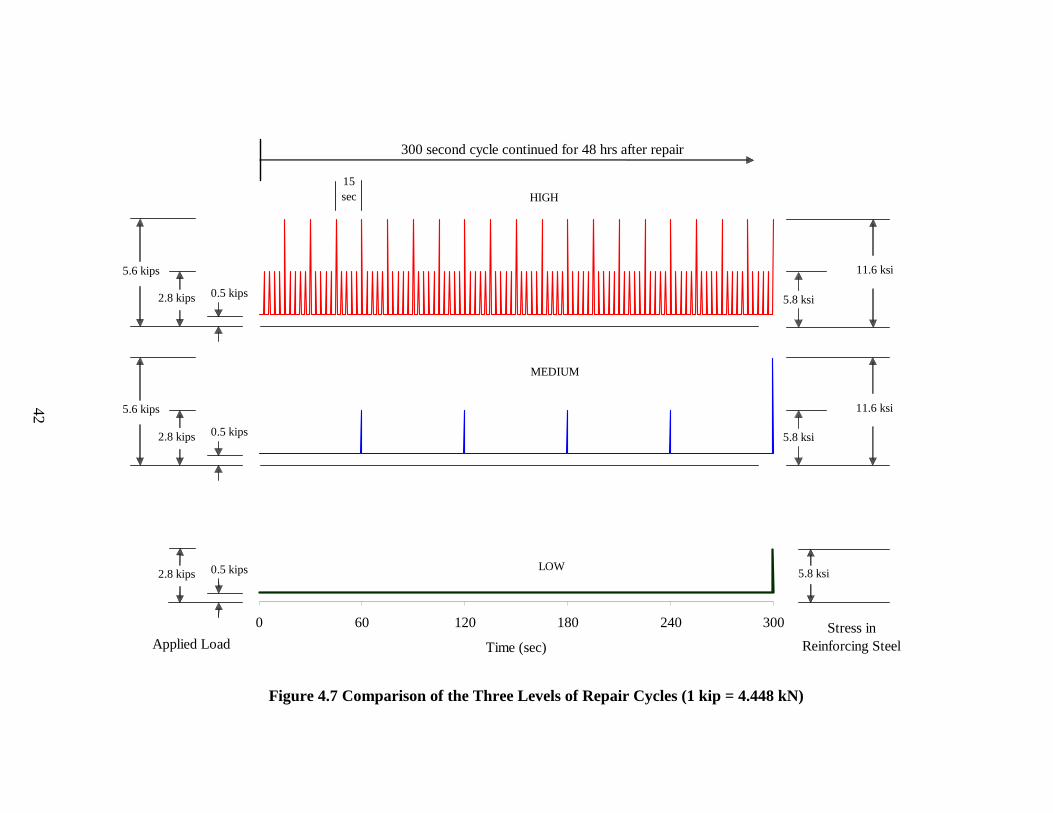
0 60 120 180 240 300
Time (sec)
LOW
HIGH
MEDIUM
300 second cycle continued for 48 hrs after repair
15sec
2.8 kips
5.6 kips
0.5 kips
2.8 kips
5.6 kips
0.5 kips
2.8 kips 0.5 kips 5.8 ksi
5.8 ksi
11.6 ksi
5.8 ksi
11.6 ksi
Applied LoadStress in
Reinforcing Steel
Figure 4.7 Comparison of the Three Levels of Repair Cycles (1 kip = 4.448 kN)
42
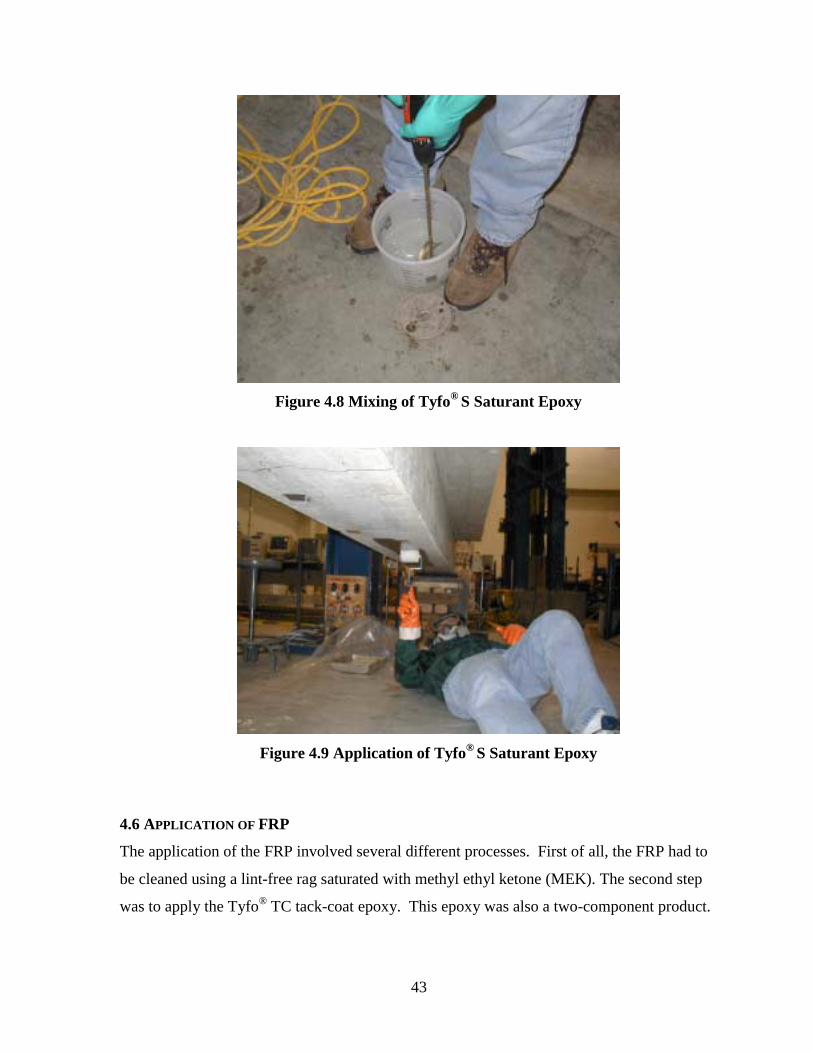
43
Figure 4.8 Mixing of Tyfo® S Saturant Epoxy
Figure 4.9 Application of Tyfo® S Saturant Epoxy
4.6 APPLICATION OF FRP
The application of the FRP involved several different processes. First of all, the FRP had to
be cleaned using a lint-free rag saturated with methyl ethyl ketone (MEK). The second step
was to apply the Tyfo® TC tack-coat epoxy. This epoxy was also a two-component product.
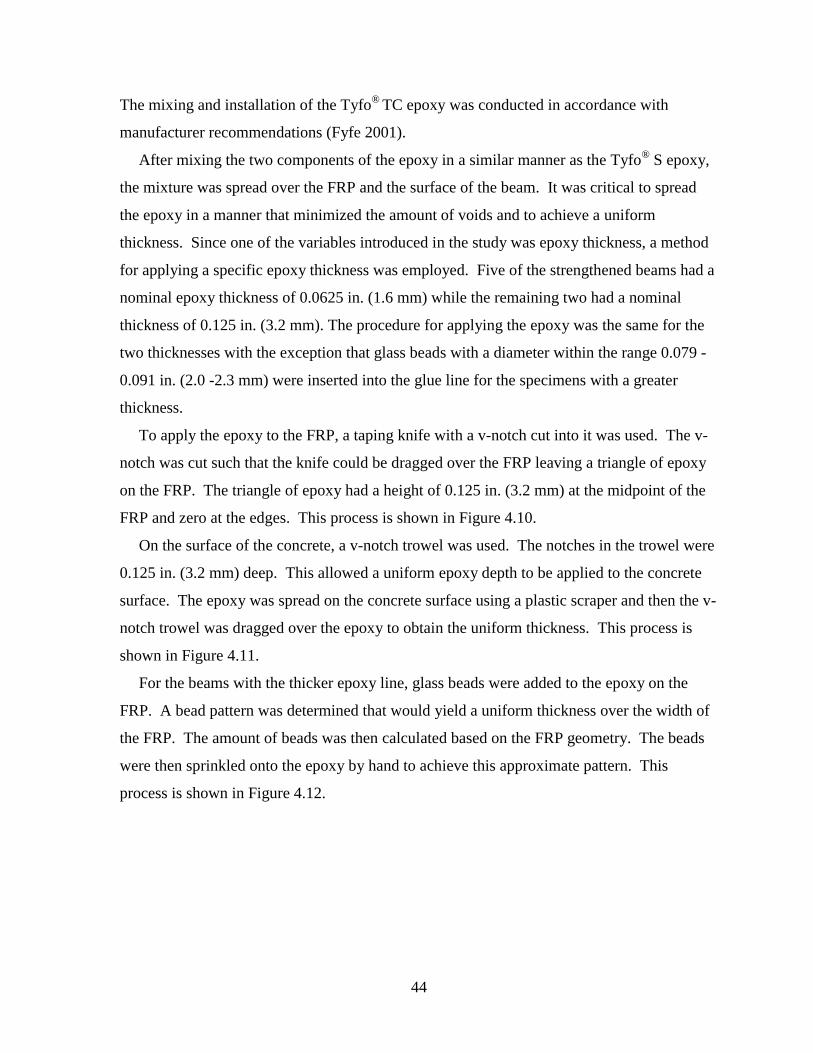
44
The mixing and installation of the Tyfo® TC epoxy was conducted in accordance with
manufacturer recommendations (Fyfe 2001).
After mixing the two components of the epoxy in a similar manner as the Tyfo® S epoxy,
the mixture was spread over the FRP and the surface of the beam. It was critical to spread
the epoxy in a manner that minimized the amount of voids and to achieve a uniform
thickness. Since one of the variables introduced in the study was epoxy thickness, a method
for applying a specific epoxy thickness was employed. Five of the strengthened beams had a
nominal epoxy thickness of 0.0625 in. (1.6 mm) while the remaining two had a nominal
thickness of 0.125 in. (3.2 mm). The procedure for applying the epoxy was the same for the
two thicknesses with the exception that glass beads with a diameter within the range 0.079 -
0.091 in. (2.0 -2.3 mm) were inserted into the glue line for the specimens with a greater
thickness.
To apply the epoxy to the FRP, a taping knife with a v-notch cut into it was used. The v-
notch was cut such that the knife could be dragged over the FRP leaving a triangle of epoxy
on the FRP. The triangle of epoxy had a height of 0.125 in. (3.2 mm) at the midpoint of the
FRP and zero at the edges. This process is shown in Figure 4.10.
On the surface of the concrete, a v-notch trowel was used. The notches in the trowel were
0.125 in. (3.2 mm) deep. This allowed a uniform epoxy depth to be applied to the concrete
surface. The epoxy was spread on the concrete surface using a plastic scraper and then the v-
notch trowel was dragged over the epoxy to obtain the uniform thickness. This process is
shown in Figure 4.11.
For the beams with the thicker epoxy line, glass beads were added to the epoxy on the
FRP. A bead pattern was determined that would yield a uniform thickness over the width of
the FRP. The amount of beads was then calculated based on the FRP geometry. The beads
were then sprinkled onto the epoxy by hand to achieve this approximate pattern. This
process is shown in Figure 4.12.
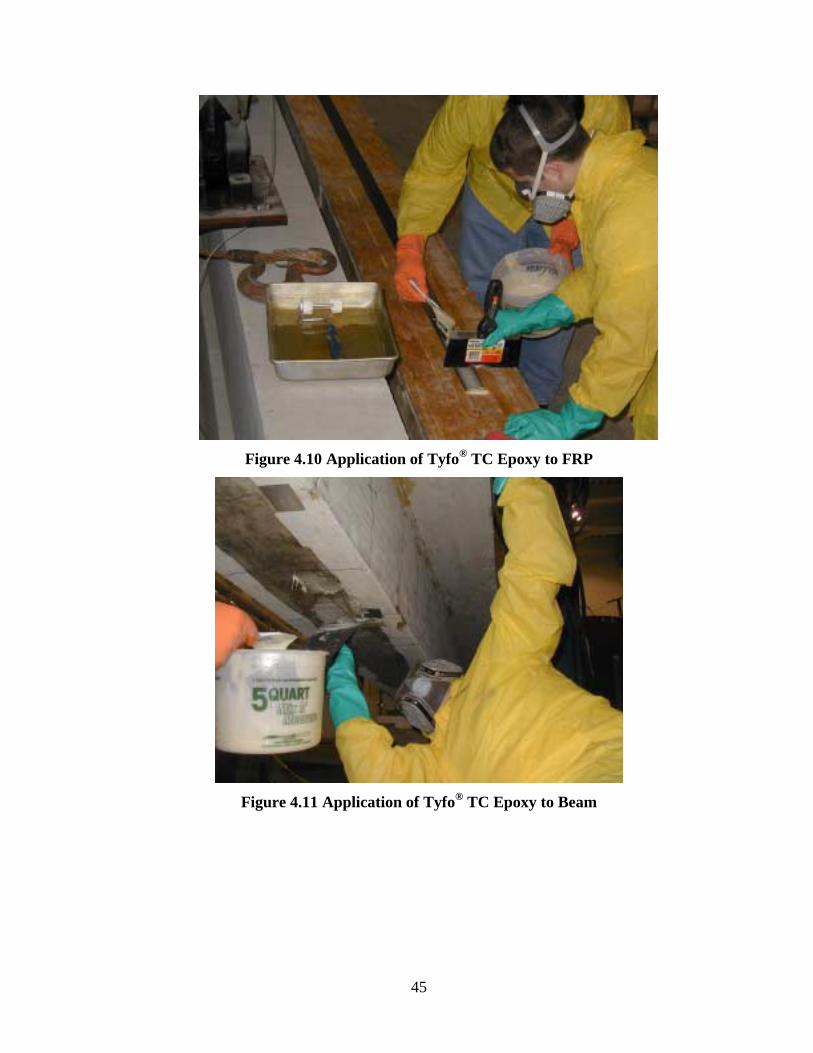
45
Figure 4.10 Application of Tyfo® TC Epoxy to FRP
Figure 4.11 Application of Tyfo® TC Epoxy to Beam
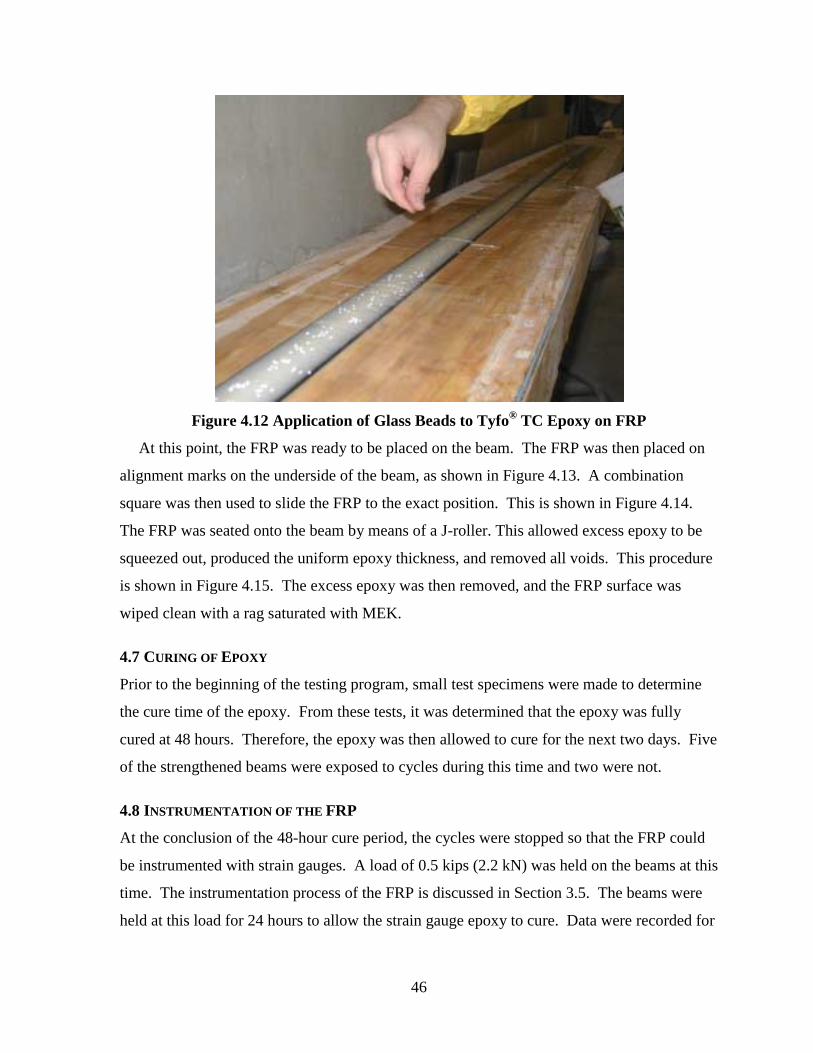
46
Figure 4.12 Application of Glass Beads to Tyfo® TC Epoxy on FRP
At this point, the FRP was ready to be placed on the beam. The FRP was then placed on
alignment marks on the underside of the beam, as shown in Figure 4.13. A combination
square was then used to slide the FRP to the exact position. This is shown in Figure 4.14.
The FRP was seated onto the beam by means of a J-roller. This allowed excess epoxy to be
squeezed out, produced the uniform epoxy thickness, and removed all voids. This procedure
is shown in Figure 4.15. The excess epoxy was then removed, and the FRP surface was
wiped clean with a rag saturated with MEK.
4.7 CURING OF EPOXY
Prior to the beginning of the testing program, small test specimens were made to determine
the cure time of the epoxy. From these tests, it was determined that the epoxy was fully
cured at 48 hours. Therefore, the epoxy was then allowed to cure for the next two days. Five
of the strengthened beams were exposed to cycles during this time and two were not.
4.8 INSTRUMENTATION OF THE FRP
At the conclusion of the 48-hour cure period, the cycles were stopped so that the FRP could
be instrumented with strain gauges. A load of 0.5 kips (2.2 kN) was held on the beams at this
time. The instrumentation process of the FRP is discussed in Section 3.5. The beams were
held at this load for 24 hours to allow the strain gauge epoxy to cure. Data were recorded for
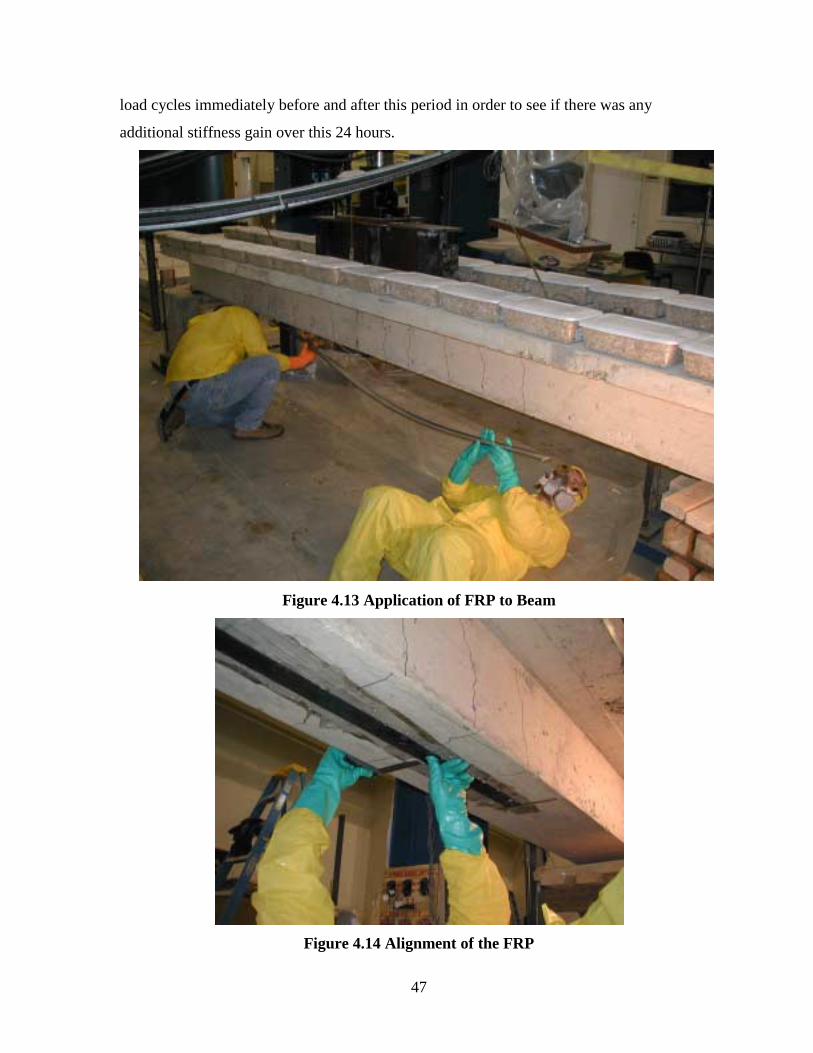
47
load cycles immediately before and after this period in order to see if there was any
additional stiffness gain over this 24 hours.
Figure 4.13 Application of FRP to Beam
Figure 4.14 Alignment of the FRP
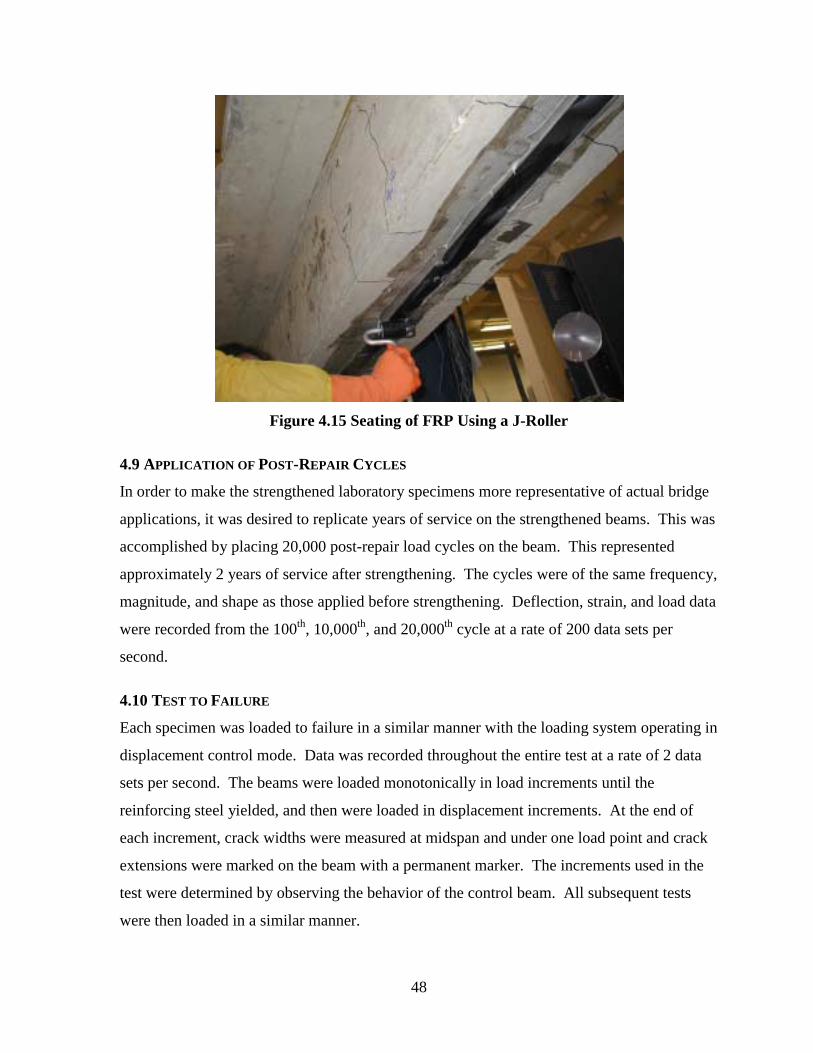
48
Figure 4.15 Seating of FRP Using a J-Roller
4.9 APPLICATION OF POST-REPAIR CYCLES
In order to make the strengthened laboratory specimens more representative of actual bridge
applications, it was desired to replicate years of service on the strengthened beams. This was
accomplished by placing 20,000 post-repair load cycles on the beam. This represented
approximately 2 years of service after strengthening. The cycles were of the same frequency,
magnitude, and shape as those applied before strengthening. Deflection, strain, and load data
were recorded from the 100th, 10,000th, and 20,000th cycle at a rate of 200 data sets per
second.
4.10 TEST TO FAILURE
Each specimen was loaded to failure in a similar manner with the loading system operating in
displacement control mode. Data was recorded throughout the entire test at a rate of 2 data
sets per second. The beams were loaded monotonically in load increments until the
reinforcing steel yielded, and then were loaded in displacement increments. At the end of
each increment, crack widths were measured at midspan and under one load point and crack
extensions were marked on the beam with a permanent marker. The increments used in the
test were determined by observing the behavior of the control beam. All subsequent tests
were then loaded in a similar manner.
49
The incremental loading scheme included loading the beams to 7 kips (31.1 kN), 14 kips
(62.2 kN), 17 kips (75.6 kN), 20 kips (89.0 kN), and 22 kips (97.9 kN). The last load
increment was the point where reinforcing steel was observed to yield. At this point, the load
scheme switched to displacement increments. The midspan displacement at the cessation of
the loading increments typically ranged between 0.4 and 0.5 inches (10.2 and 12.7 mm). The
beams were then loaded until displacements of 0.65 in. (16.5 mm) and 0.9 in. (22.9 mm)
were reached. For the strengthened members, the beginning of the FRP debonding was
observed at the 0.9-in. (22.9-mm) displacement. For this reason, the next increment was to
total debonding of the FRP. At this point, the beam was considered to have failed. The
specimens were then loaded to a displacement of 2 in. (50.8 mm). With the exception of the
control beam, the specimens were then unloaded, and data recording was ceased. The
control beam was loaded up to the maximum stroke of the hydraulic actuator. The beam was
under-reinforced; therefore, the beam was able to deform the total 9-in. (229-mm) stroke
without losing capacity. The failure mode of all strengthened specimens was characterized
by the interface shear stress between the concrete and adhesive exceeding the shear strength
of the concrete. At debonding, a thin layer of concrete was removed with the adhesive and
FRP.
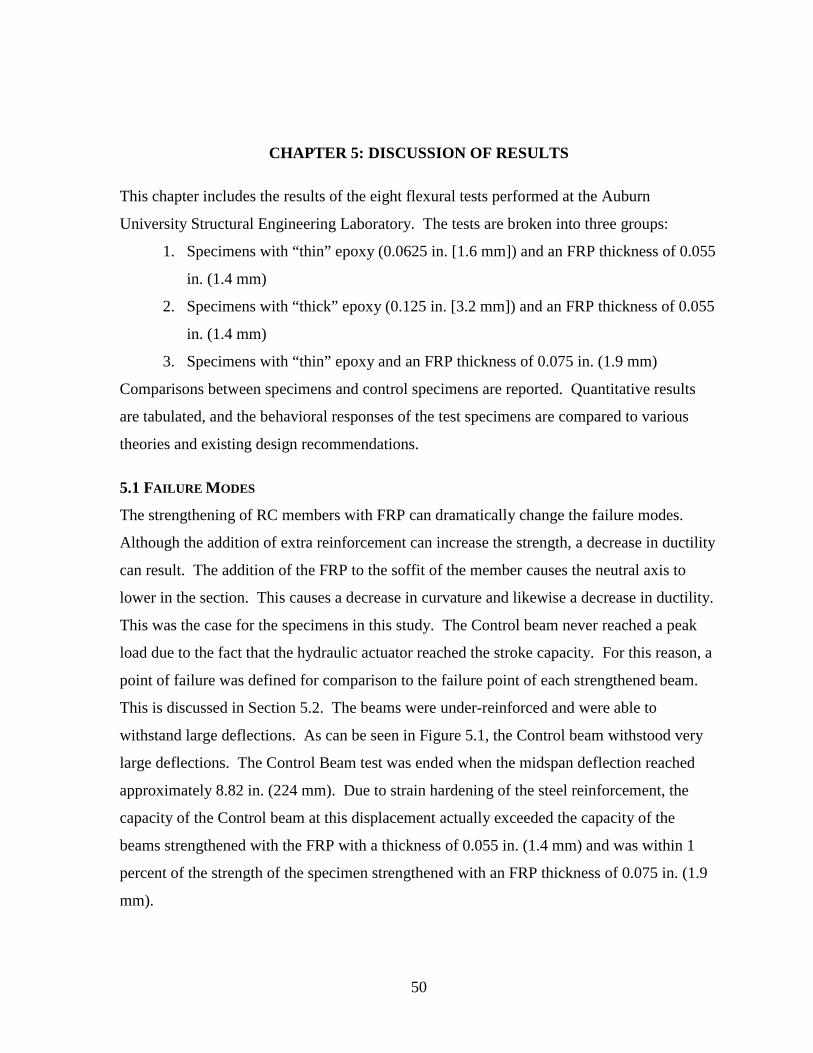
50
CHAPTER 5: DISCUSSION OF RESULTS
This chapter includes the results of the eight flexural tests performed at the Auburn
University Structural Engineering Laboratory. The tests are broken into three groups:
1. Specimens with “thin” epoxy (0.0625 in. [1.6 mm]) and an FRP thickness of 0.055
in. (1.4 mm)
2. Specimens with “thick” epoxy (0.125 in. [3.2 mm]) and an FRP thickness of 0.055
in. (1.4 mm)
3. Specimens with “thin” epoxy and an FRP thickness of 0.075 in. (1.9 mm)
Comparisons between specimens and control specimens are reported. Quantitative results
are tabulated, and the behavioral responses of the test specimens are compared to various
theories and existing design recommendations.
5.1 FAILURE MODES
The strengthening of RC members with FRP can dramatically change the failure modes.
Although the addition of extra reinforcement can increase the strength, a decrease in ductility
can result. The addition of the FRP to the soffit of the member causes the neutral axis to
lower in the section. This causes a decrease in curvature and likewise a decrease in ductility.
This was the case for the specimens in this study. The Control beam never reached a peak
load due to the fact that the hydraulic actuator reached the stroke capacity. For this reason, a
point of failure was defined for comparison to the failure point of each strengthened beam.
This is discussed in Section 5.2. The beams were under-reinforced and were able to
withstand large deflections. As can be seen in Figure 5.1, the Control beam withstood very
large deflections. The Control Beam test was ended when the midspan deflection reached
approximately 8.82 in. (224 mm). Due to strain hardening of the steel reinforcement, the
capacity of the Control beam at this displacement actually exceeded the capacity of the
beams strengthened with the FRP with a thickness of 0.055 in. (1.4 mm) and was within 1
percent of the strength of the specimen strengthened with an FRP thickness of 0.075 in. (1.9
mm).
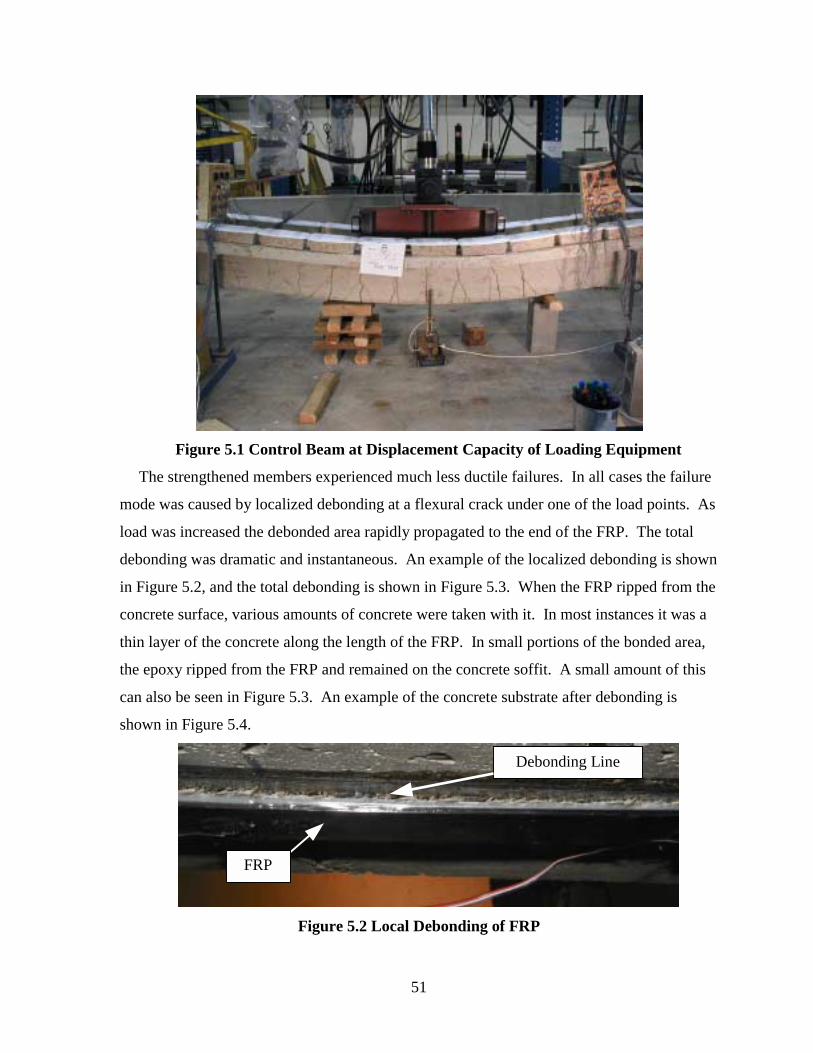
51
Figure 5.1 Control Beam at Displacement Capacity of Loading Equipment
The strengthened members experienced much less ductile failures. In all cases the failure
mode was caused by localized debonding at a flexural crack under one of the load points. As
load was increased the debonded area rapidly propagated to the end of the FRP. The total
debonding was dramatic and instantaneous. An example of the localized debonding is shown
in Figure 5.2, and the total debonding is shown in Figure 5.3. When the FRP ripped from the
concrete surface, various amounts of concrete were taken with it. In most instances it was a
thin layer of the concrete along the length of the FRP. In small portions of the bonded area,
the epoxy ripped from the FRP and remained on the concrete soffit. A small amount of this
can also be seen in Figure 5.3. An example of the concrete substrate after debonding is
shown in Figure 5.4.
Figure 5.2 Local Debonding of FRP
FRP
Debonding Line
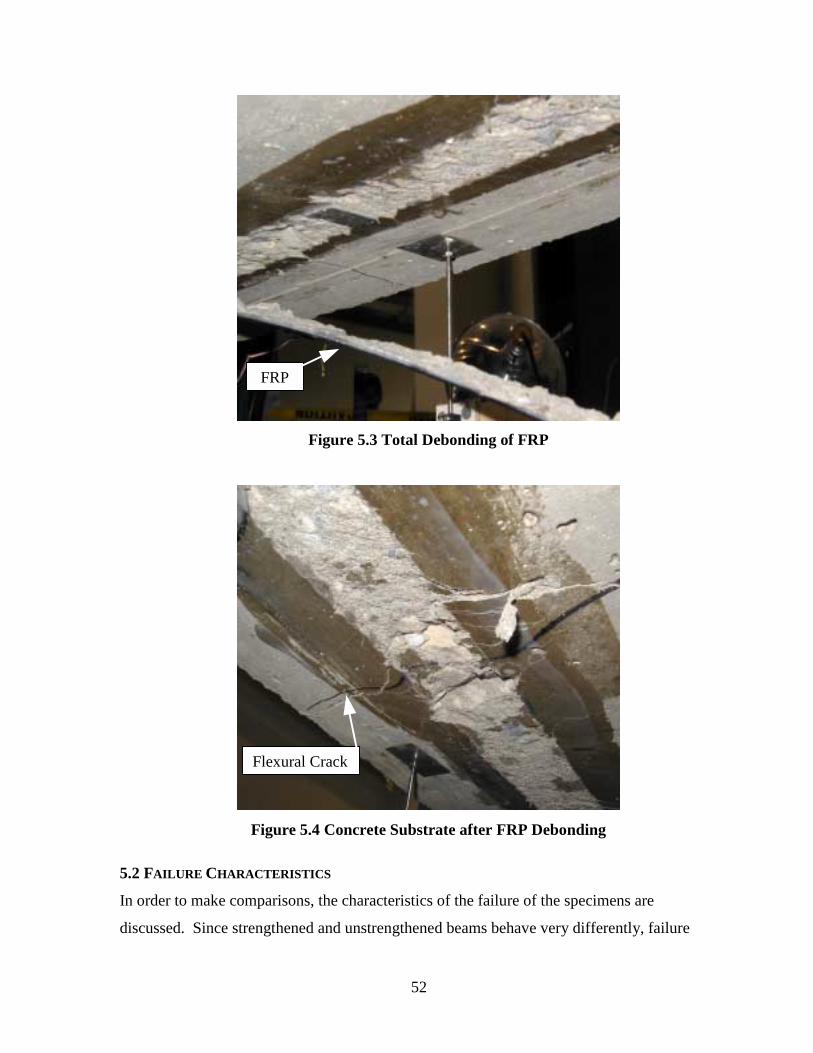
52
Figure 5.3 Total Debonding of FRP
Figure 5.4 Concrete Substrate after FRP Debonding
5.2 FAILURE CHARACTERISTICS
In order to make comparisons, the characteristics of the failure of the specimens are
discussed. Since strengthened and unstrengthened beams behave very differently, failure
FRP
Flexural Crack
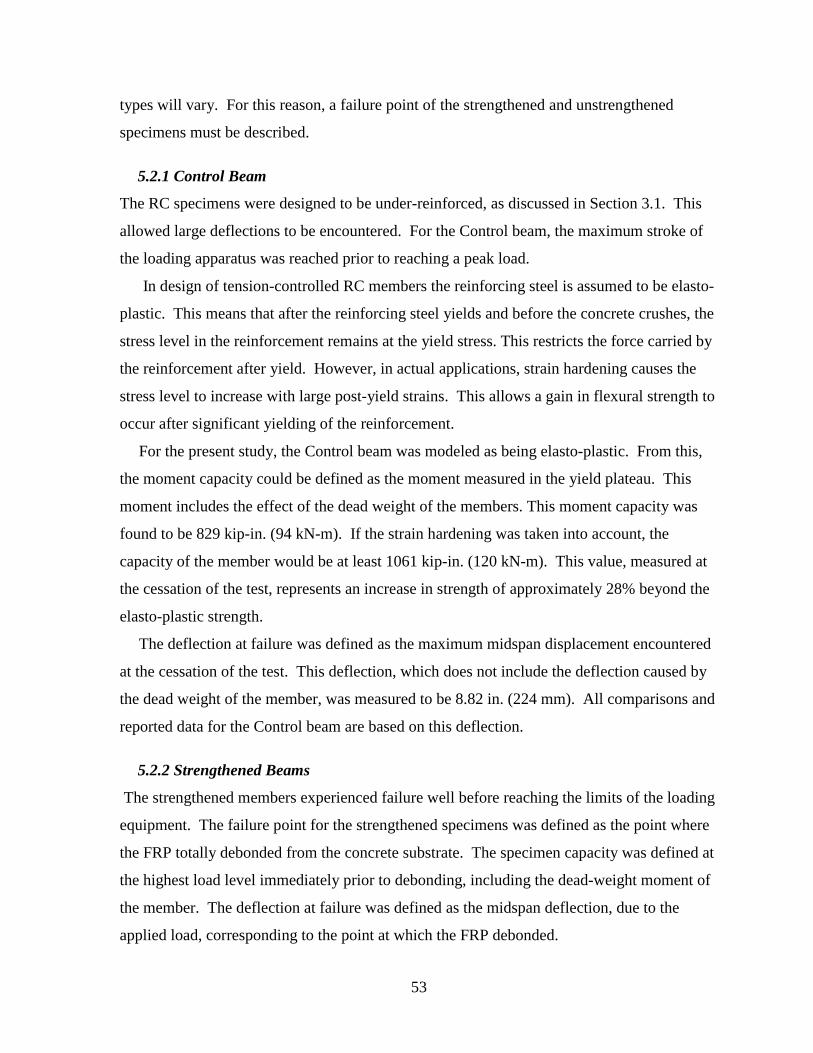
53
types will vary. For this reason, a failure point of the strengthened and unstrengthened
specimens must be described.
5.2.1 Control Beam
The RC specimens were designed to be under-reinforced, as discussed in Section 3.1. This
allowed large deflections to be encountered. For the Control beam, the maximum stroke of
the loading apparatus was reached prior to reaching a peak load.
In design of tension-controlled RC members the reinforcing steel is assumed to be elasto-
plastic. This means that after the reinforcing steel yields and before the concrete crushes, the
stress level in the reinforcement remains at the yield stress. This restricts the force carried by
the reinforcement after yield. However, in actual applications, strain hardening causes the
stress level to increase with large post-yield strains. This allows a gain in flexural strength to
occur after significant yielding of the reinforcement.
For the present study, the Control beam was modeled as being elasto-plastic. From this,
the moment capacity could be defined as the moment measured in the yield plateau. This
moment includes the effect of the dead weight of the members. This moment capacity was
found to be 829 kip-in. (94 kN-m). If the strain hardening was taken into account, the
capacity of the member would be at least 1061 kip-in. (120 kN-m). This value, measured at
the cessation of the test, represents an increase in strength of approximately 28% beyond the
elasto-plastic strength.
The deflection at failure was defined as the maximum midspan displacement encountered
at the cessation of the test. This deflection, which does not include the deflection caused by
the dead weight of the member, was measured to be 8.82 in. (224 mm). All comparisons and
reported data for the Control beam are based on this deflection.
5.2.2 Strengthened Beams
The strengthened members experienced failure well before reaching the limits of the loading
equipment. The failure point for the strengthened specimens was defined as the point where
the FRP totally debonded from the concrete substrate. The specimen capacity was defined at
the highest load level immediately prior to debonding, including the dead-weight moment of
the member. The deflection at failure was defined as the midspan deflection, due to the
applied load, corresponding to the point at which the FRP debonded.
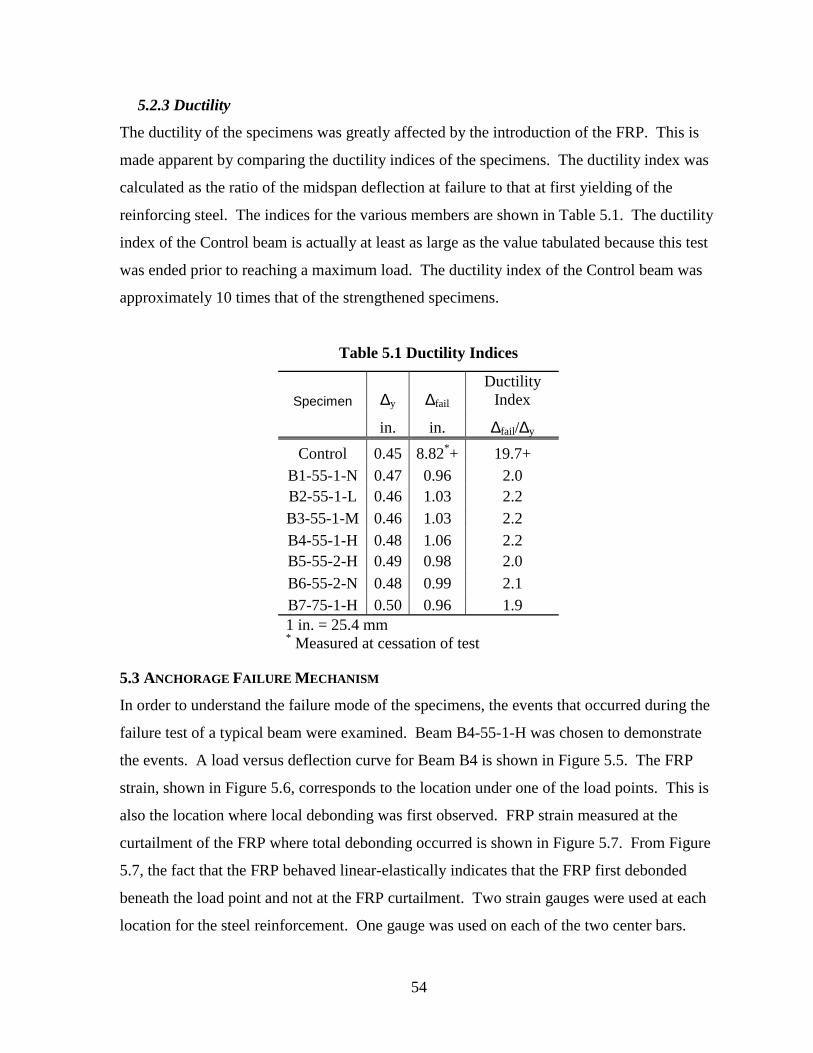
54
5.2.3 Ductility
The ductility of the specimens was greatly affected by the introduction of the FRP. This is
made apparent by comparing the ductility indices of the specimens. The ductility index was
calculated as the ratio of the midspan deflection at failure to that at first yielding of the
reinforcing steel. The indices for the various members are shown in Table 5.1. The ductility
index of the Control beam is actually at least as large as the value tabulated because this test
was ended prior to reaching a maximum load. The ductility index of the Control beam was
approximately 10 times that of the strengthened specimens.
Table 5.1 Ductility Indices
Specimen ∆y ∆fail Ductility
Index
in. in. ∆fail/∆y
Control 0.45 8.82*+ 19.7+ B1-55-1-N 0.47 0.96 2.0 B2-55-1-L 0.46 1.03 2.2 B3-55-1-M 0.46 1.03 2.2 B4-55-1-H 0.48 1.06 2.2 B5-55-2-H 0.49 0.98 2.0 B6-55-2-N 0.48 0.99 2.1 B7-75-1-H 0.50 0.96 1.9 1 in. = 25.4 mm * Measured at cessation of test
5.3 ANCHORAGE FAILURE MECHANISM
In order to understand the failure mode of the specimens, the events that occurred during the
failure test of a typical beam were examined. Beam B4-55-1-H was chosen to demonstrate
the events. A load versus deflection curve for Beam B4 is shown in Figure 5.5. The FRP
strain, shown in Figure 5.6, corresponds to the location under one of the load points. This is
also the location where local debonding was first observed. FRP strain measured at the
curtailment of the FRP where total debonding occurred is shown in Figure 5.7. From Figure
5.7, the fact that the FRP behaved linear-elastically indicates that the FRP first debonded
beneath the load point and not at the FRP curtailment. Two strain gauges were used at each
location for the steel reinforcement. One gauge was used on each of the two center bars.
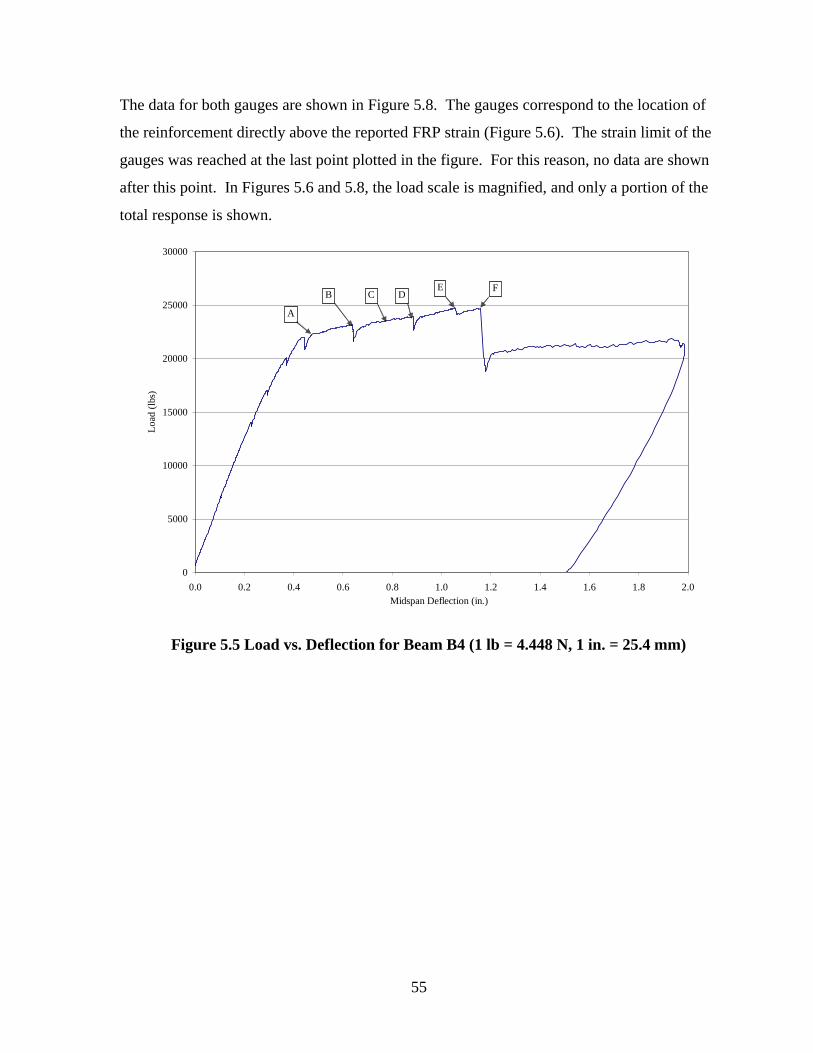
55
The data for both gauges are shown in Figure 5.8. The gauges correspond to the location of
the reinforcement directly above the reported FRP strain (Figure 5.6). The strain limit of the
gauges was reached at the last point plotted in the figure. For this reason, no data are shown
after this point. In Figures 5.6 and 5.8, the load scale is magnified, and only a portion of the
total response is shown.
0
5000
10000
15000
20000
25000
30000
0.0 0.2 0.4 0.6 0.8 1.0 1.2 1.4 1.6 1.8 2.0Midspan Deflection (in.)
Load
(lbs
)
A
EDCB
F
Figure 5.5 Load vs. Deflection for Beam B4 (1 lb = 4.448 N, 1 in. = 25.4 mm)
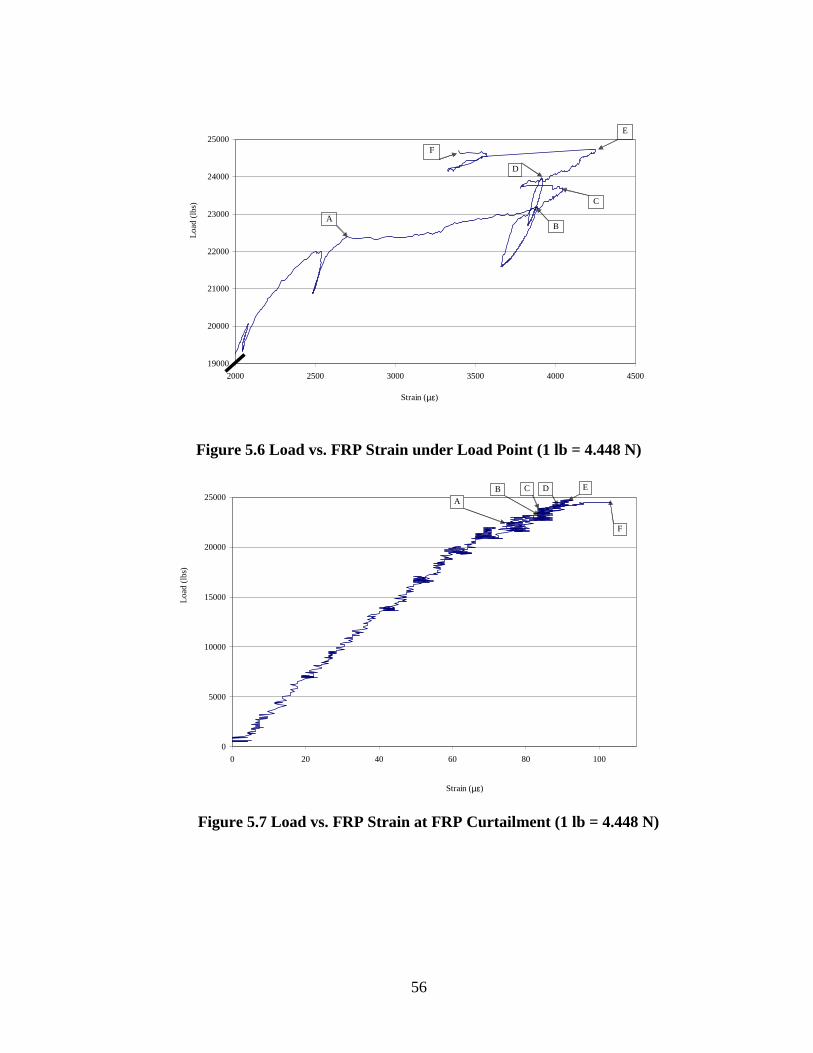
56
19000
20000
21000
22000
23000
24000
25000
2000 2500 3000 3500 4000 4500
Load
(lbs
)
Strain (µε)
AB
C
E
F
D
Figure 5.6 Load vs. FRP Strain under Load Point (1 lb = 4.448 N)
0
5000
10000
15000
20000
25000
0 20 40 60 80 100
Load
(lbs
)
Strain (µε)
AB C D E
F
Figure 5.7 Load vs. FRP Strain at FRP Curtailment (1 lb = 4.448 N)
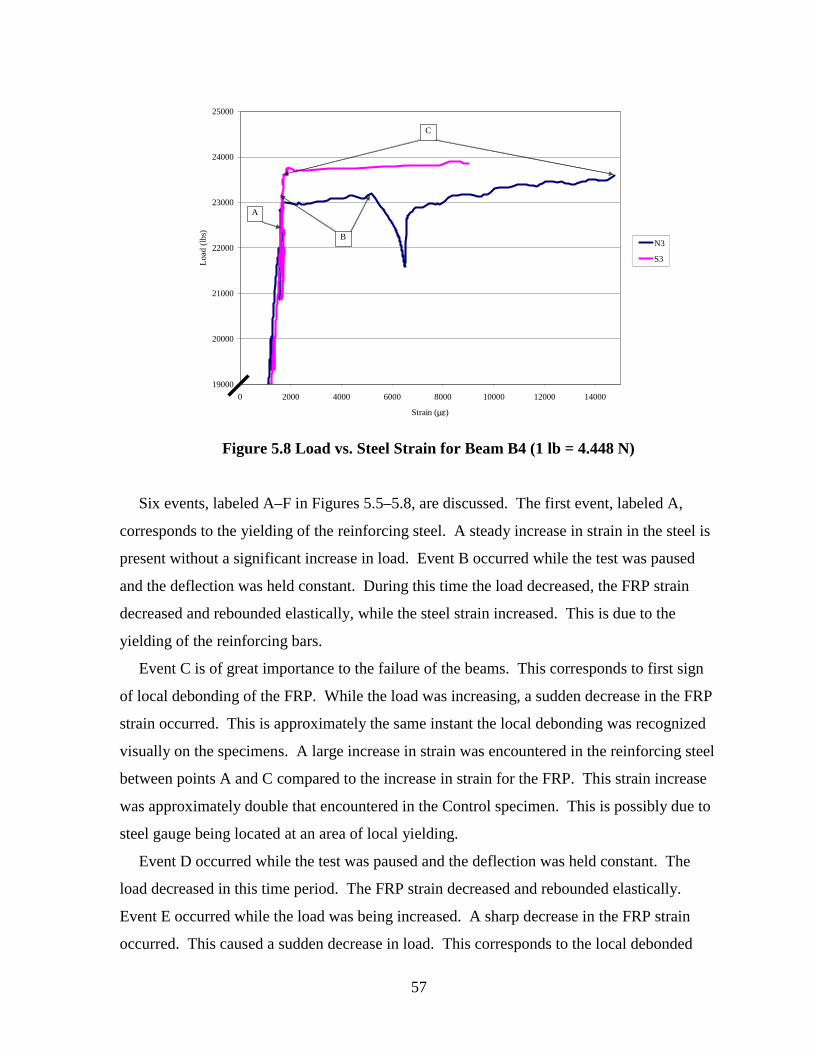
57
19000
20000
21000
22000
23000
24000
25000
0 2000 4000 6000 8000 10000 12000 14000
Strain (µε)
Load
(lbs
)
N3
S3
A
C
B
Figure 5.8 Load vs. Steel Strain for Beam B4 (1 lb = 4.448 N)
Six events, labeled A–F in Figures 5.5–5.8, are discussed. The first event, labeled A,
corresponds to the yielding of the reinforcing steel. A steady increase in strain in the steel is
present without a significant increase in load. Event B occurred while the test was paused
and the deflection was held constant. During this time the load decreased, the FRP strain
decreased and rebounded elastically, while the steel strain increased. This is due to the
yielding of the reinforcing bars.
Event C is of great importance to the failure of the beams. This corresponds to first sign
of local debonding of the FRP. While the load was increasing, a sudden decrease in the FRP
strain occurred. This is approximately the same instant the local debonding was recognized
visually on the specimens. A large increase in strain was encountered in the reinforcing steel
between points A and C compared to the increase in strain for the FRP. This strain increase
was approximately double that encountered in the Control specimen. This is possibly due to
steel gauge being located at an area of local yielding.
Event D occurred while the test was paused and the deflection was held constant. The
load decreased in this time period. The FRP strain decreased and rebounded elastically.
Event E occurred while the load was being increased. A sharp decrease in the FRP strain
occurred. This caused a sudden decrease in load. This corresponds to the local debonded
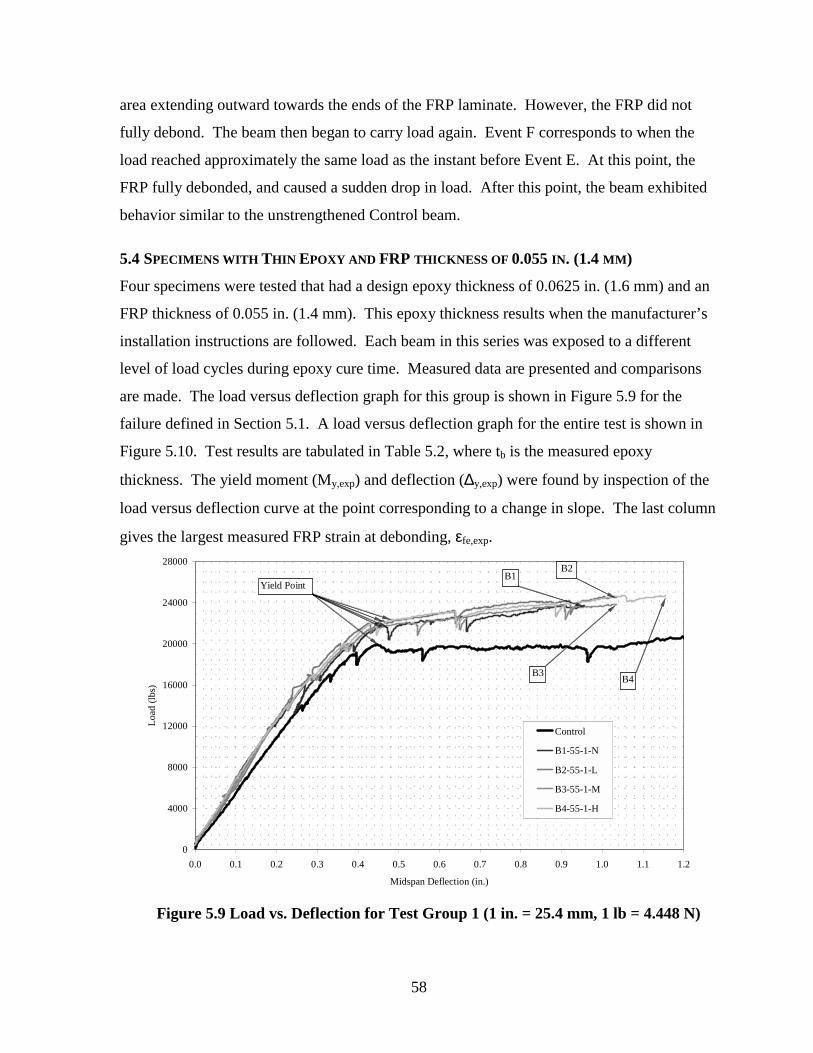
58
area extending outward towards the ends of the FRP laminate. However, the FRP did not
fully debond. The beam then began to carry load again. Event F corresponds to when the
load reached approximately the same load as the instant before Event E. At this point, the
FRP fully debonded, and caused a sudden drop in load. After this point, the beam exhibited
behavior similar to the unstrengthened Control beam.
5.4 SPECIMENS WITH THIN EPOXY AND FRP THICKNESS OF 0.055 IN. (1.4 MM)
Four specimens were tested that had a design epoxy thickness of 0.0625 in. (1.6 mm) and an
FRP thickness of 0.055 in. (1.4 mm). This epoxy thickness results when the manufacturer’s
installation instructions are followed. Each beam in this series was exposed to a different
level of load cycles during epoxy cure time. Measured data are presented and comparisons
are made. The load versus deflection graph for this group is shown in Figure 5.9 for the
failure defined in Section 5.1. A load versus deflection graph for the entire test is shown in
Figure 5.10. Test results are tabulated in Table 5.2, where tb is the measured epoxy
thickness. The yield moment (My,exp) and deflection (∆y,exp) were found by inspection of the
load versus deflection curve at the point corresponding to a change in slope. The last column
gives the largest measured FRP strain at debonding, εfe,exp.
0
4000
8000
12000
16000
20000
24000
28000
0.0 0.1 0.2 0.3 0.4 0.5 0.6 0.7 0.8 0.9 1.0 1.1 1.2
Midspan Deflection (in.)
Load
(lbs
)
Control
B1-55-1-N
B2-55-1-L
B3-55-1-M
B4-55-1-H
Yield PointB1
B4B3
B2
Figure 5.9 Load vs. Deflection for Test Group 1 (1 in. = 25.4 mm, 1 lb = 4.448 N)
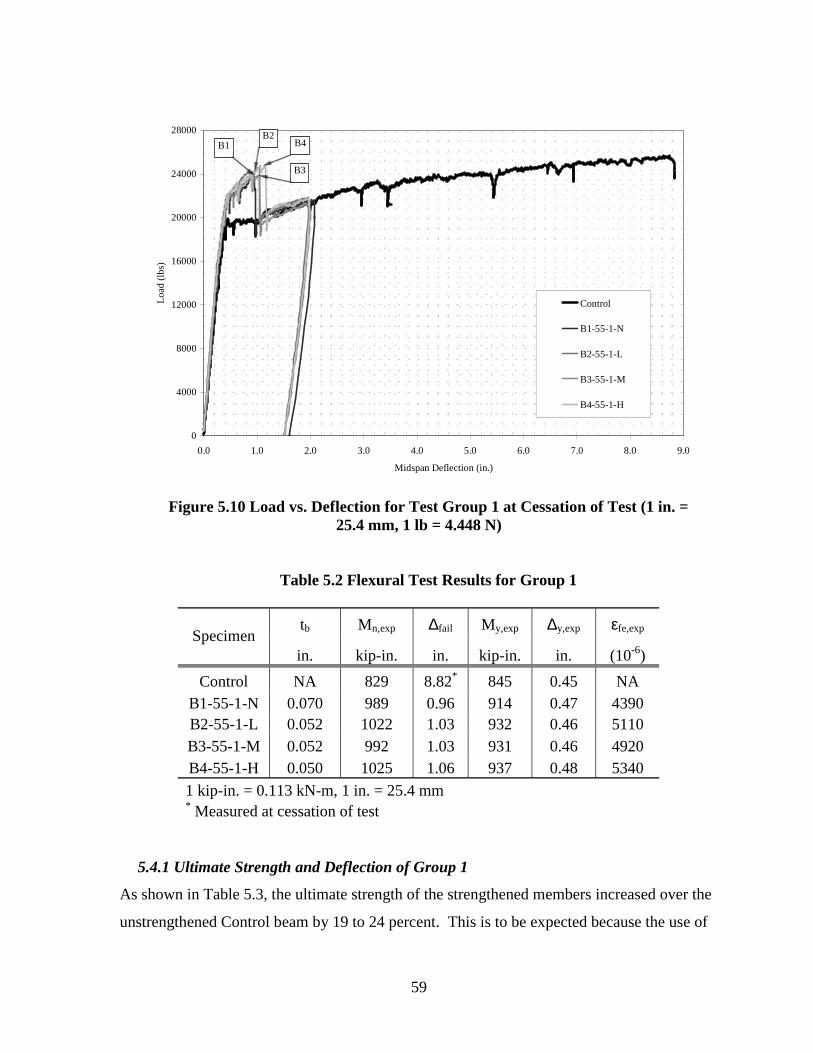
59
0
4000
8000
12000
16000
20000
24000
28000
0.0 1.0 2.0 3.0 4.0 5.0 6.0 7.0 8.0 9.0
Midspan Deflection (in.)
Load
(lbs
)
Control
B1-55-1-N
B2-55-1-L
B3-55-1-M
B4-55-1-H
B3
B4B2
B1
Figure 5.10 Load vs. Deflection for Test Group 1 at Cessation of Test (1 in. =
25.4 mm, 1 lb = 4.448 N)
Table 5.2 Flexural Test Results for Group 1
tb Mn,exp ∆fail My,exp ∆y,exp εfe,exp Specimen in. kip-in. in. kip-in. in. (10-6)
Control NA 829 8.82* 845 0.45 NA B1-55-1-N 0.070 989 0.96 914 0.47 4390 B2-55-1-L 0.052 1022 1.03 932 0.46 5110 B3-55-1-M 0.052 992 1.03 931 0.46 4920 B4-55-1-H 0.050 1025 1.06 937 0.48 5340 1 kip-in. = 0.113 kN-m, 1 in. = 25.4 mm * Measured at cessation of test
5.4.1 Ultimate Strength and Deflection of Group 1
As shown in Table 5.3, the ultimate strength of the strengthened members increased over the
unstrengthened Control beam by 19 to 24 percent. This is to be expected because the use of
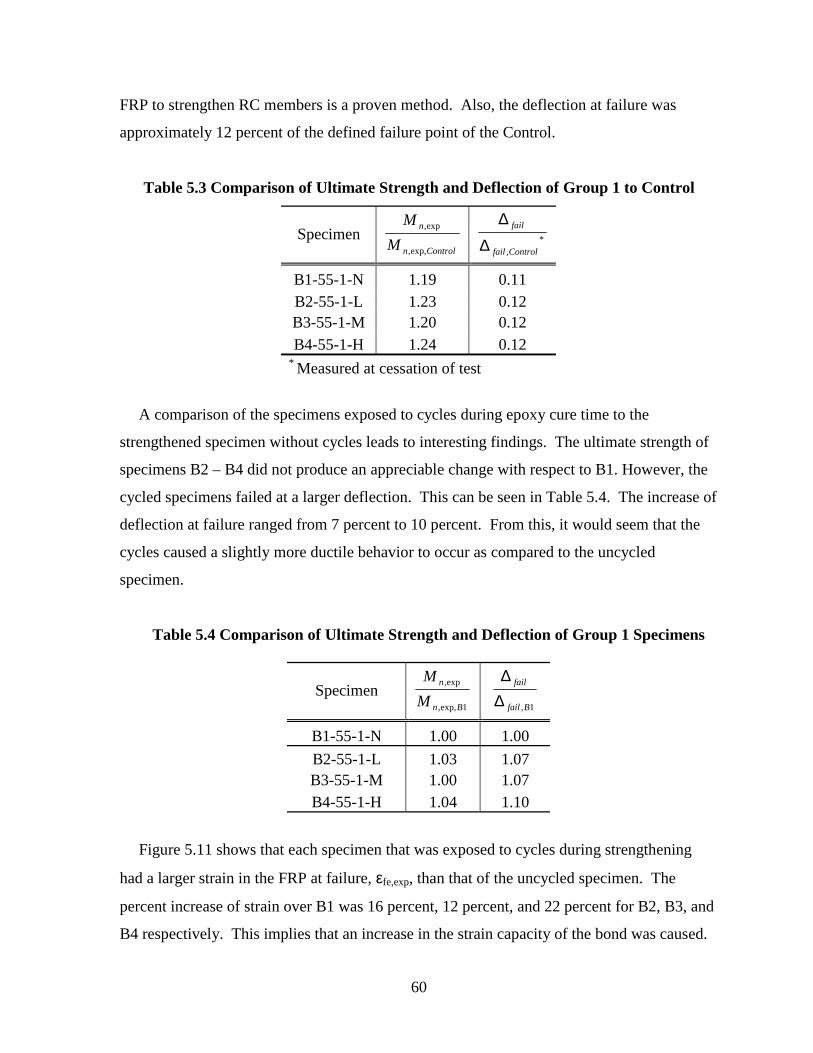
60
FRP to strengthen RC members is a proven method. Also, the deflection at failure was
approximately 12 percent of the defined failure point of the Control.
Table 5.3 Comparison of Ultimate Strength and Deflection of Group 1 to Control
Specimen Controln
n
MM
exp,,
exp, *,Controlfail
fail
∆
∆
B1-55-1-N 1.19 0.11 B2-55-1-L 1.23 0.12 B3-55-1-M 1.20 0.12 B4-55-1-H 1.24 0.12
* Measured at cessation of test
A comparison of the specimens exposed to cycles during epoxy cure time to the
strengthened specimen without cycles leads to interesting findings. The ultimate strength of
specimens B2 – B4 did not produce an appreciable change with respect to B1. However, the
cycled specimens failed at a larger deflection. This can be seen in Table 5.4. The increase of
deflection at failure ranged from 7 percent to 10 percent. From this, it would seem that the
cycles caused a slightly more ductile behavior to occur as compared to the uncycled
specimen.
Table 5.4 Comparison of Ultimate Strength and Deflection of Group 1 Specimens
Specimen 1exp,,
exp,
Bn
n
MM
1,Bfail
fail
∆∆
B1-55-1-N 1.00 1.00 B2-55-1-L 1.03 1.07 B3-55-1-M 1.00 1.07 B4-55-1-H 1.04 1.10
Figure 5.11 shows that each specimen that was exposed to cycles during strengthening
had a larger strain in the FRP at failure, εfe,exp, than that of the uncycled specimen. The
percent increase of strain over B1 was 16 percent, 12 percent, and 22 percent for B2, B3, and
B4 respectively. This implies that an increase in the strain capacity of the bond was caused.
61
Barnes and Mays (2002) encountered a strengthening of the bond when cycles were
introduced to test specimens. They theorized the strength gain was due to the fact that heat
produced from the testing equipment caused a better curing of the epoxy. However, the scale
of the specimens and the distance away from any heat sources would make this explanation
unlikely for the present study.
0
1000
2000
3000
4000
5000
6000
None (B1) Low (B2) Medium (B3) High (B4)
Level of Cycles on Epoxy
ε fe,e
xp ( µ
ε)
Figure 5.11 Comparison of Debonding Strain to Level of Epoxy Cycles for Group 1
5.4.2 Yield Moment and Deflection of Group 1
The moment corresponding to the yielding of the reinforcing steel followed a similar pattern
as the ultimate strength, as compared to the Control beam. The increase in yield moment
ranged from 8 percent to 11 percent. However, unlike the ultimate deflection, the deflection
at yield increased. The deflection increased over the Control by 3 to 8 percent. This can be
seen in Table 5.5.
Table 5.5 Comparison of Yield Strength and Deflection of Group 1 to Control
Specimen Controly
y
MM
,
Controly
y
,∆∆
B1-55-1-N 1.08 1.04 B2-55-1-L 1.10 1.03 B3-55-1-M 1.10 1.04 B4-55-1-H 1.11 1.08
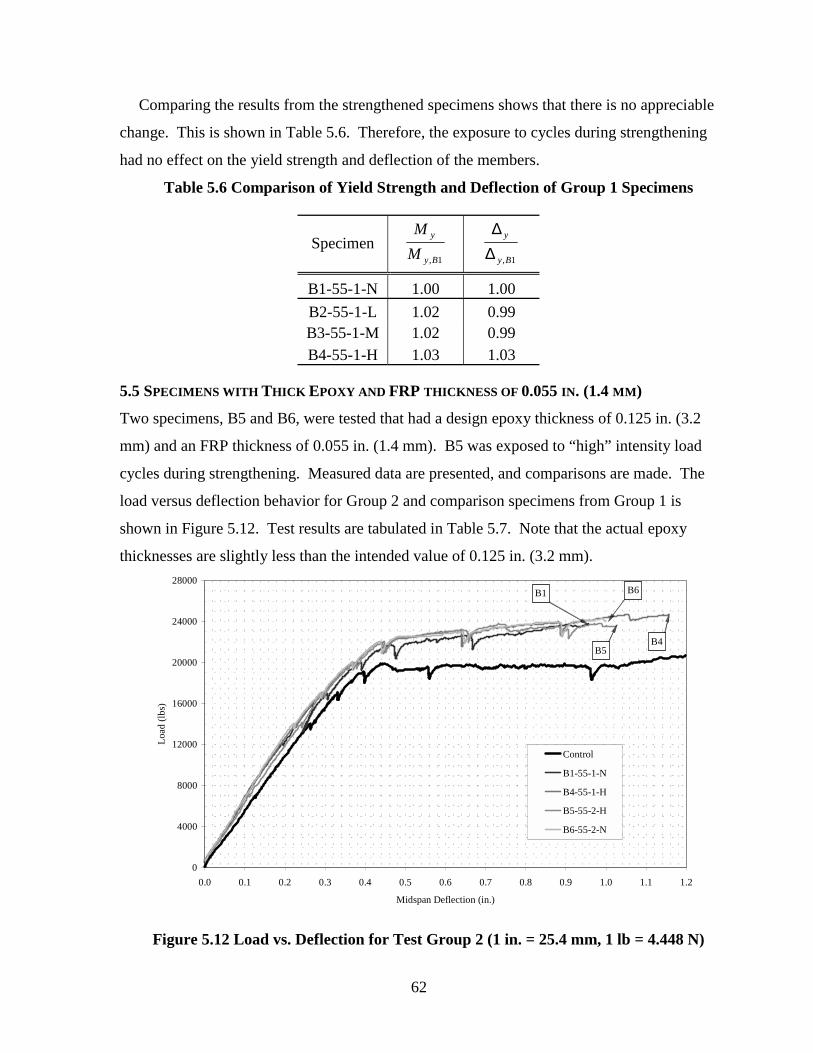
62
Comparing the results from the strengthened specimens shows that there is no appreciable
change. This is shown in Table 5.6. Therefore, the exposure to cycles during strengthening
had no effect on the yield strength and deflection of the members.
Table 5.6 Comparison of Yield Strength and Deflection of Group 1 Specimens
Specimen 1,By
y
MM
1,By
y
∆∆
B1-55-1-N 1.00 1.00 B2-55-1-L 1.02 0.99 B3-55-1-M 1.02 0.99 B4-55-1-H 1.03 1.03
5.5 SPECIMENS WITH THICK EPOXY AND FRP THICKNESS OF 0.055 IN. (1.4 MM)
Two specimens, B5 and B6, were tested that had a design epoxy thickness of 0.125 in. (3.2
mm) and an FRP thickness of 0.055 in. (1.4 mm). B5 was exposed to “high” intensity load
cycles during strengthening. Measured data are presented, and comparisons are made. The
load versus deflection behavior for Group 2 and comparison specimens from Group 1 is
shown in Figure 5.12. Test results are tabulated in Table 5.7. Note that the actual epoxy
thicknesses are slightly less than the intended value of 0.125 in. (3.2 mm).
0
4000
8000
12000
16000
20000
24000
28000
0.0 0.1 0.2 0.3 0.4 0.5 0.6 0.7 0.8 0.9 1.0 1.1 1.2
Midspan Deflection (in.)
Load
(lbs
)
Control
B1-55-1-N
B4-55-1-H
B5-55-2-H
B6-55-2-N
B1 B6
B5B4
Figure 5.12 Load vs. Deflection for Test Group 2 (1 in. = 25.4 mm, 1 lb = 4.448 N)
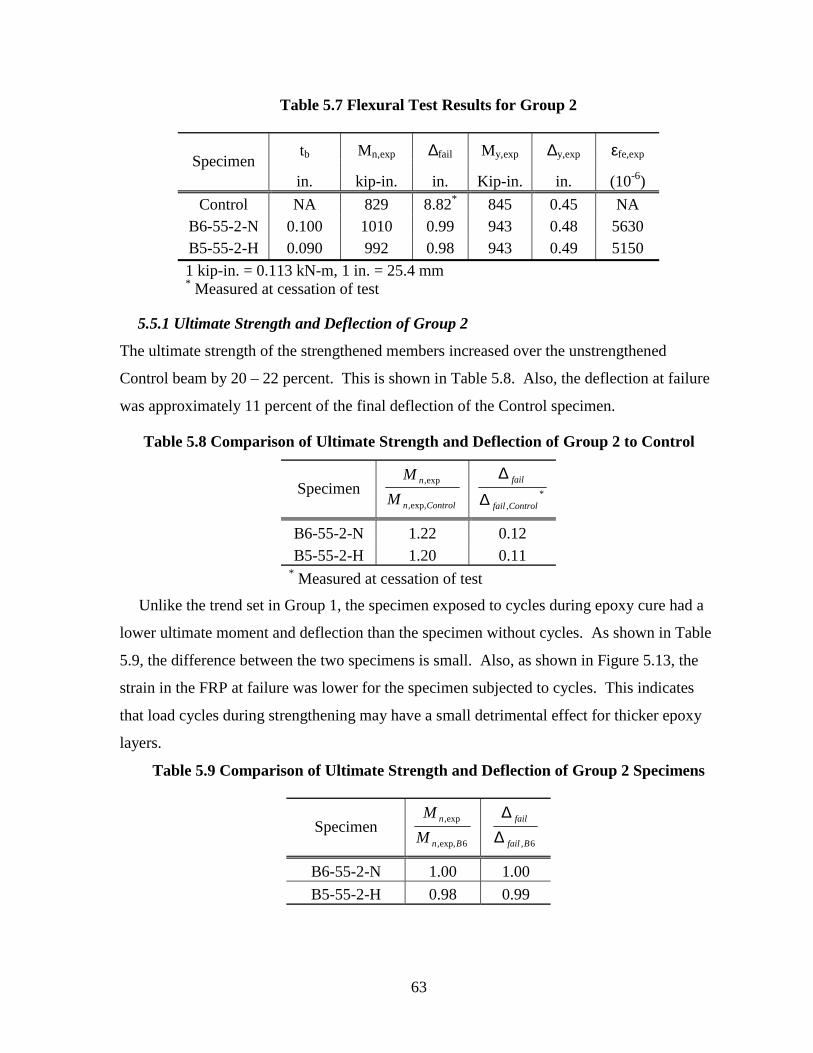
63
Table 5.7 Flexural Test Results for Group 2
tb Mn,exp ∆fail My,exp ∆y,exp εfe,exp Specimen in. kip-in. in. Kip-in. in. (10-6)
Control NA 829 8.82* 845 0.45 NA B6-55-2-N 0.100 1010 0.99 943 0.48 5630 B5-55-2-H 0.090 992 0.98 943 0.49 5150 1 kip-in. = 0.113 kN-m, 1 in. = 25.4 mm * Measured at cessation of test
5.5.1 Ultimate Strength and Deflection of Group 2
The ultimate strength of the strengthened members increased over the unstrengthened
Control beam by 20 – 22 percent. This is shown in Table 5.8. Also, the deflection at failure
was approximately 11 percent of the final deflection of the Control specimen.
Table 5.8 Comparison of Ultimate Strength and Deflection of Group 2 to Control
Specimen Controln
n
MM
exp,,
exp, *,Controlfail
fail
∆
∆
B6-55-2-N 1.22 0.12 B5-55-2-H 1.20 0.11
* Measured at cessation of test
Unlike the trend set in Group 1, the specimen exposed to cycles during epoxy cure had a
lower ultimate moment and deflection than the specimen without cycles. As shown in Table
5.9, the difference between the two specimens is small. Also, as shown in Figure 5.13, the
strain in the FRP at failure was lower for the specimen subjected to cycles. This indicates
that load cycles during strengthening may have a small detrimental effect for thicker epoxy
layers.
Table 5.9 Comparison of Ultimate Strength and Deflection of Group 2 Specimens
Specimen 6exp,,
exp,
Bn
n
MM
6,Bfail
fail
∆∆
B6-55-2-N 1.00 1.00 B5-55-2-H 0.98 0.99
64
0
1000
2000
3000
4000
5000
6000
None (B6) High (B5)
Level of Cycles on Epoxy
ε fe,
exp (
µε)
Figure 5.13 Comparison of Debonding Strain to Level of Epoxy Cycles
for Group 2
5.5.1.1 Performance of Thicker Epoxy
The specimens strengthened using a thick epoxy gave ultimate strengths and deflections in
between the specimens that had a thin epoxy and were exposed to the same loading
conditions. From Figure 5.12, the two specimens from Group 2 failed at a deflection
approximately equal to the average of the corresponding two specimens from Group 1. The
ultimate strength followed a similar trend. Researchers have suggested using thicker epoxy
as a means of improving bond strength because of the increased flexibility of the bond layer
(Harmon et al. 2003). However, from this study, it seems that the positive effects of the load
cycles on the thin epoxy overcome the advantages of using a thicker epoxy.
5.5.2 Yield Strength and Deflection of Group 2
The moment corresponding to the yielding of the reinforcing steel followed a similar pattern
as the ultimate strength, as compared to the Control beam. The increase in yield moment was
12 percent. The deflection at yield increased over the Control by 8 to 9 percent. This is
shown in Table 5.10.
65
Table 5.10 Comparison of Yield Strength and Deflection of Group 2 to Control
Specimen Controly
y
MM
,
Controly
y
,∆∆
B6-55-2-N 1.12 1.08 B5-55-2-H 1.12 1.09
Similar to the ultimate strength characteristics, the difference in the yield strength and
deflection was negligible for the specimen with applied cycles and the specimen without.
This is shown in Table 5.11.
Table 5.11 Comparison of Yield Strength and Deflection of Group 2
Specimen 6,By
y
MM
6,By
y
∆∆
B6-55-2-N 1.00 1.00 B5-55-2-H 1.00 1.01
5.6 SPECIMENS WITH THIN EPOXY AND FRP THICKNESS OF 0.075 IN. (1.9 MM)
One specimen was tested that had the manufacturer-recommended design epoxy thickness of
0.0625 in. (1.6 mm) and an FRP thickness of 0.075 in. (1.9 mm). The beam was exposed to
the high level of load cycles during strengthening. Measured data are presented, and
comparisons are made. Test results are tabulated in Table 5.12. The load versus deflection
behavior for the Group 3 specimen and the comparison specimen from Group 1 is shown in
Figure 5.14.
Table 5.12 Flexural Test Results for Group 3
tb Mn,exp ∆fail My,exp ∆y,exp εfe,exp Specimen in. kip-in. in. kip-in. in. (10-6)
Control NA 829 8.82* 845 0.45 NA B7-75-1-H 0.062 1060 0.96 957 0.50 4690 1 kip-in. = 0.113 kN-m, 1 in. = 25.4 mm * Measured at cessation of test
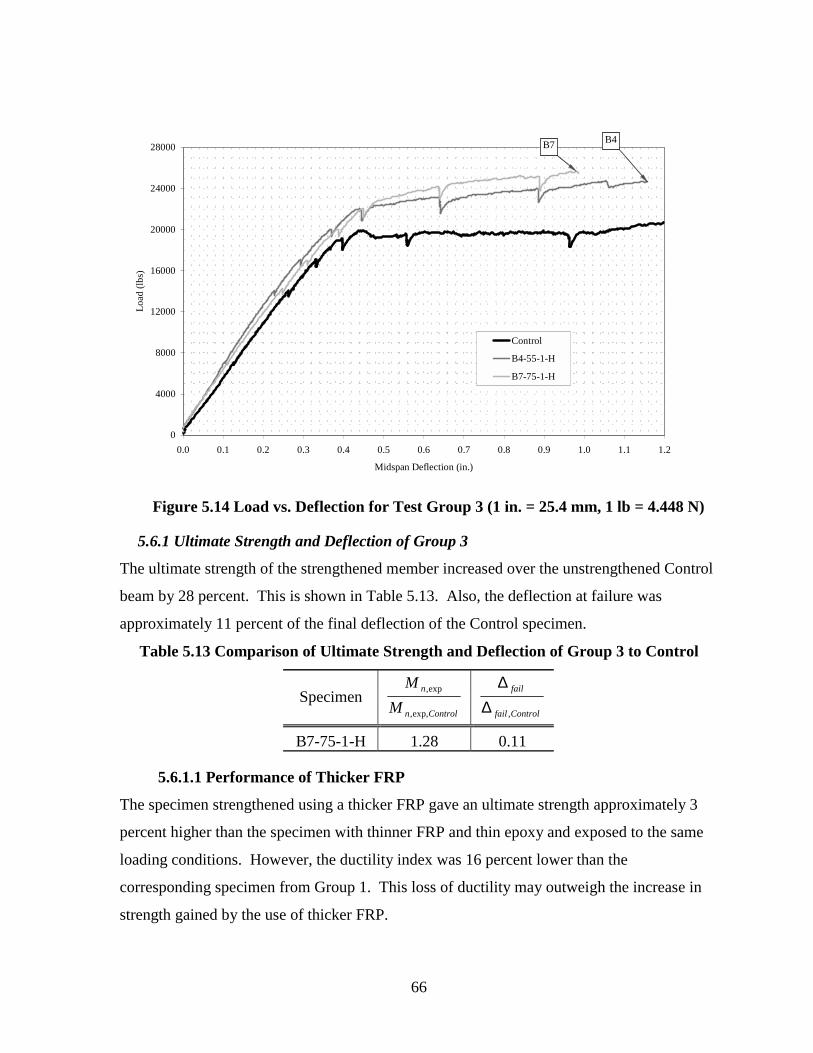
66
0
4000
8000
12000
16000
20000
24000
28000
0.0 0.1 0.2 0.3 0.4 0.5 0.6 0.7 0.8 0.9 1.0 1.1 1.2
Midspan Deflection (in.)
Load
(lbs
)
Control
B4-55-1-H
B7-75-1-H
B4B7
Figure 5.14 Load vs. Deflection for Test Group 3 (1 in. = 25.4 mm, 1 lb = 4.448 N)
5.6.1 Ultimate Strength and Deflection of Group 3
The ultimate strength of the strengthened member increased over the unstrengthened Control
beam by 28 percent. This is shown in Table 5.13. Also, the deflection at failure was
approximately 11 percent of the final deflection of the Control specimen.
Table 5.13 Comparison of Ultimate Strength and Deflection of Group 3 to Control
Specimen Controln
n
MM
exp,,
exp, Controlfail
fail
,∆∆
B7-75-1-H 1.28 0.11
5.6.1.1 Performance of Thicker FRP
The specimen strengthened using a thicker FRP gave an ultimate strength approximately 3
percent higher than the specimen with thinner FRP and thin epoxy and exposed to the same
loading conditions. However, the ductility index was 16 percent lower than the
corresponding specimen from Group 1. This loss of ductility may outweigh the increase in
strength gained by the use of thicker FRP.
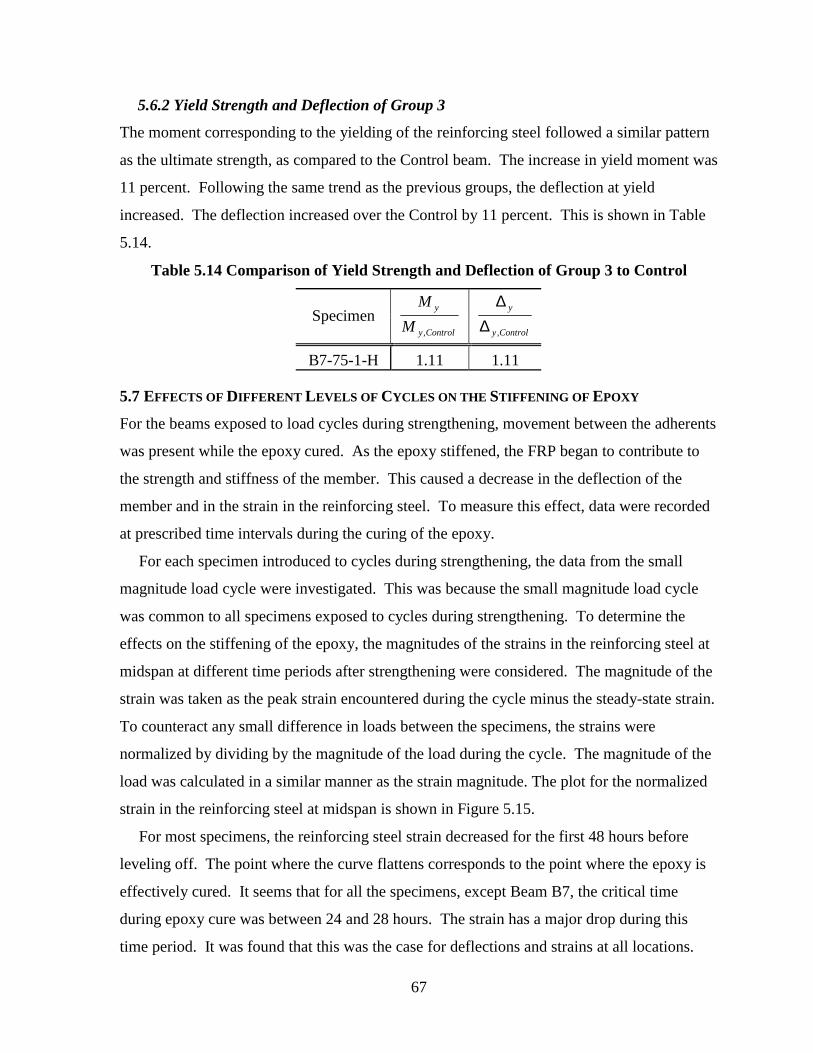
67
5.6.2 Yield Strength and Deflection of Group 3
The moment corresponding to the yielding of the reinforcing steel followed a similar pattern
as the ultimate strength, as compared to the Control beam. The increase in yield moment was
11 percent. Following the same trend as the previous groups, the deflection at yield
increased. The deflection increased over the Control by 11 percent. This is shown in Table
5.14.
Table 5.14 Comparison of Yield Strength and Deflection of Group 3 to Control
Specimen Controly
y
MM
,
Controly
y
,∆∆
B7-75-1-H 1.11 1.11
5.7 EFFECTS OF DIFFERENT LEVELS OF CYCLES ON THE STIFFENING OF EPOXY
For the beams exposed to load cycles during strengthening, movement between the adherents
was present while the epoxy cured. As the epoxy stiffened, the FRP began to contribute to
the strength and stiffness of the member. This caused a decrease in the deflection of the
member and in the strain in the reinforcing steel. To measure this effect, data were recorded
at prescribed time intervals during the curing of the epoxy.
For each specimen introduced to cycles during strengthening, the data from the small
magnitude load cycle were investigated. This was because the small magnitude load cycle
was common to all specimens exposed to cycles during strengthening. To determine the
effects on the stiffening of the epoxy, the magnitudes of the strains in the reinforcing steel at
midspan at different time periods after strengthening were considered. The magnitude of the
strain was taken as the peak strain encountered during the cycle minus the steady-state strain.
To counteract any small difference in loads between the specimens, the strains were
normalized by dividing by the magnitude of the load during the cycle. The magnitude of the
load was calculated in a similar manner as the strain magnitude. The plot for the normalized
strain in the reinforcing steel at midspan is shown in Figure 5.15.
For most specimens, the reinforcing steel strain decreased for the first 48 hours before
leveling off. The point where the curve flattens corresponds to the point where the epoxy is
effectively cured. It seems that for all the specimens, except Beam B7, the critical time
during epoxy cure was between 24 and 28 hours. The strain has a major drop during this
time period. It was found that this was the case for deflections and strains at all locations.
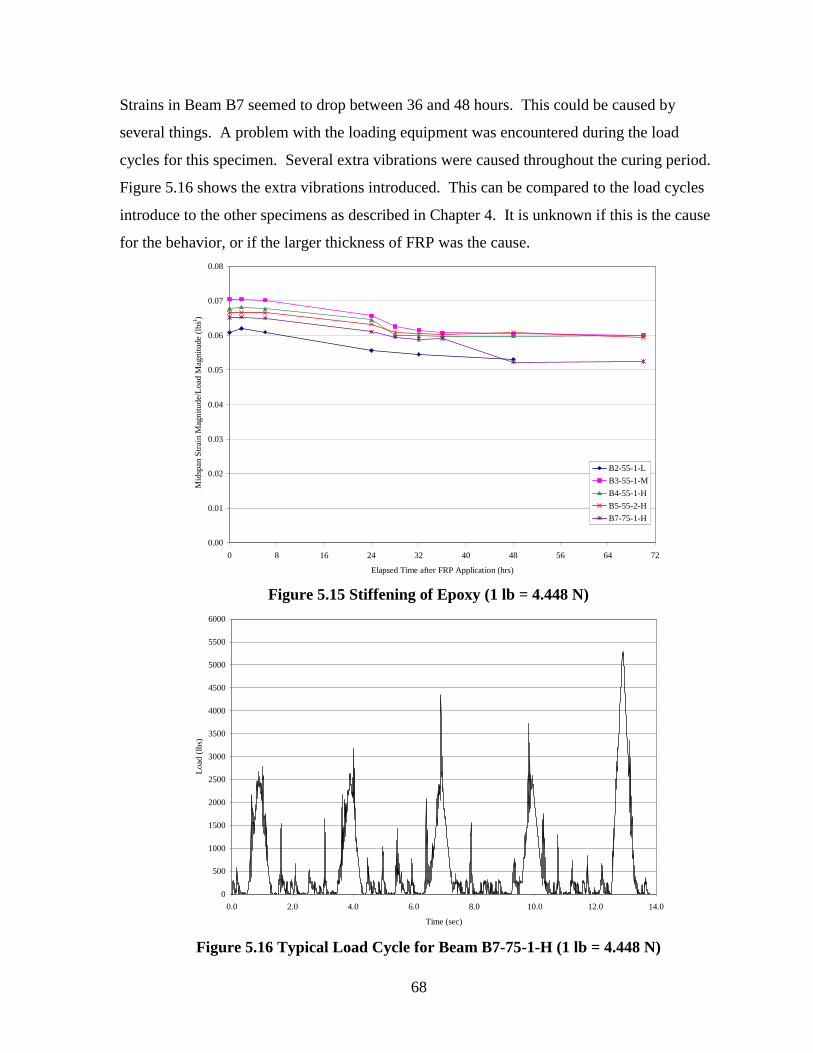
68
Strains in Beam B7 seemed to drop between 36 and 48 hours. This could be caused by
several things. A problem with the loading equipment was encountered during the load
cycles for this specimen. Several extra vibrations were caused throughout the curing period.
Figure 5.16 shows the extra vibrations introduced. This can be compared to the load cycles
introduce to the other specimens as described in Chapter 4. It is unknown if this is the cause
for the behavior, or if the larger thickness of FRP was the cause.
0.00
0.01
0.02
0.03
0.04
0.05
0.06
0.07
0.08
0 8 16 24 32 40 48 56 64 72
Elapsed Time after FRP Application (hrs)
Mid
span
Stra
in M
agni
tude
/Loa
d M
agni
tude
(lbs-1
)
B2-55-1-LB3-55-1-MB4-55-1-HB5-55-2-HB7-75-1-H
Figure 5.15 Stiffening of Epoxy (1 lb = 4.448 N)
0
500
1000
1500
2000
2500
3000
3500
4000
4500
5000
5500
6000
0.0 2.0 4.0 6.0 8.0 10.0 12.0 14.0
Time (sec)
Load
(lbs
)
Figure 5.16 Typical Load Cycle for Beam B7-75-1-H (1 lb = 4.448 N)
69
5.8 THEORETICAL RESULTS
Various theories exist for the design of FRP-strengthened RC members. Three theories are
compared to the results found in this experimental study. These include concepts published
in the ACI 440.2R-02 design guide and studies performed by De Lorenzis et al. (2001) and
Harmon et al. (2003).
5.8.1 Limiting Strain
To prevent debonding of the FRP from the concrete substrate, the strain in the FRP should be
limited to a particular value. However, there are disagreements on how this limiting strain
should be calculated. In all three theories, it is agreed upon that the limiting strain should be
inversely related to the stiffness of the FRP, but other factors that should be included are
disagreed upon. For the debonding failure, the ACI 440 report uses a factor that was derived
from experimental studies and includes only the FRP stiffness per bonded width as a
variable. De Lorenzis et al. (2001) include the fracture energy of the bond layer into a
simplified equation for calculating a reduction factor. Harmon et al. propose that the limiting
strain should take into account the properties of the bond layer, the concrete strength, the
FRP stiffness, and the extent of flexural cracking, as well as the shear and bending moments
at critical sections.
Figure 5.17 shows the largest strain in the FRP at the point of debonding found in the
experimental study and those calculated using the various theories. The ACI-440.2R-02
strain was calculated using Equation 2.1. The strains corresponding to the theory by De
Lorenzis et al. were calculated using Equations 2.3 and 2.5. Equation 2.6 was used for the
theory by Harmon et al.
The strain in the FRP at debonding for the experimental specimens never reached the
strains prescribed by the ACI 440 method. The experimental values were from 65 to 84
percent of the ACI strains for the FRP with a thickness of 0.055 in. (1.4 mm), and 95 percent
for an FRP thickness of 0.075 in (1.9 mm). From this, it would seem that the method
proposed by ACI is unsafe for use with the material used in this study. On the other hand,
the theory proposed by Harmon et al. was extremely conservative. The experimental strains
were 3 to 3.8 times the theoretical strains. The values calculated from De Lorenzis et al.
ranged from 61 to 79 percent of the experimental values. These values are also considered
conservative.
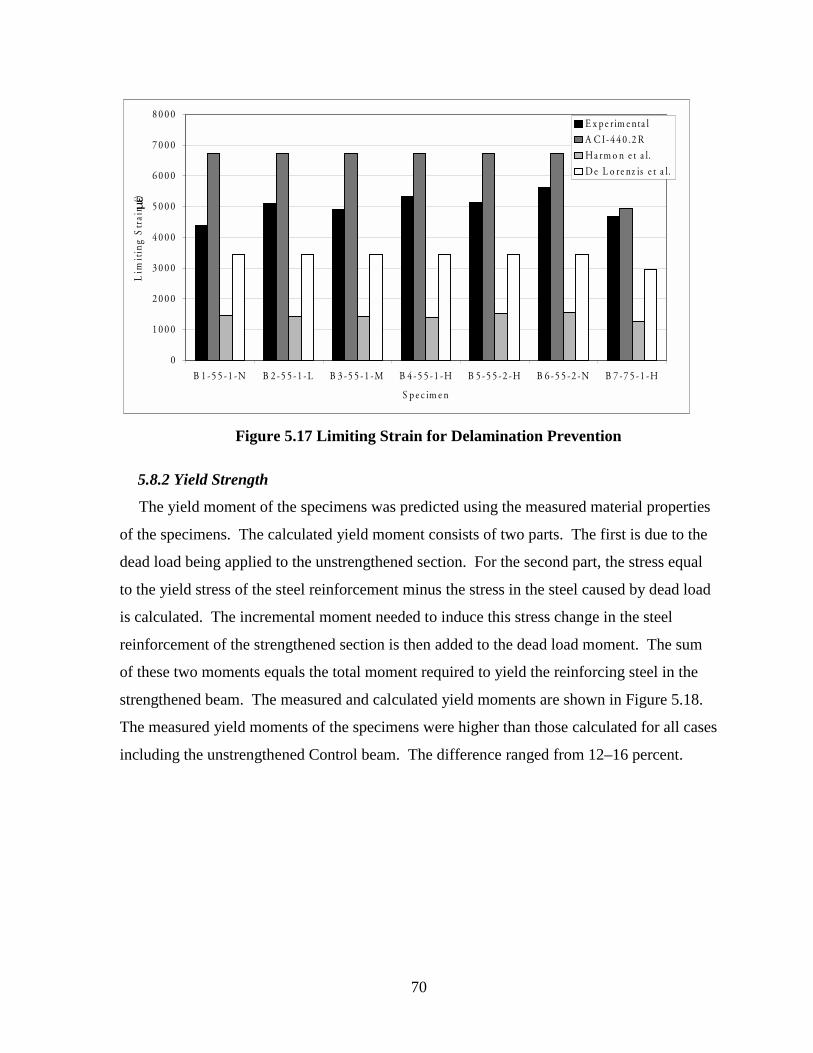
70
0
1 0 0 0
2 0 0 0
3 0 0 0
4 0 0 0
5 0 0 0
6 0 0 0
7 0 0 0
8 0 0 0
B 1 -5 5 -1 -N B 2 -5 5 -1 -L B 3 -5 5 -1 -M B 4 -5 5 -1 -H B 5 -5 5 -2 -H B 6 -5 5 -2 -N B 7 -7 5 -1 -H
S p e c im e n
Lim
itin
g S
trai
n ( µε
)E x p e r im e nta l
A C I-4 4 0 .2 R
Ha rm o n e t a l.
D e L o re nz is e t a l.
Figure 5.17 Limiting Strain for Delamination Prevention
5.8.2 Yield Strength
The yield moment of the specimens was predicted using the measured material properties
of the specimens. The calculated yield moment consists of two parts. The first is due to the
dead load being applied to the unstrengthened section. For the second part, the stress equal
to the yield stress of the steel reinforcement minus the stress in the steel caused by dead load
is calculated. The incremental moment needed to induce this stress change in the steel
reinforcement of the strengthened section is then added to the dead load moment. The sum
of these two moments equals the total moment required to yield the reinforcing steel in the
strengthened beam. The measured and calculated yield moments are shown in Figure 5.18.
The measured yield moments of the specimens were higher than those calculated for all cases
including the unstrengthened Control beam. The difference ranged from 12–16 percent.
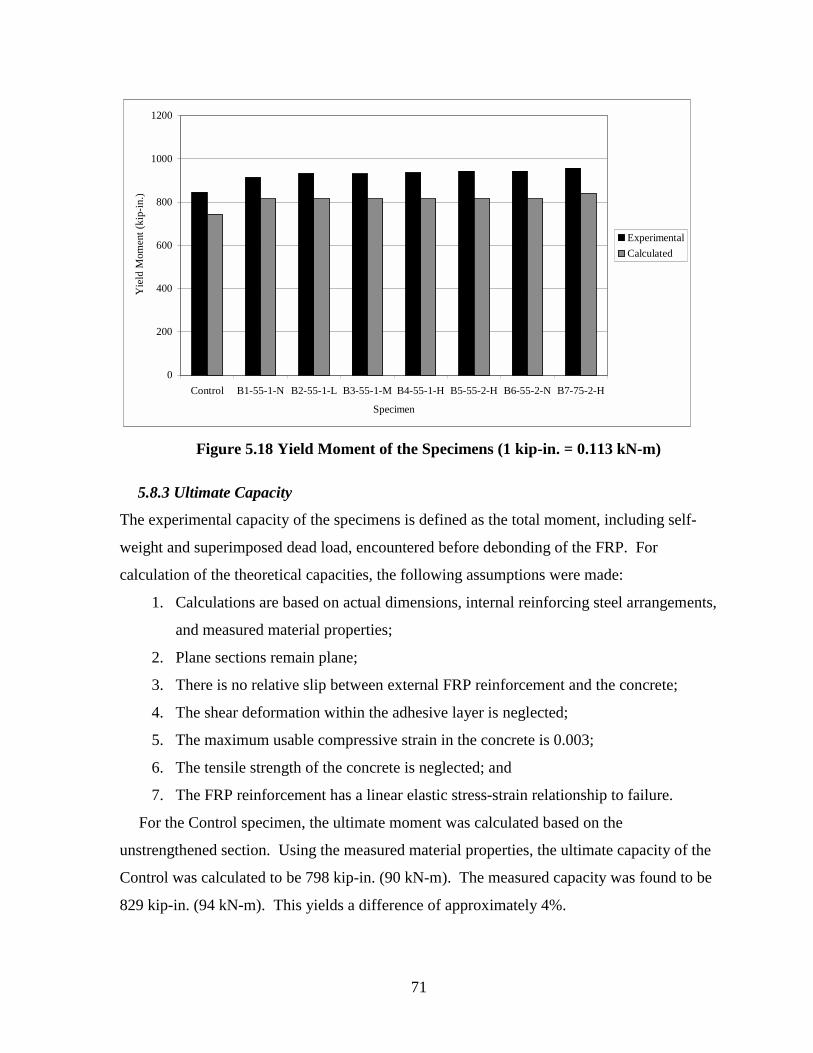
71
0
200
400
600
800
1000
1200
Control B1-55-1-N B2-55-1-L B3-55-1-M B4-55-1-H B5-55-2-H B6-55-2-N B7-75-2-H
Specimen
Yie
ld M
omen
t (ki
p-in
.)
ExperimentalCalculated
Figure 5.18 Yield Moment of the Specimens (1 kip-in. = 0.113 kN-m)
5.8.3 Ultimate Capacity
The experimental capacity of the specimens is defined as the total moment, including self-
weight and superimposed dead load, encountered before debonding of the FRP. For
calculation of the theoretical capacities, the following assumptions were made:
1. Calculations are based on actual dimensions, internal reinforcing steel arrangements,
and measured material properties;
2. Plane sections remain plane;
3. There is no relative slip between external FRP reinforcement and the concrete;
4. The shear deformation within the adhesive layer is neglected;
5. The maximum usable compressive strain in the concrete is 0.003;
6. The tensile strength of the concrete is neglected; and
7. The FRP reinforcement has a linear elastic stress-strain relationship to failure.
For the Control specimen, the ultimate moment was calculated based on the
unstrengthened section. Using the measured material properties, the ultimate capacity of the
Control was calculated to be 798 kip-in. (90 kN-m). The measured capacity was found to be
829 kip-in. (94 kN-m). This yields a difference of approximately 4%.
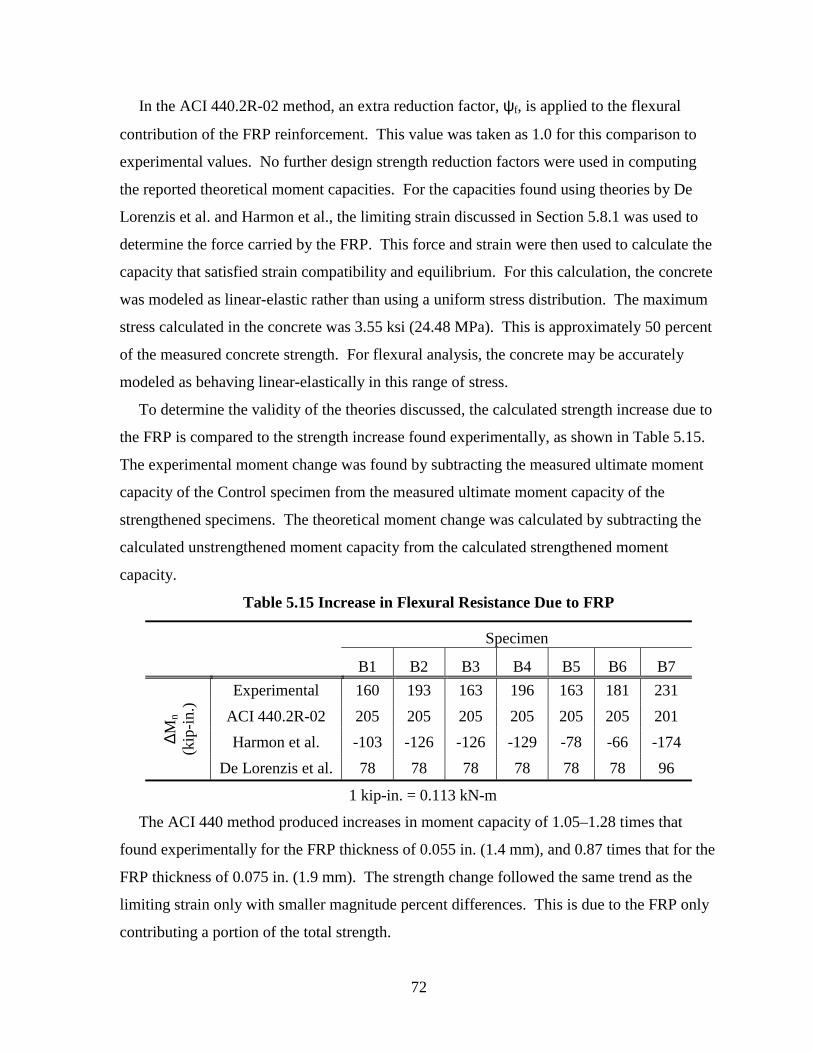
72
In the ACI 440.2R-02 method, an extra reduction factor, ψf, is applied to the flexural
contribution of the FRP reinforcement. This value was taken as 1.0 for this comparison to
experimental values. No further design strength reduction factors were used in computing
the reported theoretical moment capacities. For the capacities found using theories by De
Lorenzis et al. and Harmon et al., the limiting strain discussed in Section 5.8.1 was used to
determine the force carried by the FRP. This force and strain were then used to calculate the
capacity that satisfied strain compatibility and equilibrium. For this calculation, the concrete
was modeled as linear-elastic rather than using a uniform stress distribution. The maximum
stress calculated in the concrete was 3.55 ksi (24.48 MPa). This is approximately 50 percent
of the measured concrete strength. For flexural analysis, the concrete may be accurately
modeled as behaving linear-elastically in this range of stress.
To determine the validity of the theories discussed, the calculated strength increase due to
the FRP is compared to the strength increase found experimentally, as shown in Table 5.15.
The experimental moment change was found by subtracting the measured ultimate moment
capacity of the Control specimen from the measured ultimate moment capacity of the
strengthened specimens. The theoretical moment change was calculated by subtracting the
calculated unstrengthened moment capacity from the calculated strengthened moment
capacity.
Table 5.15 Increase in Flexural Resistance Due to FRP
Specimen
B1 B2 B3 B4 B5 B6 B7 Experimental 160 193 163 196 163 181 231
ACI 440.2R-02 205 205 205 205 205 205 201 Harmon et al. -103 -126 -126 -129 -78 -66 -174 ∆M
n
(k
ip-in
.)
De Lorenzis et al. 78 78 78 78 78 78 96
1 kip-in. = 0.113 kN-m
The ACI 440 method produced increases in moment capacity of 1.05–1.28 times that
found experimentally for the FRP thickness of 0.055 in. (1.4 mm), and 0.87 times that for the
FRP thickness of 0.075 in. (1.9 mm). The strength change followed the same trend as the
limiting strain only with smaller magnitude percent differences. This is due to the FRP only
contributing a portion of the total strength.
73
The Harmon et al. method gave smaller capacities for the strengthened specimens than the
unstrengthened. This is due to the severe restrictions on the limiting strains calculated under
this method. According to this method, the FRP debonds before the reinforcing steel yields.
Thus, the FRP would debond from the concrete substrate well before reaching the capacity of
the unstrengthened member. The member would still eventually reach the capacity of the
unstrengthened member, but the FRP would have already debonded. The De Lorenzis et al.
method gave conservative increases in strength gain.
Figure 5.19 shows the measured capacity of the specimens, as well as the moment
capacities found using the various theories. In most cases, the theoretical capacity of the
specimens was conservative. The theoretical capacities that exceeded the values calculated
using experimental values were within 2 percent of the experimental values. For the
specimens with an FRP thickness of 0.055 in. (1.2 mm), the ACI 440 method gave results
that ranged within 2 percent of the experimental values. However, for the specimen with an
FRP thickness of 0.075 in. (1.9 mm), the ACI 440 method underestimated the experimental
by approximately 6 percent. Using the ACI 440 method, the capacity for the two thicknesses
of FRP is approximately the same. This is due to the method basing the limiting strain on the
stiffness of the FRP. The extra reduction in strength of the thicker FRP, due to the added
stiffness, offsets the larger amount of force the thicker FRP can carry. This produces a larger
reduction in design strength.
The capacities found using both De Lorenzis et al. and Harmon et al. followed the same
trend as did the limiting strain. The experimental capacities were 1.13 to 1.19 times and 1.38
to 1.70 times the theoretical values of the De Lorenzis et al. and Harmon et al., respectively.
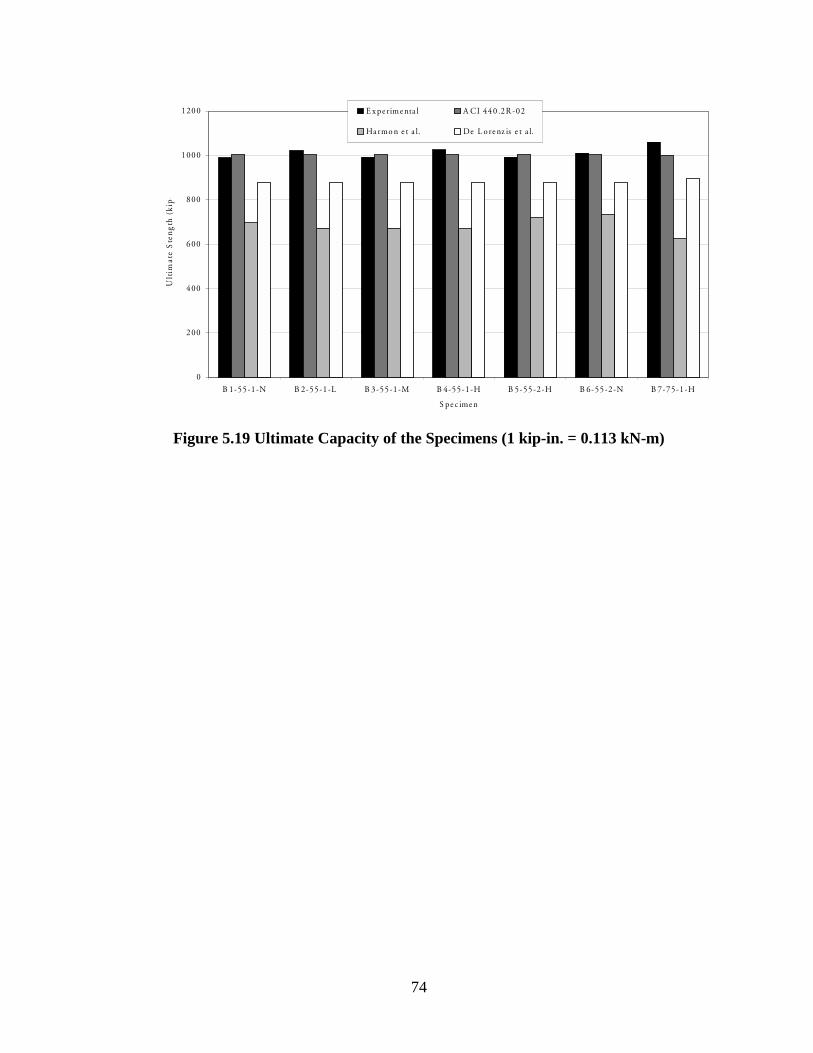
74
0
200
400
600
800
1000
1200
B 1-55-1-N B 2-55-1-L B 3-55-1-M B 4-55-1-H B 5-55-2-H B 6-55-2-N B 7-75-1-H
S pe c ime n
Ult
imat
e S
ten
gth
(k
ip-
E x pe rime nta l A CI 440 .2R -02
Ha rmo n e t a l. De L o re nz is e t a l.
Figure 5.19 Ultimate Capacity of the Specimens (1 kip-in. = 0.113 kN-m)
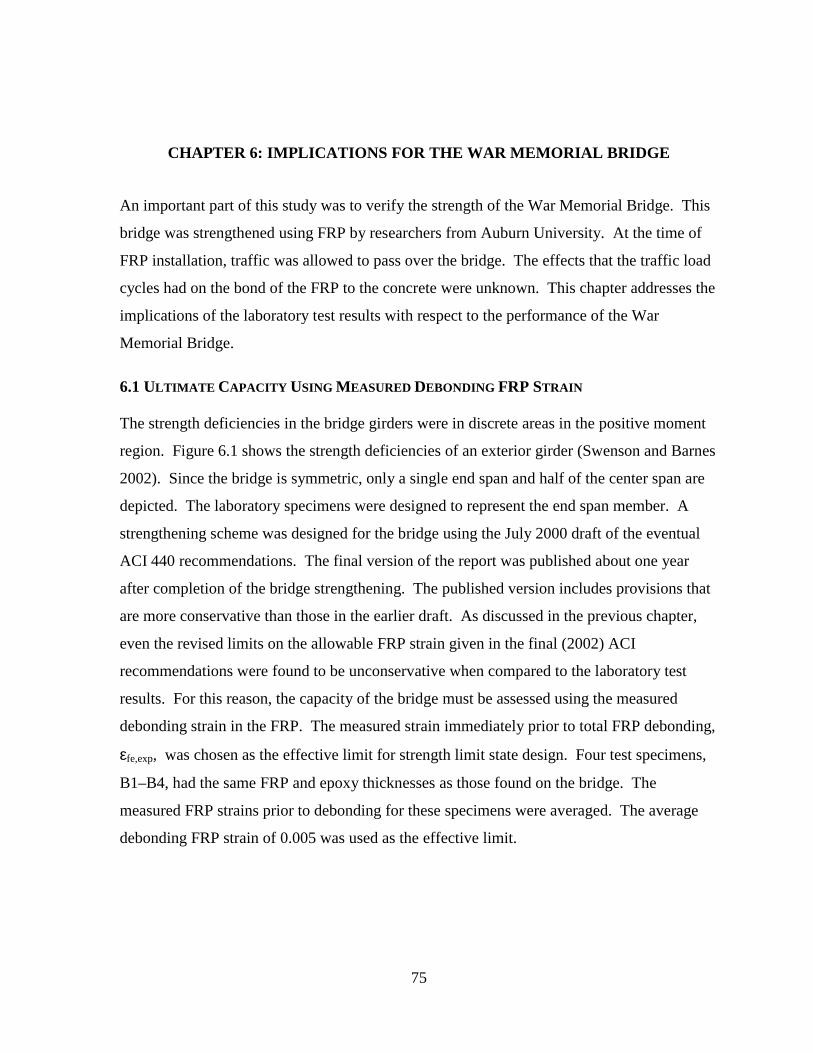
75
CHAPTER 6: IMPLICATIONS FOR THE WAR MEMORIAL BRIDGE
An important part of this study was to verify the strength of the War Memorial Bridge. This
bridge was strengthened using FRP by researchers from Auburn University. At the time of
FRP installation, traffic was allowed to pass over the bridge. The effects that the traffic load
cycles had on the bond of the FRP to the concrete were unknown. This chapter addresses the
implications of the laboratory test results with respect to the performance of the War
Memorial Bridge.
6.1 ULTIMATE CAPACITY USING MEASURED DEBONDING FRP STRAIN
The strength deficiencies in the bridge girders were in discrete areas in the positive moment
region. Figure 6.1 shows the strength deficiencies of an exterior girder (Swenson and Barnes
2002). Since the bridge is symmetric, only a single end span and half of the center span are
depicted. The laboratory specimens were designed to represent the end span member. A
strengthening scheme was designed for the bridge using the July 2000 draft of the eventual
ACI 440 recommendations. The final version of the report was published about one year
after completion of the bridge strengthening. The published version includes provisions that
are more conservative than those in the earlier draft. As discussed in the previous chapter,
even the revised limits on the allowable FRP strain given in the final (2002) ACI
recommendations were found to be unconservative when compared to the laboratory test
results. For this reason, the capacity of the bridge must be assessed using the measured
debonding strain in the FRP. The measured strain immediately prior to total FRP debonding,
εfe,exp, was chosen as the effective limit for strength limit state design. Four test specimens,
B1–B4, had the same FRP and epoxy thicknesses as those found on the bridge. The
measured FRP strains prior to debonding for these specimens were averaged. The average
debonding FRP strain of 0.005 was used as the effective limit.
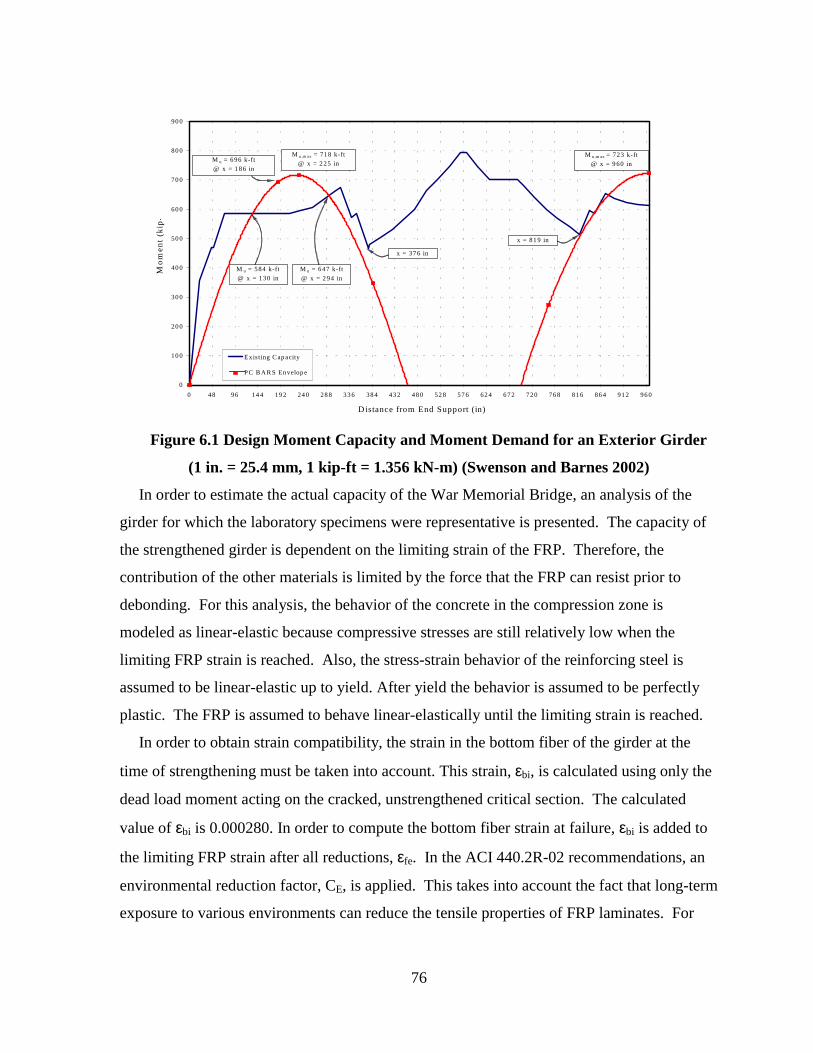
76
0
10 0
20 0
30 0
40 0
50 0
60 0
70 0
80 0
90 0
0 48 96 14 4 19 2 24 0 28 8 33 6 38 4 43 2 48 0 52 8 57 6 62 4 67 2 72 0 76 8 81 6 86 4 91 2 96 0
D istance from End Support (in)
Mom
ent
(kip
-
E x is ting C ap acity
P C B A R S Envelop e
M u ,m ax = 718 k-ft@ x = 2 25 in
M u ,m ax = 723 k-ft@ x = 9 60 in
M u = 647 k-ft@ x = 2 94 in
M u = 584 k-ft@ x = 1 30 in
x = 81 9 in
x = 37 6 in
M u = 696 k-ft@ x = 1 86 in
Figure 6.1 Design Moment Capacity and Moment Demand for an Exterior Girder
(1 in. = 25.4 mm, 1 kip-ft = 1.356 kN-m) (Swenson and Barnes 2002)
In order to estimate the actual capacity of the War Memorial Bridge, an analysis of the
girder for which the laboratory specimens were representative is presented. The capacity of
the strengthened girder is dependent on the limiting strain of the FRP. Therefore, the
contribution of the other materials is limited by the force that the FRP can resist prior to
debonding. For this analysis, the behavior of the concrete in the compression zone is
modeled as linear-elastic because compressive stresses are still relatively low when the
limiting FRP strain is reached. Also, the stress-strain behavior of the reinforcing steel is
assumed to be linear-elastic up to yield. After yield the behavior is assumed to be perfectly
plastic. The FRP is assumed to behave linear-elastically until the limiting strain is reached.
In order to obtain strain compatibility, the strain in the bottom fiber of the girder at the
time of strengthening must be taken into account. This strain, εbi, is calculated using only the
dead load moment acting on the cracked, unstrengthened critical section. The calculated
value of εbi is 0.000280. In order to compute the bottom fiber strain at failure, εbi is added to
the limiting FRP strain after all reductions, εfe. In the ACI 440.2R-02 recommendations, an
environmental reduction factor, CE, is applied. This takes into account the fact that long-term
exposure to various environments can reduce the tensile properties of FRP laminates. For
77
carbon FRP with exterior exposure, this value is taken as 0.85. The environmental reduction
factor is used by ACI 440 as shown in Equation 6.1.
fuEfu C *εε ⋅= (6.1)
εfu is the design rupture strain of the FRP, and ε∗fu is the ultimate rupture strain of the
FRP. For this analysis, instead of using the ultimate rupture strain, the average measured
limiting strain of 0.005 was used. However, it was not reduced by the environmental
reduction factor because for the debonding failure, the environmental reduction factor
appears in the numerator and denominator of the equation for the limiting strain calculated by
the ACI 440.2R-02 method. Therefore, the environmental reduction factor has no effect for
this type of failure. This resulted in a design FRP strain of εfe = 0.005. Addition of εbi
resulted in a total bottom fiber strain of 0.005280 at ultimate. With this value known, the
strain profile, shown in Figure 6.2, is varied until equilibrium of sectional forces is obtained.
Figure 6.2 Strain and Stress Profiles for Analysis
Before calculating the moment capacity, ACI 440 applies a reduction factor, ψf, to the
FRP contribution to the moment. This value is taken as 0.85. This is applied to account for
uncertainties that are currently present with the use of FRP. The strains are then converted to
forces using the values given in Table 6.1 and the assumptions described above. The moment
capacity is then calculated by summing moments about the compression force of the
concrete.
A strength reduction factor, φ, is also applied to the moment capacity. This is the same
factor used in conventional RC design using ACI 318-02 and FRP-strengthened members
using ACI 440.2R-02. The factor is designed to account for the ductility associated with the
anticipated failure mechanism. The value of this factor is dependent on the level of strain in
the reinforcing steel. Since it has been shown that the use of FRP decreases the ductility, a
larger reduction in design strength will result if the tension steel strain at failure does not
c
h d
d’
εfe
εbi
εs
εc
AFRP
As
A’s
ε’s
fc
fs
ff
f’s
Strain Profile Stress Profile
bf
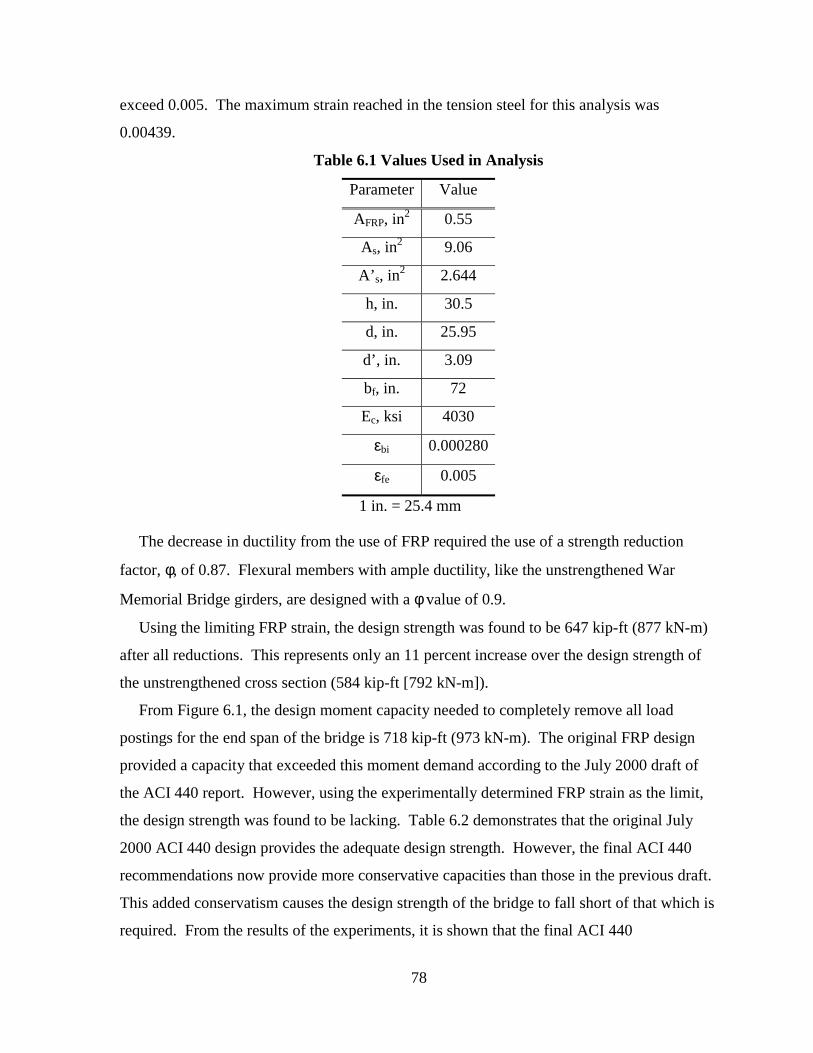
78
exceed 0.005. The maximum strain reached in the tension steel for this analysis was
0.00439.
Table 6.1 Values Used in Analysis
Parameter Value
AFRP, in2 0.55
As, in2 9.06
A’s, in2 2.644
h, in. 30.5
d, in. 25.95
d’, in. 3.09
bf, in. 72
Ec, ksi 4030
εbi 0.000280
εfe 0.005
1 in. = 25.4 mm
The decrease in ductility from the use of FRP required the use of a strength reduction
factor, φ, of 0.87. Flexural members with ample ductility, like the unstrengthened War
Memorial Bridge girders, are designed with a φ value of 0.9.
Using the limiting FRP strain, the design strength was found to be 647 kip-ft (877 kN-m)
after all reductions. This represents only an 11 percent increase over the design strength of
the unstrengthened cross section (584 kip-ft [792 kN-m]).
From Figure 6.1, the design moment capacity needed to completely remove all load
postings for the end span of the bridge is 718 kip-ft (973 kN-m). The original FRP design
provided a capacity that exceeded this moment demand according to the July 2000 draft of
the ACI 440 report. However, using the experimentally determined FRP strain as the limit,
the design strength was found to be lacking. Table 6.2 demonstrates that the original July
2000 ACI 440 design provides the adequate design strength. However, the final ACI 440
recommendations now provide more conservative capacities than those in the previous draft.
This added conservatism causes the design strength of the bridge to fall short of that which is
required. From the results of the experiments, it is shown that the final ACI 440
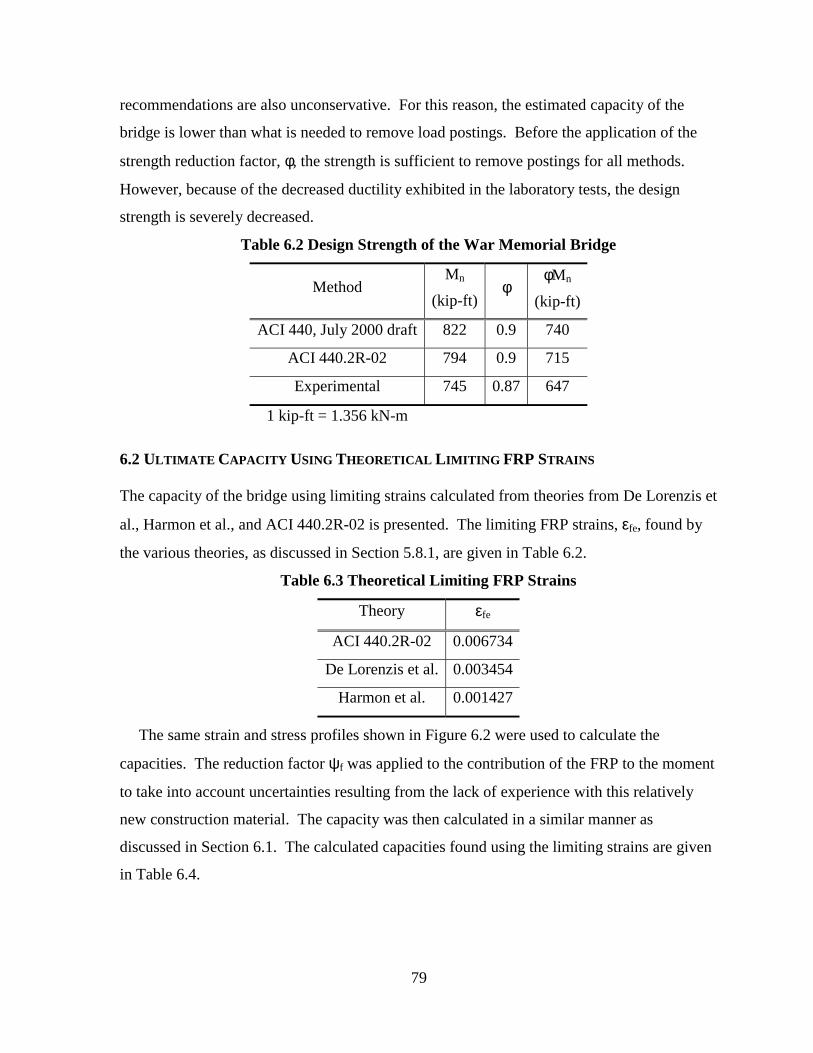
79
recommendations are also unconservative. For this reason, the estimated capacity of the
bridge is lower than what is needed to remove load postings. Before the application of the
strength reduction factor, φ, the strength is sufficient to remove postings for all methods.
However, because of the decreased ductility exhibited in the laboratory tests, the design
strength is severely decreased.
Table 6.2 Design Strength of the War Memorial Bridge
Method Mn
(kip-ft) φ
φMn
(kip-ft)
ACI 440, July 2000 draft 822 0.9 740
ACI 440.2R-02 794 0.9 715
Experimental 745 0.87 647
1 kip-ft = 1.356 kN-m
6.2 ULTIMATE CAPACITY USING THEORETICAL LIMITING FRP STRAINS
The capacity of the bridge using limiting strains calculated from theories from De Lorenzis et
al., Harmon et al., and ACI 440.2R-02 is presented. The limiting FRP strains, εfe, found by
the various theories, as discussed in Section 5.8.1, are given in Table 6.2.
Table 6.3 Theoretical Limiting FRP Strains
Theory εfe
ACI 440.2R-02 0.006734
De Lorenzis et al. 0.003454
Harmon et al. 0.001427
The same strain and stress profiles shown in Figure 6.2 were used to calculate the
capacities. The reduction factor ψf was applied to the contribution of the FRP to the moment
to take into account uncertainties resulting from the lack of experience with this relatively
new construction material. The capacity was then calculated in a similar manner as
discussed in Section 6.1. The calculated capacities found using the limiting strains are given
in Table 6.4.
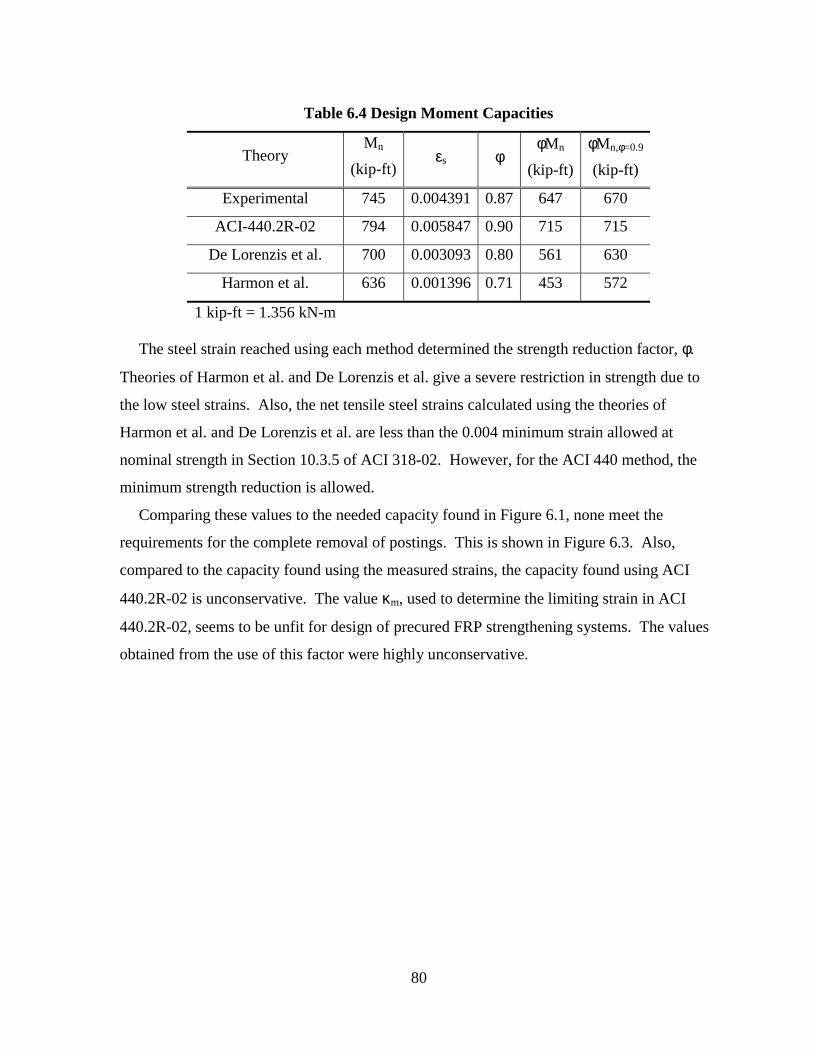
80
Table 6.4 Design Moment Capacities
Theory Mn
(kip-ft) εs φ
φMn
(kip-ft)
φMn,φ=0.9
(kip-ft)
Experimental 745 0.004391 0.87 647 670
ACI-440.2R-02 794 0.005847 0.90 715 715
De Lorenzis et al. 700 0.003093 0.80 561 630
Harmon et al. 636 0.001396 0.71 453 572
1 kip-ft = 1.356 kN-m
The steel strain reached using each method determined the strength reduction factor, φ.
Theories of Harmon et al. and De Lorenzis et al. give a severe restriction in strength due to
the low steel strains. Also, the net tensile steel strains calculated using the theories of
Harmon et al. and De Lorenzis et al. are less than the 0.004 minimum strain allowed at
nominal strength in Section 10.3.5 of ACI 318-02. However, for the ACI 440 method, the
minimum strength reduction is allowed.
Comparing these values to the needed capacity found in Figure 6.1, none meet the
requirements for the complete removal of postings. This is shown in Figure 6.3. Also,
compared to the capacity found using the measured strains, the capacity found using ACI
440.2R-02 is unconservative. The value κm, used to determine the limiting strain in ACI
440.2R-02, seems to be unfit for design of precured FRP strengthening systems. The values
obtained from the use of this factor were highly unconservative.
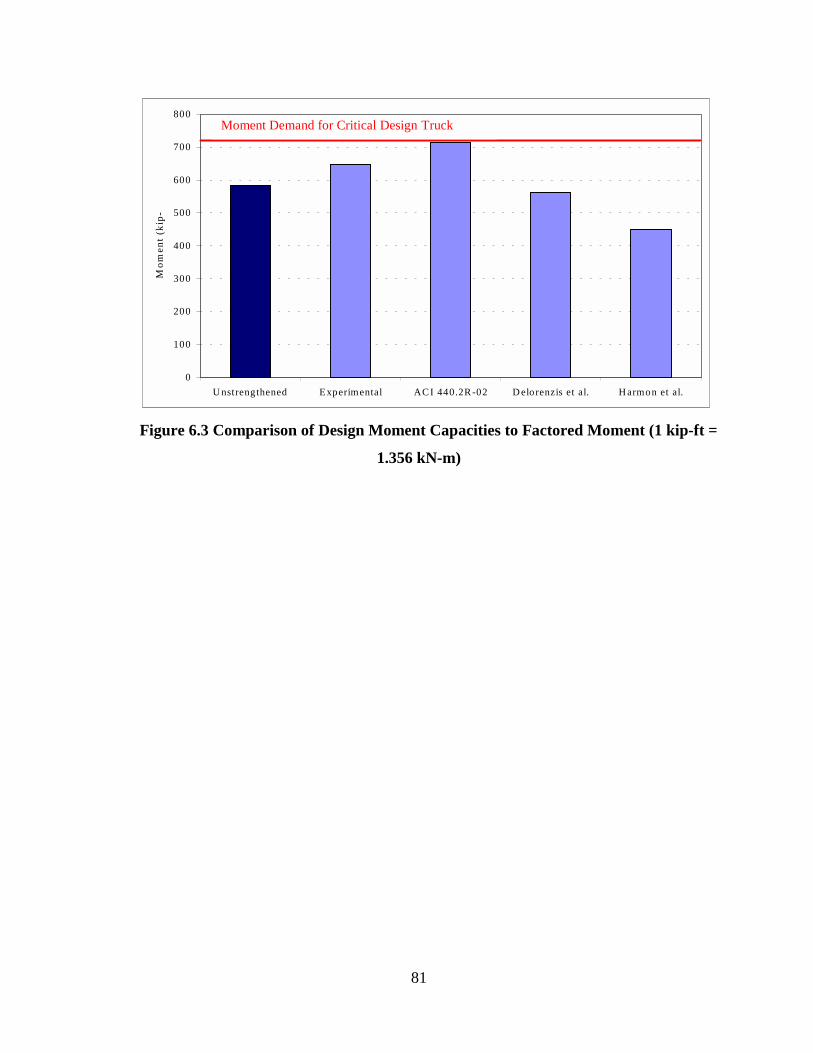
81
0
100
200
300
400
500
600
700
800
U nstrengthened Experimental AC I 440.2R -02 D elo renzis et al. H armon et al.
Mom
ent (
kip-
M oment demand fo r Critical D esign T ruck
Figure 6.3 Comparison of Design Moment Capacities to Factored Moment (1 kip-ft =
1.356 kN-m)
Moment Demand for Critical Design Truck
82
CHAPTER 7: CONCLUSIONS AND RECOMMENDATIONS
7.1 SUMMARY
The practice of strengthening RC bridges with FRP is becoming a more common
strengthening method. However, in bridge applications is it usually unfeasible to close the
bridge to traffic during strengthening. This brings forth the concern of how the traffic load
cycles affect the bond of the FRP to the concrete. To examine this, eight RC beams were
used to test the flexural performance of beams externally reinforced with epoxy-bonded FRP
and exposed to load cycles during epoxy cure. One beam was unstrengthened and used as a
control. Two of the strengthened specimens were not subjected to load cycles during epoxy
cure to serve as controls for the effects of loading cycles during epoxy cure. Three other
groups of specimens were tested:
1. Specimens with “thin” epoxy (0.0625 in. [1.6 mm]) and an FRP thickness of 0.055 in.
(1.4 mm)
2. Specimens with “thick” epoxy (0.125 in. [3.2 mm]) and an FRP thickness of 0.055 in.
(1.4 mm)
3. Specimens with “thin” epoxy and an FRP thickness of 0.075 in. (1.9 mm)
Comparisons of the experimental data demonstrated that cycles have a minimal effect on
the ultimate strength of the FRP-reinforced beams. However, the load cycles seemed to
increase the ductility of the specimens over those not exposed to load cycles. Failure of all
strengthened specimens resulted from FRP debonding at a flexural crack under one of the
load points; this debonding then propagated out to the curtailment of the FRP. Limits on the
FRP strain to prevent this debonding, given by current design recommendations, were found
to be unsafe for the type of FRP used in this study.
The capacity of the War Memorial Bridge was calculated based on the measured limiting
FRP strain to prevent debonding. The capacity was also calculated based on limiting strains
calculated from various theories and design recommendations. It was discovered that the
capacity of the strengthened bridge does not exceed moment requirements to totally remove
all load postings.
83
7.2 CONCLUSIONS
The results of this study provided valuable insight into the effects of load cycles during
strengthening. It was found that the strengthened specimens had an increase in flexural
strength over the unstrengthened specimen of 19 – 28 percent. However, this was not the
focus of this study. The effects of cycles during epoxy cure time on the ultimate strength of
the members were found to be minimal. An interesting finding was that the beams subjected
to cycles during curing of the epoxy failed at a larger deflection than those without cycles.
From this, it was concluded that the cycles during curing of the epoxy helped increase the
strength of the bond and the ductility of the members.
A major problem identified in this study was that existing ACI 440.2R-02 design
recommendations give unsafe limiting strains to prevent FRP debonding for the FRP type
used. Other theories presented were conservative in this aspect. However, the ultimate
strength of the members, calculated using the existing design recommendations and
presented theories, remained fairly close to the measured capacities.
For all strengthened members, failure was caused by localized debonding at a flexural
crack under one of the load points. As load was increased, the debonding rapidly propagated
to the curtailment of the FRP. The total debonding was dramatic and instantaneous. The
ductility of the strengthened members was reduced to approximately 10% of that of the
unstrengthened specimen, which is undesirable.
The capacity of an exterior girder of the War Memorial Bridge was calculated using the
limiting FRP strain measured in the study. It was discovered that the capacity is not
sufficient to remove all load postings on the bridge. The original strengthening design of the
bridge was performed using the July 2000 draft of the eventual ACI 440 report. By using the
ACI 440 recommendations, the limiting strain has been shown to be unconservative. The
factor, κm, used to produce the limiting FRP strain seems to be unfit for use with the type of
FRP used in this study. The capacity was also calculated using various theories and the
current ACI 440 recommendations. For all cases, the capacity was less than that needed to
totally remove load postings.
84
7.3 RECOMMENDATIONS
Based on the results of this study, the effects of load cycles during epoxy cure on the ultimate
strength of FRP strengthened RC members are minimal. For a majority of the members,
there was no reduction in capacity. For the remainder, the reduction was negligible. One
concern encountered during this study was the limit found in current design
recommendations used to control the debonding failure mode. The limit is based on the
strain that the FRP is able to withstand before debonding. The following recommendations
are made:
1. For strengthening of RC members with epoxy-bonded FRP, the fact that loading
cycles may be present can be ignored for the epoxy type and thickness used in the
War Memorial Bridge.
2. The limiting strain computed according to the ACI 440.2R-02 report is not
conservative for the type of FRP and epoxy used in this study.
3. Further research on the effects of epoxy thickness on the anchorage of FRP should
be performed.
4. Further research needs to be performed on the limiting FRP strain to prevent
debonding of precured FRP laminates.
5. Load postings on the War Memorial Bridge should be maintained until further
research is performed.
6. The removal of postings could be accomplished by adding extra FRP reinforcement
to the girders. However, any additional FRP should be bonded directly to the
concrete surface. Using extra FRP to simply “thicken” the existing FRP will likely
result in no significant increase in strength prior to debonding.
85
REFERENCES
AASHTO Interim Revisions 1994. Manual for Condition Evaluation of Bridges, American Association of State Highway and Transportation Officials, Washington, D.C.
Almusallam, T.H. and Al-Salloum, Y.A. 2001. “Ultimate Strength Prediction for RC Beams Externally Strengthened by Composite Materials”, Composites: Part B, Vol. 32, pp. 609-619.
American Concrete Institute (ACI 440.2R-02). Guide for the Design and Construction of Externally Bonded FRP Systems for Strengthening Concrete Structures (440.2R-02), Farmington Hills, Michigan, 2002.
American Concrete Institute (ACI 318-02). Building Code Requirements for Structural Concrete (318-02) and Commentary (318R-02), Farmington Hills, Michigan, 2002.
ASTM C 78, Standard Test Method for Flexural Strength of Concrete (Using Simple Beam with Third-Point Loading), Annual Book of American Society for Testing and Materials Standards, 1994.
ASTM C 469, Standard Test Method for Static Modulus of Elasticity and Poisson’s Ratio of Concrete in Compression, Annual Book of 469American Society for Testing and Materials Standards, 1994.
ASTM C 496, Standard Test Method for Splitting Tensile Strength of Cylindrical Concrete Specimens, Annual Book of American Society for Testing and Materials Standards, 1996.
ASTM C 192, Standard Test Method for Making and Curing Concrete Test Specimens in the Laboratory, Annual Book of American Society for Testing and Materials Standards, 2000.
ASTM C 39, Standard Test Method for Compressive Strength of Cylindrical Concrete Specimens, Annual Book of American Society for Testing and Materials Standards, 2001.
Arduini, M. and Nanni, A. 1997. “Behavior of Precracked RC Beams Strengthened with Carbon FRP Sheets”, Journal of Composites for Construction, Vol. 1, No. 2, May, pp. 63-70.
Barnes, R.A. and Mays, G.C. 2001. “The Effect of Traffic Vibration on Adhesive Curing During Installation of Bonded External Reinforcement”, Proceedings of the Institution of Civil Engineers Structures & Buildings 146, Issue 4, November, pp. 403-410.
Breña, S.F., Bramblett, R.M., Wood, S.L., and Kreger, M.E. 2003. “Increasing Flexural Capacity of Reinforced Concrete Beams Using Carbon Fiber-Reinforced Polymer Composites”, ACI Structural Journal, Vol. 100, No. 1, January-February, pp. 36-46.
86
Breña, S.F. 2000. Strengthening Reinforced Concrete Bridges Using Carbon Fiber Reinforced Polymer Composites, Ph. D Dissertation, The University of Texas at Austin, December.
De Lorenzis, L., Miller, B., and Nanni, A. 2001. “Bond of Fiber-Reinforced Polymer Laminates to Concrete”, ACI Materials Journal, Vol. 98, No. 3, May-June, pp. 256-264.
El-Mihilmy, M.T. and Tedesco, J.W. 2001. “Prediction of Anchorage Failure for Reinforced Concrete Beams Strengthened with Fiber-Reinforced Polymer Plates”, ACI Structural Journal, Vol. 98, No. 3, May-June, pp. 301-314.
Fanning, P.J. and Kelly, O. 2001. “Ultimate Response of RC Beams Strengthened with CFRP Plates”, Journal of Composites for Construction, Vol. 5, No. 2, May, pp. 122-127.
FYFE Co. LLC (2000a). Tyfo® S Saturant Epoxy, San Diego, California.
FYFE Co. LLC (2000b). Tyfo® UC Composite Laminate Strip System, San Diego, California.
FYFE Co. LLC (2001). Tyfo® TC Tack-Coat Epoxy, San Diego, California.
GangaRao, H.V.S. and Vijay, P.V. 1998. “Bending Behavior of Concrete Beams Wrapped with Carbon Fabric”, Journal of Structural Engineering, V. 124, No. 1, January, pp. 3-10.
Harmon, T., Kim, Y.J., Kardos, J., Johnson, T., and Stark, A. 2003. “Bond of Surface Mounted FRP Reinforcement for Concrete Structures”, Manuscript accepted for publication in the ACI Structural Journal.
Macdonald, M.D. 1981. “Strength of Bonded Shear Joints Subjected to Movement During Cure”, International Journal of Cement Composites and Lightweight Concrete, Vol. 3, No. 4, November, pp. 267-272.
Mukhopadhyaya, P. and Swamy, N. 2001. “Interface Shear Stress: A New Design Criterion for Plate Debonding”, Journal of Composites for Construction, Vol. 5, No. 1, February, pp. 35-43.
Nguyen, D.M., Chan, T.K., and Cheong, H.K. 2001. “Brittle Failure and Bond Development Length of CFRP-Concrete Beams”, Journal of Composites for Construction, Vol. 5, No. 1, February, pp. 12-17.
Stallings, J.M., Tedesco, J.W., El-Mihilmy, M., and McCauley, M. 2001. “Field Performance of FRP Bridge Repairs”, Journal of Bridge Engineering, Vol. 5, No. 2, May, pp. 107-113.
Swenson, K.S. and Barnes, R.W. 2002. Design Procedure for FRP Strengthening of War Memorial Bridge, Interim Report 930-466, Auburn University, May.
87
APPENDIX A: MATERIAL PROPERTIES
This appendix is divided into three sections. Concrete material properties are described in
Section A.1, reinforcing steel properties are summarized in Section A.2, and FRP reinforcing
system properties are given in Section A.3. Concrete cylinders, concrete flexural specimens,
and steel bars were tested as part of this research program to determine the material
properties used in analysis. Material properties reported by the manufacturers are
summarized for the composite material systems.
A.1 CONCRETE
Concrete cylinders (6 in. [152 mm] diameter by 12 in. [305 mm] in height) and flexural
specimens (6 in. by 6in. by 20 in. [152 mm by 152 mm by 305 mm]) were fabricated using
standard ASTM procedures as specified in ASTM C-192 (2000). Thirty cylinders and 4
flexural specimens were cast from the same batch of concrete as the laboratory specimens
and were cured under moist conditions at 73 ± 3˚F (23 ± 2˚C) in a moist curing room. The
testing program for all beams spanned four months. It was desired that the strength gain of
the concrete be negligible for this time period. Therefore, the strength of the concrete needed
to be approximately constant with respect to time. One cylinder was tested in compression 4,
7, and 14 days after casting, and two cylinders were tested 28 days after casting to establish
the strength-gain curve. Also, two cylinders were tested in compression within 24 hrs of
testing of each laboratory specimen to establish the strength at the time of testing.
Compressive tests were performed in accordance with ASTM C-39 (2001). Figure A.1
shows the compressive strength versus elapsed time curve for the test cylinders. The
modulus of elasticity was also measured for the cylinders tested with the laboratory
specimens. The tests for modulus of elasticity were performed in accordance with ASTM C-
469 (1994). Table A.1 summarizes the results of the compressive strength tests and the
modulus of elasticity tests for all specimens.
Since the laboratory specimens were tested at an age where the strength gain was minimal,
splitting tensile and flexural tests were only performed before the first laboratory specimen
and after the last were tested. Three cylinders were tested for splitting tensile strength at
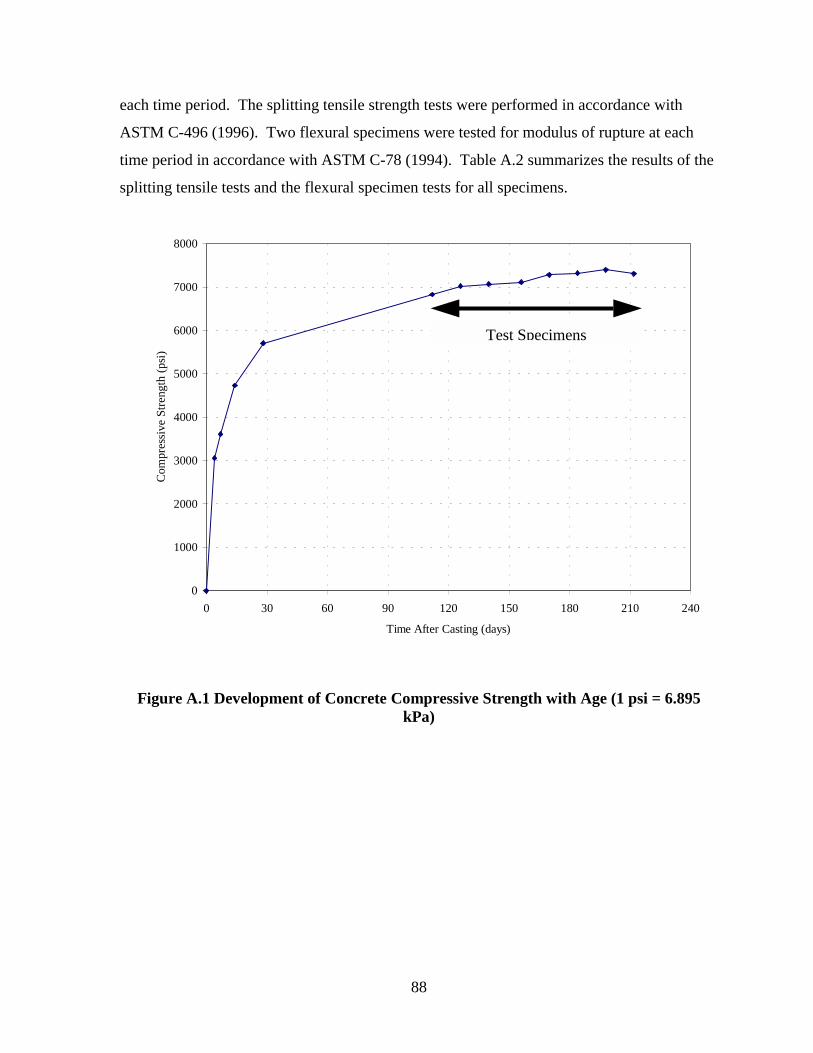
88
each time period. The splitting tensile strength tests were performed in accordance with
ASTM C-496 (1996). Two flexural specimens were tested for modulus of rupture at each
time period in accordance with ASTM C-78 (1994). Table A.2 summarizes the results of the
splitting tensile tests and the flexural specimen tests for all specimens.
0
1000
2000
3000
4000
5000
6000
7000
8000
0 30 60 90 120 150 180 210 240
Time After Casting (days)
Com
pres
sive
Stre
ngth
(psi)
Figure A.1 Development of Concrete Compressive Strength with Age (1 psi = 6.895 kPa)
Test Specimens
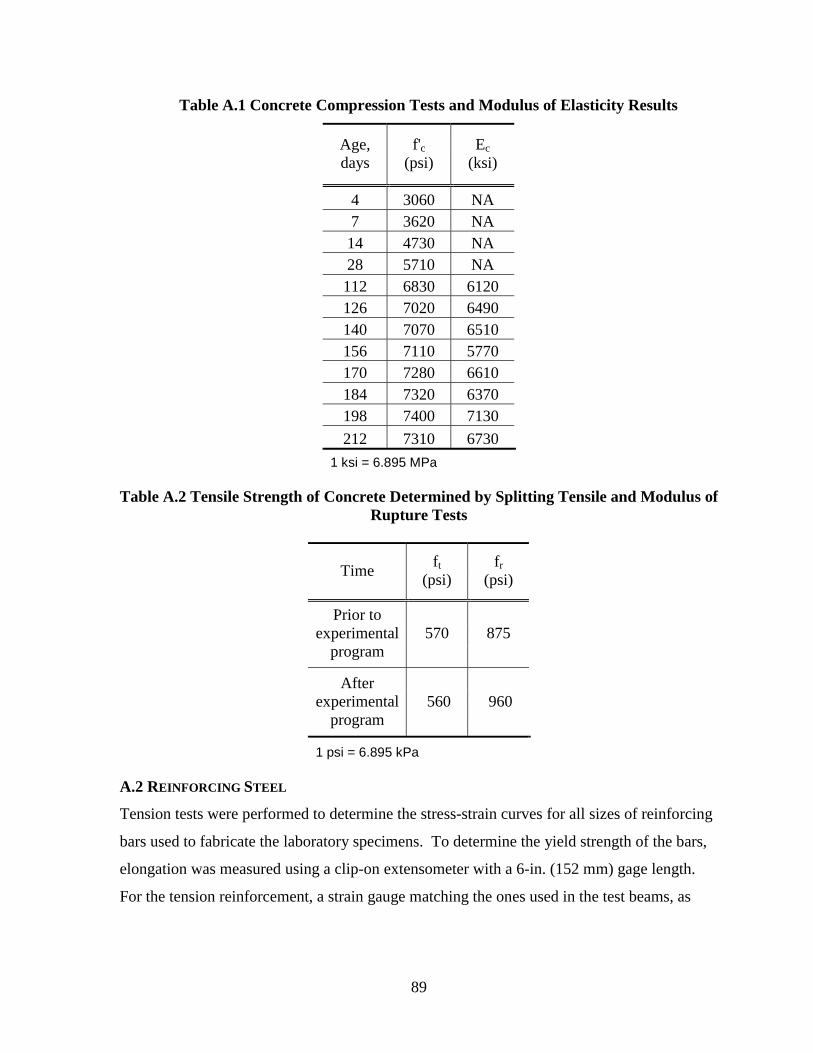
89
Table A.1 Concrete Compression Tests and Modulus of Elasticity Results
Age, days
f'c (psi)
Ec (ksi)
4 3060 NA 7 3620 NA 14 4730 NA 28 5710 NA 112 6830 6120 126 7020 6490 140 7070 6510 156 7110 5770 170 7280 6610 184 7320 6370 198 7400 7130 212 7310 6730
1 ksi = 6.895 MPa
Table A.2 Tensile Strength of Concrete Determined by Splitting Tensile and Modulus of Rupture Tests
Time ft (psi)
fr (psi)
Prior to experimental
program 570 875
After experimental
program 560 960
1 psi = 6.895 kPa
A.2 REINFORCING STEEL
Tension tests were performed to determine the stress-strain curves for all sizes of reinforcing
bars used to fabricate the laboratory specimens. To determine the yield strength of the bars,
elongation was measured using a clip-on extensometer with a 6-in. (152 mm) gage length.
For the tension reinforcement, a strain gauge matching the ones used in the test beams, as
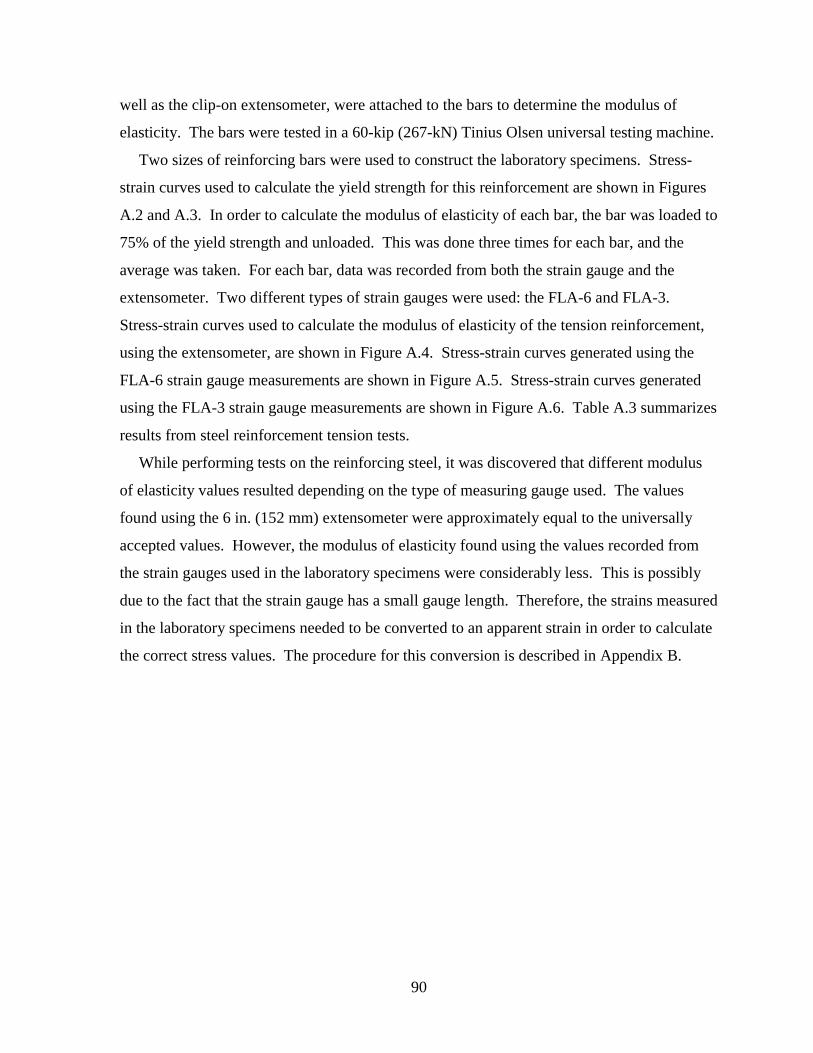
90
well as the clip-on extensometer, were attached to the bars to determine the modulus of
elasticity. The bars were tested in a 60-kip (267-kN) Tinius Olsen universal testing machine.
Two sizes of reinforcing bars were used to construct the laboratory specimens. Stress-
strain curves used to calculate the yield strength for this reinforcement are shown in Figures
A.2 and A.3. In order to calculate the modulus of elasticity of each bar, the bar was loaded to
75% of the yield strength and unloaded. This was done three times for each bar, and the
average was taken. For each bar, data was recorded from both the strain gauge and the
extensometer. Two different types of strain gauges were used: the FLA-6 and FLA-3.
Stress-strain curves used to calculate the modulus of elasticity of the tension reinforcement,
using the extensometer, are shown in Figure A.4. Stress-strain curves generated using the
FLA-6 strain gauge measurements are shown in Figure A.5. Stress-strain curves generated
using the FLA-3 strain gauge measurements are shown in Figure A.6. Table A.3 summarizes
results from steel reinforcement tension tests.
While performing tests on the reinforcing steel, it was discovered that different modulus
of elasticity values resulted depending on the type of measuring gauge used. The values
found using the 6 in. (152 mm) extensometer were approximately equal to the universally
accepted values. However, the modulus of elasticity found using the values recorded from
the strain gauges used in the laboratory specimens were considerably less. This is possibly
due to the fact that the strain gauge has a small gauge length. Therefore, the strains measured
in the laboratory specimens needed to be converted to an apparent strain in order to calculate
the correct stress values. The procedure for this conversion is described in Appendix B.
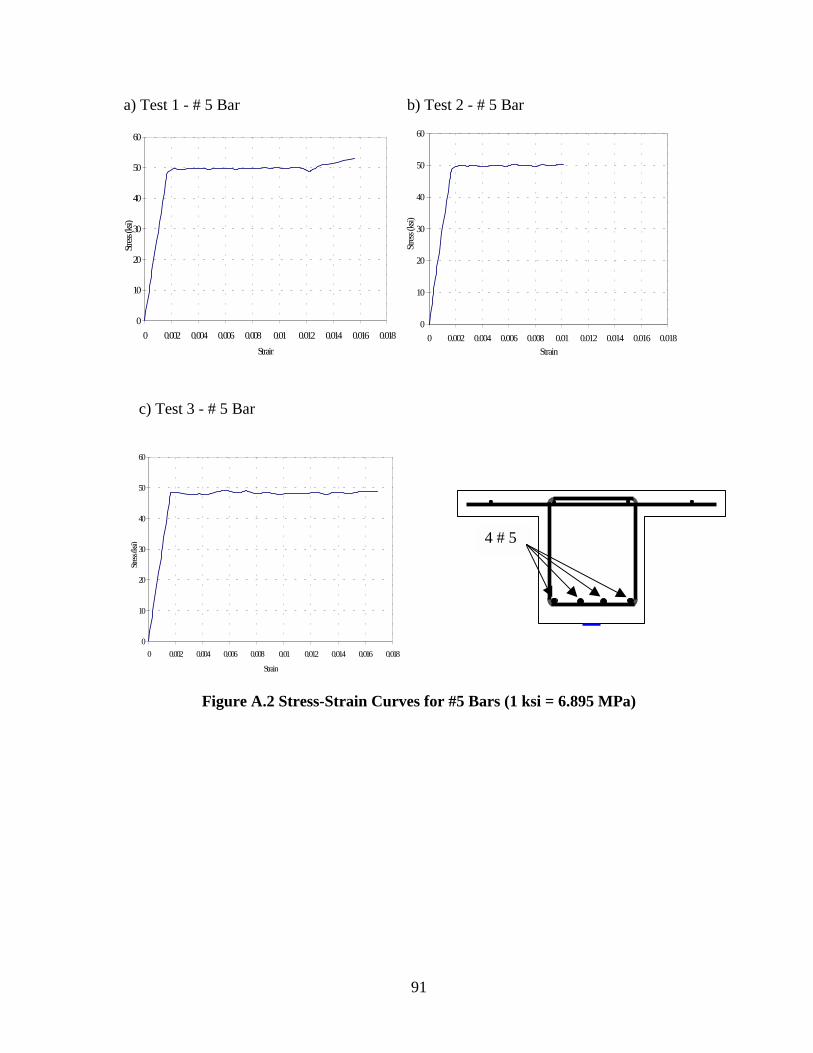
91
a) Test 1 - # 5 Bar b) Test 2 - # 5 Bar
0
10
20
30
40
50
60
0 0.002 0.004 0.006 0.008 0.01 0.012 0.014 0.016 0.018Strain
Stress
(ksi)
0
10
20
30
40
50
60
0 0.002 0.004 0.006 0.008 0.01 0.012 0.014 0.016 0.018Strain
Stress
(ksi)
c) Test 3 - # 5 Bar
0
10
20
30
40
50
60
0 0.002 0.004 0.006 0.008 0.01 0.012 0.014 0.016 0.018
Strain
Stress
(ksi)
Figure A.2 Stress-Strain Curves for #5 Bars (1 ksi = 6.895 MPa)
4 # 5
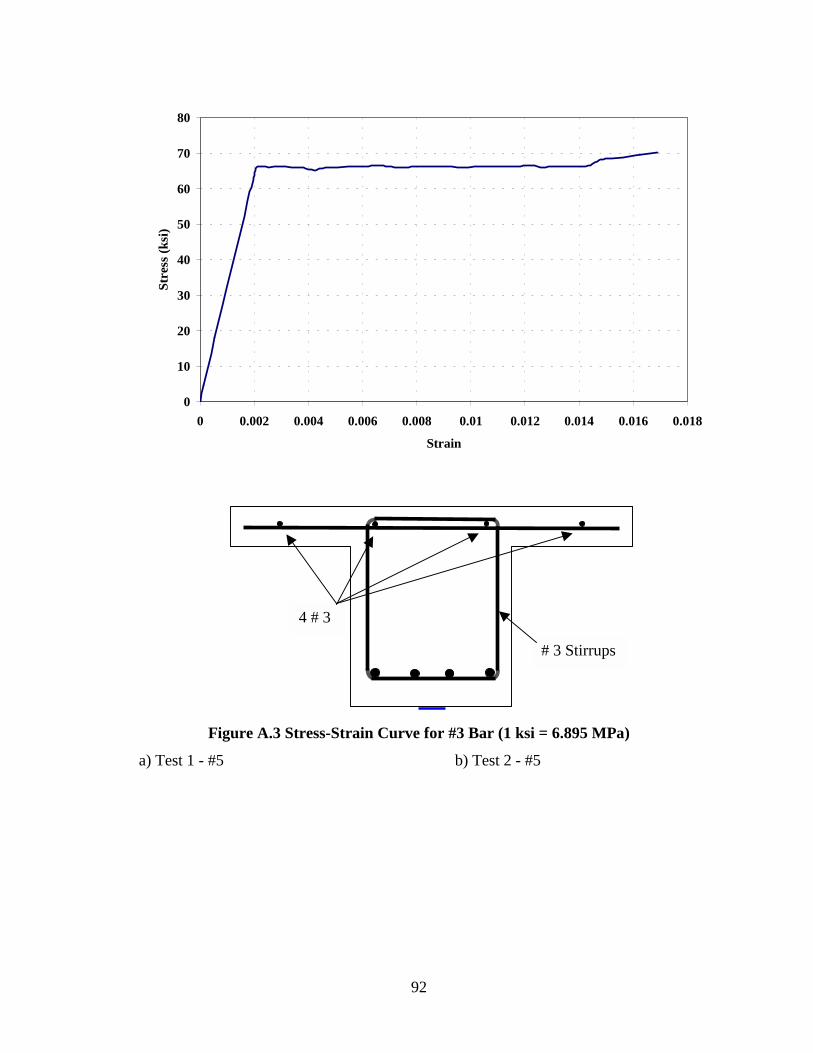
92
0
10
20
30
40
50
60
70
80
0 0.002 0.004 0.006 0.008 0.01 0.012 0.014 0.016 0.018
Strain
Stre
ss (k
si)
Figure A.3 Stress-Strain Curve for #3 Bar (1 ksi = 6.895 MPa)
a) Test 1 - #5 b) Test 2 - #5
4 # 3
# 3 Stirrups
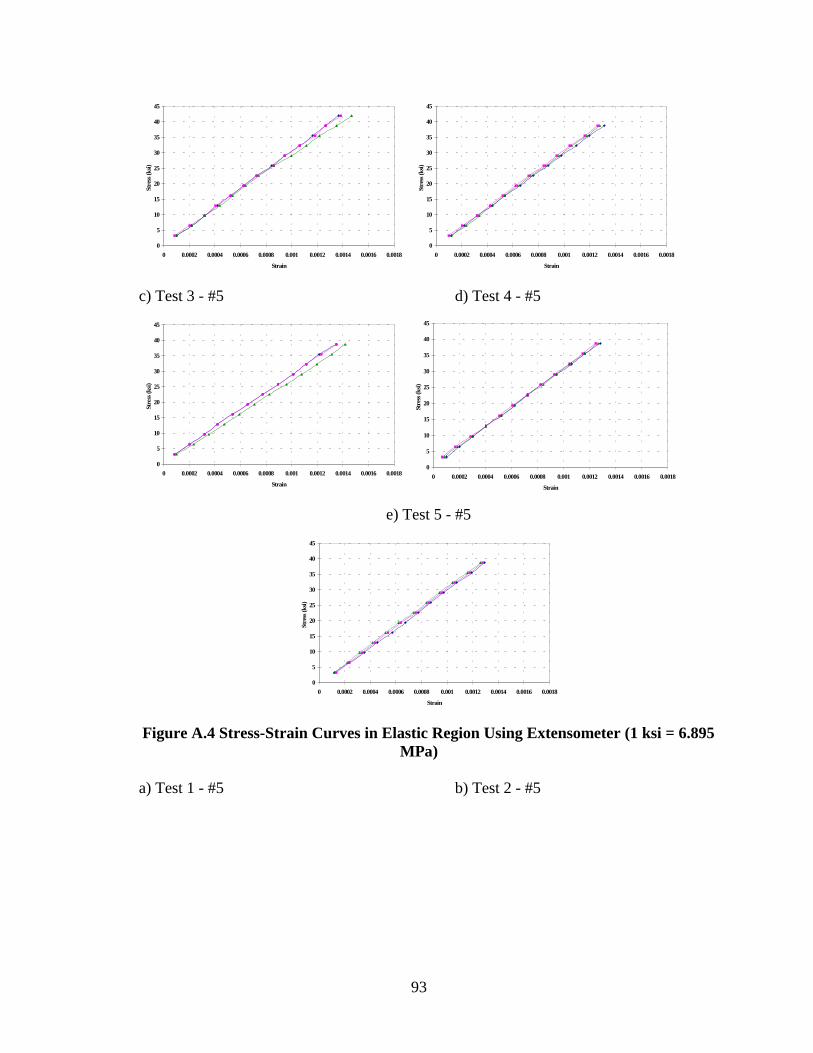
93
0
5
10
15
20
25
30
35
40
45
0 0.0002 0.0004 0.0006 0.0008 0.001 0.0012 0.0014 0.0016 0.0018
Strain
Stre
ss (k
si)
0
5
10
15
20
25
30
35
40
45
0 0.0002 0.0004 0.0006 0.0008 0.001 0.0012 0.0014 0.0016 0.0018
Strain
Stre
ss (k
si)
c) Test 3 - #5 d) Test 4 - #5
0
5
10
15
20
25
30
35
40
45
0 0.0002 0.0004 0.0006 0.0008 0.001 0.0012 0.0014 0.0016 0.0018
Strain
Stre
ss (k
si)
0
5
10
15
20
25
30
35
40
45
0 0.0002 0.0004 0.0006 0.0008 0.001 0.0012 0.0014 0.0016 0.0018
Strain
Stre
ss (k
si)
e) Test 5 - #5
0
5
10
15
20
25
30
35
40
45
0 0.0002 0.0004 0.0006 0.0008 0.001 0.0012 0.0014 0.0016 0.0018
Strain
Stre
ss (k
si)
Figure A.4 Stress-Strain Curves in Elastic Region Using Extensometer (1 ksi = 6.895
MPa)
a) Test 1 - #5 b) Test 2 - #5
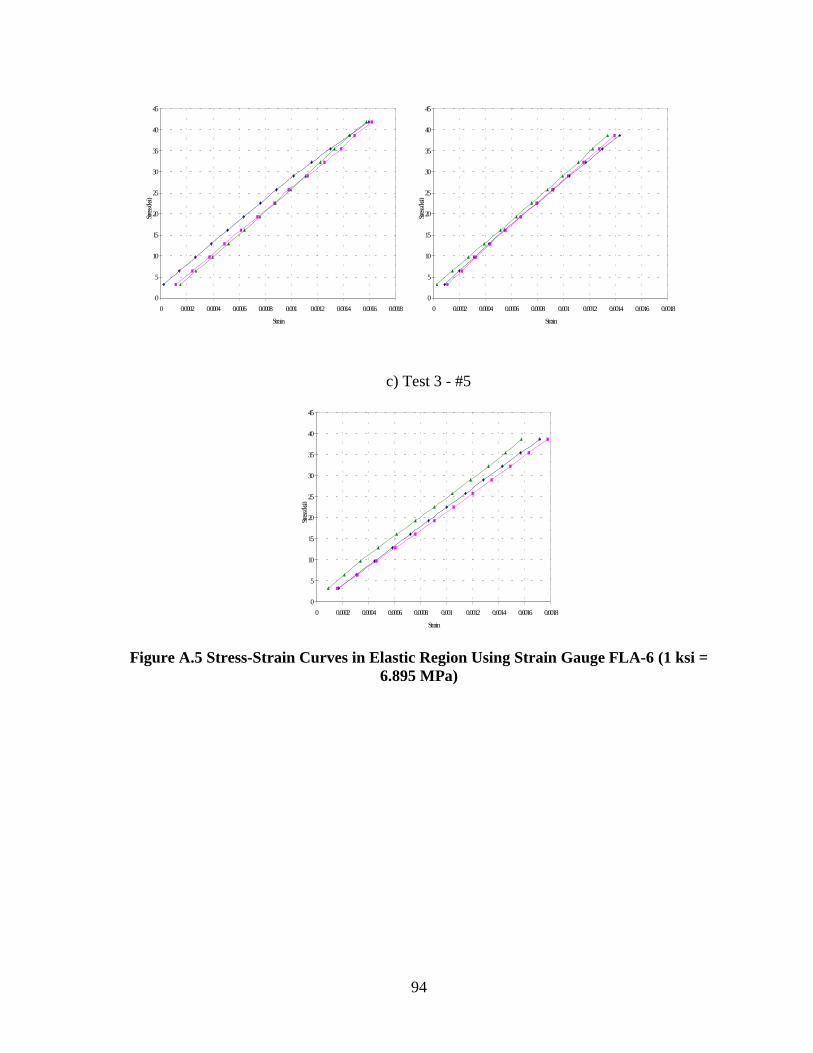
94
0
5
10
15
20
25
30
35
40
45
0 0.0002 0.0004 0.0006 0.0008 0.001 0.0012 0.0014 0.0016 0.0018
Strain
Stress
(ksi)
0
5
10
15
20
25
30
35
40
45
0 0.0002 0.0004 0.0006 0.0008 0.001 0.0012 0.0014 0.0016 0.0018
Strain
Stress
(ksi)
c) Test 3 - #5
0
5
10
15
20
25
30
35
40
45
0 0.0002 0.0004 0.0006 0.0008 0.001 0.0012 0.0014 0.0016 0.0018
Strain
Stress
(ksi)
Figure A.5 Stress-Strain Curves in Elastic Region Using Strain Gauge FLA-6 (1 ksi =
6.895 MPa)
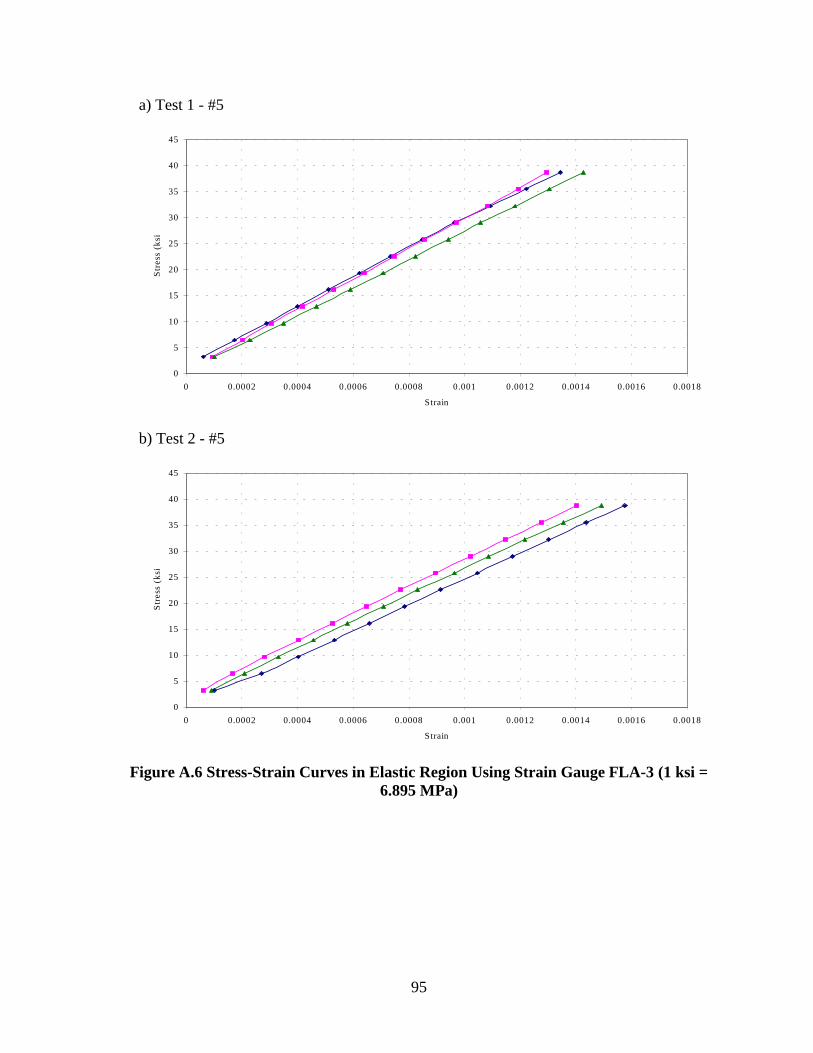
95
a) Test 1 - #5
0
5
10
15
20
25
30
35
40
45
0 0.0002 0.0004 0.0006 0.0008 0.001 0.0012 0.0014 0.0016 0.0018
Strain
Stre
ss (
ksi
b) Test 2 - #5
0
5
10
15
20
25
30
35
40
45
0 0.0002 0.0004 0.0006 0.0008 0.001 0.0012 0.0014 0.0016 0.0018
Strain
Stre
ss (
ksi
Figure A.6 Stress-Strain Curves in Elastic Region Using Strain Gauge FLA-3 (1 ksi =
6.895 MPa)
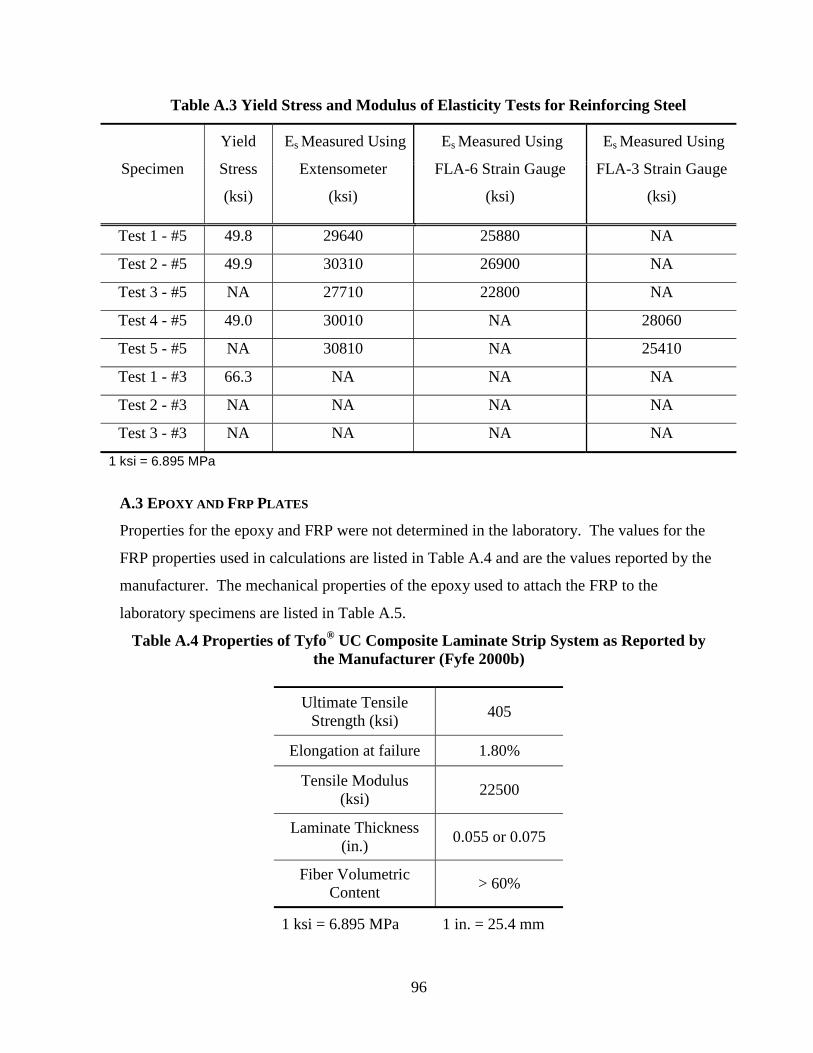
96
Table A.3 Yield Stress and Modulus of Elasticity Tests for Reinforcing Steel
Specimen
Yield
Stress
(ksi)
Es Measured Using
Extensometer
(ksi)
Es Measured Using
FLA-6 Strain Gauge
(ksi)
Es Measured Using
FLA-3 Strain Gauge
(ksi)
Test 1 - #5 49.8 29640 25880 NA
Test 2 - #5 49.9 30310 26900 NA
Test 3 - #5 NA 27710 22800 NA
Test 4 - #5 49.0 30010 NA 28060
Test 5 - #5 NA 30810 NA 25410
Test 1 - #3 66.3 NA NA NA
Test 2 - #3 NA NA NA NA
Test 3 - #3 NA NA NA NA
1 ksi = 6.895 MPa
A.3 EPOXY AND FRP PLATES
Properties for the epoxy and FRP were not determined in the laboratory. The values for the
FRP properties used in calculations are listed in Table A.4 and are the values reported by the
manufacturer. The mechanical properties of the epoxy used to attach the FRP to the
laboratory specimens are listed in Table A.5.
Table A.4 Properties of Tyfo® UC Composite Laminate Strip System as Reported by the Manufacturer (Fyfe 2000b)
Ultimate Tensile
Strength (ksi) 405
Elongation at failure 1.80%
Tensile Modulus (ksi) 22500
Laminate Thickness (in.) 0.055 or 0.075
Fiber Volumetric Content > 60%
1 ksi = 6.895 MPa 1 in. = 25.4 mm
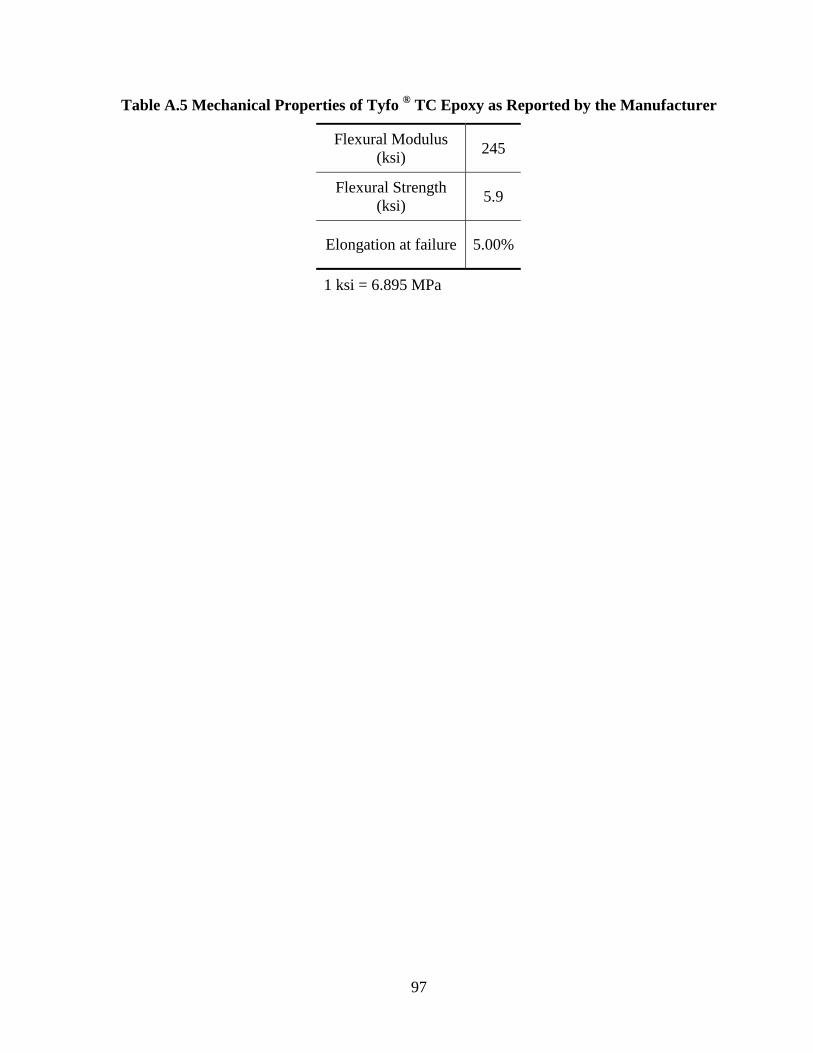
97
Table A.5 Mechanical Properties of Tyfo ® TC Epoxy as Reported by the Manufacturer
Flexural Modulus (ksi) 245
Flexural Strength (ksi) 5.9
Elongation at failure 5.00%
1 ksi = 6.895 MPa
98
APPENDIX B: APPARENT STRAIN CONVERSION
While performing tension tests on the reinforcing steel, it was discovered that different
modulus of elasticity values were exhibited depending on the type of measuring gauge used.
The values found using the 6 in. (152 mm) extensometer were approximately equal to the
universally accepted values. However, the modulus of elasticity found using the values
recorded from the strain gauges used in the laboratory specimens were considerably less.
Therefore, the strains measured in the laboratory specimens were converted to an apparent
strain in order to calculate the correct stress values for the steel reinforcement in the elastic
range. This appendix describes the process for converting the measured strain to an apparent
strain.
A.1 CONVERSION FACTOR
As described in Appendix A, tensile tests were performed on specimens cut from the tensile
reinforcing steel used in the laboratory specimens. Five bars were tested using a 6 in. (152
mm) extensometer and two types of strain gauges. Three bars with the extensometer and an
FLA-6 strain gauge were tested, and two with the extensometer and an FLA-3 strain gauge
were tested. Deflection data was recorded with the extensometer. Strain data was recorded
from the strain gauge using a Vishay Strain Indicator. Data was recorded for each device at
given load intervals up to a load corresponding to 75% of the yielding load. The specimens
were then unloaded. This procedure was repeated three times for each test specimen. A
corresponding modulus of elasticity was calculated for each data set. This led to the
discovery of the need to convert the measured strain from the strain gauges to an apparent
strain. The conversion factor was determined by finding the ratio of strain measured with the
extensometer to the strain found with each type strain gauge (Equation B.1). A separate
conversion factor was found for each type of strain gauge.
iSG
EXT
εε (B.1)
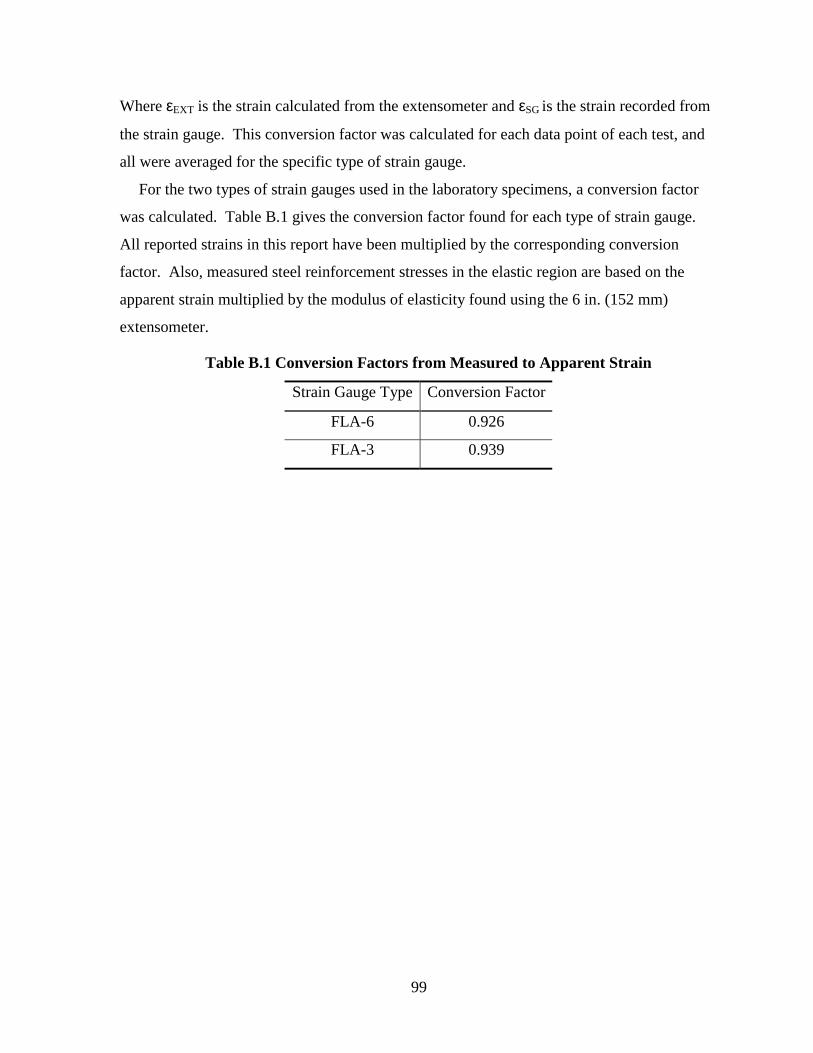
99
Where εEXT is the strain calculated from the extensometer and εSG is the strain recorded from
the strain gauge. This conversion factor was calculated for each data point of each test, and
all were averaged for the specific type of strain gauge.
For the two types of strain gauges used in the laboratory specimens, a conversion factor
was calculated. Table B.1 gives the conversion factor found for each type of strain gauge.
All reported strains in this report have been multiplied by the corresponding conversion
factor. Also, measured steel reinforcement stresses in the elastic region are based on the
apparent strain multiplied by the modulus of elasticity found using the 6 in. (152 mm)
extensometer.
Table B.1 Conversion Factors from Measured to Apparent Strain
Strain Gauge Type Conversion Factor
FLA-6 0.926
FLA-3 0.939
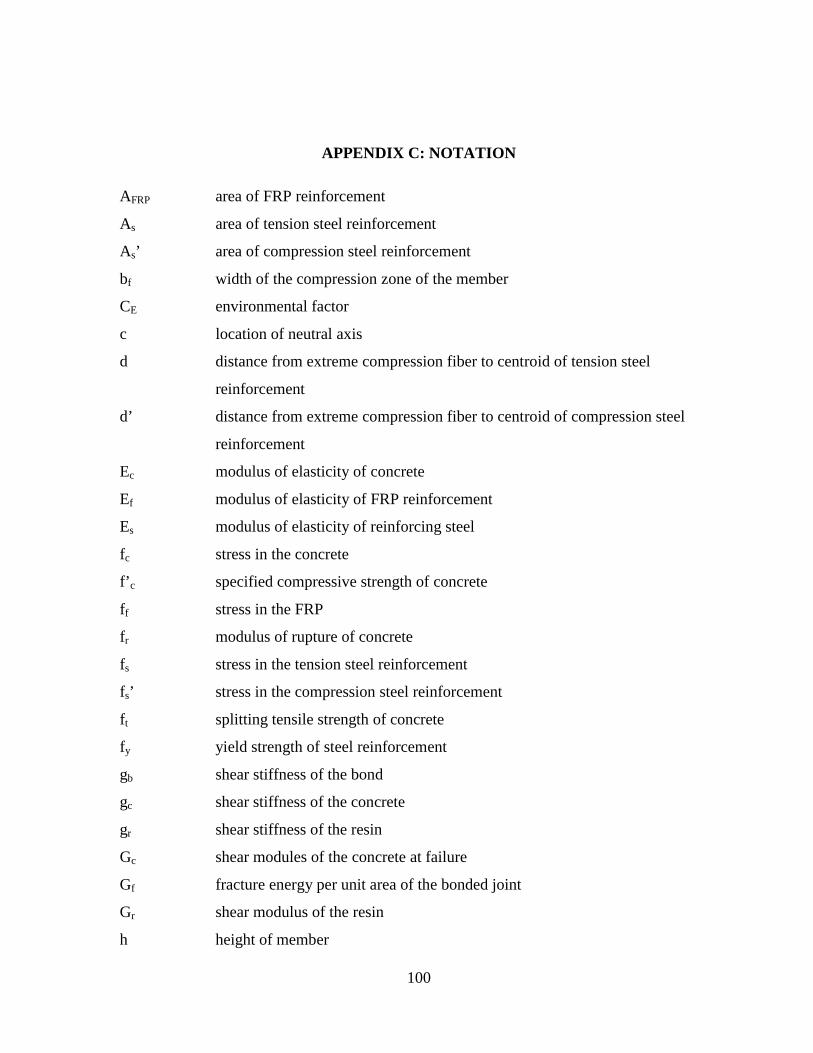
100
APPENDIX C: NOTATION
AFRP area of FRP reinforcement
As area of tension steel reinforcement
As’ area of compression steel reinforcement
bf width of the compression zone of the member
CE environmental factor
c location of neutral axis
d distance from extreme compression fiber to centroid of tension steel
reinforcement
d’ distance from extreme compression fiber to centroid of compression steel
reinforcement
Ec modulus of elasticity of concrete
Ef modulus of elasticity of FRP reinforcement
Es modulus of elasticity of reinforcing steel
fc stress in the concrete
f’c specified compressive strength of concrete
ff stress in the FRP
fr modulus of rupture of concrete
fs stress in the tension steel reinforcement
fs’ stress in the compression steel reinforcement
ft splitting tensile strength of concrete
fy yield strength of steel reinforcement
gb shear stiffness of the bond
gc shear stiffness of the concrete
gr shear stiffness of the resin
Gc shear modules of the concrete at failure
Gf fracture energy per unit area of the bonded joint
Gr shear modulus of the resin
h height of member
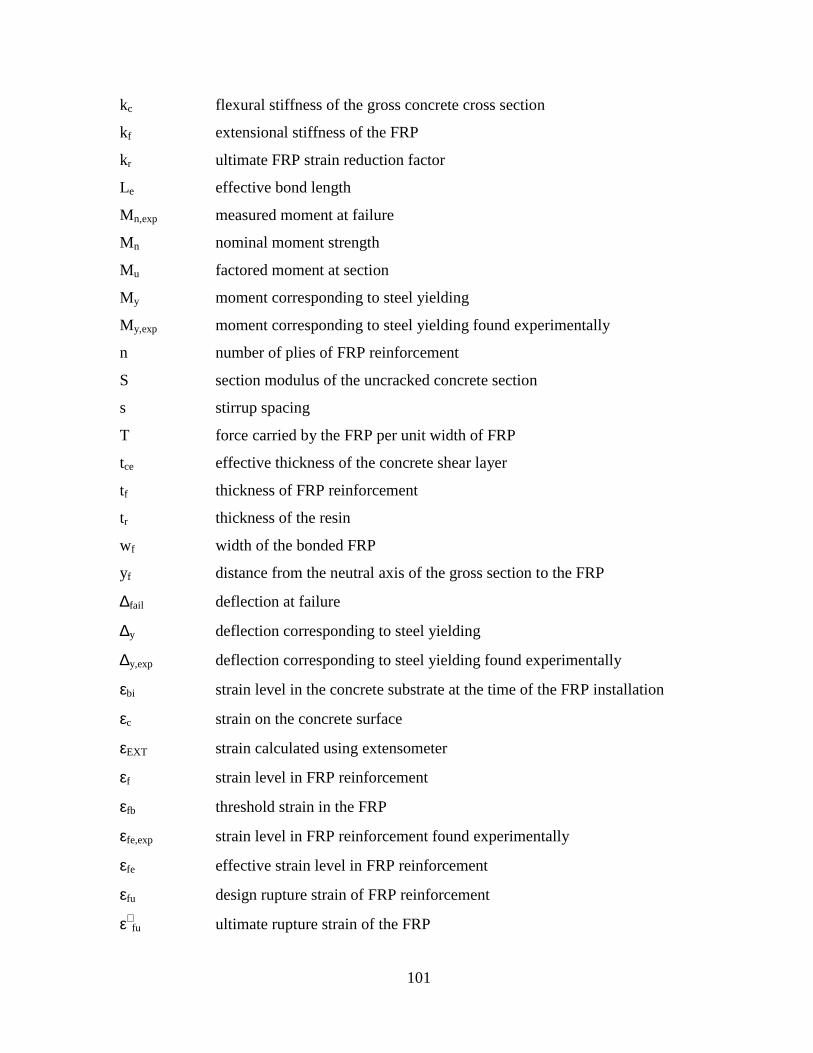
101
kc flexural stiffness of the gross concrete cross section
kf extensional stiffness of the FRP
kr ultimate FRP strain reduction factor
Le effective bond length
Mn,exp measured moment at failure
Mn nominal moment strength
Mu factored moment at section
My moment corresponding to steel yielding
My,exp moment corresponding to steel yielding found experimentally
n number of plies of FRP reinforcement
S section modulus of the uncracked concrete section
s stirrup spacing
T force carried by the FRP per unit width of FRP
tce effective thickness of the concrete shear layer
tf thickness of FRP reinforcement
tr thickness of the resin
wf width of the bonded FRP
yf distance from the neutral axis of the gross section to the FRP
∆fail deflection at failure
∆y deflection corresponding to steel yielding
∆y,exp deflection corresponding to steel yielding found experimentally
εbi strain level in the concrete substrate at the time of the FRP installation
εc strain on the concrete surface
εEXT strain calculated using extensometer
εf strain level in FRP reinforcement
εfb threshold strain in the FRP
εfe,exp strain level in FRP reinforcement found experimentally
εfe effective strain level in FRP reinforcement
εfu design rupture strain of FRP reinforcement
ε∗fu ultimate rupture strain of the FRP
102
εs strain in the tension steel reinforcement
εs’ strain in the compression steel reinforcement
εSG strain measured using a strain gauge
km bond-dependent coefficient for flexure
φ strength reduction factor
ρ steel tension reinforcement ratio
ρFRP FRP reinforcement ratio
τb allowable shear stress in the plane of the bond layer
τ(x) shear stress in the bond layer
ω mechanical reinforcement ratio
ψf additional FRP strength reduction factor