Embed Size (px)
Citation preview
1
Effects of the Quantitative Easing Policy: A Survey of
Empirical Analyses
Hiroshi Ugai
This paper surveys the empirical analyses that examine the effects of the Bank of Japan’s (BOJ’s) quantitative easing policy (QEP), which wasimplemented from March 2001 through March 2006. The survey confirmsa clear effect whereby the commitment to maintain the QEP fostered theexpectations that the zero interest rate would continue into the future,thereby lowering the yield curve centering on the short- to medium-termrange. There were also phases in which an increase in the current accountbalances held by financial institutions at the BOJ bolstered this expec-tation. While the results were mixed as to whether expansion of the monetary base and altering the composition of the BOJ’s balance sheet led to portfolio rebalancing, generally this effect, if any, was smaller thanthat stemming from the commitment. When viewing the QEP’s impact on Japan’s economy through various transmission channels, many of theanalyses suggest that the QEP created an accommodative environment in terms of corporate financing. In particular, the QEP contained finan-cial institutions’ funding costs from the market and staved off financialinstitutions’ funding uncertainties. The QEP’s effect on raising aggregatedemand and prices was often limited, due largely to the then progressingcorporate balance-sheet adjustment, as well as the zero bound constraint on interest rates.
Keywords: Zero interest rate policy; Quantitative easing policy; Commitment;Zero bound constraint on interest rates; Deflation
JEL Classification: E43, E44, E51, E52, E58
MONETARY AND ECONOMIC STUDIES/MARCH 2007
DO NOT REPRINT OR REPRODUCE WITHOUT PERMISSION.
Monetary Affairs Department, Bank of Japan (currently, General Manager, Okayama Branch) (E-mail: [email protected])
The author would like to thank Kosuke Aoki, London School of Economics, and many Bank ofJapan (BOJ) colleagues including Kunio Okina, Hideo Hayakawa, Shigenori Shiratsuka, NobuyukiOda, Takeshi Kimura, Koichiro Kamada, Naohiko Baba, Ippei Fujiwara, and Tomohiro Sugo fortheir valuable comments. All remaining errors are the author’s responsibility. Views expressed in thispaper are those of the author and do not necessarily reflect the official views of the BOJ.
I. Introduction
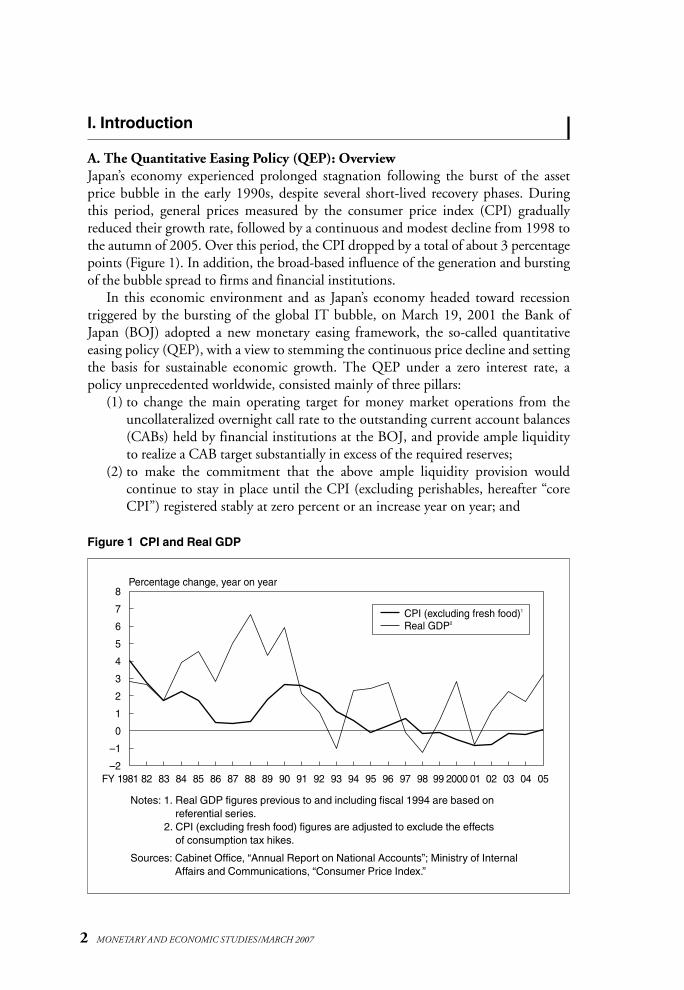
A. The Quantitative Easing Policy (QEP): OverviewJapan’s economy experienced prolonged stagnation following the burst of the assetprice bubble in the early 1990s, despite several short-lived recovery phases. Duringthis period, general prices measured by the consumer price index (CPI) graduallyreduced their growth rate, followed by a continuous and modest decline from 1998 tothe autumn of 2005. Over this period, the CPI dropped by a total of about 3 percentagepoints (Figure 1). In addition, the broad-based influence of the generation and burstingof the bubble spread to firms and financial institutions.
In this economic environment and as Japan’s economy headed toward recession triggered by the bursting of the global IT bubble, on March 19, 2001 the Bank of Japan (BOJ) adopted a new monetary easing framework, the so-called quantitative easing policy (QEP), with a view to stemming the continuous price decline and settingthe basis for sustainable economic growth. The QEP under a zero interest rate, a policy unprecedented worldwide, consisted mainly of three pillars:
(1) to change the main operating target for money market operations from theuncollateralized overnight call rate to the outstanding current account balances(CABs) held by financial institutions at the BOJ, and provide ample liquidityto realize a CAB target substantially in excess of the required reserves;
(2) to make the commitment that the above ample liquidity provision would continue to stay in place until the CPI (excluding perishables, hereafter “coreCPI”) registered stably at zero percent or an increase year on year; and
2 MONETARY AND ECONOMIC STUDIES/MARCH 2007
Figure 1 CPI and Real GDP
–2
–1
0
1
2
3
4
5
6
7
8
1981 82 83 84 85 86 87 88 89 90 91 92 93 94 95 96 97 98 99 2000 01 02 03 04 05
Percentage change, year on year
FY
CPI (excluding fresh food)1
Real GDP2
Notes: 1. Real GDP figures previous to and including fiscal 1994 are based on referential series.
2. CPI (excluding fresh food) figures are adjusted to exclude the effects of consumption tax hikes.
Sources: Cabinet Office, “Annual Report on National Accounts”; Ministry of InternalAffairs and Communications, “Consumer Price Index.”
(3) to increase the amount of outright purchases of long-term Japanese govern-ment bonds (JGBs), up to a ceiling of the outstanding balance of banknotesissued, should the BOJ consider such an increase to be necessary for providingliquidity smoothly.
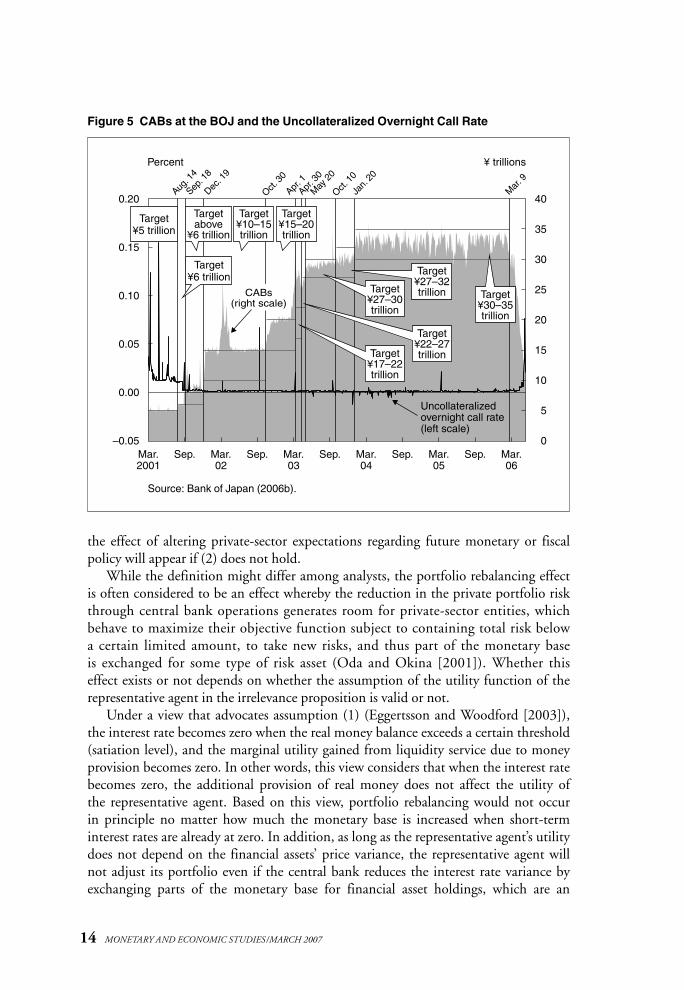
The transition of the QEP started in March 2001 with a CAB target of ¥5 trillion,a level higher than the required reserve level of ¥4 trillion.1 The target was then progressively raised in response to the deterioration of the economy, and was leftunchanged until the BOJ exited the QEP after the target was raised in January 2004to ¥30 trillion to ¥35 trillion. Reflecting the ample liquidity provision under the QEP,the uncollateralized overnight call rate declined to 0.001 percent, a level below the0.02–0.03 percent that was realized from 1999 to 2000 under the zero interest ratepolicy (ZIRP). To meet smoothly the CAB target, the BOJ gradually increased itspurchases of long-term JGBs from the initial pace of ¥400 billion per month, and setthe amount at ¥1,200 billion per month beginning in October 2002. As of the end of2005, the BOJ provided a monetary base2 worth ¥117 trillion, as its liability, in theform of CABs and cash. On the asset side, the BOJ’s holdings of long-term JGBsreached ¥63 trillion. Furthermore, from July 2003 to March 2006, as a limited-timemeasure, the BOJ purchased asset-backed securities with a view to supporting thedevelopment of the asset-backed securities market and strengthening the transmissionmechanism of monetary policy.3 The BOJ further clarified its commitment (item [2]of the commitment above) in October 2003.4 While the BOJ was also committedduring 1999–2000 under the ZIRP to “continue the ZIRP until deflationary concernis dispelled,” the commitment of the QEP differed from that of the ZIRP in that itlinked the commitment with the actual track record of the CPI.
The core CPI growth turned positive from November 2005, and the rate forJanuary 2006 announced in early March was 0.5 percent. On March 9, 2006, theBOJ stated that the year-on-year growth in the core CPI was expected to remain positive, and judged that the conditions laid out in the commitment under the QEPhad been fulfilled. Consequently, the BOJ exited the QEP and decided to change theoperating target of money market operations back to the uncollateralized overnightcall rate, and to encourage the rate to remain at effectively zero percent.
B. Purposes of This PaperThe QEP generated extensive debate both in Japan and abroad even before its adop-tion. For example, there was active debate over whether the BOJ should increase funds
3
Effects of the Quantitative Easing Policy: A Survey of Empirical Analyses
1. For details, see the Appendix.2. The monetary base is the sum of the BOJ CABs, banknotes, and coins in circulation (although in a strict sense, coins
in circulation are not included in the BOJ’s liabilities), and it is a concept that synthesizes the currency provided bythe BOJ.
3. Other than these measures, the BOJ determined to purchase stocks held by commercial banks from October 2002to end-September 2003, to overcome the nonperforming-loan (NPL) problem and ensure financial system stability.
4. Specifically, the BOJ clarified that its commitment to maintaining the QEP until the CPI registered stably zero percent or an increase year on year was underpinned by two conditions: the recent core CPI should register zero percent or above over a few months on average, and the prospective core CPI would not be expected to register belowzero percent. In addition, the BOJ stated that these conditions were the necessary conditions, and there might becases in which the BOJ judged it appropriate from an economic and price standpoint to continue with the QEP evenif these two conditions were fulfilled.
provision beyond interest rate manipulation when the BOJ adopted the ZIRP in1999.5 Furthermore, debates continued after the BOJ adopted the QEP, ranging from what effects could be expected from the QEP and whether the BOJ should further increase the CABs to exit from deflation to whether new measures should beintroduced.6 At the Monetary Policy Meeting that decided on the introduction of the QEP, the BOJ revealed, upon referring that the effects of an increase in quantitywere uncertain, that the Bank would “continue examining what would be the effects of increasing the outstanding balance of current accounts at the Bank as well as the possibility of a further easing through an increase in the outstanding balance.”7 Whilethese debates have yet to reach any theoretical or empirical consensus, the data obtainedand theoretical and empirical research conducted during the five-year period of theQEP nevertheless seem to have gradually converged with the views in academia.Meanwhile, the BOJ assessed the effects of the QEP in its October 2005 Outlook forEconomic Activity and Prices as follows:8
When there were strong concerns over the stability of the financial system, the ample provision of liquidity by the Bank, which met financial institutions’liquidity demand, stabilized financial markets and maintained accommodativefinancial conditions, and contributed to averting a contraction in economicactivity. In financial markets, the Bank’s ample provision of liquidity pushedshort-term interest rates to practically zero percent. Longer-term interest rateshave stably remained at low levels because the commitment by the Bank has ledthe market to expect that short-term interest rates will remain at zero percentwhen prices continue to decline slightly.9
To reach such an assessment, various empirical analyses have been conducted withinand outside the BOJ. Arguably, several difficult issues are involved in gauging the effectsof the QEP compared with those of normal interest rate policy. For example, there is aneed to differentiate the effects associated with lowering the policy rate to zero andthose manifested through expectations and changes in monetary aggregate indicators.In addition, there are constraints in that there has never been any previous experienceof the QEP either in Japan or abroad. Given such constraints, the stock of empiricalresearch is not necessarily sufficient at this juncture. Nevertheless, it is useful to surveythe previous empirical analyses.10
This paper examines the previous empirical analyses on the effects of the QEP byspecifying the transmission channels through which the effects work and identifyingtheir magnitudes, and by capturing the QEP’s overall effects on the economy. First,
4 MONETARY AND ECONOMIC STUDIES/MARCH 2007
5. For detailed discussions, see Bernanke (2000), Iwata (2000), Kuttner and Posen (2001), Svensson (2001), Okina(1999a, b), McKinnon (1999), Meltzer (1999a), and Oda and Okina (2001).
6. Such discussions are presented in Svensson (2003), Coenen and Wieland (2003), Bernanke (2003), Iwata (2001),Fukao (2002), Shirakawa (2002), and Komiya (2002).
7. Bank of Japan (2001, p. 80).8. Fukui (2006) also assesses the effects of the QEP.9. Bank of Japan (2006a, pp. 63–64).
10. In the latter stage of the QEP, Ueda (2005) tried to summarize Japan’s monetary policy under a zero bound constraint of interest rates.
this paper examines the transmission mechanism of the QEP’s effects. The effects areclassified into three types based on operational measures, and three questions are posedfor the effects through each specific transmission channel.11 The first question is, amongthe effects of the QEP, what is the extent of the effect of the commitment to maintainthe QEP on the expected future path of short-term interest rates observed (SectionII.A). The second question is through which channel and to what extent are the effectsof expanding the size of the BOJ’s balance sheet by increasing the CABs identified(Section II.B). The third question is through which channel and to what extent are theeffects of altering the composition of the BOJ’s balance sheet by increasing purchases oflong-term JGBs identified (Section II.C). The reason why one can consider the effectsof the QEP in these three classifications based on operational measures is that eachoperational measure is not necessarily a precondition for the other operational measureto become effective, and this makes it possible to grasp the effects independently. Forexample, the commitment referred to in the first question could be fulfilled just bycommitting to maintain a zero interest rate over time even if the BOJ did not provideample liquidity far in excess of the required reserves. Altering the composition of the BOJ’s balance sheet, referred to in the third question, could take place withoutexpanding the size of the balance sheet through an increase in the purchase of long-term JGBs and a decrease in the purchase of short-term JGBs.12 In taking up theeffects according to individual operational measures, this paper adopts the approach ofjudging whether the transmission channels exist by measuring the extent of the effectson the yields of various financial assets in financial and capital markets.
The paper then reviews the extent to which the QEP affected the economy throughthe identified transmission mechanism. Specifically, the paper poses several questionswith respect to the comprehensive effects of the QEP. The first question is whether theQEP had the effect of containing the financial system uncertainty that had destabilizedthe economy (Section III.A). This question is asked because financial system uncer-tainty is considered to have played some role, while opinions vary as to the extent,behind the prolonged stagnation of Japan’s economy from the 1990s, and that furtherdeterioration of financial system uncertainty could have, through contraction of business activity, sharply worsened the economic and price situation. The second question is to what extent the QEP contributed to raising aggregate demand and prices (Section III.B). If the analyses indicate that this effect in raising aggregatedemand and prices was weak, the paper will consider whether that was because thetransmission channel itself was weak or because Japan’s economic structure hadbecome less sensitive to monetary easing amid mounting adjustment pressures. Finally,the paper summarizes the conclusions that emerge from the survey, and points outissues for future research (Section IV).
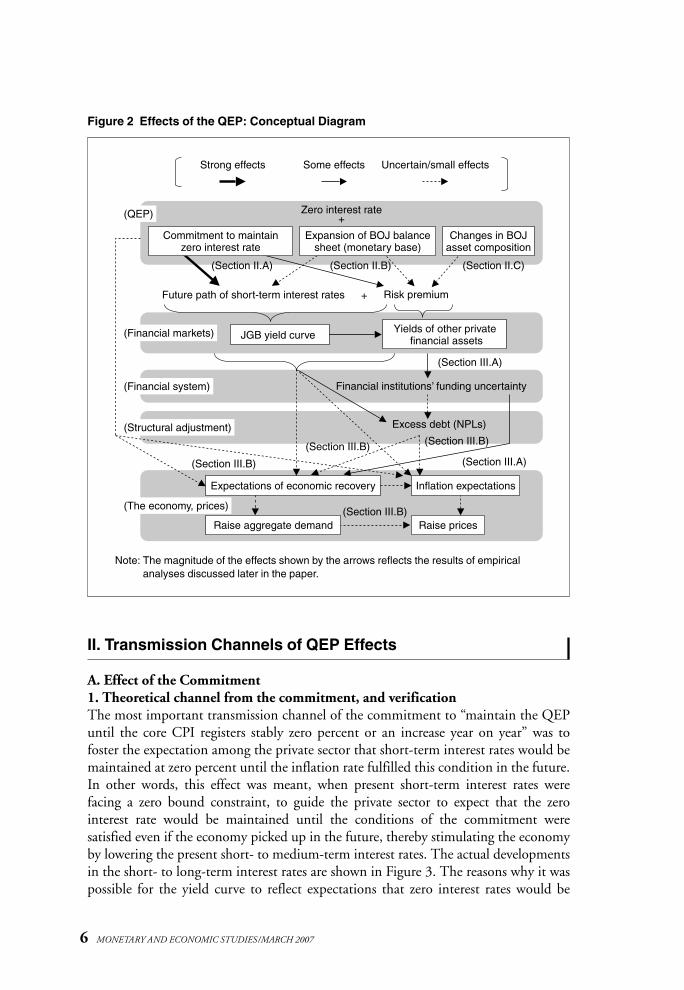
Figure 2 presents a conceptual diagram of the transmission channels and effects ofthe QEP on which the examinations in the following sections are based.
5
Effects of the Quantitative Easing Policy: A Survey of Empirical Analyses
11. There are several possible ways to classify the transmission channels of the policy effects; the classification adoptedhere is consistent with that in Bernanke and Reinhart (2004). While various paths in terms of economic theorycould have been weaved into each classification, the judgment here is that the most useful way is to link the policyeffects with the policy measures.
12. However, there might be a case where increasing the quantity of CABs could not be achieved without an increasein the purchase of long-term JGBs.
II. Transmission Channels of QEP Effects
A. Effect of the Commitment1. Theoretical channel from the commitment, and verificationThe most important transmission channel of the commitment to “maintain the QEPuntil the core CPI registers stably zero percent or an increase year on year” was to foster the expectation among the private sector that short-term interest rates would be maintained at zero percent until the inflation rate fulfilled this condition in the future.In other words, this effect was meant, when present short-term interest rates were facing a zero bound constraint, to guide the private sector to expect that the zero interest rate would be maintained until the conditions of the commitment were satisfied even if the economy picked up in the future, thereby stimulating the economyby lowering the present short- to medium-term interest rates. The actual developmentsin the short- to long-term interest rates are shown in Figure 3. The reasons why it waspossible for the yield curve to reflect expectations that zero interest rates would be
6 MONETARY AND ECONOMIC STUDIES/MARCH 2007
Figure 2 Effects of the QEP: Conceptual Diagram
Strong effects Some effects Uncertain/small effects
(Financial system) Financial institutions’ funding uncertainty
Zero interest rate
Commitment to maintainzero interest rate
Expansion of BOJ balancesheet (monetary base)
Changes in BOJasset composition
+
(Section II.A) (Section II.B) (Section II.C)
+Future path of short-term interest rates Risk premium
(Financial markets) Yields of other private financial assets
(Section III.A)
(The economy, prices)
Inflation expectations
Raise prices
Excess debt (NPLs)(Structural adjustment)
(Section III.B) (Section III.B)
(Section III.B) (Section III.A)
(Section III.B)
JGB yield curve
Expectations of economic recovery
Raise aggregate demand
(QEP)
Note: The magnitude of the effects shown by the arrows reflects the results of empiricalanalyses discussed later in the paper.
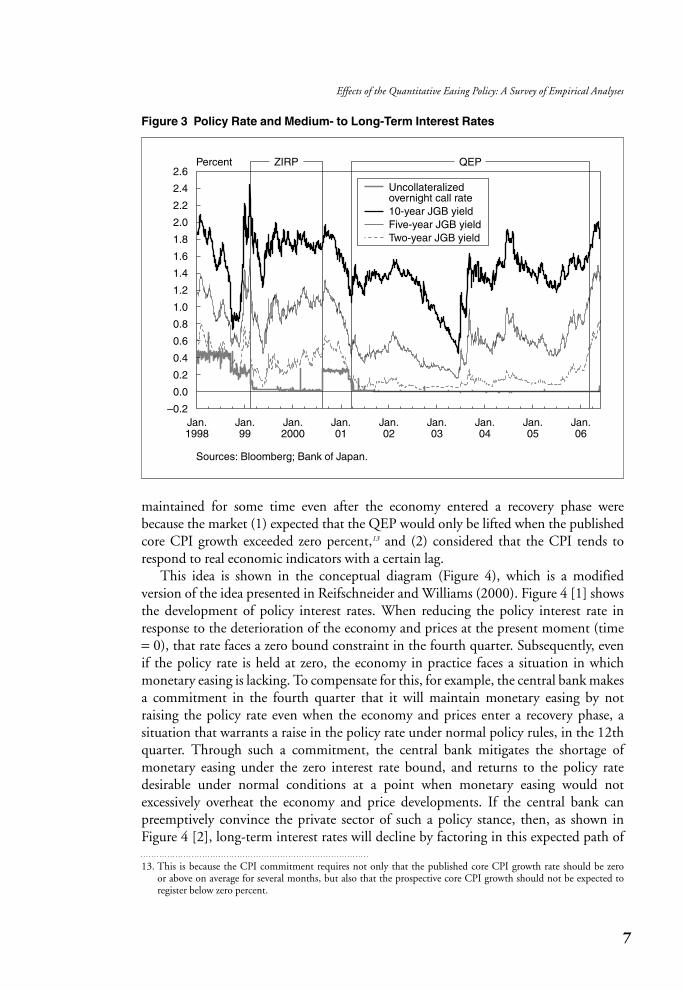
maintained for some time even after the economy entered a recovery phase werebecause the market (1) expected that the QEP would only be lifted when the publishedcore CPI growth exceeded zero percent,13 and (2) considered that the CPI tends torespond to real economic indicators with a certain lag.
This idea is shown in the conceptual diagram (Figure 4), which is a modified version of the idea presented in Reifschneider and Williams (2000). Figure 4 [1] showsthe development of policy interest rates. When reducing the policy interest rate inresponse to the deterioration of the economy and prices at the present moment (time= 0), that rate faces a zero bound constraint in the fourth quarter. Subsequently, evenif the policy rate is held at zero, the economy in practice faces a situation in which monetary easing is lacking. To compensate for this, for example, the central bank makesa commitment in the fourth quarter that it will maintain monetary easing by not raising the policy rate even when the economy and prices enter a recovery phase, a situation that warrants a raise in the policy rate under normal policy rules, in the 12thquarter. Through such a commitment, the central bank mitigates the shortage of monetary easing under the zero interest rate bound, and returns to the policy rate desirable under normal conditions at a point when monetary easing would not excessively overheat the economy and price developments. If the central bank can preemptively convince the private sector of such a policy stance, then, as shown inFigure 4 [2], long-term interest rates will decline by factoring in this expected path of
7
Effects of the Quantitative Easing Policy: A Survey of Empirical Analyses
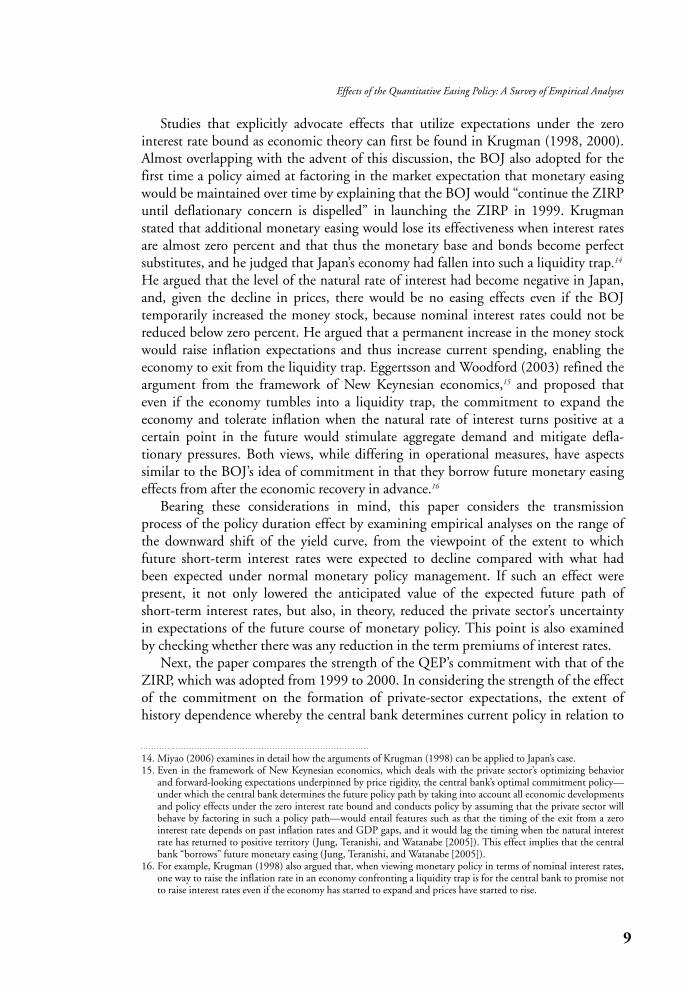
Figure 3 Policy Rate and Medium- to Long-Term Interest Rates
–0.2
0.0
0.2
0.4
0.6
0.8
1.0
1.2
1.4
1.6
1.8
2.0
2.2
2.4
2.6QEPZIRPPercent
Jan.1998
Jan.99
Jan.2000
Jan.01
Jan.02
Jan.03
Jan.04
Jan.05
Jan.06
Uncollateralized overnight call rate10-year JGB yieldFive-year JGB yieldTwo-year JGB yield
Sources: Bloomberg; Bank of Japan.
13. This is because the CPI commitment requires not only that the published core CPI growth rate should be zero or above on average for several months, but also that the prospective core CPI growth should not be expected toregister below zero percent.
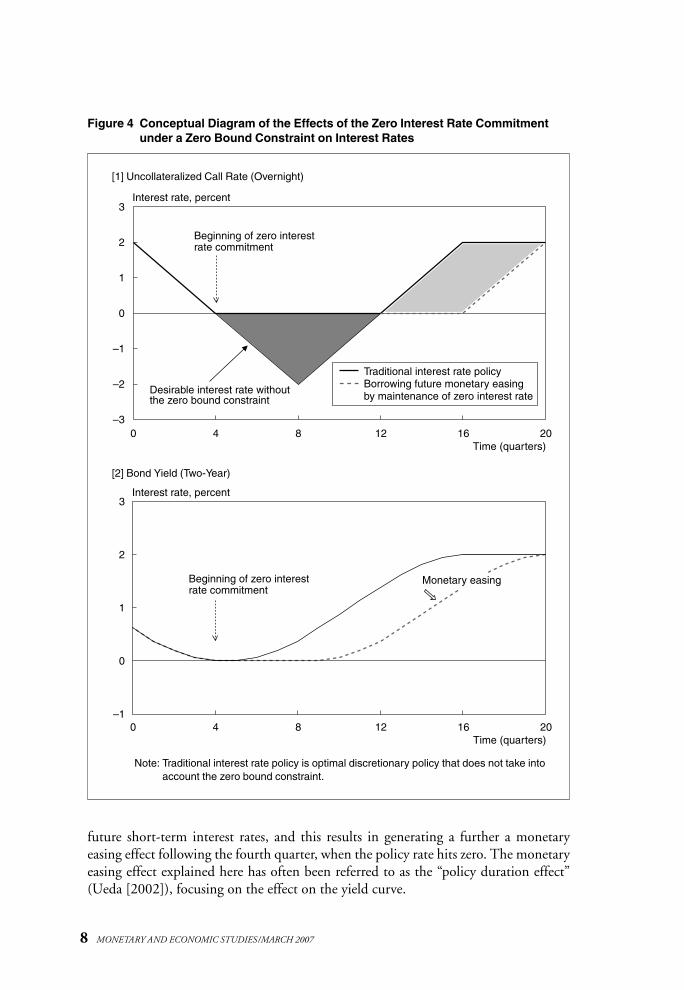
future short-term interest rates, and this results in generating a further a monetary easing effect following the fourth quarter, when the policy rate hits zero. The monetaryeasing effect explained here has often been referred to as the “policy duration effect”(Ueda [2002]), focusing on the effect on the yield curve.
8 MONETARY AND ECONOMIC STUDIES/MARCH 2007
Figure 4 Conceptual Diagram of the Effects of the Zero Interest Rate Commitmentunder a Zero Bound Constraint on Interest Rates
–1
0
1
2
3
–3
–2
–1
0
1
2
3
0 4 8 12 16 20
0 4 8 12 16 20
Interest rate, percent
Beginning of zero interest rate commitment
Desirable interest rate without the zero bound constraint
Beginning of zero interest rate commitment
Interest rate, percent
Time (quarters)
Time (quarters)
Monetary easing
Traditional interest rate policyBorrowing future monetary easing by maintenance of zero interest rate
[1] Uncollateralized Call Rate (Overnight)
[2] Bond Yield (Two-Year)
Note: Traditional interest rate policy is optimal discretionary policy that does not take intoaccount the zero bound constraint.
Studies that explicitly advocate effects that utilize expectations under the zerointerest rate bound as economic theory can first be found in Krugman (1998, 2000).Almost overlapping with the advent of this discussion, the BOJ also adopted for thefirst time a policy aimed at factoring in the market expectation that monetary easingwould be maintained over time by explaining that the BOJ would “continue the ZIRPuntil deflationary concern is dispelled” in launching the ZIRP in 1999. Krugmanstated that additional monetary easing would lose its effectiveness when interest ratesare almost zero percent and that thus the monetary base and bonds become perfectsubstitutes, and he judged that Japan’s economy had fallen into such a liquidity trap.14
He argued that the level of the natural rate of interest had become negative in Japan,and, given the decline in prices, there would be no easing effects even if the BOJ temporarily increased the money stock, because nominal interest rates could not bereduced below zero percent. He argued that a permanent increase in the money stockwould raise inflation expectations and thus increase current spending, enabling theeconomy to exit from the liquidity trap. Eggertsson and Woodford (2003) refined theargument from the framework of New Keynesian economics,15 and proposed thateven if the economy tumbles into a liquidity trap, the commitment to expand theeconomy and tolerate inflation when the natural rate of interest turns positive at a certain point in the future would stimulate aggregate demand and mitigate defla-tionary pressures. Both views, while differing in operational measures, have aspectssimilar to the BOJ’s idea of commitment in that they borrow future monetary easingeffects from after the economic recovery in advance.16
Bearing these considerations in mind, this paper considers the transmissionprocess of the policy duration effect by examining empirical analyses on the range ofthe downward shift of the yield curve, from the viewpoint of the extent to whichfuture short-term interest rates were expected to decline compared with what hadbeen expected under normal monetary policy management. If such an effect were present, it not only lowered the anticipated value of the expected future path of short-term interest rates, but also, in theory, reduced the private sector’s uncertainty in expectations of the future course of monetary policy. This point is also examined by checking whether there was any reduction in the term premiums of interest rates.
Next, the paper compares the strength of the QEP’s commitment with that of theZIRP, which was adopted from 1999 to 2000. In considering the strength of the effectof the commitment on the formation of private-sector expectations, the extent of history dependence whereby the central bank determines current policy in relation to
9
Effects of the Quantitative Easing Policy: A Survey of Empirical Analyses
14. Miyao (2006) examines in detail how the arguments of Krugman (1998) can be applied to Japan’s case.15. Even in the framework of New Keynesian economics, which deals with the private sector’s optimizing behavior
and forward-looking expectations underpinned by price rigidity, the central bank’s optimal commitment policy—under which the central bank determines the future policy path by taking into account all economic developmentsand policy effects under the zero interest rate bound and conducts policy by assuming that the private sector willbehave by factoring in such a policy path—would entail features such as that the timing of the exit from a zerointerest rate depends on past inflation rates and GDP gaps, and it would lag the timing when the natural interestrate has returned to positive territory (Jung, Teranishi, and Watanabe [2005]). This effect implies that the centralbank “borrows” future monetary easing (Jung, Teranishi, and Watanabe [2005]).
16. For example, Krugman (1998) also argued that, when viewing monetary policy in terms of nominal interest rates,one way to raise the inflation rate in an economy confronting a liquidity trap is for the central bank to promise notto raise interest rates even if the economy has started to expand and prices have started to rise.
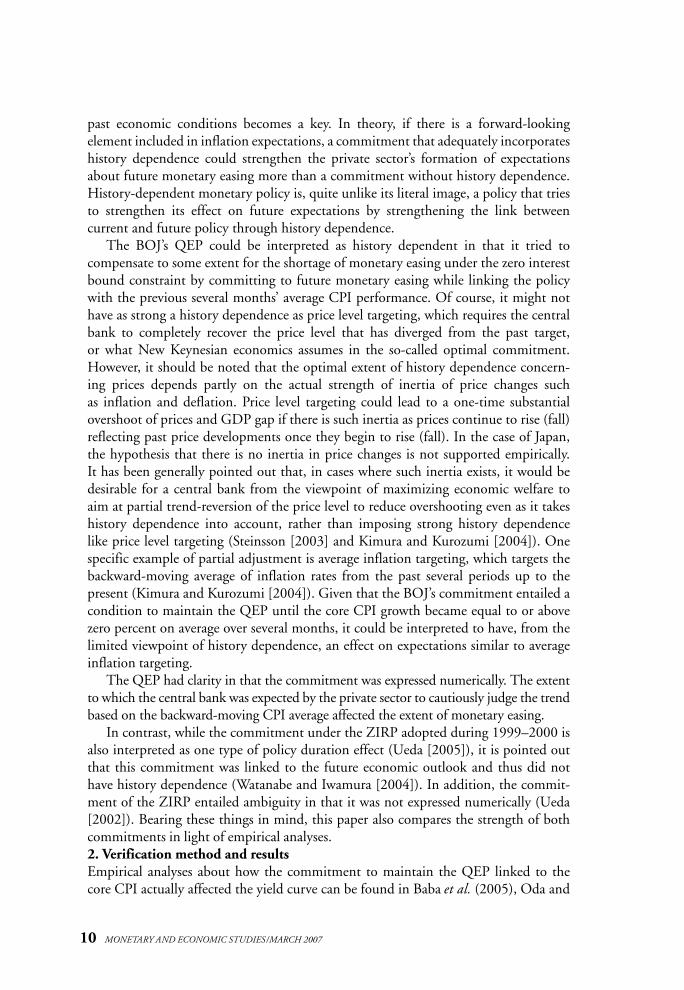
past economic conditions becomes a key. In theory, if there is a forward-looking element included in inflation expectations, a commitment that adequately incorporateshistory dependence could strengthen the private sector’s formation of expectationsabout future monetary easing more than a commitment without history dependence.History-dependent monetary policy is, quite unlike its literal image, a policy that triesto strengthen its effect on future expectations by strengthening the link between current and future policy through history dependence.
The BOJ’s QEP could be interpreted as history dependent in that it tried to compensate to some extent for the shortage of monetary easing under the zero interestbound constraint by committing to future monetary easing while linking the policywith the previous several months’ average CPI performance. Of course, it might nothave as strong a history dependence as price level targeting, which requires the centralbank to completely recover the price level that has diverged from the past target, or what New Keynesian economics assumes in the so-called optimal commitment.However, it should be noted that the optimal extent of history dependence concern-ing prices depends partly on the actual strength of inertia of price changes such as inflation and deflation. Price level targeting could lead to a one-time substantialovershoot of prices and GDP gap if there is such inertia as prices continue to rise (fall)reflecting past price developments once they begin to rise (fall). In the case of Japan,the hypothesis that there is no inertia in price changes is not supported empirically. It has been generally pointed out that, in cases where such inertia exists, it would bedesirable for a central bank from the viewpoint of maximizing economic welfare toaim at partial trend-reversion of the price level to reduce overshooting even as it takeshistory dependence into account, rather than imposing strong history dependencelike price level targeting (Steinsson [2003] and Kimura and Kurozumi [2004]). Onespecific example of partial adjustment is average inflation targeting, which targets thebackward-moving average of inflation rates from the past several periods up to thepresent (Kimura and Kurozumi [2004]). Given that the BOJ’s commitment entailed acondition to maintain the QEP until the core CPI growth became equal to or abovezero percent on average over several months, it could be interpreted to have, from thelimited viewpoint of history dependence, an effect on expectations similar to averageinflation targeting.
The QEP had clarity in that the commitment was expressed numerically. The extentto which the central bank was expected by the private sector to cautiously judge the trendbased on the backward-moving CPI average affected the extent of monetary easing.
In contrast, while the commitment under the ZIRP adopted during 1999–2000 isalso interpreted as one type of policy duration effect (Ueda [2005]), it is pointed outthat this commitment was linked to the future economic outlook and thus did nothave history dependence (Watanabe and Iwamura [2004]). In addition, the commit-ment of the ZIRP entailed ambiguity in that it was not expressed numerically (Ueda[2002]). Bearing these things in mind, this paper also compares the strength of bothcommitments in light of empirical analyses.2. Verification method and resultsEmpirical analyses about how the commitment to maintain the QEP linked to thecore CPI actually affected the yield curve can be found in Baba et al. (2005), Oda and
10 MONETARY AND ECONOMIC STUDIES/MARCH 2007
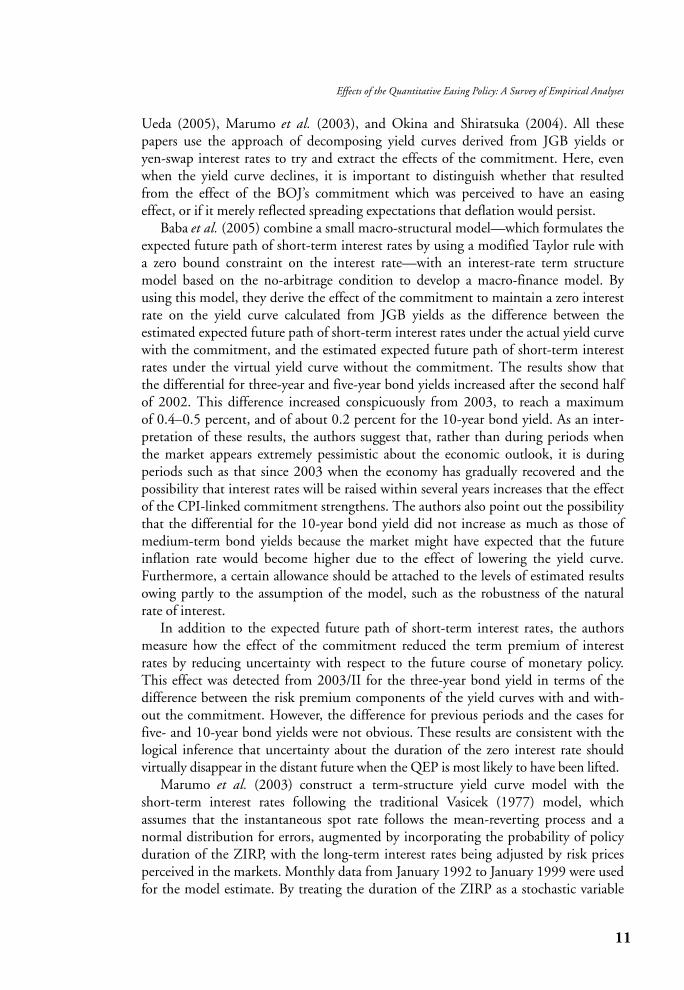
Ueda (2005), Marumo et al. (2003), and Okina and Shiratsuka (2004). All thesepapers use the approach of decomposing yield curves derived from JGB yields or yen-swap interest rates to try and extract the effects of the commitment. Here, evenwhen the yield curve declines, it is important to distinguish whether that resultedfrom the effect of the BOJ’s commitment which was perceived to have an easingeffect, or if it merely reflected spreading expectations that deflation would persist.
Baba et al. (2005) combine a small macro-structural model—which formulates theexpected future path of short-term interest rates by using a modified Taylor rule witha zero bound constraint on the interest rate—with an interest-rate term structuremodel based on the no-arbitrage condition to develop a macro-finance model. Byusing this model, they derive the effect of the commitment to maintain a zero interestrate on the yield curve calculated from JGB yields as the difference between the estimated expected future path of short-term interest rates under the actual yield curvewith the commitment, and the estimated expected future path of short-term interestrates under the virtual yield curve without the commitment. The results show that the differential for three-year and five-year bond yields increased after the second halfof 2002. This difference increased conspicuously from 2003, to reach a maximum of 0.4–0.5 percent, and of about 0.2 percent for the 10-year bond yield. As an inter-pretation of these results, the authors suggest that, rather than during periods whenthe market appears extremely pessimistic about the economic outlook, it is duringperiods such as that since 2003 when the economy has gradually recovered and the possibility that interest rates will be raised within several years increases that the effectof the CPI-linked commitment strengthens. The authors also point out the possibilitythat the differential for the 10-year bond yield did not increase as much as those ofmedium-term bond yields because the market might have expected that the futureinflation rate would become higher due to the effect of lowering the yield curve.Furthermore, a certain allowance should be attached to the levels of estimated resultsowing partly to the assumption of the model, such as the robustness of the natural rate of interest.
In addition to the expected future path of short-term interest rates, the authorsmeasure how the effect of the commitment reduced the term premium of interestrates by reducing uncertainty with respect to the future course of monetary policy.This effect was detected from 2003/II for the three-year bond yield in terms of thedifference between the risk premium components of the yield curves with and with-out the commitment. However, the difference for previous periods and the cases forfive- and 10-year bond yields were not obvious. These results are consistent with thelogical inference that uncertainty about the duration of the zero interest rate should virtually disappear in the distant future when the QEP is most likely to have been lifted.
Marumo et al. (2003) construct a term-structure yield curve model with the short-term interest rates following the traditional Vasicek (1977) model, whichassumes that the instantaneous spot rate follows the mean-reverting process and a normal distribution for errors, augmented by incorporating the probability of policyduration of the ZIRP, with the long-term interest rates being adjusted by risk pricesperceived in the markets. Monthly data from January 1992 to January 1999 were usedfor the model estimate. By treating the duration of the ZIRP as a stochastic variable
11
Effects of the Quantitative Easing Policy: A Survey of Empirical Analyses
and estimating how market participants assumed the length of policy duration basedon data after 1999, they find that it grew longer following adoption of the QEPtoward the end of 2002.
Okina and Shiratsuka (2004) break down the forward rate derived from dailyeuroyen and yen swap interest rates data by using an extended version of the Nelsonand Siegel (1987) model, and estimate how the length of the policy duration effectchanges in different phases. They show that the policy duration effect strengthenedonce in the first half of 2001 when the QEP was adopted, and strengthened againfrom the spring of 2002, and estimate the expected duration of the policy to be some2.5 years as of the end of 2002. Contrary to Baba et al. (2005), Okina and Shiratsuka(2004) attribute the strengthening of the effect to the strengthening of market partici-pants’ expectations that deflation would be protracted for years given the decline inaverage long-term forward rates, on which the policy duration effect would have littleimpact. The difference in these papers’ interpretations may turn on whether theempirical analyses fully include the data for 2003.
Based on the above-mentioned empirical analyses, this paper now proceeds to com-pare the strength of the commitment effect under the QEP with that under the ZIRP,and to check whether the core CPI commitment had a stronger effect on lowering theyield curve than the commitment linked to dispelling future deflationary concerns.
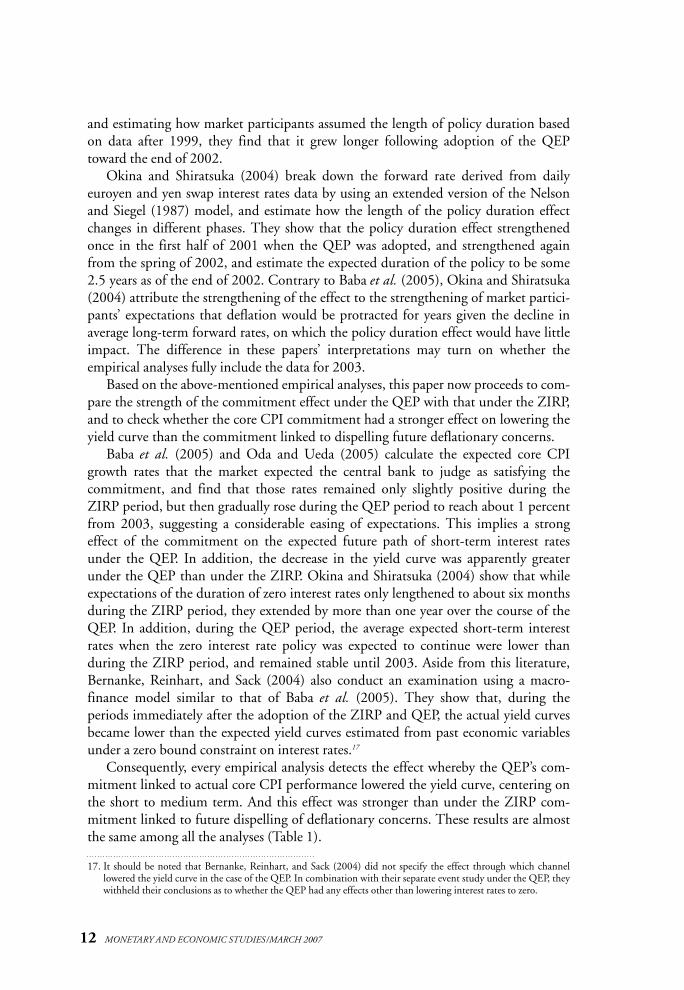
Baba et al. (2005) and Oda and Ueda (2005) calculate the expected core CPIgrowth rates that the market expected the central bank to judge as satisfying the commitment, and find that those rates remained only slightly positive during theZIRP period, but then gradually rose during the QEP period to reach about 1 percentfrom 2003, suggesting a considerable easing of expectations. This implies a strongeffect of the commitment on the expected future path of short-term interest ratesunder the QEP. In addition, the decrease in the yield curve was apparently greaterunder the QEP than under the ZIRP. Okina and Shiratsuka (2004) show that whileexpectations of the duration of zero interest rates only lengthened to about six monthsduring the ZIRP period, they extended by more than one year over the course of theQEP. In addition, during the QEP period, the average expected short-term interestrates when the zero interest rate policy was expected to continue were lower than during the ZIRP period, and remained stable until 2003. Aside from this literature,Bernanke, Reinhart, and Sack (2004) also conduct an examination using a macro-finance model similar to that of Baba et al. (2005). They show that, during the periods immediately after the adoption of the ZIRP and QEP, the actual yield curvesbecame lower than the expected yield curves estimated from past economic variablesunder a zero bound constraint on interest rates.17
Consequently, every empirical analysis detects the effect whereby the QEP’s com-mitment linked to actual core CPI performance lowered the yield curve, centering onthe short to medium term. And this effect was stronger than under the ZIRP com-mitment linked to future dispelling of deflationary concerns. These results are almostthe same among all the analyses (Table 1).
12 MONETARY AND ECONOMIC STUDIES/MARCH 2007
17. It should be noted that Bernanke, Reinhart, and Sack (2004) did not specify the effect through which channellowered the yield curve in the case of the QEP. In combination with their separate event study under the QEP, theywithheld their conclusions as to whether the QEP had any effects other than lowering interest rates to zero.
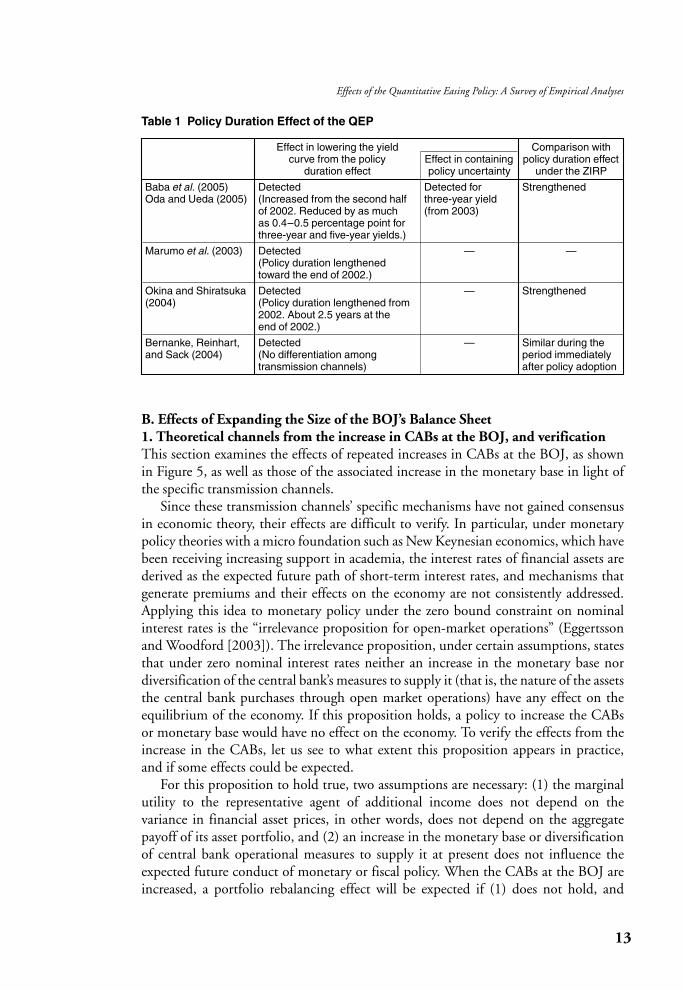
B. Effects of Expanding the Size of the BOJ’s Balance Sheet1. Theoretical channels from the increase in CABs at the BOJ, and verificationThis section examines the effects of repeated increases in CABs at the BOJ, as shownin Figure 5, as well as those of the associated increase in the monetary base in light ofthe specific transmission channels.
Since these transmission channels’ specific mechanisms have not gained consensusin economic theory, their effects are difficult to verify. In particular, under monetarypolicy theories with a micro foundation such as New Keynesian economics, which havebeen receiving increasing support in academia, the interest rates of financial assets arederived as the expected future path of short-term interest rates, and mechanisms thatgenerate premiums and their effects on the economy are not consistently addressed.Applying this idea to monetary policy under the zero bound constraint on nominalinterest rates is the “irrelevance proposition for open-market operations” (Eggertssonand Woodford [2003]). The irrelevance proposition, under certain assumptions, statesthat under zero nominal interest rates neither an increase in the monetary base nordiversification of the central bank’s measures to supply it (that is, the nature of the assetsthe central bank purchases through open market operations) have any effect on theequilibrium of the economy. If this proposition holds, a policy to increase the CABs or monetary base would have no effect on the economy. To verify the effects from theincrease in the CABs, let us see to what extent this proposition appears in practice, and if some effects could be expected.
For this proposition to hold true, two assumptions are necessary: (1) the marginalutility to the representative agent of additional income does not depend on the variance in financial asset prices, in other words, does not depend on the aggregatepayoff of its asset portfolio, and (2) an increase in the monetary base or diversificationof central bank operational measures to supply it at present does not influence theexpected future conduct of monetary or fiscal policy. When the CABs at the BOJ areincreased, a portfolio rebalancing effect will be expected if (1) does not hold, and
13
Effects of the Quantitative Easing Policy: A Survey of Empirical Analyses
Table 1 Policy Duration Effect of the QEP
Effect in lowering the yield Comparison with curve from the policy Effect in containing policy duration effect
duration effect policy uncertainty under the ZIRP
Baba et al. (2005)Oda and Ueda (2005)
Marumo et al. (2003)
Okina and Shiratsuka(2004)
Bernanke, Reinhart,and Sack (2004)
Detected (Increased from the second halfof 2002. Reduced by as much as 0.4–0.5 percentage point forthree-year and five-year yields.)
Detected(Policy duration lengthenedtoward the end of 2002.)
Detected(Policy duration lengthened from2002. About 2.5 years at the end of 2002.)
Detected(No differentiation among transmission channels)
Detected for three-year yield (from 2003)
—
—
—
Strengthened
—
Strengthened
Similar during theperiod immediatelyafter policy adoption
the effect of altering private-sector expectations regarding future monetary or fiscalpolicy will appear if (2) does not hold.
While the definition might differ among analysts, the portfolio rebalancing effectis often considered to be an effect whereby the reduction in the private portfolio riskthrough central bank operations generates room for private-sector entities, whichbehave to maximize their objective function subject to containing total risk below a certain limited amount, to take new risks, and thus part of the monetary base is exchanged for some type of risk asset (Oda and Okina [2001]). Whether this effect exists or not depends on whether the assumption of the utility function of therepresentative agent in the irrelevance proposition is valid or not.
Under a view that advocates assumption (1) (Eggertsson and Woodford [2003]),the interest rate becomes zero when the real money balance exceeds a certain threshold(satiation level), and the marginal utility gained from liquidity service due to moneyprovision becomes zero. In other words, this view considers that when the interest ratebecomes zero, the additional provision of real money does not affect the utility of the representative agent. Based on this view, portfolio rebalancing would not occur in principle no matter how much the monetary base is increased when short-terminterest rates are already at zero. In addition, as long as the representative agent’s utilitydoes not depend on the financial assets’ price variance, the representative agent willnot adjust its portfolio even if the central bank reduces the interest rate variance byexchanging parts of the monetary base for financial asset holdings, which are an
14 MONETARY AND ECONOMIC STUDIES/MARCH 2007
Figure 5 CABs at the BOJ and the Uncollateralized Overnight Call Rate
–0.05
0.00
0.05
0.10
0.15
0.20
0
5
10
15
20
25
30
35
40
Mar.2001
Aug. 1
4
Sep. 1
8
Dec. 1
9
Oct. 3
0
Apr. 1
Oct. 1
0
Jan.
20
Mar
. 9
Apr. 3
0
May
20
Sep. Mar.02
Sep. Mar.03
Sep. Mar.04
Sep. Mar.05
Sep. Mar.06
¥ trillionsPercent
Uncollateralized overnight call rate (left scale)
CABs(right scale)
Target¥5 trillion
Target¥6 trillion
Targetabove
¥6 trillion
Target¥10–15trillion
Target¥15–20trillion
Target¥27–30trillion
Target¥27–32trillion Target
¥30–35trillion
Target¥22–27trillionTarget
¥17–22trillion
Source: Bank of Japan (2006b).
imperfect substitute for the monetary base. Because the portfolio rebalancing effectwould be theoretically rejected, proponents of this viewpoint do not attempt toempirically verify this effect in the first place.
In contrast, if the assumption of its utility and budget constraint is relaxed, there isroom for the portfolio rebalancing effect to take place. Even so, there would be noeffect if the central bank were to increase the monetary base by purchasing short-termgovernment bonds, which are an almost perfect substitute for the monetary base underzero interest rates.18 However, there is a view that, even when short-term interest ratesbecome zero and the monetary base and short-term JGBs become a perfect substitute,given the existence of many financial assets that are not perfect substitutes for the monetary base, raising the prices of imperfect substitute assets could generate a monetary easing effect even under zero interest rates (McCallum [2000, 2003]) andothers).19 There are two views about which component of the premium of yields offinancial assets that are imperfect substitutes the portfolio rebalancing could affect.Bearing in mind the two views that draw attention to the imperfect substitutability offinancial assets, the paper now proceeds to verify the past empirical research to identifywhether such portfolio rebalancing effects exist, focusing on the effects on the yields of various financial assets.
The first view is that portfolio rebalancing works through a mechanism wherebythe monetary base supply alters the supply-demand relationship of various financialassets, thereby raising their prices (reducing their premiums) (Meltzer [1995, 1999b,2001]).20 Since this interpretation does not take into account what economic funda-mentals would change behind that, the component of the premiums that changes isnot specified. This reduction of premiums is understood to affect business fixedinvestment through changes in stock prices, which leads to changes in Tobin’s q, andconsumption through the wealth effect.
The second view theorizes imperfect substitutability among financial assets fromthe viewpoint of the liquidity premium. Namely, since there is a qualitative differencein terms of liquidity between money, which is always usable, and bonds or capital,only a portion of which can be liquidated at one time, the exchange between themcould increase the liquidity of the private sector (Yates [2003]).21 In addition, there isthe view that the cost of lost liquidity from the purchase of long-term bonds and thetransaction costs stemming from trading long-term bonds adds premiums onto theterm structure of interest rates (Andrés, López-Salido, and Nelson [2004]). Under the concepts presented by Kiyotaki and Moore (2001), the supply of the monetary basemitigates liquidity constraints by altering the amount of liquidity in the economy, andis thus expected to reduce liquidity premiums, bring changes in the flow of fundsfrom a savings entity to an investing entity, and thereby stimulate investment. Under
15
Effects of the Quantitative Easing Policy: A Survey of Empirical Analyses
18. McCallum (2001) notes that for the central bank to conduct open market operations under zero interest rates byexchanging monetary base for short-term government bonds, which, at the margin, become perfect substitutes,would be like replacing US$1 billion worth of US$5 bills with US$1 billion worth of US$10 bills, which, to anapproximation, has no effect.
19. Other than altering the prices of financial assets that are not perfect substitutes for the monetary base, there is anargument for considering the portfolio-rebalancing effects in a broader context, from the viewpoint that moneyhas different functions. See Section III.A.
20. Mishkin (1995) referred to such effects identified by Meltzer as “asset price effects.”21. The theoretical background is according to Kiyotaki and Moore (2001).
the concepts advocated by Andrés, López-Salido, and Nelson (2004), economic activitywill be stimulated through a decline in long-term interest rates rather than rates estimated from the expected future path of short-term interest rates.
Next, in considering whether assumption (2) of the irrelevance proposition holds,this paper specifically examines the issue of whether an increase in the monetary baseor diversification of measures to supply this monetary base through market operationsat present would affect the private sector’s expectations on the future course of mone-tary policy. As shown in the Appendix, when the BOJ raised its CAB target, in manycases it cited preventing deterioration of the economy and price declines as reasons forthe raise. If increases in the CABs or monetary base actually make the private sectorexpect that monetary easing will continue longer than previously envisaged, theseincreases will reduce present nominal long-term interest rates (Meyer [2001]). In thefollowing subsection, this paper reviews empirical analyses that attempt to determinewhether the QEP’s easing effects were strengthened because the implementation of thecommitment to maintain the QEP was endorsed in the visible format of an increase inthe CABs. The analysis here is considered to augment the policy duration effect of thecommitment surveyed in Section II.A.
As another channel not discussed so far, effects through the fiscal channel have beennoted. This is the assertion that when the central bank conducts its QEP aggressivelyand the private sector recognizes that the monetary base will permanently increase byway of JGB purchases, the private sector comes to expect government debt interestpayments to decline over time, consequently reducing the private sector’s tax burden(Auerbach and Obstfeld [2005]). This channel has not been verified empirically. Torealize positive interest rates while maintaining a permanent increase in the monetarybase after the economy returns to normal would require high nominal economicgrowth by way of massive inflation. The reason for not verifying this channel may bethat it is deemed unrealistic to try to convince the private sector of this scenario. 2. Verification method and resultsAs a premise for examining whether the portfolio rebalancing effect exists, this paperlooks into the demand for the real monetary base under zero interest rates. Under the QEP, if the interest rate elasticity of demand for the real monetary base becomesinfinite when short-term interest rates are zero, the monetary base will be passivelyabsorbed regardless of the amount provided, and thus effects from an increase in themonetary base cannot be expected. In this regard, Kimura et al. (2003) use data from1978/I to 2002/I and, with the reservation that data under the zero interest rateperiod are not necessarily sufficient and any conclusions should be treated as prelimi-nary, they reject the null hypothesis that the interest rate elasticity of demand for thereal monetary base becomes infinite when short-term interest rates are zero.
Oda and Ueda (2005) and Kimura and Small (2006) explicitly analyze the existenceand magnitude of the portfolio rebalancing effect. While both try to grasp the effect onpremiums included in financial assets that are imperfect substitutes for the monetarybase, the question of exactly which premium will be affected is not within the scope of their analyses.
Oda and Ueda (2005) conduct regression analysis on the risk premium componentof the yield curve (see Section II.A for the methodology) that was extracted in Baba
16 MONETARY AND ECONOMIC STUDIES/MARCH 2007
et al. (2005) by using variables that denote the CABs at the BOJ and the magnitude ofthe BOJ’s outright purchases of the long-term JGBs as explanatory variables. Based ondata from 1995/I to 2003/IV, they find that the regression results for three-, five-, and10-year rates were statistically insignificant for the BOJ’s CABs.
On the other hand, Kimura and Small (2006) examine the existence of portfoliorebalancing effects through changes in the supply and demand of financial assets basedon the capital asset pricing model (CAPM).22 Specifically, they express the difference in risks reflected in the rate of return of each financial asset as the differences in para-meter � (the sensitivity of each financial asset’s return against the market portfolio’sreturn). The market portfolio consists of the monetary base, equities (the Nikkei StockAverage), foreign government bonds (the yen-U.S. dollar exchange rate), high- andlow-grade corporate bonds, and long-term JGBs. They alter the composition of themarket portfolio by way of changes in the CABs through the BOJ’s market operations,and consider that portfolio rebalancing exists if the risk premiums of individual financial assets change, reflecting the change in their supply and demand. Using datafrom January 2000 to March 2004, they conduct regression analysis with changes in the risk premiums of individual financial assets’ yields as dependent variables and the CABs at the BOJ as an explanatory variable, and find that the credit spread of high-grade corporate bonds narrowed in a statistically significant manner. They interpret that the spread narrowed because investors, in order not to raise their portfolio risk, increased their demand for financial assets with countercyclical returnssuch as JGBs. However, even when the CABs were increased by ¥10 trillion, the credit spread of Aa-grade corporate bonds narrowed only by 1–4 basis points. They alsoconclude that an increase in the CABs decreased the forward exchange risk premiumsomewhat once the indirect effect through implied volatility is taken into account, whiletheir estimations of the direct effect on the risk premium present mixed results.23
Takeda, Komaki, and Yajima (2005) conduct studies that focus on the liquidity premiums of JGBs. They appraise the finite difference among the one-year forwardrates of JGBs at each future point as marginal changes in term premiums, and statisti-cally test whether these declined before and after the change of policies. They concludethat, at least at the time of the adoption of the QEP in March 2001, the decline in liquidity premiums was statistically significant.
Sadahiro (2005) focuses on the effects on the foreign exchange rate. By usingmonthly data from March 2001, when the QEP started, to September 2004, he conducts regression analysis on the effect of the Japan-U.S. monetary base ratio on theyen-dollar exchange rate, and confirms that the effect was statistically insignificant.
Consequently, as shown in Table 2, the prior studies present mixed results as to theeffect of portfolio rebalancing on JGB yields. The effect on financial assets other thanJGBs is found to be statistically significant in the case of high-grade corporate bonds.The findings on the effect on the foreign exchange rate are split between some effectand no effect. As a whole, even in the analyses that detect the portfolio rebalancingeffect to a certain extent, this effect was smaller than the effect of the commitment on
17
Effects of the Quantitative Easing Policy: A Survey of Empirical Analyses
22. The details of the CAPM are explained in chapter 1 of Cochrane (2001).23. It should be noted that, for assets with procyclical returns, the risk premium on equities and the credit spread of
low-grade corporate bonds increased in a statistically significant manner.
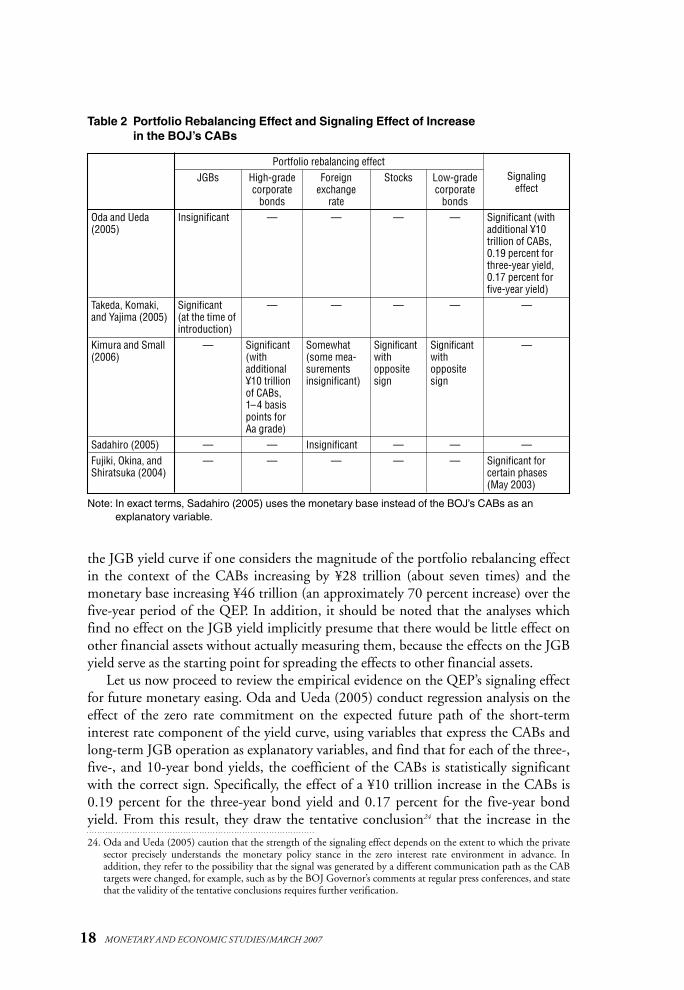
the JGB yield curve if one considers the magnitude of the portfolio rebalancing effectin the context of the CABs increasing by ¥28 trillion (about seven times) and themonetary base increasing ¥46 trillion (an approximately 70 percent increase) over thefive-year period of the QEP. In addition, it should be noted that the analyses whichfind no effect on the JGB yield implicitly presume that there would be little effect onother financial assets without actually measuring them, because the effects on the JGByield serve as the starting point for spreading the effects to other financial assets.
Let us now proceed to review the empirical evidence on the QEP’s signaling effectfor future monetary easing. Oda and Ueda (2005) conduct regression analysis on theeffect of the zero rate commitment on the expected future path of the short-terminterest rate component of the yield curve, using variables that express the CABs andlong-term JGB operation as explanatory variables, and find that for each of the three-,five-, and 10-year bond yields, the coefficient of the CABs is statistically significantwith the correct sign. Specifically, the effect of a ¥10 trillion increase in the CABs is 0.19 percent for the three-year bond yield and 0.17 percent for the five-year bondyield. From this result, they draw the tentative conclusion24 that the increase in the
18 MONETARY AND ECONOMIC STUDIES/MARCH 2007
Note: In exact terms, Sadahiro (2005) uses the monetary base instead of the BOJ’s CABs as an explanatory variable.
Table 2 Portfolio Rebalancing Effect and Signaling Effect of Increase in the BOJ’s CABs
Portfolio rebalancing effectJGBs High-grade Foreign Stocks Low-grade Signaling
corporate exchange corporate effectbonds rate bonds
Oda and Ueda(2005)
Takeda, Komaki,and Yajima (2005)
Kimura and Small(2006)
Sadahiro (2005)Fujiki, Okina, andShiratsuka (2004)
Insignificant
Significant(at the time ofintroduction)
—
——
—
—
Significant(with additional¥10 trillionof CABs,1–4 basispoints forAa grade)
——
—
—
Somewhat(some mea-surementsinsignificant)
Insignificant—
—
—
Significantwith oppositesign
——
—
—
Significantwith oppositesign
——
Significant (withadditional ¥10 trillion of CABs,0.19 percent forthree-year yield,0.17 percent forfive-year yield)
—
—
—Significant for certain phases(May 2003)
24. Oda and Ueda (2005) caution that the strength of the signaling effect depends on the extent to which the privatesector precisely understands the monetary policy stance in the zero interest rate environment in advance. In addition, they refer to the possibility that the signal was generated by a different communication path as the CAB targets were changed, for example, such as by the BOJ Governor’s comments at regular press conferences, and statethat the validity of the tentative conclusions requires further verification.
CABs during the QEP period may have made the private sector recognize more firmly the policy duration effect whereby the BOJ would continue monetary easingfor years to come.
On the other hand, Fujiki, Okina, and Shiratsuka (2004) conduct a case studyabout the effect of the BOJ’s decisions to increase the CAB target in April, May, andOctober 2003 and January 2004 on the yield curve, using the euroyen TokyoInterbank Offered Rate (TIBOR) and the yen swap interest rate. They conclude thatwhile the May 2003 decision affected the expectations of market participants, no cleareffects could be detected in the other cases.
As a whole, empirical analyses show that, when the BOJ increased the CAB targets,there were some phases in which this brought about a signaling effect (Table 2). Theexistence and magnitude of a signaling effect seems to depend on the extent to whichthe private sector understands precisely in advance the commitment to maintain thezero interest rate. Even in cases where the commitment to maintain the zero interestrate may not be believed at the beginning, once the private sector becomes certain aboutthe policy stance through comments at press conferences or an increase in the CABs,then changes in the CAB targets may not have any additional signaling effect.
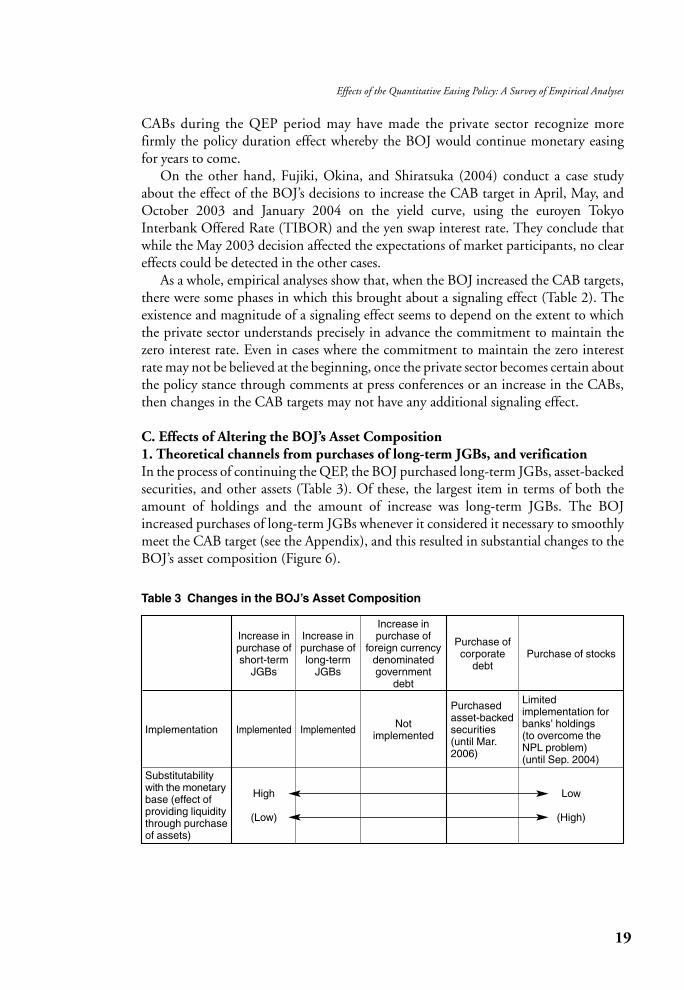
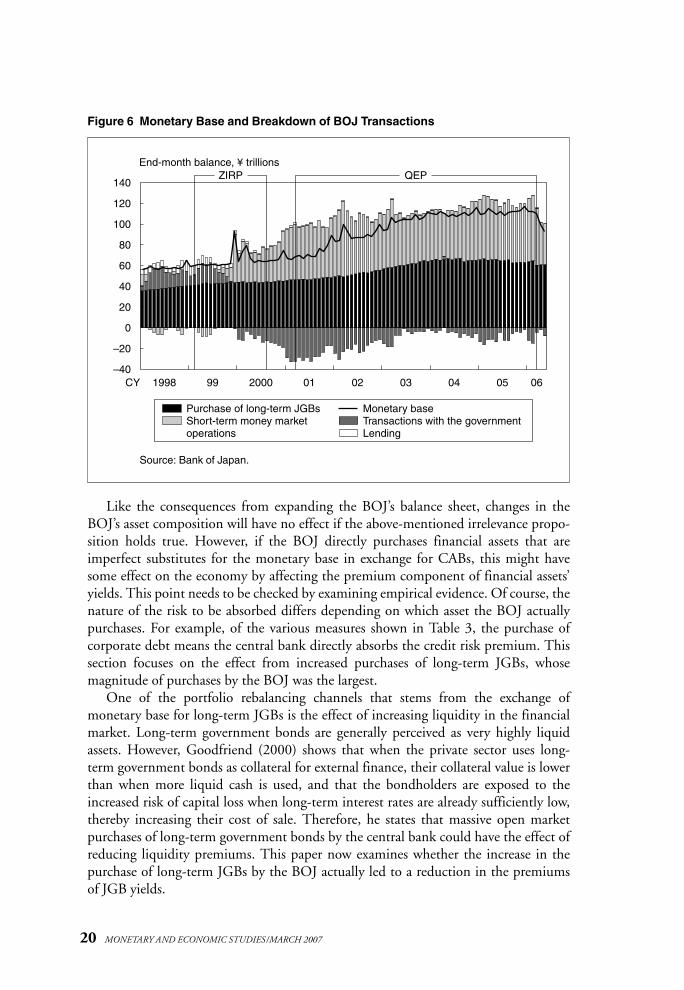
C. Effects of Altering the BOJ’s Asset Composition1. Theoretical channels from purchases of long-term JGBs, and verificationIn the process of continuing the QEP, the BOJ purchased long-term JGBs, asset-backedsecurities, and other assets (Table 3). Of these, the largest item in terms of both theamount of holdings and the amount of increase was long-term JGBs. The BOJincreased purchases of long-term JGBs whenever it considered it necessary to smoothlymeet the CAB target (see the Appendix), and this resulted in substantial changes to theBOJ’s asset composition (Figure 6).
19
Effects of the Quantitative Easing Policy: A Survey of Empirical Analyses
Table 3 Changes in the BOJ’s Asset Composition
Implementation
Substitutabilitywith the monetarybase (effect ofproviding liquiditythrough purchaseof assets)
Increase inpurchase ofshort-term
JGBs
Implemented
High
(Low)
Increase inpurchase oflong-term
JGBs
Implemented
Increase in purchase of
foreign currency denominated government
debt
Not implemented
Purchase ofcorporate
debt
Purchasedasset-backedsecurities(until Mar.2006)
Purchase of stocks
Limited implementation forbanks’ holdings (to overcome theNPL problem) (until Sep. 2004)
Low
(High)
Like the consequences from expanding the BOJ’s balance sheet, changes in theBOJ’s asset composition will have no effect if the above-mentioned irrelevance propo-sition holds true. However, if the BOJ directly purchases financial assets that are imperfect substitutes for the monetary base in exchange for CABs, this might havesome effect on the economy by affecting the premium component of financial assets’yields. This point needs to be checked by examining empirical evidence. Of course, thenature of the risk to be absorbed differs depending on which asset the BOJ actually purchases. For example, of the various measures shown in Table 3, the purchase of corporate debt means the central bank directly absorbs the credit risk premium. Thissection focuses on the effect from increased purchases of long-term JGBs, whose magnitude of purchases by the BOJ was the largest.
One of the portfolio rebalancing channels that stems from the exchange of monetary base for long-term JGBs is the effect of increasing liquidity in the financialmarket. Long-term government bonds are generally perceived as very highly liquidassets. However, Goodfriend (2000) shows that when the private sector uses long-term government bonds as collateral for external finance, their collateral value is lowerthan when more liquid cash is used, and that the bondholders are exposed to theincreased risk of capital loss when long-term interest rates are already sufficiently low,thereby increasing their cost of sale. Therefore, he states that massive open marketpurchases of long-term government bonds by the central bank could have the effect ofreducing liquidity premiums. This paper now examines whether the increase in thepurchase of long-term JGBs by the BOJ actually led to a reduction in the premiums of JGB yields.
20 MONETARY AND ECONOMIC STUDIES/MARCH 2007
Figure 6 Monetary Base and Breakdown of BOJ Transactions
–40
–20
0
20
40
60
80
100
120
140
1998 99 2000 01 02 03 04 05 06CY
End-month balance, ¥ trillionsQEPZIRP
Purchase of long-term JGBsShort-term money market operations
Monetary baseTransactions with the governmentLending
Source: Bank of Japan.
It should be noted that considerations of a channel whereby the central bank’s purchases of specific financial assets affect the supply and demand of imperfect sub-stitute assets and thereby reduce premiums are based on the segmented market hypothesis, that is, the understanding that economic entities have different preferenceswith respect to the maturity composition and types of financial assets. If the yields of the long-term JGBs purchased by the BOJ are significantly disconnected from the yields of JGBs with different maturities or those of corporate bonds, a decline inlong-term JGB yields will not spread over to the yields of other financial assets, and thus significant economic effects may not occur (Bernanke and Reinhart [2004]).This point will also be examined in the analysis of the effects on financial assets otherthan JGBs.
Additionally, this paper examines the empirical evidence of the signaling effect ofincreased purchases of long-term government bonds on expectations regarding thefuture course of monetary policy. However, the signal cannot be determined in onedirection a priori. One possibility is that if the central bank increases its purchases oflong-term government bonds, the credibility of expectations that zero interest rateswill be maintained would be enhanced since the central bank would then incur capitallosses if it did not continue the low interest rate policy for the foreseeable future(Clouse et al. [2003]). However, taking into account the relationship with fiscal policy, there could be other possibilities. For example, Fujiki, Okina, and Shiratsuka(2001) estimate that, even starting with the BOJ balance sheet before the QEP wasadopted, if one assumes that the BOJ purchases ¥60 trillion of long-term JGBs andlong-term interest rates reach 5 percent as a result of economic recovery, the BOJ wouldincur a capital loss of about ¥12 trillion if it sold the purchased long-term JGBs in1–2 years.25 In addition, they point out the possibility that if the BOJ tries to absorbthe monetary base after exiting from deflation by way of selling government debt, the private sector’s holdings of government debt could increase given the amount of capital loss the BOJ would incur when selling. Given the need to bear in mind thesevarious possibilities, in the following, if any signaling effect is detected, its contentmust also be examined in light of the empirical evidence.2. Verification method and resultsTo begin with, the effects of the BOJ’s increased purchases of long-term JGBs onfinancial assets’ premiums are estimated in Oda and Ueda (2005) and Kimura andSmall (2006). As previously mentioned, Oda and Ueda (2005) conduct a regressionanalysis against the risk premium component of short- to medium-term interest rates,using variables that denote the BOJ’s CABs and the magnitude of outright purchasesof long-term JGBs as explanatory variables. As explanatory variables of the BOJ’s outright purchases of long-term JGBs, they use the share of JGBs held by the BOJ intotal JGBs outstanding and the amounts of long-term JGBs purchased by the BOJ,and obtain results that both variables are not statistically significant for all cases—three-year, five-year, and 10-year JGBs.
21
Effects of the Quantitative Easing Policy: A Survey of Empirical Analyses
25. It should be noted that, in the current BOJ balance sheet, the duration of the long-term JGBs the BOJ holds isconsiderably shorter than the original maturity of 10 years and the timing to sell the bonds has not been predeter-mined. Therefore, the results of Fujiki, Okina, and Shiratsuka (2001) need to be interpreted with some discountin that the actual level of capital loss differs substantially depending on the assumptions.
On the other hand, Kimura and Small (2006) use the same CAPM model as previously explained in discussing the effects of the increase in the BOJ’s CABs whilechanging the explanatory variable from the BOJ’s CABs to the balance of the long-termJGBs held by the BOJ, and estimate the effects on financial assets’ risk premiums. The results, similar to those in the case of having the BOJ’s CABs as the explanatoryvariable, are that the credit spread of high-grade corporate bonds narrowed in a statistically significant manner, while the magnitude is small at 6–8 basis points for Aa-grade corporate bonds from a ¥10 trillion increase in the purchase of long-termJGBs. In addition, they conclude that the increased purchases of long-term JGBs somewhat decreased the forward exchange risk premium when the indirect effectthrough the influence on implied volatility is taken into account, while estimations ofthe direct effect on the risk premium present mixed results.26
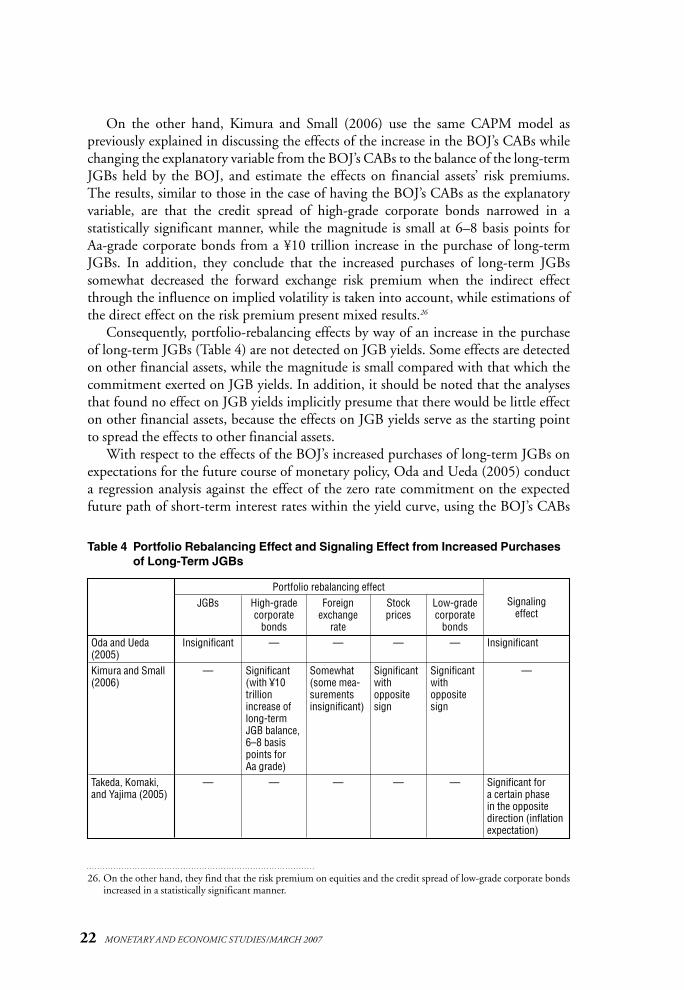
Consequently, portfolio-rebalancing effects by way of an increase in the purchaseof long-term JGBs (Table 4) are not detected on JGB yields. Some effects are detectedon other financial assets, while the magnitude is small compared with that which thecommitment exerted on JGB yields. In addition, it should be noted that the analysesthat found no effect on JGB yields implicitly presume that there would be little effecton other financial assets, because the effects on JGB yields serve as the starting pointto spread the effects to other financial assets.
With respect to the effects of the BOJ’s increased purchases of long-term JGBs onexpectations for the future course of monetary policy, Oda and Ueda (2005) conducta regression analysis against the effect of the zero rate commitment on the expectedfuture path of short-term interest rates within the yield curve, using the BOJ’s CABs
22 MONETARY AND ECONOMIC STUDIES/MARCH 2007
Table 4 Portfolio Rebalancing Effect and Signaling Effect from Increased Purchasesof Long-Term JGBs
Portfolio rebalancing effectJGBs High-grade Foreign Stock Low-grade Signaling
corporate exchange prices corporate effectbonds rate bonds
Oda and Ueda(2005)Kimura and Small(2006)
Takeda, Komaki,and Yajima (2005)
Insignificant
—
—
—
Significant(with ¥10trillionincrease oflong-termJGB balance,6–8 basispoints for Aa grade)
—
—
Somewhat(some mea-surementsinsignificant)
—
—
Significantwith oppositesign
—
—
Significantwith oppositesign
—
Insignificant
—
Significant for a certain phase in the opposite direction (inflationexpectation)
26. On the other hand, they find that the risk premium on equities and the credit spread of low-grade corporate bondsincreased in a statistically significant manner.
and the amount of long-term JGBs purchased as explanatory variables. They find thecoefficient of long-term JGBs purchased is not necessarily statistically significant, withthe opposite sign.
Takeda, Komaki, and Yajima (2005) use finite differences according to the maturi-ties of JGB forward rates, and find that premiums, including the inflation premium,temporarily increased in a statistically significant manner centering on the longer-term maturities of 7–8 years only when the BOJ increased its purchase of long-termJGBs from ¥400 billion per month to ¥600 billion per month in August 2001. They interpret this result as implying the possibility that the market expected that theincrease in the purchase of long-term JGBs would lead to a loss of fiscal discipline andthereby fostered inflation expectations.
As such, no empirical evidence to date has verified that the BOJ’s increased pur-chases of long-term JGBs had any effect on strengthening expectations for monetaryeasing (Table 4).
III. Effects of the QEP on Macro Financial and Economic Variables
So far, this paper has examined the effects of the QEP separately according to trans-mission channels. Here, the effects of the QEP on Japan’s economy overall are examinedby linking the various transmission channels analyzed above.
A. Effects on Stabilizing Financial Markets1. The relationship between the financial system and aggregate demand/prices,
and verificationCorporate balance-sheet adjustments after the bursting of the bubble and, as the otherside of the same coin, the nonperforming-loan (NPL) problem of financial institu-tions that led to insufficient functioning of financial intermediation, are considered tobe major factors behind the prolonged stagnation of Japan’s economy that began inthe early 1990s and lasted until about 2003. In particular, after the failures ofYamaichi Securities and Hokkaido Takushoku Bank in November 1997, financialinstitutions’ funding costs surged amid the rapidly heightened uncertainty regardingfinancial institutions’ management (Figure 7).
It has been pointed out that from the end of 1997 to 1998 nominal GDP declinedamid a credit contraction. There were phases in which firms had heightened uncertaintyregarding their funding over fear that financial institutions were reducing lending due to liquidity concerns, and the economy was at risk of tumbling into a deflationary spiral (Hayakawa and Maeda [2000] and Bank of Japan [2000]).27
23
Effects of the Quantitative Easing Policy: A Survey of Empirical Analyses
27. Specifically, empirical analyses show that the following two channels were at work. First, the decline in businessfixed investment can be attributed to financial institutions’ becoming extremely cautious in their lending stancetoward firms, especially small and medium-sized firms (Motonishi and Yoshikawa [1999]). Second, even thosefirms that were not facing funding constraints experienced intensified uncertainty regarding the investment envi-ronment in view of the heightened financial system uncertainty, and thus deferred their business fixed investmentsto some extent (Bank of Japan [1998]).
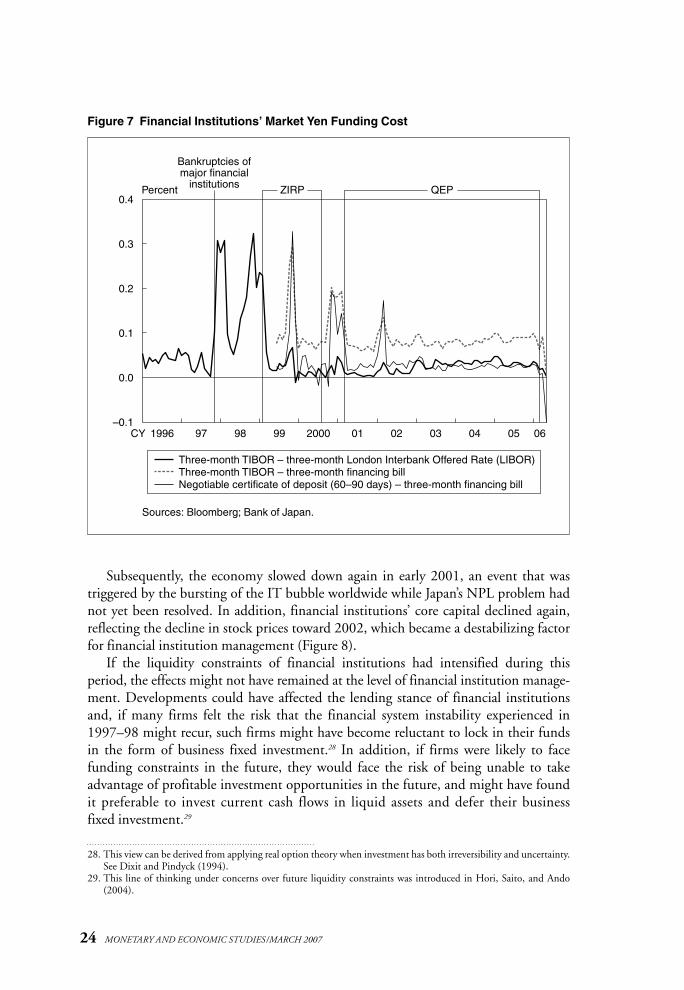
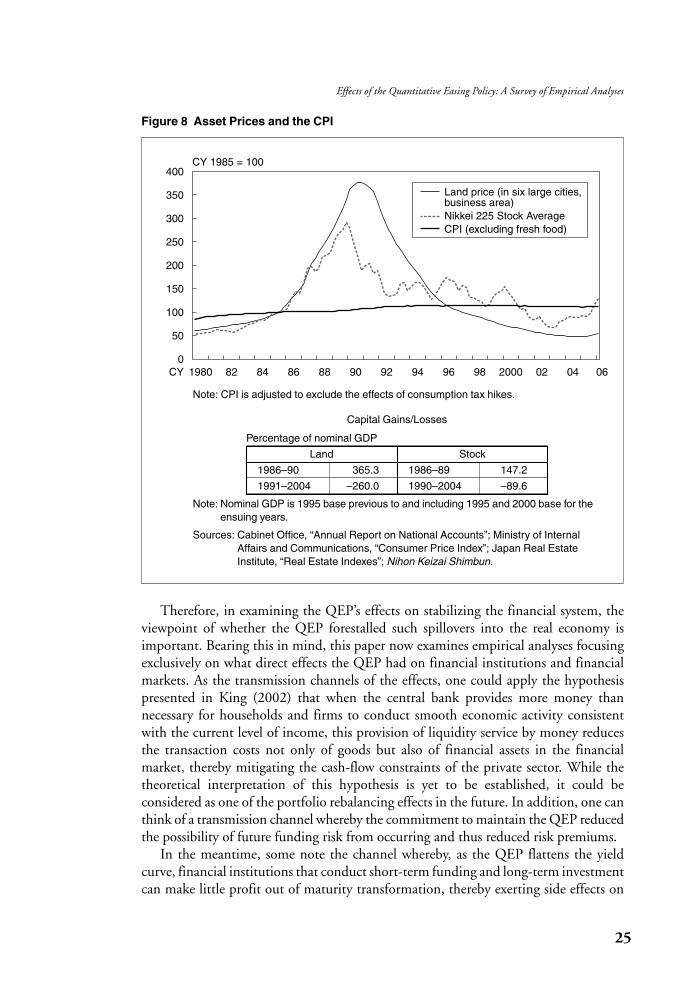
Subsequently, the economy slowed down again in early 2001, an event that wastriggered by the bursting of the IT bubble worldwide while Japan’s NPL problem hadnot yet been resolved. In addition, financial institutions’ core capital declined again,reflecting the decline in stock prices toward 2002, which became a destabilizing factorfor financial institution management (Figure 8).
If the liquidity constraints of financial institutions had intensified during thisperiod, the effects might not have remained at the level of financial institution manage-ment. Developments could have affected the lending stance of financial institutionsand, if many firms felt the risk that the financial system instability experienced in1997–98 might recur, such firms might have become reluctant to lock in their fundsin the form of business fixed investment.28 In addition, if firms were likely to facefunding constraints in the future, they would face the risk of being unable to takeadvantage of profitable investment opportunities in the future, and might have foundit preferable to invest current cash flows in liquid assets and defer their businessfixed investment.29
24 MONETARY AND ECONOMIC STUDIES/MARCH 2007
Figure 7 Financial Institutions’ Market Yen Funding Cost
–0.1
0.0
0.1
0.2
0.3
0.4
1996CY 97 98 99 2000 01 02 03 04 05 06
Percent
Bankruptcies ofmajor financial
institutions QEPZIRP
Three-month TIBOR – three-month London Interbank Offered Rate (LIBOR)Three-month TIBOR – three-month financing billNegotiable certificate of deposit (60–90 days) – three-month financing bill
Sources: Bloomberg; Bank of Japan.
28. This view can be derived from applying real option theory when investment has both irreversibility and uncertainty.See Dixit and Pindyck (1994).
29. This line of thinking under concerns over future liquidity constraints was introduced in Hori, Saito, and Ando(2004).
Therefore, in examining the QEP’s effects on stabilizing the financial system, theviewpoint of whether the QEP forestalled such spillovers into the real economy isimportant. Bearing this in mind, this paper now examines empirical analyses focusingexclusively on what direct effects the QEP had on financial institutions and financialmarkets. As the transmission channels of the effects, one could apply the hypothesispresented in King (2002) that when the central bank provides more money than necessary for households and firms to conduct smooth economic activity consistentwith the current level of income, this provision of liquidity service by money reducesthe transaction costs not only of goods but also of financial assets in the financial market, thereby mitigating the cash-flow constraints of the private sector. While thetheoretical interpretation of this hypothesis is yet to be established, it could be considered as one of the portfolio rebalancing effects in the future. In addition, one canthink of a transmission channel whereby the commitment to maintain the QEP reducedthe possibility of future funding risk from occurring and thus reduced risk premiums.
In the meantime, some note the channel whereby, as the QEP flattens the yieldcurve, financial institutions that conduct short-term funding and long-term investmentcan make little profit out of maturity transformation, thereby exerting side effects on
25
Effects of the Quantitative Easing Policy: A Survey of Empirical Analyses
Figure 8 Asset Prices and the CPI
0
50
100
150
200
250
300
350
400CY 1985 = 100
CY 1980 82 84 86 88 90 92 94 96 98 2000 02 04 06
Land price (in six large cities, business area)Nikkei 225 Stock AverageCPI (excluding fresh food)
Note: CPI is adjusted to exclude the effects of consumption tax hikes.
Capital Gains/Losses
Percentage of nominal GDP
Land Stock
1986–90 365.3 1986–89 147.2
1991–2004 –260.0 1990–2004 –89.6
Note: Nominal GDP is 1995 base previous to and including 1995 and 2000 base for theensuing years.
Sources: Cabinet Office, “Annual Report on National Accounts”; Ministry of InternalAffairs and Communications, “Consumer Price Index”; Japan Real EstateInstitute, “Real Estate Indexes”; Nihon Keizai Shimbun.
the banking system (IMF [2003]). However, empirical analyses have not yet been conducted on this aspect because, through the periods after the adoption of the QEP,the profits of financial institutions actually depended substantially on changes in thecredit costs that had arisen due to the NPL problem.2. Verification method and resultsOf the qualitative analyses that dealt with the QEP’s effects on dispelling the liquidityconcerns of financial institutions, by comparing the changes in policy actions with the developments in financial markets, Baba et al. (2005) assess that the QEP pre-vented the generation of risk premiums when financial institutions raised funds infinancial markets, and avoided recurrence of the liquidity crisis that occurred during1997–98. In addition, Suzuki and Kobayashi (2005) conclude that the BOJ’s ampleliquidity provision to the market had a preventive effect on financial institutions’funding concerns.
While a few studies measure quantitatively the QEP’s effects on the funding costs offinancial institutions, Baba et al. (2006) report that during the QEP phase the dispersionof issuance rates of negotiable certificates of deposit (NCDs) by major banks (city banksand trust banks), the volume of which accounts for about 30 percent of their market funding needs, fell to or below the level of October 1997, when the difference in credit-worthiness among individual banks drew little attention. They also pool the single-yeardata of the NCD credit spreads30 for 1997, 1999, 2002, 2004, and 2005 (up to the beginning of May), respectively, and run regressions of the credit spreads on dummy variables corresponding to sample banks’ credit ratings for each year to estimate creditspreads for each credit rating category (credit curves). The results show that the slope ofthe credit curve started to flatten after introduction of the ZIRP in 1999 and maintainedthis trend under the QEP, almost flattening out in 2004–05, indicating that the differ-ences in credit ratings were then barely reflected. Furthermore, after controlling for the difference in creditworthiness by the spread of the bank bond yield over the yield ofJGBs with the same maturity, they conduct a panel analysis to estimate to what extentmonetary policy-related variables have contributed to the behavior of individual financial institutions’ NCD issuance rates. The findings indicate that the introductionof both the ZIRP and the QEP were statistically significant, and that clarification of the commitment was sometimes statistically significant, although minor. While theBOJ’s CABs were not statistically significant as an explanatory variable, the maturitylength of the BOJ’s bill-purchasing operations was statistically significant. While theseresults do not imply the changes in the credit risks that represent the solvency of financial institutions, it may be interpreted that credit risks in a broad sense were reducedin that funding risks were mitigated by the clarification of the BOJ’s stance to continue providing ample liquidity. Therefore, Baba et al. (2006) conclude that the BOJ’s commitment to policy duration had the effect of reducing the credit spread, and that the lengthening of the BOJ’s operation maturity might have had some effects.
Fujiki and Shiratsuka (2001) use the relationship whereby the stronger the demandfor liquidity, the lower the profitability of securities with short maturity and the steeper
26 MONETARY AND ECONOMIC STUDIES/MARCH 2007
30. They defined the credit spread for a bank as the interest rate on NCDs issued by the bank with each maturity (lessthan 30, 60, and 90 days) minus the weighted average of the uncollateralized overnight call rate over all banks.
the slope of the yield curve, and consider the effects on financial institutions’ liquidityconstraints during the ZIRP period. Specifically, they find that the term spreads ofeuroyen (1–3 months) in terms of the difference over overnight interest rates shrankmarkedly during 1999–2000. From this observation, they conclude that, by way of the policy duration effect, the range of zero interest rate financial assets that were substitutes for the monetary base expanded and thus increased liquidity substantially,and this resulted in mitigating the liquidity constraints of financial institutions. Sincethe range of financial assets that were substitutes for the monetary base furtherexpanded under the QEP compared with the ZIRP period, it is possible to assume thatthis liquidity effect remained in place.
B. Effects of Raising Aggregate Demand and Prices1. Generation mechanism of continuous price declines, and verificationThis section analyzes the extent to which the QEP, after exerting effects to contain therisk of a deflationary spiral stemming from financial system instability (as shown inthe previous subsection), is considered to have further contributed to raising Japan’saggregate demand and prices based on empirical analyses.
While a decline in productivity also contributed to the prolonged stagnation ofJapan’s economy after the 1990s, a drop in the natural rate of interest due to negativedemand shocks seems to have played a major role in the modest but continuous pricedecline over that time.31 Corporations’ prolonged suffering from their balance-sheetadjustments may also be described as a situation in which the economy lagged in its response to negative demand shocks, or in which negative demand shocks were continuously imposed on the economy. This paper now examines the extent to whichthe QEP exerted its easing effect and raised aggregate demand and prices under this sit-uation where the impact from the decline in Japan’s natural rate of interest continuously affected the economy.
Since the verification results differ depending on which QEP transmission channelis measured, this paper considers three types of approaches: (1) measuring broadly without specifying the transmission channel; (2) measuring the effects in shifting the yield curve downward, mainly bearing in mind the policy duration effect; and (3) measuring the effects of an increase in the monetary base, mainly bearing in mind theportfolio rebalancing effect. Here, this paper comprehensively captures the effects on theeconomy, including the direct effects on aggregate demand and price expectations thatcould not necessarily be measured by the approach of assessing the transmission channelin terms of the effect on financial asset yields adopted in Section II.2. Verification method and resultsa. Verification that broadly measures the effects of the QEPThis subsection begins by introducing a study that does not specify the transmissionchannel of the QEP, but rather broadly grasps and measures the QEP’s effects on Japan’seconomy. The merit of this approach is that it avoids underestimating the policy effectsresulting from imposing in advance too strong a constraint on the transmission channel,
27
Effects of the Quantitative Easing Policy: A Survey of Empirical Analyses
31. Another interpretation of deflation is that it will persist under zero interest rates even if the natural rate of interestcontinues to be positive (a “deflationary trap”) (Benhabib, Schmitt-Grohé, and Uribe [2002] and Iwamoto [2005]).
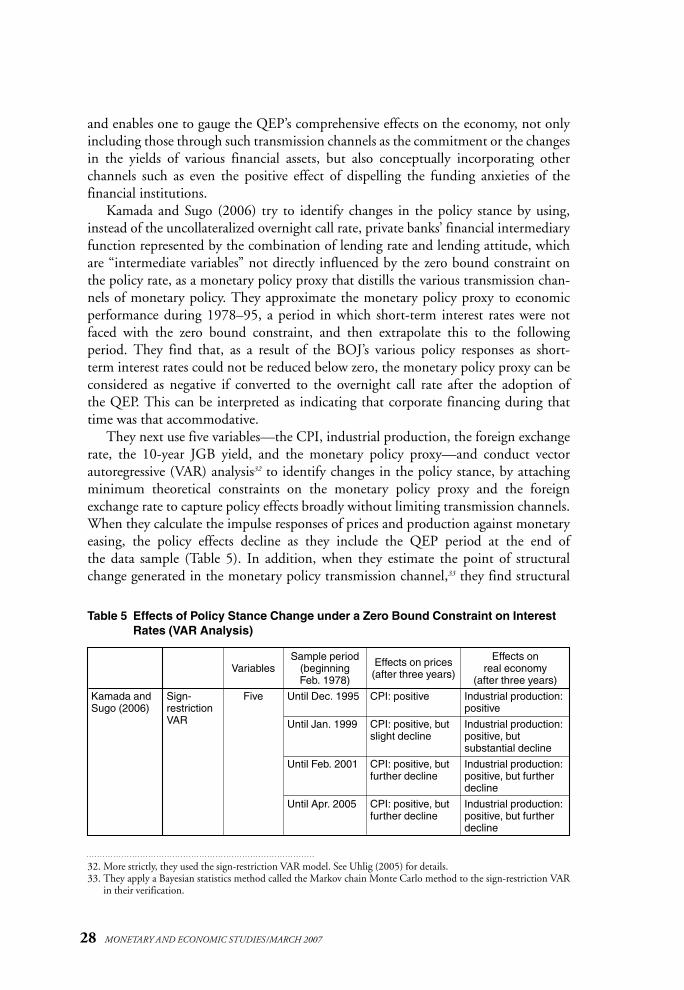
and enables one to gauge the QEP’s comprehensive effects on the economy, not onlyincluding those through such transmission channels as the commitment or the changesin the yields of various financial assets, but also conceptually incorporating other channels such as even the positive effect of dispelling the funding anxieties of the financial institutions.
Kamada and Sugo (2006) try to identify changes in the policy stance by using,instead of the uncollateralized overnight call rate, private banks’ financial intermediaryfunction represented by the combination of lending rate and lending attitude, whichare “intermediate variables” not directly influenced by the zero bound constraint on the policy rate, as a monetary policy proxy that distills the various transmission chan-nels of monetary policy. They approximate the monetary policy proxy to economic performance during 1978–95, a period in which short-term interest rates were not faced with the zero bound constraint, and then extrapolate this to the following period. They find that, as a result of the BOJ’s various policy responses as short-term interest rates could not be reduced below zero, the monetary policy proxy can be considered as negative if converted to the overnight call rate after the adoption of the QEP. This can be interpreted as indicating that corporate financing during thattime was that accommodative.
They next use five variables—the CPI, industrial production, the foreign exchangerate, the 10-year JGB yield, and the monetary policy proxy—and conduct vectorautoregressive (VAR) analysis32 to identify changes in the policy stance, by attachingminimum theoretical constraints on the monetary policy proxy and the foreignexchange rate to capture policy effects broadly without limiting transmission channels.When they calculate the impulse responses of prices and production against monetaryeasing, the policy effects decline as they include the QEP period at the end of the data sample (Table 5). In addition, when they estimate the point of structuralchange generated in the monetary policy transmission channel,33 they find structural
28 MONETARY AND ECONOMIC STUDIES/MARCH 2007
Kamada andSugo (2006)
Sign-restrictionVAR
Variables
Five
Sample period(beginning Feb. 1978)
Until Dec. 1995
Until Jan. 1999
Until Feb. 2001
Until Apr. 2005
Effects on prices(after three years)
CPI: positive
CPI: positive, butslight decline
CPI: positive, butfurther decline
CPI: positive, butfurther decline
Effects on real economy
(after three years)
Industrial production:positive
Industrial production:positive, but substantial decline
Industrial production:positive, but furtherdecline
Industrial production:positive, but furtherdecline
Table 5 Effects of Policy Stance Change under a Zero Bound Constraint on InterestRates (VAR Analysis)
32. More strictly, they used the sign-restriction VAR model. See Uhlig (2005) for details. 33. They apply a Bayesian statistics method called the Markov chain Monte Carlo method to the sign-restriction VAR
in their verification.
change around the end of 1990, which corresponds to the peak of the asset price bubble, but identify no subsequent structural changes. When they conduct a counter-factual simulation by combining monetary easing after the bursting of the asset price bubble with the VAR model that described Japan’s economy before the bursting,the result indicates an increase in prices. From this, they conclude that, in addition to the zero bound constraint on interest rates and the erosion of banks’ financial intermediary functions, the worsening of corporate balance-sheet problems and thebreakdown of the mechanism which amplifies economic activity limited the effects of monetary easing. b. Verification measured from the effects of lowering yield curveAs previously shown, the analyses that verified the policy duration effect as the QEP’stransmission channel found that the QEP had the effect of flattening the yield curve.This apparently recognizes that an accommodative environment had been generatedin terms of the extent of corporate financing. While the effects on aggregate demandand prices were mixed, as shown below, in general more papers find that the QEP didnot lead to raising aggregate demand and prices because of insufficient functioning offinancial intermediation and corporate balance-sheet adjustment.
For example, Okina and Shiratsuka (2004) and Baba et al. (2005) argue that,although the QEP lowered the yield curve mainly through the policy duration effects,its effects on prices and the economy were limited. Similar reasons are cited in bothstudies. Based on the observation that the implied forward rate for longer terms didnot rise, Okina and Shiratsuka (2004) conclude that the QEP did not have the effectof reversing the financial market’s expectations that deflation would persist. They saythis is because the transmission mechanism from lender to borrower was blocked andthe monetary easing effect did not spill over to outside the financial system. Baba et al.(2005) show, by way of structural model analysis, that the reduction of net assets ofboth lenders and borrowers raised funding costs through information asymmetrybetween them,34 and interpret that this offset the effects of lowering the yield curve. At the same time, however, as discussed in Section II.A, they point out the possibilitythat the effect of the commitment on lower interest rates contributed to produce somehigher inflation expectations when viewed from a long-term perspective, since thislowering effect was lower for 10-year bonds than for three- and five-year bonds.
On the other hand, Suzuki and Kobayashi (2005) made a positive assessment aboutthe monetary easing effect by showing that, with the combination of the zero policyinterest rate and the policy duration effect, long-term real funding rates declined centering on the manufacturing industry from 2002 and the lending attitude of financial institutions became accommodative, which was effective to a certain extent in raising firms’ funds demand, with some lag. However, they do not separate the effectsof lowering the policy interest rate to zero percent and the policy duration effects.c. Verification measured from the effects of the monetary base increaseSections II.B and II.C showed that the effects through the transmission channels ofthe increase in the BOJ’s CABs and the increase in the purchase of long-term JGBs
29
Effects of the Quantitative Easing Policy: A Survey of Empirical Analyses
34. This effect is referred to as the financial accelerator (Bernanke, Gertler, and Gilchrist [1999]). For an analysis ofJapan’s prolonged stagnation using this effect, see Fuchi, Muto, and Ugai (2005).
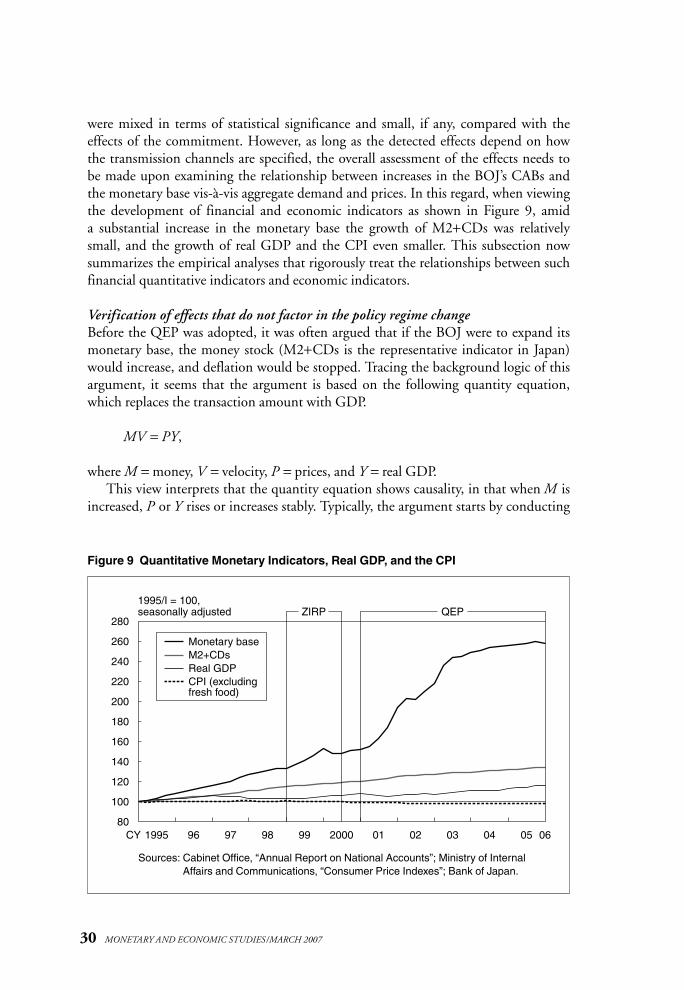
were mixed in terms of statistical significance and small, if any, compared with theeffects of the commitment. However, as long as the detected effects depend on howthe transmission channels are specified, the overall assessment of the effects needs tobe made upon examining the relationship between increases in the BOJ’s CABs andthe monetary base vis-à-vis aggregate demand and prices. In this regard, when viewingthe development of financial and economic indicators as shown in Figure 9, amid a substantial increase in the monetary base the growth of M2+CDs was relativelysmall, and the growth of real GDP and the CPI even smaller. This subsection nowsummarizes the empirical analyses that rigorously treat the relationships between suchfinancial quantitative indicators and economic indicators.
Verification of effects that do not factor in the policy regime changeBefore the QEP was adopted, it was often argued that if the BOJ were to expand itsmonetary base, the money stock (M2+CDs is the representative indicator in Japan)would increase, and deflation would be stopped. Tracing the background logic of thisargument, it seems that the argument is based on the following quantity equation,which replaces the transaction amount with GDP.
MV = PY,
where M = money, V = velocity, P = prices, and Y = real GDP.This view interprets that the quantity equation shows causality, in that when M is
increased, P or Y rises or increases stably. Typically, the argument starts by conducting
30 MONETARY AND ECONOMIC STUDIES/MARCH 2007
Figure 9 Quantitative Monetary Indicators, Real GDP, and the CPI
80
100
120
140
160
180
200
220
240
260
280
1995CY 96 97 98 99 2000 01 02 03 04 05 06
1995/I = 100, seasonally adjusted QEPZIRP
Monetary baseM2+CDsReal GDPCPI (excluding fresh food)
Sources: Cabinet Office, “Annual Report on National Accounts”; Ministry of InternalAffairs and Communications, “Consumer Price Indexes”; Bank of Japan.
a regression on M2+CDs using the monetary base, the declining trend of the moneymultiplier (M2+CDs/monetary base), and the lending attitude of financial institu-tions, and, upon showing that the monetary base is statistically significant as anexplanatory variable, then estimates a function whereby nominal GDP/M2+CDsexplains the inflation rate, and concludes that an increase in the monetary base would raise inflation via the money stock (Shinpo [2002]).35 In addition, there is anempirical analysis based on the VAR model that shows that among money stock, banklending, and funding other than that from banks, money stock has the largest effecton economic activity (Harada and Okamoto [2004]).
However, Woodford (2003) presents an influential view that the money quantityequation shows the state of economic equilibrium, and not causality as described above;and that therefore money could not affect prices independent of interest rates under a specific monetary policy even if one takes into account the mechanism wherebymoney reduces transaction costs. From this standpoint, even if there were a stable relationship between an increase in the money stock and economic activity when interest rates are positive, this relationship would disappear once interest rates becomezero. Consequently, to accept that the quantity equation shows causality and monetaryeasing which increases money stock is effective, one must assume that the relationshipbetween the monetary base and money stock, and their relationship with nominalGDP, would in fact be stable when the monetary base is intentionally increased underzero interest rates. However, the data used in the studies here, covering fiscal1974–2000 in Shinpo (2002) and 1980/I–2001/IV in Harada and Okamoto (2004),are long-term time-series data and hardly cover the periods of the ZIRP and QEP. So assessment of the stability of the relationships among the monetary base, moneystock, and nominal GDP under the QEP must await further data accumulation.
Also, when looking at empirical analyses on the stability of the relationship betweenthe monetary base and money stock, many studies conclude that the relationship was unstable under zero interest rates. For example, the Bank of Japan (2002) showsthat the monetary base and the money stock are not linked by a fixed rate to begin with, that especially under an environment where interest rates are close to zero, the cash/bank deposits ratio and the BOJ’s CABs/bank deposits ratio both fluctuatesubstantially, and that the money multiplier also becomes unstable and fluctuates in anunpredictable manner. Kuttner (2004) also judges, by viewing the developmentsbetween M2+CDs and the BOJ’s CABs (the operating variable of the QEP) or themonetary base, that the link between them was weak.
In addition, many results show that the relationship between the money stock and economic activity has weakened. With respect to M2+CDs,36 for example,Kuttner (2004) states that if the long-run relationship is extended between M2+CDsand real GDP and prices measured from before 1990 until 2004, the relationship
31
Effects of the Quantitative Easing Policy: A Survey of Empirical Analyses
35. There are arguments that go further to propose that the price level could be raised if the BOJ determines theamount of the monetary base to increase and adjusts the CABs to realize that amount (Hetzel [2004]).
36. With respect to narrow money (M1), while Miyao (2002) and Fujiki and Watanabe (2004) show that moneydemand for interest rate levels has been unstable under an extremely low interest rate environment, they neverthelessconclude that the usefulness of velocity is not lost if one uses the function in the form of double-log specificationthat depicts both money demand and interest rates in logarithms.
still exists, although it becomes weak. On the other hand, Bank of Japan (2003) verifies a long-run equilibrium relationship among real M2+CDs, real GDP, and theopportunity cost of holding money using the vector error correction model (VECM)based on two sets of data from 1971 forward and from 1981 forward, and notes thatthe long-run equilibrium relationship was not identified if data since the end of 1997,when financial system concerns rapidly heightened, were included. In addition,Miyao (2005) conducts a rigorous verification with respect to the long-run equilib-rium relationship between M2 and economic activity. He shows that the long-runequilibrium relationship does not hold among M2, real GDP, and prices, and also thatM2 does not have the power to forecast real GDP, the GDP deflator, or nominal GDPif data during 1993–2003 are used.37 As to why the relationship between the moneystock and economic activity has become fragile, several reasons have been pointed out:the NPL problem and progress of corporate restructuring (Miyao [2005]), financialsystem uncertainty with heightened precautionary demand for currency on the part ofhouseholds and firms, and the substantial decline in the opportunity cost of liquidityservice provided by M2+CDs under zero interest rates, which induced a substantialfunds shift among financial assets (Bank of Japan [2003]).
As such, much empirical evidence indicates that the relationships between themonetary base and money stock, and between the monetary base and nominal GDP,have been extremely unstable, at least when interest rates were zero.
Verification of effects that factor in the policy regime changeThis paper now proceeds to examine the analyses that explicitly factor in the changes ofpolicy regime under the zero bound constraint on interest rates. Especially in the recentanalyses, VAR models that take into account changes of policy regimes under the zerobound constraint on interest rates are being adopted to extract objectively from the datathe relationships among the monetary base, the real economy, and the inflation rate.Three specific examples are cited below (see Table 6 for a list of the results).
Kimura et al. (2003) use four variables—the CPI rate of change, the GDP gap, themonetary base rate of increase, and the overnight call rate—and estimate a VARmodel38 with time-varying coefficients for the sample period of 1971/II–2002/I. Theyfind that the impulse response to an increase in the monetary base was in the directionof an inflation rise as of 1985 (II), while there was no response against either the infla-tion rate or the GDP gap as of 2002 (I). Based on these findings, they conclude that,given the structural changes in the economy under a zero bound constraint on interestrates, they could not extract a function whereby the monetary base channel raisedprices or the economy.
Fujiwara (2006) tries to grasp the policy effects using a VAR39 analysis that does fac-tor in a structural break in monetary policy effects, but does not impose constraints a priori on the timing of such a break. Specifically, he uses monthly data from 1985–2004and conducts analyses using three variables—the CPI, industrial production, and the monetary base—and then using four variables, adding the new issuance rate for
32 MONETARY AND ECONOMIC STUDIES/MARCH 2007
37. Sugihara et al. (2000), while based on data up to the ZIRP period, also find similar instability of money demand. 38. They use a Bayesian VAR model.39. They use the Markov switching VAR model.
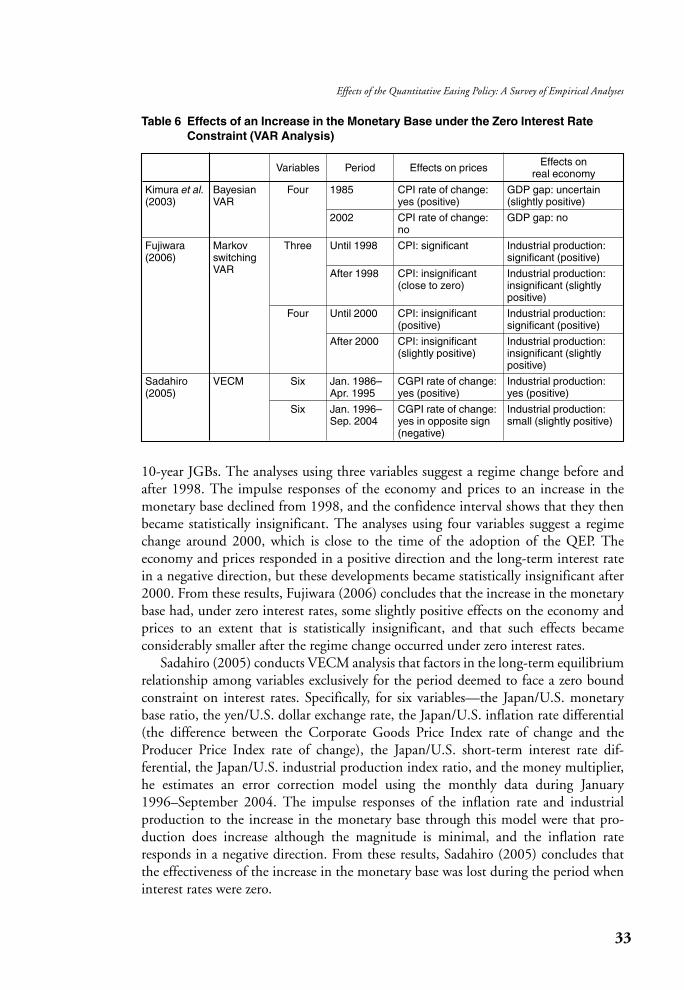
10-year JGBs. The analyses using three variables suggest a regime change before andafter 1998. The impulse responses of the economy and prices to an increase in the monetary base declined from 1998, and the confidence interval shows that they thenbecame statistically insignificant. The analyses using four variables suggest a regimechange around 2000, which is close to the time of the adoption of the QEP. The economy and prices responded in a positive direction and the long-term interest ratein a negative direction, but these developments became statistically insignificant after2000. From these results, Fujiwara (2006) concludes that the increase in the monetarybase had, under zero interest rates, some slightly positive effects on the economy andprices to an extent that is statistically insignificant, and that such effects became considerably smaller after the regime change occurred under zero interest rates.
Sadahiro (2005) conducts VECM analysis that factors in the long-term equilibriumrelationship among variables exclusively for the period deemed to face a zero boundconstraint on interest rates. Specifically, for six variables—the Japan/U.S. monetarybase ratio, the yen/U.S. dollar exchange rate, the Japan/U.S. inflation rate differential(the difference between the Corporate Goods Price Index rate of change and theProducer Price Index rate of change), the Japan/U.S. short-term interest rate dif-ferential, the Japan/U.S. industrial production index ratio, and the money multiplier,he estimates an error correction model using the monthly data during January1996–September 2004. The impulse responses of the inflation rate and industrial production to the increase in the monetary base through this model were that pro-duction does increase although the magnitude is minimal, and the inflation rateresponds in a negative direction. From these results, Sadahiro (2005) concludes that the effectiveness of the increase in the monetary base was lost during the period wheninterest rates were zero.
33
Effects of the Quantitative Easing Policy: A Survey of Empirical Analyses
Kimura et al.(2003)
Fujiwara(2006)
Sadahiro(2005)
BayesianVAR
MarkovswitchingVAR
VECM
Variables
Four
Three
Four
Six
Six
Period
1985
2002
Until 1998
After 1998
Until 2000
After 2000
Jan. 1986–Apr. 1995
Jan. 1996–Sep. 2004
Effects on prices
CPI rate of change:yes (positive)
CPI rate of change:no
CPI: significant
CPI: insignificant(close to zero)
CPI: insignificant(positive)
CPI: insignificant(slightly positive)
CGPI rate of change:yes (positive)
CGPI rate of change:yes in opposite sign(negative)
Effects on real economy
GDP gap: uncertain(slightly positive)
GDP gap: no
Industrial production:significant (positive)
Industrial production:insignificant (slightlypositive)
Industrial production:significant (positive)
Industrial production:insignificant (slightlypositive)
Industrial production:yes (positive)
Industrial production:small (slightly positive)
Table 6 Effects of an Increase in the Monetary Base under the Zero Interest RateConstraint (VAR Analysis)
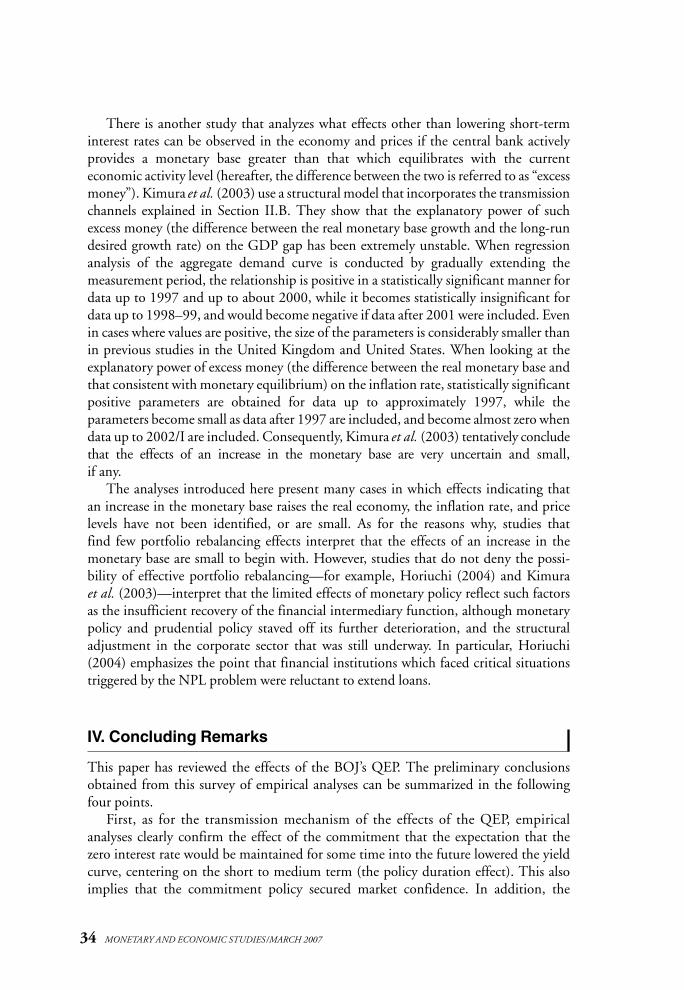
There is another study that analyzes what effects other than lowering short-terminterest rates can be observed in the economy and prices if the central bank actively provides a monetary base greater than that which equilibrates with the current economic activity level (hereafter, the difference between the two is referred to as “excessmoney”). Kimura et al. (2003) use a structural model that incorporates the transmissionchannels explained in Section II.B. They show that the explanatory power of suchexcess money (the difference between the real monetary base growth and the long-rundesired growth rate) on the GDP gap has been extremely unstable. When regressionanalysis of the aggregate demand curve is conducted by gradually extending the measurement period, the relationship is positive in a statistically significant manner fordata up to 1997 and up to about 2000, while it becomes statistically insignificant fordata up to 1998–99, and would become negative if data after 2001 were included. Evenin cases where values are positive, the size of the parameters is considerably smaller thanin previous studies in the United Kingdom and United States. When looking at theexplanatory power of excess money (the difference between the real monetary base andthat consistent with monetary equilibrium) on the inflation rate, statistically significantpositive parameters are obtained for data up to approximately 1997, while the parameters become small as data after 1997 are included, and become almost zero whendata up to 2002/I are included. Consequently, Kimura et al. (2003) tentatively concludethat the effects of an increase in the monetary base are very uncertain and small, if any.
The analyses introduced here present many cases in which effects indicating thatan increase in the monetary base raises the real economy, the inflation rate, and pricelevels have not been identified, or are small. As for the reasons why, studies that find few portfolio rebalancing effects interpret that the effects of an increase in themonetary base are small to begin with. However, studies that do not deny the possi-bility of effective portfolio rebalancing—for example, Horiuchi (2004) and Kimuraet al. (2003)—interpret that the limited effects of monetary policy reflect such factorsas the insufficient recovery of the financial intermediary function, although monetarypolicy and prudential policy staved off its further deterioration, and the structuraladjustment in the corporate sector that was still underway. In particular, Horiuchi(2004) emphasizes the point that financial institutions which faced critical situationstriggered by the NPL problem were reluctant to extend loans.
IV. Concluding Remarks
This paper has reviewed the effects of the BOJ’s QEP. The preliminary conclusionsobtained from this survey of empirical analyses can be summarized in the followingfour points.
First, as for the transmission mechanism of the effects of the QEP, empirical analyses clearly confirm the effect of the commitment that the expectation that thezero interest rate would be maintained for some time into the future lowered the yieldcurve, centering on the short to medium term (the policy duration effect). This alsoimplies that the commitment policy secured market confidence. In addition, the
34 MONETARY AND ECONOMIC STUDIES/MARCH 2007
QEP, which committed to the actual performance of the CPI, had stronger effects on lowering the yield curve than the ZIRP, which committed to future dispelling of deflationary concerns.
Second, the effects from expanding the BOJ’s balance sheet (expansion of themonetary base) through an increase in the BOJ’s CABs and the effects from alteringthe BOJ’s asset composition through increased purchases of long-term JGBs can beassessed in line with the transmission channels as follows. The empirical analyses present mixed results as to whether the portfolio rebalancing, which affects the premium portion of the yields of financial assets that are imperfect substitutes for the monetary base, had any effect on narrowing the premium portion of bond yields, and even among those that detect such an effect, many generally conclude that themagnitude of this effect was smaller than that from the commitment. With respect tothe signaling effect, which affects the private sector’s expectations for the future pathof short-term interest rates, at least the effect from an increase in the BOJ’s CABs onbolstering expectations that the monetary easing would continue into the future wasdetected during certain phases. On the other hand, no such effects were identifiedfrom increased purchases of long-term JGBs, and, in one phase, inflation premiumstemporarily increased.
Third, bearing these points in mind and taking up studies that empirically analyze the QEP’s overall macroeconomic impact on Japan’s economy through varioustransmission channels, many of these analyses in general observe that the QEP createdan accommodative monetary environment. Looking at the contents of the macro-economic impact, while the transmission channels are not specified, these macroeco-nomic analyses verify that because of the QEP, the premiums on market funds raisedby financial institutions carrying substantial NPLs shrank to the extent that they no longer reflected credit rating differentials. According to analyses of the economicsituation during this period, if firms had heightened anxieties regarding their fundingover fear of the stability of the financial system, further deterioration of economic and price developments resulting from the likes of deferring their business fixed investment might have occurred. Therefore, this observation implies that the QEP hadthe effects of maintaining financial market stability and an accommodative monetaryenvironment by removing financial institutions’ funding uncertainties, and thereby preventing further deterioration of the economy reviewed above.
Fourth, as for the QEP’s effects in raising aggregate demand and prices, the effectssolely from increasing the monetary base under the zero bound constraint on interestrates were not detected or were small, if any, compared with the periods without the zero bound constraint on interest rates. When gauging the effects of the QEPbroadly, many studies show that the QEP had a greater monetary easing effect thanthat stemming from merely lowering the uncollateralized overnight call rate to zeropercent, while the effects of raising aggregate demand and prices nevertheless turnedout to be limited. Analytical results and interpretations are presented to indicate that, in addition to the zero bound constraint of the interest rate, major roles wereplayed by the substantial decline in responsiveness to monetary easing on the part ofcorporations and financial institutions resulting from their deteriorated core capitaldue to a plunge in asset prices.
35
Effects of the Quantitative Easing Policy: A Survey of Empirical Analyses
The largest effect of the QEP identified in this survey was through the channelthat works on the expected future path of short-term interest rates. This result suggests that when a central bank conducts monetary policy with due recognition ofthe zero bound constraint on interest rates, information dissemination concerningmonetary policy from the central bank to the private sector is critical to manifestingthe policy effects.
Regardless, empirical analyses on the channels and magnitude of the QEP’s effectsare still not sufficient. It is expected that with many additional studies the validity of the preliminary conclusions presented here will be scrutinized from various angles in the future. This paper now ends by listing several issues that deserve furtherempirical studies.
The first is the portfolio rebalancing effects. This survey did not find that theseeffects were strongly manifested. However, this area has yet to find a consensus ofmacroeconomic understanding, and thus lacks sufficient empirical analyses. Forexample, there has been no empirical verification that as the BOJ’s CABs increased,the yields on financial assets abroad declined by way of the carry trade utilizing yen,with extremely low funding costs, or that the real estate-related securities market wasaffected, and the transmission channels are not theoretically clear. As represented bythese examples, whether the QEP had subtle and broad-based effects on various assetmarkets awaits the accumulated results of further studies.
The second issue is the multifaceted examination of the commitment effect.According to the classification of Eggertsson and Woodford (2003), even when aneconomy has tumbled into a liquidity trap, the central bank’s credible commitment toeffecting economic recovery substantially in the future when the natural interest rateturns positive is theoretically expected to raise aggregate demand and prices throughfour channels: (1) by stimulating current spending even when current nominal inter-est rates face a zero bound constraint by maintaining nominal interest rates at a lowerlevel for longer in the future than would normally be expected; (2) by stimulating current spending by reducing real interest rates by generating inflation expectations; (3) by stimulating current spending from expectations that future income will increase;and (4) expectations that the inflation rate will rise in the future make it less likely forcurrent prices to fall. While empirical analyses on the policy duration effect havefocused especially on channel (1), studies have not quantitatively clarified the extent towhich each of the other channels that does not especially mediate financial markets waseffective. In addition, the extent to which the actual commitment diverges from thetheoretical optimal commitment, which is derived from the magnitude of the demandshock and price shock to the economy and the structure of Japan’s economy,40 would bean important, contentious issue in assessing the effects of the commitment policy.
The third issue is to what extent the QEP could have been effective if Japan’s economy had not gone through a substantial decline in asset prices and the associatederosion of core capital and risk-taking ability on the part of corporations and financialinstitutions, as witnessed during the 1990s to early 2000s. While we have begun to see
36 MONETARY AND ECONOMIC STUDIES/MARCH 2007
40. Oda and Nagahata (2005) examined the costs and benefits of maintaining zero interest rates by committing onlyto inflation rates in relation to the magnitude of demand and price shocks.
such studies as Kamada and Sugo (2006) recently on this question, their number isstill extremely few. In considering policy measures when short-term interest rates facea zero bound constraint in the course of the normal business cycle, it is essential tohave studies that explicitly differentiate the effects stemming from the QEP, structuraladjustment, and the zero bound constraint on interest rates.
The fourth issue concerns the significance of normal financial transactions becom-ing unprofitable under the QEP. In this regard, market practitioners have often notedthat declines in transactions in the short-term money market and declines in thecredit spreads of corporate bonds influence the efficiency of resource allocation.41
On the other hand, some consider such phenomena to be transitory adjustment costswhile financial schemes are unable to adapt to a zero interest rate environment(Bernanke and Reinhart [2004]). There have been almost no empirical analyses fromthese viewpoints, and the accumulated results of future studies are awaited.
37
Effects of the Quantitative Easing Policy: A Survey of Empirical Analyses
41. Shirakawa (2006) introduces such market practitioners’ viewpoints.
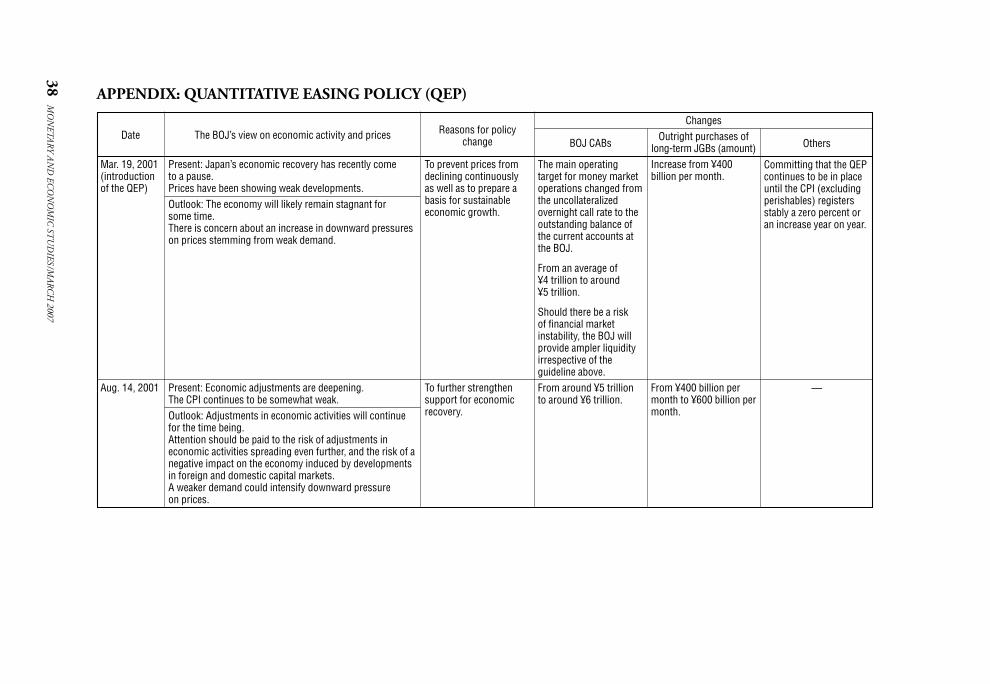
38M
ON
ETAR
Y AN
D EC
ON
OM
IC ST
UD
IES/M
AR
CH
2007
APPENDIX: QUANTITATIVE EASING POLICY (QEP)
Date
Mar. 19, 2001(introduction of the QEP)
Aug. 14, 2001
Reasons for policychange
To prevent prices fromdeclining continuouslyas well as to prepare abasis for sustainableeconomic growth.
To further strengthensupport for economicrecovery.
BOJ CABs
The main operating target for money marketoperations changed fromthe uncollateralizedovernight call rate to theoutstanding balance ofthe current accounts atthe BOJ.
From an average of ¥4 trillion to around ¥5 trillion.
Should there be a risk of financial market instability, the BOJ willprovide ampler liquidityirrespective of the guideline above.From around ¥5 trillionto around ¥6 trillion.
ChangesOutright purchases of
long-term JGBs (amount)Increase from ¥400 billion per month.
From ¥400 billion permonth to ¥600 billion permonth.
Others
Committing that the QEPcontinues to be in placeuntil the CPI (excludingperishables) registersstably a zero percent oran increase year on year.
—
The BOJ’s view on economic activity and prices
Present: Japan’s economic recovery has recently come to a pause. Prices have been showing weak developments.Outlook: The economy will likely remain stagnant for some time.There is concern about an increase in downward pressureson prices stemming from weak demand.
Present: Economic adjustments are deepening. The CPI continues to be somewhat weak.Outlook: Adjustments in economic activities will continuefor the time being.Attention should be paid to the risk of adjustments in economic activities spreading even further, and the risk of anegative impact on the economy induced by developmentsin foreign and domestic capital markets.A weaker demand could intensify downward pressure on prices.
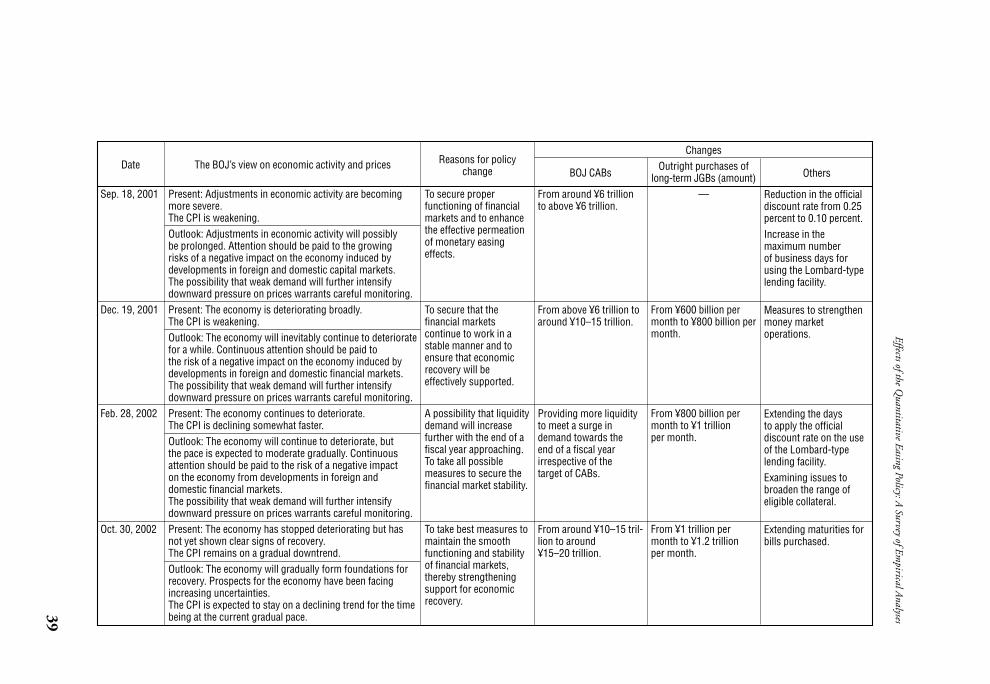
39
Effects of the Quantitative Easing Policy: A
Survey of Empirical A
nalyses
Date
Sep. 18, 2001
Dec. 19, 2001
Feb. 28, 2002
Oct. 30, 2002
Reasons for policychange
To secure proper functioning of financialmarkets and to enhancethe effective permeationof monetary easingeffects.
To secure that the financial markets continue to work in a stable manner and toensure that economicrecovery will be effectively supported.
A possibility that liquiditydemand will increase further with the end of a fiscal year approaching.To take all possible measures to secure thefinancial market stability.
To take best measures tomaintain the smoothfunctioning and stabilityof financial markets,thereby strengtheningsupport for economicrecovery.
BOJ CABs
From around ¥6 trillionto above ¥6 trillion.
From above ¥6 trillion toaround ¥10–15 trillion.
Providing more liquidityto meet a surge indemand towards the end of a fiscal year irrespective of the target of CABs.
From around ¥10–15 tril-lion to around ¥15–20 trillion.
ChangesOutright purchases of
long-term JGBs (amount)—
From ¥600 billion permonth to ¥800 billion permonth.
From ¥800 billion permonth to ¥1 trillion per month.
From ¥1 trillion permonth to ¥1.2 trillion per month.
Others
Reduction in the officialdiscount rate from 0.25percent to 0.10 percent. Increase in the maximum number of business days forusing the Lombard-typelending facility.
Measures to strengthenmoney market operations.
Extending the days to apply the official discount rate on the useof the Lombard-typelending facility.Examining issues tobroaden the range of eligible collateral.
Extending maturities forbills purchased.
The BOJ’s view on economic activity and prices
Present: Adjustments in economic activity are becomingmore severe. The CPI is weakening.Outlook: Adjustments in economic activity will possibly be prolonged. Attention should be paid to the growing risks of a negative impact on the economy induced bydevelopments in foreign and domestic capital markets. The possibility that weak demand will further intensifydownward pressure on prices warrants careful monitoring.Present: The economy is deteriorating broadly. The CPI is weakening.Outlook: The economy will inevitably continue to deterioratefor a while. Continuous attention should be paid to the risk of a negative impact on the economy induced by developments in foreign and domestic financial markets.The possibility that weak demand will further intensifydownward pressure on prices warrants careful monitoring.Present: The economy continues to deteriorate.The CPI is declining somewhat faster.Outlook: The economy will continue to deteriorate, but the pace is expected to moderate gradually. Continuousattention should be paid to the risk of a negative impact on the economy from developments in foreign and domestic financial markets.The possibility that weak demand will further intensifydownward pressure on prices warrants careful monitoring.Present: The economy has stopped deteriorating but hasnot yet shown clear signs of recovery.The CPI remains on a gradual downtrend.Outlook: The economy will gradually form foundations forrecovery. Prospects for the economy have been facingincreasing uncertainties.The CPI is expected to stay on a declining trend for the timebeing at the current gradual pace.
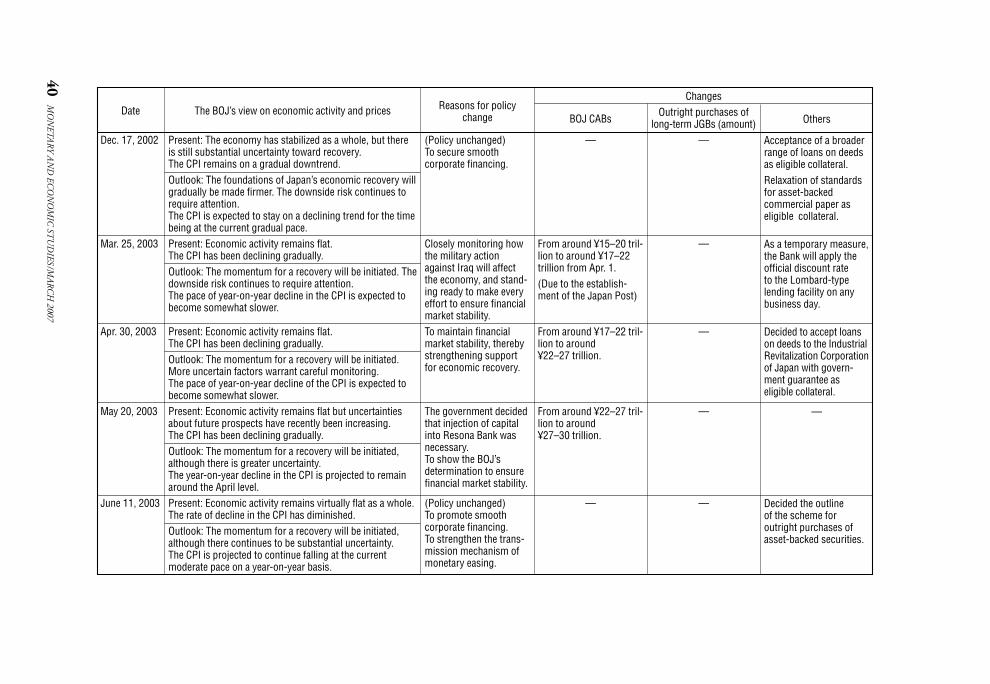
40M
ON
ETAR
Y AN
D EC
ON
OM
IC ST
UD
IES/M
AR
CH
2007
Date
Dec. 17, 2002
Mar. 25, 2003
Apr. 30, 2003
May 20, 2003
June 11, 2003
Reasons for policychange
(Policy unchanged)To secure smooth corporate financing.
Closely monitoring howthe military actionagainst Iraq will affectthe economy, and stand-ing ready to make everyeffort to ensure financialmarket stability.To maintain financialmarket stability, therebystrengthening supportfor economic recovery.
The government decidedthat injection of capitalinto Resona Bank wasnecessary.To show the BOJ’s determination to ensurefinancial market stability.
(Policy unchanged)To promote smooth corporate financing.To strengthen the trans-mission mechanism ofmonetary easing.
BOJ CABs
—
From around ¥15–20 tril-lion to around ¥17–22trillion from Apr. 1.(Due to the establish-ment of the Japan Post)
From around ¥17–22 tril-lion to around ¥22–27 trillion.
From around ¥22–27 tril-lion to around ¥27–30 trillion.
—
ChangesOutright purchases of
long-term JGBs (amount)—
—
—
—
—
Others
Acceptance of a broaderrange of loans on deedsas eligible collateral.Relaxation of standardsfor asset-backed commercial paper as eligible collateral.
As a temporary measure,the Bank will apply theofficial discount rate to the Lombard-type lending facility on anybusiness day.
Decided to accept loanson deeds to the IndustrialRevitalization Corporationof Japan with govern-ment guarantee as eligible collateral.
—
Decided the outline of the scheme for outright purchases ofasset-backed securities.
The BOJ’s view on economic activity and prices
Present: The economy has stabilized as a whole, but thereis still substantial uncertainty toward recovery.The CPI remains on a gradual downtrend.Outlook: The foundations of Japan’s economic recovery willgradually be made firmer. The downside risk continues torequire attention.The CPI is expected to stay on a declining trend for the timebeing at the current gradual pace.Present: Economic activity remains flat.The CPI has been declining gradually.Outlook: The momentum for a recovery will be initiated. Thedownside risk continues to require attention.The pace of year-on-year decline in the CPI is expected tobecome somewhat slower.
Present: Economic activity remains flat.The CPI has been declining gradually.Outlook: The momentum for a recovery will be initiated.More uncertain factors warrant careful monitoring. The pace of year-on-year decline of the CPI is expected tobecome somewhat slower.Present: Economic activity remains flat but uncertaintiesabout future prospects have recently been increasing.The CPI has been declining gradually.Outlook: The momentum for a recovery will be initiated,although there is greater uncertainty.The year-on-year decline in the CPI is projected to remainaround the April level.Present: Economic activity remains virtually flat as a whole.The rate of decline in the CPI has diminished.Outlook: The momentum for a recovery will be initiated,although there continues to be substantial uncertainty.The CPI is projected to continue falling at the current moderate pace on a year-on-year basis.
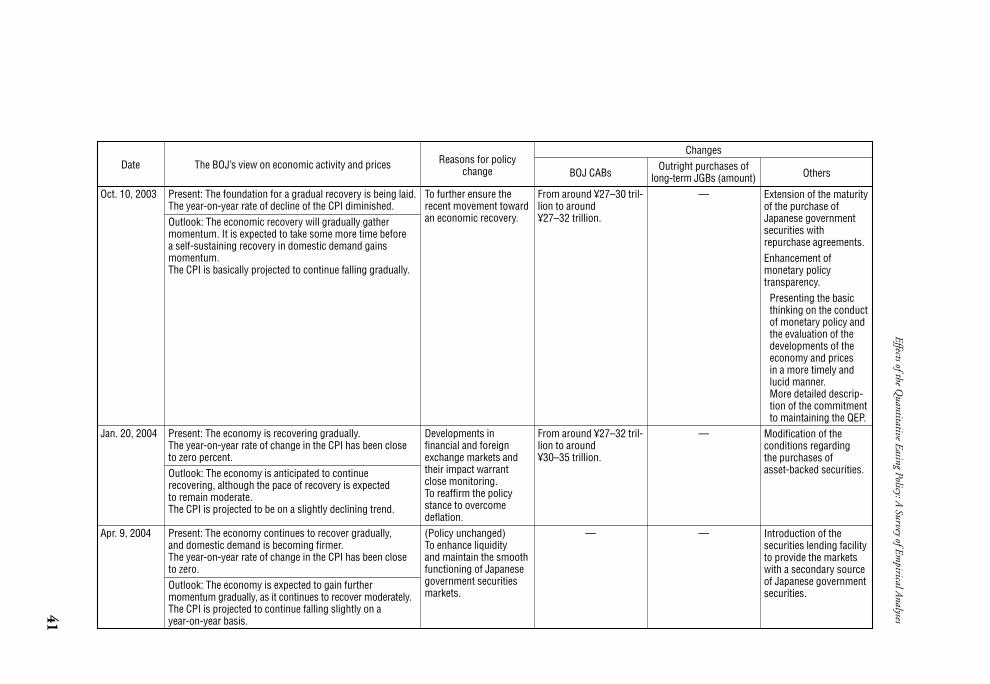
41
Effects of the Quantitative Easing Policy: A
Survey of Empirical A
nalyses
Date
Oct. 10, 2003
Jan. 20, 2004
Apr. 9, 2004
Reasons for policychange
To further ensure therecent movement towardan economic recovery.
Developments in financial and foreignexchange markets andtheir impact warrantclose monitoring.To reaffirm the policystance to overcomedeflation.(Policy unchanged)To enhance liquidity and maintain the smoothfunctioning of Japanesegovernment securitiesmarkets.
BOJ CABs
From around ¥27–30 tril-lion to around ¥27–32 trillion.
From around ¥27–32 tril-lion to around ¥30–35 trillion.
—
ChangesOutright purchases of
long-term JGBs (amount)—
—
—
Others
Extension of the maturityof the purchase ofJapanese governmentsecurities with repurchase agreements.Enhancement of monetary policy transparency.
Presenting the basicthinking on the conductof monetary policy andthe evaluation of thedevelopments of theeconomy and prices in a more timely andlucid manner.More detailed descrip-tion of the commitmentto maintaining the QEP.
Modification of the conditions regarding the purchases of asset-backed securities.
Introduction of the securities lending facilityto provide the marketswith a secondary sourceof Japanese governmentsecurities.
The BOJ’s view on economic activity and prices
Present: The foundation for a gradual recovery is being laid.The year-on-year rate of decline of the CPI diminished.Outlook: The economic recovery will gradually gathermomentum. It is expected to take some more time before a self-sustaining recovery in domestic demand gainsmomentum.The CPI is basically projected to continue falling gradually.
Present: The economy is recovering gradually.The year-on-year rate of change in the CPI has been closeto zero percent.Outlook: The economy is anticipated to continue recovering, although the pace of recovery is expected to remain moderate.The CPI is projected to be on a slightly declining trend.
Present: The economy continues to recover gradually, and domestic demand is becoming firmer.The year-on-year rate of change in the CPI has been closeto zero.Outlook: The economy is expected to gain further momentum gradually, as it continues to recover moderately.The CPI is projected to continue falling slightly on a year-on-year basis.
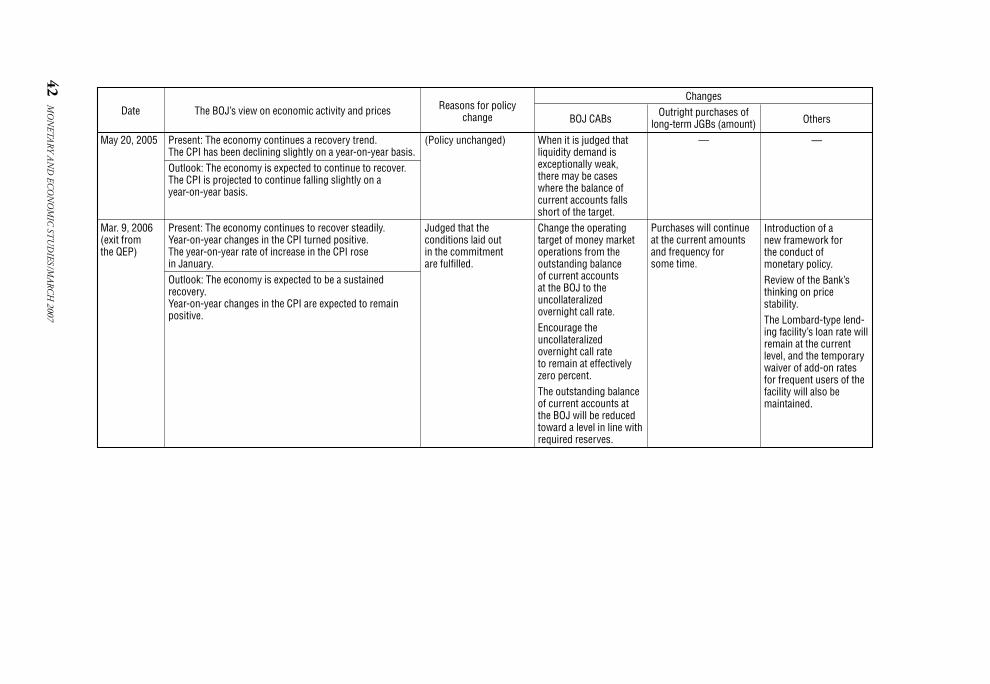
42M
ON
ETAR
Y AN
D EC
ON
OM
IC ST
UD
IES/M
AR
CH
2007
Date
May 20, 2005
Mar. 9, 2006(exit from the QEP)
Reasons for policychange
(Policy unchanged)
Judged that the conditions laid out in the commitment are fulfilled.
BOJ CABs
When it is judged thatliquidity demand isexceptionally weak, there may be caseswhere the balance of current accounts fallsshort of the target.Change the operatingtarget of money marketoperations from the outstanding balance of current accounts at the BOJ to the uncollateralizedovernight call rate.Encourage the uncollateralizedovernight call rate to remain at effectivelyzero percent.The outstanding balanceof current accounts atthe BOJ will be reducedtoward a level in line withrequired reserves.
ChangesOutright purchases of
long-term JGBs (amount)—
Purchases will continueat the current amountsand frequency for some time.
Others
—
Introduction of a new framework for the conduct of monetary policy.Review of the Bank’sthinking on price stability.The Lombard-type lend-ing facility’s loan rate willremain at the currentlevel, and the temporarywaiver of add-on ratesfor frequent users of thefacility will also be maintained.
The BOJ’s view on economic activity and prices
Present: The economy continues a recovery trend.The CPI has been declining slightly on a year-on-year basis.Outlook: The economy is expected to continue to recover.The CPI is projected to continue falling slightly on a year-on-year basis.
Present: The economy continues to recover steadily.Year-on-year changes in the CPI turned positive.The year-on-year rate of increase in the CPI rose in January.Outlook: The economy is expected to be a sustained recovery.Year-on-year changes in the CPI are expected to remainpositive.
Andrés, J., J. D. López-Salido, and E. Nelson, “Tobin’s Imperfect Asset Substitution in OptimizingGeneral Equilibrium,” Journal of Money, Credit and Banking, 36 (4), 2004, pp. 665–690.
Auerbach, A. J., and M. Obstfeld, “The Case for Open-Market Purchases in a Liquidity Trap,” AmericanEconomic Review, 95 (1), 2005, pp. 110–137.
Baba, N., M. Nakashima, Y. Shigemi, and K. Ueda, “The Bank of Japan’s Monetary Policy and BankRisk Premiums in the Money Market,” International Journal of Central Banking, 2 (1), 2006,pp. 105–135.
———, S. Nishioka, N. Oda, M. Shirakawa, K. Ueda, and H. Ugai, “Japan’s Deflation, Problems in theFinancial System and Monetary Policy,” Monetary and Economic Studies, 23 (1), Institute forMonetary and Economic Studies, Bank of Japan, 2005, pp. 47–111 (presented at UnderstandingLow Inflation and Deflation: A Conference Organized by the Bank for International Settlementson June 18–19, 2004).
Bank of Japan, “Annual Review of Monetary and Economic Developments in Fiscal 1997,” AnnualReview 1998, 1998, pp. 57–154.
———, Research and Statistics Department, “Price Developments in Japan—A Review Focusing on the1990s,” Bank of Japan Quarterly Bulletin, 9 (2), 2000, pp. 153–228.
———, “Minutes of the Monetary Policy Meeting on March 19, 2001,” Bank of Japan QuarterlyBulletin, 9 (2), 2001, pp. 72–87 (also available at http://www.boj.or.jp/en/type/release/teiki/giji/g010319.htm).
———, Policy Planning Office, “How Should the Recent Increase in Japan’s Monetary Base BeUnderstood?” Bank of Japan Quarterly Bulletin, 10 (4), 2002, pp. 139–172.
———, ———, “The Role of the Money Stock in Conducting Monetary Policy,” Bank of JapanQuarterly Bulletin, 11 (2), 2003, pp. 151–202.
———, “Outlook for Economic Activity and Prices October 2005,” Bank of Japan Quarterly Bulletin,14 (1), pp. 62–65, 2006a (also available at http://www.boj.or.jp/en/type/release/teiki/tenbo/gor0510.htm).
———, Financial Markets Department, “Money Market Operations in Fiscal 2005,” 2006b (also available at http://www.boj.or.jp/en/type/ronbun/ron/research/ron0608b.htm).
Benhabib, J., S. Schmitt-Grohé, and M. Uribe, “Avoiding Liquidity Traps,” Journal of Political Economy,110 (3), 2002, pp. 535–563.
Bernanke, B. S., “Japanese Monetary Policy: A Case of Self-Induced Paralysis?” in A. Posen and R. Mikitani,eds. Japan’s Financial Crisis and Its Parallels to US Experience, Special Report 13, Institute forInternational Economics, Washington, D.C., 2000, pp. 149–166.
———, “Some Thought on Monetary Policy in Japan,” Address to the Japan Society of MonetaryEconomics, 2003.
———, M. Gertler, and S. Gilchrist, “The Financial Accelerator in a Quantitative Business CycleFramework,” in J. B. Taylor and M. Woodford, eds. Handbook of Macroeconomics, Vol. 1C,Amsterdam: North-Holland, 1999, pp. 1341–1393.
———, and V. R. Reinhart, “Conducting Monetary Policy at Very Low Short-Term Interest Rates,”American Economic Review, 94 (2), 2004, pp. 85–90.
———, ———, and B. P. Sack, “Monetary Policy Alternatives at the Zero Bound: An EmpiricalAssessment,” Brookings Papers on Economic Activity, 2, 2004, pp. 1–78.
Clouse, J., D. Henderson, A. Orphanides, D. H. Small, and P. A. Tinsley, “Monetary Policy When theNominal Short-Term Interest Rate Is Zero,” Topics in Macroeconomics, 3 (1), article 12, 2003.
Cochrane, J. H., Asset Pricing, Chapter 1, Princeton, New Jersey: Princeton University Press, 2001.Coenen, G., and V. Wieland, “The Zero-Interest-Rate Bound and the Role of the Exchange Rate for
Monetary Policy in Japan,” Journal of Monetary Economics, 50 (5), 2003, pp. 1071–1101.Dixit, A., and R. Pindyck, Investment Under Uncertainty, Princeton, New Jersey: Princeton University
Press, 1994.Eggertsson, G., and M. Woodford, “The Zero Bound on Interest Rates and Optimal Monetary Policy,”
Brookings Papers on Economic Activity, 1, 2003, pp. 139–211.
43
Effects of the Quantitative Easing Policy: A Survey of Empirical Analyses
References
Fuchi, H., I. Muto, and H. Ugai, “A Historical Evaluation of Financial Accelerator Effects in Japan’sEconomy,” Bank of Japan Working Paper No. 05-E-8, Bank of Japan, 2005.
Fujiki, H., K. Okina, and S. Shiratsuka, “Monetary Policy under Zero Interest Rate: Viewpoints ofCentral Bank Economists,” Monetary and Economic Studies, 19 (1), Institute for Monetary andEconomic Studies, Bank of Japan, 2001, pp. 89–130.
———, ———, and ———, “Comments on ‘Price Stability and Japanese Monetary Policy’ (1),”Monetary and Economic Studies, 22 (3), Institute for Monetary and Economic Studies, Bank ofJapan, 2004, pp. 25–36.
———, and S. Shiratsuka, “Policy Duration Effects under the Zero Interest Rate Policy in 1999–2000:Evidence from Japan’s Money Market Data,” Monetary and Economic Studies, 20 (1), Institutefor Monetary and Economic Studies, Bank of Japan, 2001, pp. 1–32.
———, and K. Watanabe, “Japanese Demand for M1 and Demand Deposits: Cross-Sectional andTime-Series Evidence from Japan,” Monetary and Economic Studies, 22 (3), Institute forMonetary and Economic Studies, Bank of Japan, 2004, pp. 47–78.
Fujiwara, I., “Evaluating Monetary Policy When Nominal Interest Rates Are Almost Zero,” Journal ofthe Japanese and International Economies, 20 (3), 2006, pp. 434–453.
Fukao, M., “Defure, Furyo Saiken Mondai to Kin’yu Seisaku (Deflation, the NPL Problem and MonetaryPolicy),” in R. Komiya and Japan Center for Economic Research, eds. Kin’yu Seisaku Rongi noSoten—Nichigin Hihan to Sono Hanron (Main Issues of Monetary Policy Debates), NihonKeizai Shimbunsha, 2002, pp. 11–80 (in Japanese).
Fukui, T., “Opening Speech,” Monetary and Economic Studies, 24 (S-1), Institute for Monetary andEconomic Studies, Bank of Japan, 2006, pp. 9–12.
Goodfriend, M., “Overcoming the Zero Bound on Interest Rate Policy,” Journal of Money, Credit andBanking, 32 (4), Part 2, 2000, pp. 1007–1035.
Harada, Y., and S. Okamoto, “Ginko Kashidashi, Money, Sonota no Shikin Chotatsu Shudan no Yuisei(Comparison among Bank Loans, Money Supply, and Other Fund Procurement Methods),” inK. Hamada, Y. Harada, and Economic and Social Research Institute, Cabinet Office, eds. ChokiFukyo no Riron to Jissho (Theories and Empirical Analyses of Prolonged Stagnation), Toyo KeizaiShimposha, 2004, pp. 101–123 (in Japanese).
Hayakawa, H., and E. Maeda, “Understanding Japan’s Financial and Economic Developments sinceAutumn 1997,” Research and Statistics Department Working Paper No. 00-1, Bank of Japan,2000.
Hetzel, R. L., “Price Stability and Japanese Monetary Policy,” Monetary and Economic Studies, 22 (3),Institute for Monetary and Economic Studies, Bank of Japan, 2004, pp. 1–24.
Hori, K., M. Saito, and K. Ando, “1990 Nendai no Setsubi Toshi Teimei no Haikei ni tsuite (On the Causeof Fixed Investment Stagnation during the 1990s in Japan: Evidence from Panel Data of theFinancial Statements),” Keizai Keiei Kenkyu (Economics Today), 25 (4), Research Institute ofCapital Formation, Development Bank of Japan, 2004 (in Japanese).
Horiuchi, A., “Choki Teitai no Gen’in to Taiosaku (Causes and Measures against Prolonged Stagnation),”in K. Hamada, A. Horiuchi, and Economic and Social Research Institute, Cabinet Office, eds.Ronso Nihon no Keizai Kiki—Choki Teitai no Shin’in wo Kaimeisuru (Japan’s Economic Crisis),Nihon Keizai Shimbunsha, 2004, pp. 289–318 (in Japanese).
International Monetary Fund, “Japan: Financial System Stability Assessment and SupplementaryInformation,” IMF Country Report No. 03/287, 2003.
Iwamoto, Y., “Monetary and Fiscal Policy to Escape from a Deflationary Trap,” Monetary and EconomicStudies, 23 (1), Institute for Monetary and Economic Studies, Bank of Japan, 2005, pp. 1–46.
Iwata, K., Zero Kinri no Keizaigaku (Zero Interest Rate Policy), Diamondsha, 2000 (in Japanese).———, Defure no Keizaigaku (Economics of Deflation), Toyo Keizai Shimposha, 2001 (in Japanese).Jung, T., Y. Teranishi, and T. Watanabe, “Optimal Monetary Policy at the Zero-Interest-Rate Bound,”
Journal of Money, Credit and Banking, 37 (5), 2005, pp. 813–835.Kamada, K., and T. Sugo, “Evaluating Japanese Monetary Policy under the Non-Negativity Constraint
on Nominal Short-Term Interest Rates,” Bank of Japan Working Paper No. 06-E-17, Bank ofJapan, 2006.
44 MONETARY AND ECONOMIC STUDIES/MARCH 2007
Kimura, T., H. Kobayashi, J. Muranaga, and H. Ugai, “The Effect of the Increase in the Monetary Base onJapan’s Economy at Zero Interest Rates: An Empirical Analysis,” in Monetary Policy in a ChangingEnvironment, Bank for International Settlements Conference Series, 19, 2003, pp. 276–312.
———, and T. Kurozumi, “Effectiveness of History-Dependent Monetary Policy,” Journal of theJapanese and International Economies, 18 (3), 2004, pp. 330–361.
———, and D. Small, “Quantitative Monetary Easing and Risk in Financial Asset Markets,” The B.E.Journal of Macroeconomics, 6 (1), 2006.
King, M., “No Money, No Inflation: The Role of Money in the Economy,” Bank of England QuarterlyBulletin, Summer, 2002, pp. 162–177.
Kiyotaki, N., and J. Moore, “Liquidity, Business Cycles, and Monetary Policy,” mimeo, London Schoolof Economics, 2001.
Komiya, R., “Nichigin Hihan no Ronten no Kento (Examining the Point of Criticism for the Bank ofJapan’s Monetary Policy),” in R. Komiya and Japan Center for Economic Research, eds., Kin’yuSeisaku Rongi no Soten—Nichigin Hihan to Sono Hanron (Main Issues of Monetary PolicyDebates), Nihon Keizai Shimbunsha, 2002, pp. 235–312 (in Japanese).
Krugman, P., “It’s Baaack: Japan’s Slump and the Return of the Liquidity Trap,” Brookings Papers onEconomic Activity, 2, 1998, pp. 137–187.
———, “Thinking about the Liquidity Trap,” Journal of the Japanese and International Economies, 14 (4), 2000, pp. 221–237.
Kuttner, K. N., “Comments on ‘Price Stability and Japanese Monetary Policy’ (2),” Monetary and EconomicStudies, 22 (3), Institute for Monetary and Economic Studies, Bank of Japan, 2004, pp. 37–46.
———, and A. S. Posen, “The Great Recession: Lessons for Macroeconomic Policy from Japan,”Brookings Papers on Economic Activity, 2, 2001, pp. 93–160.
Marumo, K., T. Nakayama, S. Nishioka, and T. Yoshida, “Extracting Market Expectations on theDuration of the Zero Interest Rate Policy from Japan’s Bond Prices,” Financial MarketsDepartment Working Paper No. 03-E-2, Bank of Japan, 2003.
McCallum, B. T., “Theoretical Analysis Regarding a Zero Lower Bound on Nominal Interest Rates,”Journal of Money, Credit and Banking, 32 (4), Part 2, 2000, pp. 870–904.
———, “Japanese Monetary Policy Again,” Shadow Open Market Committee, 2001.———, “Japanese Monetary Policy 1991–2001,” Federal Reserve Bank of Richmond Economic Quarterly,
89 (1), Federal Reserve Bank of Richmond, 2003, pp. 1–31. McKinnon, R., “Comments on ‘Monetary Policy under Zero Inflation,’” Monetary and Economic Studies,
17 (3), Institute for Monetary and Economic Studies, Bank of Japan, 1999, pp. 183–188.Meltzer, A., “Monetary, Credit and (Other) Transmission Processes: A Monetarist Perspective,” Journal
of Economic Perspectives, 9 (4), 1995, pp. 49–72.———, “Comments: What More Can the Bank of Japan Do?” Monetary and Economic Studies, 17 (3),
Institute for Monetary and Economic Studies, Bank of Japan, 1999a, pp. 189–191.———, “Commentary: Monetary Policy at Zero Inflation,” in New Challenges for Monetary Policy:
A Symposium Sponsored by the Federal Reserve Bank of Kansas City, 1999b, pp. 261–276.———, “Monetary Transmission at Low Inflation: Some Clues from Japan in the 1990s,” Monetary and
Economic Studies, 19 (S-1), Institute for Monetary and Economic Studies, Bank of Japan, 2001,pp. 13–34.
Meyer, L. H., “Does Money Matter?” Federal Reserve Bank of St. Louis Review, 83 (5), Federal ReserveBank of St. Louis, 2001, pp. 1–15.
Mishkin, F. S., “Symposium on the Monetary Transmission Mechanism,” Journal of EconomicPerspectives, 9 (4), 1995, pp. 3–10.
Miyao, R., “Liquidity Traps and the Stability of Money Demand: Is Japan Really Trapped at the ZeroBound?” RIEB Discussion Paper No. 127, Kobe University, 2002.
———, “Use of the Money Supply in the Conduct of Japan’s Monetary Policy: Re-Examining the Time-Series Evidence,” The Japanese Economic Review, 56 (2), 2005, pp. 165–187.
———, Macro Kin’yu Seisaku no Jikeiretsu Bunseki: Seisaku Koka no Riron to Jissho (Time SeriesAnalysis of Macro Monetary Policy: Theories and Empirical Analyses of Policy Effects), Chapter3, Nihon Keizai Shimbunsha, 2006 (in Japanese).
45
Effects of the Quantitative Easing Policy: A Survey of Empirical Analyses
Motonishi, T., and H. Yoshikawa, “Causes of the Long Stagnation of Japan during the 1990s: Financialor Real?” Journal of the Japanese and International Economies, 13 (3), 1999, pp. 181–200.
Nelson, C. R., and A. F. Siegel, “Parsimonious Modeling of Yield Curves,” Journal of Business, 60 (4),1987, pp. 473–489.
Oda, N., and T. Nagahata, “On the Function of the Zero Interest Rate Commitment: Monetary PolicyRules in the Presence of the Zero Lower Bound on Interest Rates,” Bank of Japan Working PaperNo. 05-E-1, Bank of Japan, 2005.
———, and K. Okina, “Further Monetary Easing Policies under the Non-Negativity Constraints ofNominal Interest Rates: Summary of the Discussion Based on Japan’s Experience,” Monetaryand Economic Studies, 19 (S-1), Institute for Monetary and Economic Studies, Bank of Japan,2001, pp. 323–360.
———, and K. Ueda, “The Effects of the Bank of Japan’s Zero Interest Rate Commitment andQuantitative Monetary Easing on the Yield Curve: A Macro-Finance Approach,” Bank of JapanWorking Paper No. 05-E-6, Bank of Japan, 2005.
Okina, K., “Monetary Policy under Zero Inflation: A Response to Criticisms and Questions RegardingMonetary Policy,” Monetary and Economic Studies, 17 (3), Institute for Monetary and EconomicStudies, Bank of Japan, 1999a, pp. 157–182.
———, “Rejoinder to Comments Made by Professors McKinnon and Meltzer,” Monetary and EconomicStudies, 17 (3), Institute for Monetary and Economic Studies, Bank of Japan, 1999b, pp. 192–198.
———, and S. Shiratsuka, “Policy Commitment and Expectation Formation: Japan’s Experience under Zero Interest Rates,” North American Journal of Economics and Finance, 15 (1), 2004, pp. 75–100.
Reifschneider, D., and J. C. Williams, “Three Lessons for Monetary Policy in a Low Inflation Era,”Journal of Money, Credit and Banking, 32 (4), Part 2, 2000, pp. 936–966.
Sadahiro, A., Sengo Nihon no Macro Keizai Bunseki (Macroeconomic Analysis of the Postwar JapaneseEconomy), Chapter 9, Toyo Keizai Shimposha, 2005 (in Japanese).
Shinpo, S., “Defure wo Motarashita nowa Kozo Yoin ka, Kin’yu Seisaku ka (Which Is the Cause of Deflation,the Structural Adjustment Factor or Monetary Policy?),” in R. Komiya and Japan Center forEconomic Research, eds. Kin’yu Seisaku Rongi no Soten—Nichigin Hihan to Sono Hanron (MainIssues of Monetary Policy Debates), Nihon Keizai Shimbunsha, 2002, pp. 81–120 (in Japanese).
Shirakawa, M., “One Year Under ‘Quantitative Easing,’” IMES Discussion Paper No. 2002-E-3, Bank ofJapan, 2002.
———, “Panelists’ Remarks,” Monetary and Economic Studies, 24 (S-1), Institute for Monetary andEconomic Studies, Bank of Japan, 2006, pp. 252–261.
Steinsson, J., “Optimal Monetary Policy in an Economy with Inflation Persistence,” Journal of MonetaryEconomics, 50 (7), 2003, pp. 1425–1456.
Sugihara, S., T. Mihira, T. Takahashi, and M. Takeda, “Kin’yu Seisaku no Hakyu Keiro to SeisakuShudan (Monetary Policy in Japan—Instruments, Transmission Mechanisms, and Effects),”Economic Analysis Series, 162, Economic and Social Research Institute, Cabinet Office, 2000,pp. 115–435 (in Japanese).
Suzuki, A., and S. Kobayashi, “Ryoteki Kanwa Seisaku no Hyoka to Korekara no Kin’yu Seisaku (TheEffects of Quantitative Easing Policy and the Next Monetary Policy),” Soken Chosa (UFJ EconomicReport), 4, UFJ Institute Ltd., 2005 (in Japanese).
Svensson, L. E. O., “The Zero Bound in an Open Economy: A Foolproof Way of Escaping from aLiquidity Trap,” Monetary and Economic Studies, 19 (S-1), Institute for Monetary and EconomicStudies, Bank of Japan, 2001, pp. 277–312.
———, “Escaping from a Liquidity Trap and Deflation: A Foolproof Way and Others,” Journal ofEconomic Perspectives, 17 (4), 2003, pp. 145–166.
Takeda, Y., Y. Komaki, and K. Yajima, Kitai Keisei no Ishitsusei to Macro Keizai Seisaku: Keizai Shutai waDokomade Goriteki ka (Heterogeneity of Expectation Formation and Macro Economic Policy),Chapter 8, Toyo Keizai Shimposha, 2005 (in Japanese).
Ueda, K., “The Transmission Mechanism of Monetary Policy near Zero Interest Rates: The JapaneseExperience, 1998–2000,” in L. Mahadeva and P. Sinclair, eds. Monetary Transmission in DiverseEconomies, Cambridge University Press, 2002.
46 MONETARY AND ECONOMIC STUDIES/MARCH 2007
———, “The Bank of Japan’s Struggle with the Zero Lower Bound on Nominal Interest Rates: Exercisesin Expectations Management,” International Finance, 8, 2005, pp. 329–350.
Uhlig, H., “What Are the Effects of Monetary Policy on Output? Result from an Agnostic IdentificationProcedure,” Journal of Monetary Economics, 52 (2), 2005, pp. 381–419.
Vasicek, O., “An Equilibrium Characterization of the Term Structure,” Journal of Financial Economics, 5 (2), 1977, pp. 177–188.
Watanabe, T., and M. Iwamura, Atarashii Bukka Riron (Price Level Dynamics in a Liquidity Trap),Chapter 3, Iwanami Shoten, 2004 (in Japanese).
Woodford, M., Interest and Prices: Foundations of a Theory of Monetary Policy, Chapter 2, Princeton,New Jersey: Princeton University Press, 2003.
Yates, T., “Monetary Policy and the Zero Bound to Nominal Interest Rates,” Bank of England QuarterlyBulletin, Spring, 2003, pp. 27–37.
47
Effects of the Quantitative Easing Policy: A Survey of Empirical Analyses

48 MONETARY AND ECONOMIC STUDIES/MARCH 2007