Embed Size (px)
Citation preview
Progress in Oceanography xxx (2014) xxx–xxx
Contents lists available at ScienceDirect
Progress in Oceanography
journal homepage: www.elsevier .com/ locate /pocean
Effects of the Bering Strait closure on AMOC and global climateunder different background climates
http://dx.doi.org/10.1016/j.pocean.2014.02.0040079-6611/� 2014 Elsevier Ltd. All rights reserved.
⇑ Corresponding author. Tel.: +1 3034971334; fax: +1 3034971348.E-mail address: [email protected] (A. Hu).
Please cite this article in press as: Hu, A., et al. Effects of the Bering Strait closure on AMOC and global climate under different background climateOceanogr. (2014), http://dx.doi.org/10.1016/j.pocean.2014.02.004
Aixue Hu a,⇑, Gerald A. Meehl a, Weiqing Han b, Bette Otto-Bliestner a, Ayako Abe-Ouchi c,Nan Rosenbloom a
a Climate and Global Dynamics Division, National Center for Atmospheric Research, Boulder, CO 80305, USAb Department of Atmospheric and Oceanic Sciences, University of Colorado, Boulder, CO 80301, USAc Atmosphere and Ocean Research Institute, University of Tokyo, Chiba 277-8568, Japan
a r t i c l e i n f o a b s t r a c t
Article history:Available online xxxx
Previous studies have suggested that the status of the Bering Strait may have a significant influence onglobal climate variability on centennial, millennial, and even longer time scales. Here we use multipleversions of the National Center for Atmospheric Research (NCAR) Community Climate System Model(CCSM, versions 2 and 3) to investigate the influence of the Bering Strait closure/opening on the Atlan-tic Meridional Overturning Circulation (AMOC) and global mean climate under present-day, 15 thou-sand-year before present (kyr BP), and 112 kyr BP climate boundary conditions. Our results showthat regardless of the version of the model used or the widely different background climates, the BeringStrait’s closure produces a robust result of a strengthening of the AMOC, and an increase in the north-ward meridional heat transport in the Atlantic. As a consequence, the climate becomes warmer in theNorth Atlantic and the surrounding regions, but cooler in the North Pacific, leading to a seesaw-likeclimate change between these two basins. For the first time it is noted that the absence of the BeringStrait throughflow causes a slower motion of Arctic sea ice, a reduced upper ocean water exchangebetween the Arctic and North Atlantic, reduced sea ice export and less fresh water in the NorthAtlantic. These changes contribute positively to the increased upper ocean density there, thusstrengthening the AMOC. Potentially these changes in the North Atlantic could have a significant effecton the ice sheets both upstream and downstream in ice age climate, and further influence global sealevel changes.
� 2014 Elsevier Ltd. All rights reserved.
1. Introduction
The Bering Strait is a shallow and narrow strait connecting theNorth Pacific and the Arctic. Presently, about 0.8 Sv of relativelyfresher North Pacific water (Woodgate and Aagaard, 2005) is trans-ported through this strait into the Arctic, and subsequently into theNorth Atlantic. Studies show that this strait opened about 4.8–7.4million years ago (Marincovich and Gladenkov, 2001). The openingof the Bering Strait allows a short-cut communication between thePacific and the Atlantic via the Arctic. A series of previous studiesindicates that changes of the Bering Strait status, such as an open-ing or closing of this strait due to the raising and lowering of sealevel associated with the retreat or growth of the land-based icesheets, may have played an important role in modulating
glacial–interglacial climate variability (Shaffer and Bendtsen,1994; Nof, 2000; Nof and Van Gorder, 2003; De Bore and Nof,2004a,b; Hu and Meehl, 2005; Hu et al., 2007, 2008, 2010, 2011,2012a,b; Keigwin and Cook, 2007; Sandal and Nof, 2008a,b,c; Sar-nthein et al., 2009; Ortiz et al., 2012). This is because the openingor closing of the Bering Strait affects the water mass exchange,especially freshwater, between the Pacific and the North Atlantic,leading to changes of deep convection in the subpolar North Atlan-tic. This affects the production of North Atlantic Deep Water(NADW), thus resulting in changes to the global scale oceanic cir-culation involving the Atlantic Meridional Overturning Circulation(AMOC) or the Thermohaline Circulation (THC).
AMOC transports upper ocean warm and saline water into thesubpolar North Atlantic where this water loses its heat to the over-lying atmosphere and becomes dense, sinking to depth and flowingsouthward, and upwelling elsewhere in the world ocean (Dicksonand Brown, 1994; Stocker and Broecker, 1994). This circulation is
s. Prog.
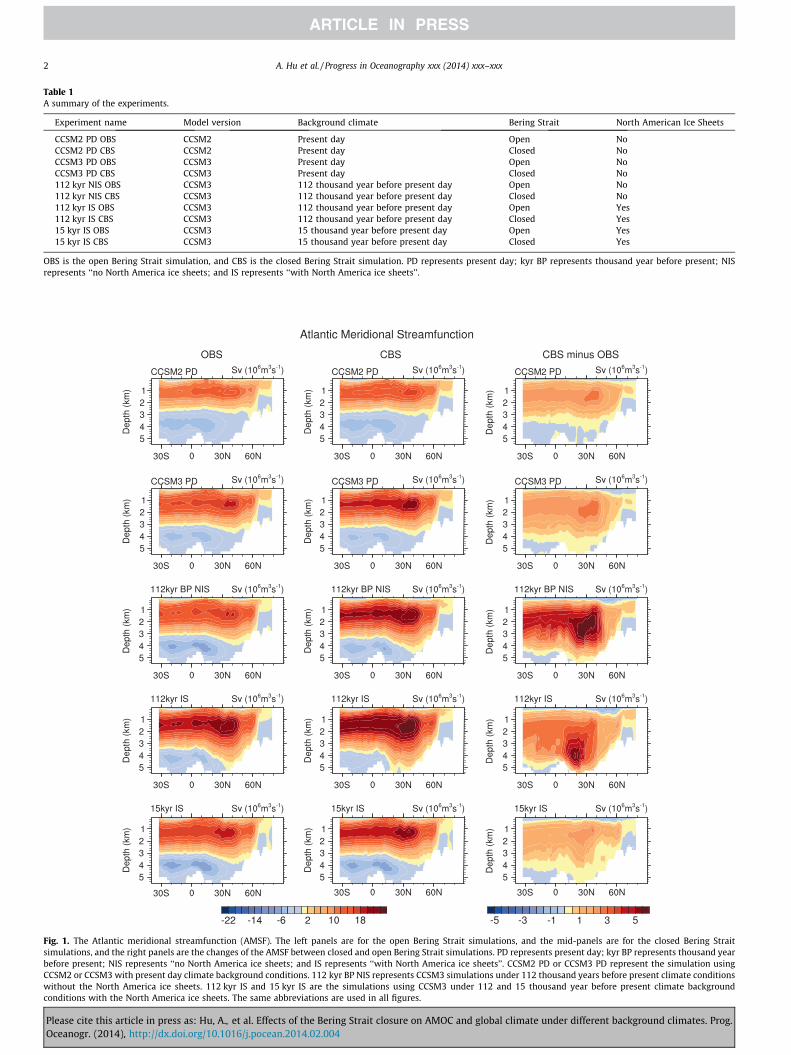
Table 1A summary of the experiments.
Experiment name Model version Background climate Bering Strait North American Ice Sheets
CCSM2 PD OBS CCSM2 Present day Open NoCCSM2 PD CBS CCSM2 Present day Closed NoCCSM3 PD OBS CCSM3 Present day Open NoCCSM3 PD CBS CCSM3 Present day Closed No112 kyr NIS OBS CCSM3 112 thousand year before present day Open No112 kyr NIS CBS CCSM3 112 thousand year before present day Closed No112 kyr IS OBS CCSM3 112 thousand year before present day Open Yes112 kyr IS CBS CCSM3 112 thousand year before present day Closed Yes15 kyr IS OBS CCSM3 15 thousand year before present day Open Yes15 kyr IS CBS CCSM3 15 thousand year before present day Closed Yes
OBS is the open Bering Strait simulation, and CBS is the closed Bering Strait simulation. PD represents present day; kyr BP represents thousand year before present; NISrepresents ‘‘no North America ice sheets; and IS represents ‘‘with North America ice sheets’’.
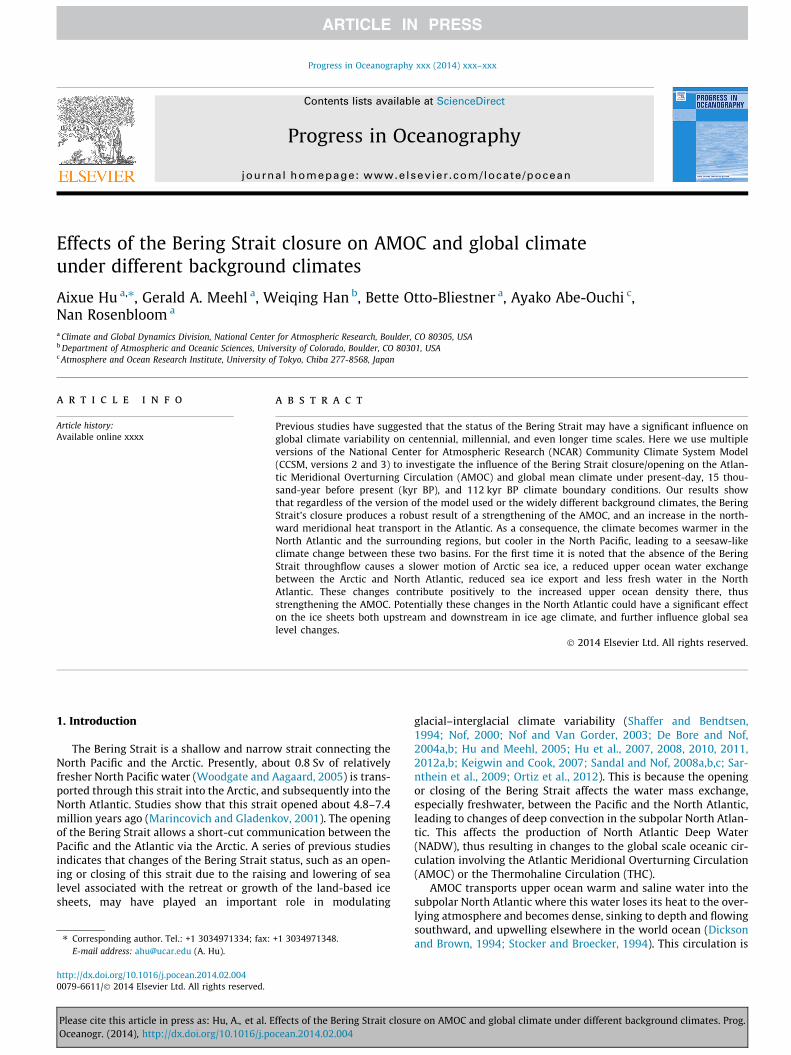
Fig. 1. The Atlantic meridional streamfunction (AMSF). The left panels are for the open Bering Strait simulations, and the mid-panels are for the closed Bering Straitsimulations, and the right panels are the changes of the AMSF between closed and open Bering Strait simulations. PD represents present day; kyr BP represents thousand yearbefore present; NIS represents ‘‘no North America ice sheets; and IS represents ‘‘with North America ice sheets’’. CCSM2 PD or CCSM3 PD represent the simulation usingCCSM2 or CCSM3 with present day climate background conditions. 112 kyr BP NIS represents CCSM3 simulations under 112 thousand years before present climate conditionswithout the North America ice sheets. 112 kyr IS and 15 kyr IS are the simulations using CCSM3 under 112 and 15 thousand year before present climate backgroundconditions with the North America ice sheets. The same abbreviations are used in all figures.
2 A. Hu et al. / Progress in Oceanography xxx (2014) xxx–xxx
Please cite this article in press as: Hu, A., et al. Effects of the Bering Strait closure on AMOC and global climate under different background climates. Prog.Oceanogr. (2014), http://dx.doi.org/10.1016/j.pocean.2014.02.004
Table 2The oceanic mean state of the open and closed Bering Strait simulations.
CCSM2 PD CCSM3 PD 112 kyr NIS 112 kyr IS 15 kyr IS
OBS CBS OBS CBS OBS CBS OBS CBS OBS CBS
AMOC 15.7 18.3 19.4 22.2 19.2 24.5 24.9 27.9 19.5 22.1NAMHT 24�N 0.84 0.98 1.05 1.19 1.04 1.26 1.25 1.39 1.19 1.32NPMHT 24�N 0.91 0.77 0.88 0.76 0.87 0.74 0.82 0.79 0.78 0.71SPMHT 30�S �0.45 �0.60 �0.61 �0.76 �0.77 �0.97 �0.92 �1.08 �0.86 �0.96Arc-Atl FW �0.171 �0.114 �0.218 �0.150 �0.072 �0.047 �0.055 0.007 �0.017 0.043NPMHF 40�N �0.23 �0.32 �0.25 �0.32 �0.26 �0.32 �0.23 �0.33 �0.23 �0.30BS transport 0.81 – 0.86 – 0.78 – 1.02 – 0.83 –BS FW transport 0.062 – 0.081 – 0.067 – 0.093 – 0.063 –Arc-Atl SIE �0.129 �0.124 �0.181 �0.167 �0.349 �0.317 �0.412 �0.344 �0.402 �0.364
The units for Atlantic meridional overturning circulation (AMOC), Arctic to Atlantic freshwater transport (Arc-Atl FW), North Pacific freshwater transport at 40�N (NPMHF40�N), Bering Strait mass (BS transport) and freshwater transports (BS FW transport), and Arctic to Atlantic sea ice export (Arc-Atl SIE) are Sv (106 m3 s�1), and for the NorthAtlantic meridional heat transport at 24�N (NAMHT 24�N), North (South) Pacific meridional heat transport at 24�N (30�S) (NPMHT 24�N or SPMHT 30�S) are PW (1015 W). OBSis the open Bering Strait simulation, and CBS is the closed Bering Strait simulation. PD represents present day; kyr BP represents thousand year before present; NIS represents‘‘no North America ice sheets; and IS represents ‘‘with North America ice sheets’’.
a b
c d
e
f
Fig. 2. Percentage changes of the Atlantic meridional overturning circulation (AMOC), Atlantic meridional heat transport (MHT) at 24�N, Pacific MHT at 24�N and 30�S, theliquid freshwater transport (FWT) from Arctic to the North Atlantic, and the FWT in the Pacific at 40�N.
A. Hu et al. / Progress in Oceanography xxx (2014) xxx–xxx 3
Please cite this article in press as: Hu, A., et al. Effects of the Bering Strait closure on AMOC and global climate under different background climates. Prog.Oceanogr. (2014), http://dx.doi.org/10.1016/j.pocean.2014.02.004
4 A. Hu et al. / Progress in Oceanography xxx (2014) xxx–xxx
important to the Atlantic and global climate because the AMOCcarries a significant amount of heat to the North Atlantic (Gana-chaud and Wunsch, 2000), resulting in a mild climate downstreamin Europe. Numerical simulations (e.g., Keigwin and Jones, 1994;Sakai and Peltier, 1997; Stouffer et al., 2006; Hu et al., 2013) andpaleo-proxy records (Alley and MacAyeal, 1994; Broecker, 1994;Zahn et al., 1997; Clark et al., 2007; Gutjahr et al., 2010) suggestthat the collapse of this circulation could induce significant coolingevents, such as the Heinrich events (Heinrich, 1988; Hemming,2004). Studies also suggest that variations of this circulation canaffect the response of the climate system to greenhouse gas forcingin the future (e.g., Manabe et al., 1991; Delworth et al., 1993; Tim-mermann et al., 1998, 2005a,b; Schmittner and Stocker, 1999; Huet al., 2004a; Gregory et al., 2005; Schmittner et al., 2005; Dahlet al., 2005; Zhang and Delworth, 2005; Levermann et al., 2005;Broccoli et al., 2006).
Previous studies indicate that the response of the AMOC tobuoyancy forcing in the North Atlantic will affect the strength ofthe Bering Strait throughflow, but changes of the Bering Straitthroughflow can also feed back to the strength of the AMOC (Shaf-fer and Bendtsen, 1994; De Bore and Nof, 2004a,b; Hu and Meehl,2005; Hu et al., 2007, 2008, 2009, 2010, 2011, 2012a,b, 2013). Un-der present day climate, the relatively fresh Pacific water flowsthrough this strait into the Arctic (Woodgate and Aagaard, 2005).Then the freshwater carried by this throughflow is transported intothe subpolar North Atlantic as liquid water or sea ice via the FramStrait. This freshwater can influence the deep convection in theNorth Atlantic subpolar seas, and thus the strength of the AMOC.
a
c
e
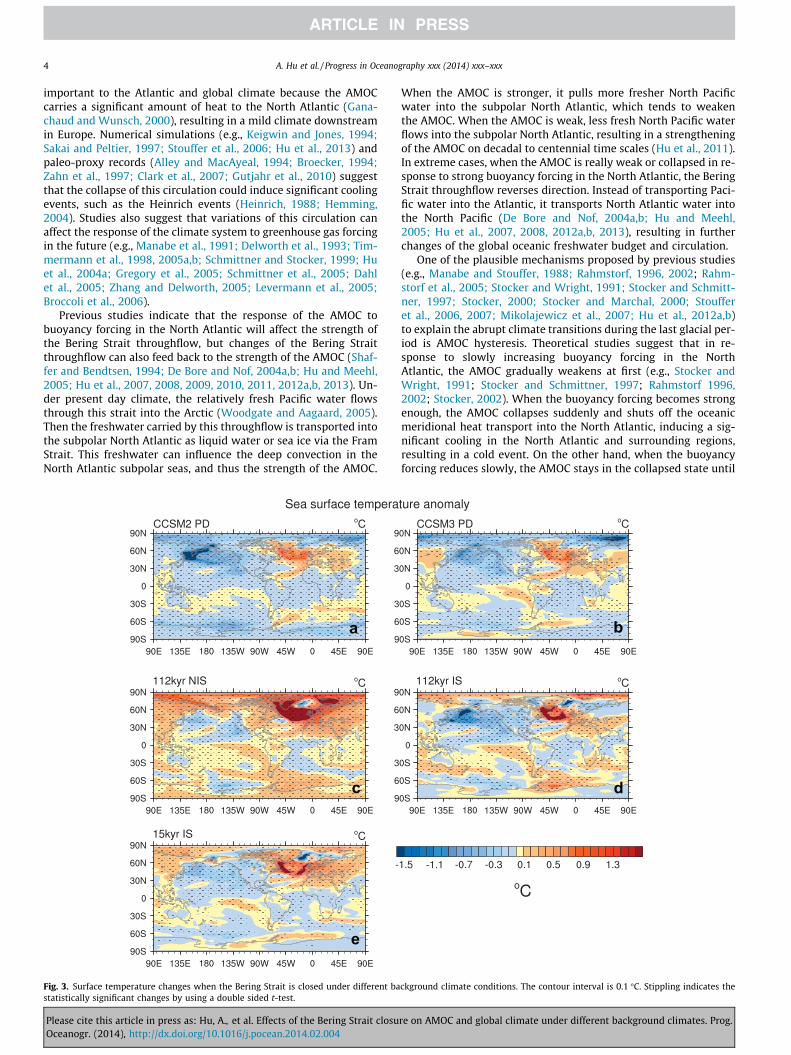
Fig. 3. Surface temperature changes when the Bering Strait is closed under different bastatistically significant changes by using a double sided t-test.
Please cite this article in press as: Hu, A., et al. Effects of the Bering Strait closuOceanogr. (2014), http://dx.doi.org/10.1016/j.pocean.2014.02.004
When the AMOC is stronger, it pulls more fresher North Pacificwater into the subpolar North Atlantic, which tends to weakenthe AMOC. When the AMOC is weak, less fresh North Pacific waterflows into the subpolar North Atlantic, resulting in a strengtheningof the AMOC on decadal to centennial time scales (Hu et al., 2011).In extreme cases, when the AMOC is really weak or collapsed in re-sponse to strong buoyancy forcing in the North Atlantic, the BeringStrait throughflow reverses direction. Instead of transporting Paci-fic water into the Atlantic, it transports North Atlantic water intothe North Pacific (De Bore and Nof, 2004a,b; Hu and Meehl,2005; Hu et al., 2007, 2008, 2012a,b, 2013), resulting in furtherchanges of the global oceanic freshwater budget and circulation.
One of the plausible mechanisms proposed by previous studies(e.g., Manabe and Stouffer, 1988; Rahmstorf, 1996, 2002; Rahm-storf et al., 2005; Stocker and Wright, 1991; Stocker and Schmitt-ner, 1997; Stocker, 2000; Stocker and Marchal, 2000; Stoufferet al., 2006, 2007; Mikolajewicz et al., 2007; Hu et al., 2012a,b)to explain the abrupt climate transitions during the last glacial per-iod is AMOC hysteresis. Theoretical studies suggest that in re-sponse to slowly increasing buoyancy forcing in the NorthAtlantic, the AMOC gradually weakens at first (e.g., Stocker andWright, 1991; Stocker and Schmittner, 1997; Rahmstorf 1996,2002; Stocker, 2002). When the buoyancy forcing becomes strongenough, the AMOC collapses suddenly and shuts off the oceanicmeridional heat transport into the North Atlantic, inducing a sig-nificant cooling in the North Atlantic and surrounding regions,resulting in a cold event. On the other hand, when the buoyancyforcing reduces slowly, the AMOC stays in the collapsed state until
b
d
ckground climate conditions. The contour interval is 0.1 �C. Stippling indicates the
re on AMOC and global climate under different background climates. Prog.
A. Hu et al. / Progress in Oceanography xxx (2014) xxx–xxx 5
the buoyancy forcing becomes small enough, then the AMOC sud-denly restarts again, and the oceanic meridional heat transport intothe North Atlantic resumes, leading to a warm event, such as theDansgaard/Oeschger events (Dansgaard et al., 1993; Ditlevsenet al., 2005). A recent coupled climate model study suggests that
a
c
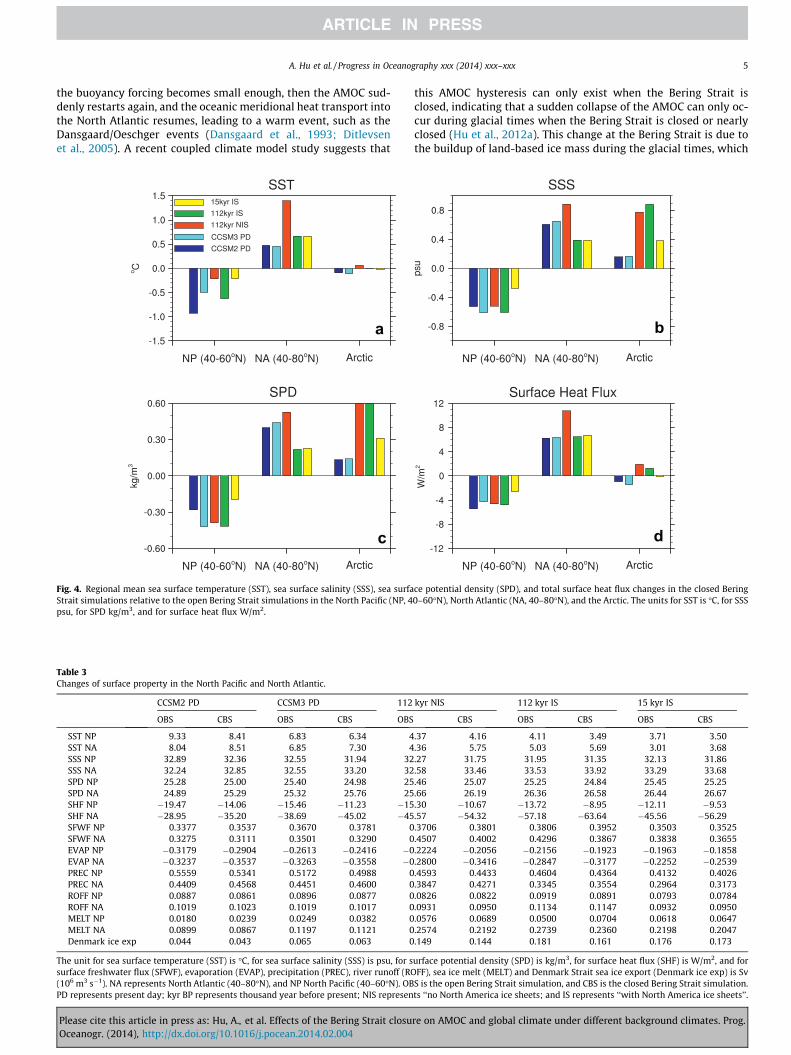
Fig. 4. Regional mean sea surface temperature (SST), sea surface salinity (SSS), sea surfaStrait simulations relative to the open Bering Strait simulations in the North Pacific (NP, 4psu, for SPD kg/m3, and for surface heat flux W/m2.
Table 3Changes of surface property in the North Pacific and North Atlantic.
CCSM2 PD CCSM3 PD 112
OBS CBS OBS CBS OBS
SST NP 9.33 8.41 6.83 6.34 4SST NA 8.04 8.51 6.85 7.30 4SSS NP 32.89 32.36 32.55 31.94 32SSS NA 32.24 32.85 32.55 33.20 32SPD NP 25.28 25.00 25.40 24.98 25SPD NA 24.89 25.29 25.32 25.76 25SHF NP �19.47 �14.06 �15.46 �11.23 �15SHF NA �28.95 �35.20 �38.69 �45.02 �45SFWF NP 0.3377 0.3537 0.3670 0.3781 0SFWF NA 0.3275 0.3111 0.3501 0.3290 0EVAP NP �0.3179 �0.2904 �0.2613 �0.2416 �0EVAP NA �0.3237 �0.3537 �0.3263 �0.3558 �0PREC NP 0.5559 0.5341 0.5172 0.4988 0PREC NA 0.4409 0.4568 0.4451 0.4600 0ROFF NP 0.0887 0.0861 0.0896 0.0877 0ROFF NA 0.1019 0.1023 0.1019 0.1017 0MELT NP 0.0180 0.0239 0.0249 0.0382 0MELT NA 0.0899 0.0867 0.1197 0.1121 0Denmark ice exp 0.044 0.043 0.065 0.063 0
The unit for sea surface temperature (SST) is �C, for sea surface salinity (SSS) is psu, for ssurface freshwater flux (SFWF), evaporation (EVAP), precipitation (PREC), river runoff (RO(106 m3 s�1). NA represents North Atlantic (40–80�N), and NP North Pacific (40–60�N). OBPD represents present day; kyr BP represents thousand year before present; NIS represen
Please cite this article in press as: Hu, A., et al. Effects of the Bering Strait closuOceanogr. (2014), http://dx.doi.org/10.1016/j.pocean.2014.02.004
this AMOC hysteresis can only exist when the Bering Strait isclosed, indicating that a sudden collapse of the AMOC can only oc-cur during glacial times when the Bering Strait is closed or nearlyclosed (Hu et al., 2012a). This change at the Bering Strait is due tothe buildup of land-based ice mass during the glacial times, which
b
d
ce potential density (SPD), and total surface heat flux changes in the closed Bering0–60�N), North Atlantic (NA, 40–80�N), and the Arctic. The units for SST is �C, for SSS
kyr NIS 112 kyr IS 15 kyr IS
CBS OBS CBS OBS CBS
.37 4.16 4.11 3.49 3.71 3.50
.36 5.75 5.03 5.69 3.01 3.68
.27 31.75 31.95 31.35 32.13 31.86
.58 33.46 33.53 33.92 33.29 33.68
.46 25.07 25.25 24.84 25.45 25.25
.66 26.19 26.36 26.58 26.44 26.67
.30 �10.67 �13.72 �8.95 �12.11 �9.53
.57 �54.32 �57.18 �63.64 �45.56 �56.29
.3706 0.3801 0.3806 0.3952 0.3503 0.3525
.4507 0.4002 0.4296 0.3867 0.3838 0.3655
.2224 �0.2056 �0.2156 �0.1923 �0.1963 �0.1858
.2800 �0.3416 �0.2847 �0.3177 �0.2252 �0.2539
.4593 0.4433 0.4604 0.4364 0.4132 0.4026
.3847 0.4271 0.3345 0.3554 0.2964 0.3173
.0826 0.0822 0.0919 0.0891 0.0793 0.0784
.0931 0.0950 0.1134 0.1147 0.0932 0.0950
.0576 0.0689 0.0500 0.0704 0.0618 0.0647
.2574 0.2192 0.2739 0.2360 0.2198 0.2047
.149 0.144 0.181 0.161 0.176 0.173
urface potential density (SPD) is kg/m3, for surface heat flux (SHF) is W/m2, and forFF), sea ice melt (MELT) and Denmark Strait sea ice export (Denmark ice exp) is Sv
S is the open Bering Strait simulation, and CBS is the closed Bering Strait simulation.ts ‘‘no North America ice sheets; and IS represents ‘‘with North America ice sheets’’.
re on AMOC and global climate under different background climates. Prog.
6 A. Hu et al. / Progress in Oceanography xxx (2014) xxx–xxx
moves water from the ocean to land and lowers the global sea le-vel, resulting in the closure of the Bering Strait. This closed BeringStrait effectively shuts off the water mass exchange from the NorthPacific to North Atlantic via the Arctic. As a result, the externalbuoyancy forcing added into the North Atlantic, such as ice sheetmelt water, is not transported out of the North Atlantic efficiently,leading to an accumulation of the buoyancy flux in the subpolarNorth Atlantic and the Arctic, resulting in a shutoff of the NADWformation, and the sudden collapse of the AMOC. On the otherhand, an open Bering Strait reduces the flow of fresher North Paci-fic water into the North Atlantic when the AMOC weakens. Theadded buoyancy flux in the subpolar North Atlantic can then be ex-ported into the Pacific via the Bering Strait when the AMOC is veryweak, thus preventing a sudden collapse of the AMOC (Hu et al.,2012a). Instead, the AMOC can only slowly weaken/strengthen asthe freshwater forcing in the North Atlantic is enhanced/weakened.
Previous studies also suggest that the closure or opening of theBering Strait itself could affect the glacial climate by modifying thestrength of the AMOC (Hu et al., 2010). This has been supported byrecent observational evidence (Grützner and Higgins, 2010). Dur-ing the early last glacial period, the closure of the Bering Strait en-hanced the AMOC via preventing the fresher North Pacific waterfrom being transported into the North Atlantic via the Arctic. Thisstrengthened AMOC then transported more heat into the NorthAtlantic, and thus warmed the North Atlantic and the surroundingregions which led to the initial melt-back of the ice sheets in NorthAmerica. Once the ice sheets start to melt, the ice sheet surface
a
c
e
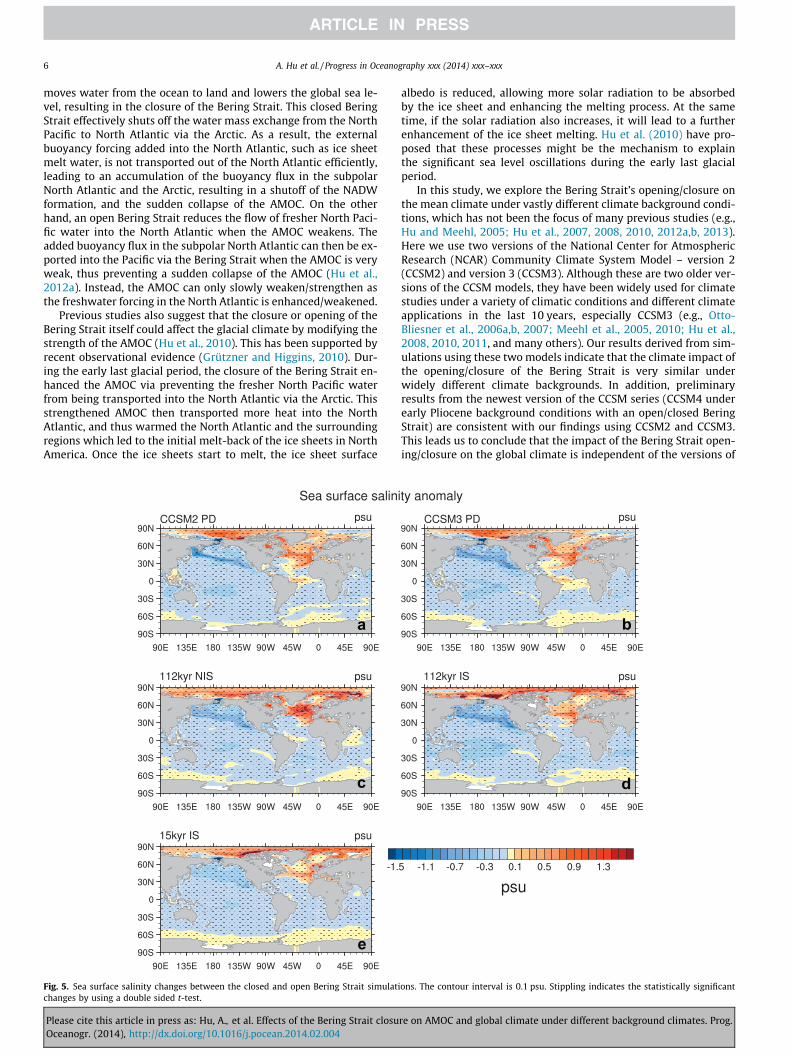
Fig. 5. Sea surface salinity changes between the closed and open Bering Strait simulatchanges by using a double sided t-test.
Please cite this article in press as: Hu, A., et al. Effects of the Bering Strait closuOceanogr. (2014), http://dx.doi.org/10.1016/j.pocean.2014.02.004
albedo is reduced, allowing more solar radiation to be absorbedby the ice sheet and enhancing the melting process. At the sametime, if the solar radiation also increases, it will lead to a furtherenhancement of the ice sheet melting. Hu et al. (2010) have pro-posed that these processes might be the mechanism to explainthe significant sea level oscillations during the early last glacialperiod.
In this study, we explore the Bering Strait’s opening/closure onthe mean climate under vastly different climate background condi-tions, which has not been the focus of many previous studies (e.g.,Hu and Meehl, 2005; Hu et al., 2007, 2008, 2010, 2012a,b, 2013).Here we use two versions of the National Center for AtmosphericResearch (NCAR) Community Climate System Model – version 2(CCSM2) and version 3 (CCSM3). Although these are two older ver-sions of the CCSM models, they have been widely used for climatestudies under a variety of climatic conditions and different climateapplications in the last 10 years, especially CCSM3 (e.g., Otto-Bliesner et al., 2006a,b, 2007; Meehl et al., 2005, 2010; Hu et al.,2008, 2010, 2011, and many others). Our results derived from sim-ulations using these two models indicate that the climate impact ofthe opening/closure of the Bering Strait is very similar underwidely different climate backgrounds. In addition, preliminaryresults from the newest version of the CCSM series (CCSM4 underearly Pliocene background conditions with an open/closed BeringStrait) are consistent with our findings using CCSM2 and CCSM3.This leads us to conclude that the impact of the Bering Strait open-ing/closure on the global climate is independent of the versions of
b
d
ions. The contour interval is 0.1 psu. Stippling indicates the statistically significant
re on AMOC and global climate under different background climates. Prog.
A. Hu et al. / Progress in Oceanography xxx (2014) xxx–xxx 7
the CCSM models used in this study, and also is independent of thebackground climates. These results imply that the underlyingphysical mechanisms explored in this study are very likely to beat work for other coupled models as well based on the vast differ-ence in physics and numerics among these three versions of theCCSM model. Of course, to test these mechanisms further, a com-parison study using different coupled models is ideal for the future,but out of the scope of this study. The rest of the paper is organizedas follows: Section 2 describes the models and experiments; Sec-tion 3 shows the results; and Section 4 gives the discussion andconclusions.
2. Models and experiments
2.1. Models
Here we use two versions of the NCAR Community Climate Sys-tem Model – CCSM2 (Kiehl and Gent, 2004) and CCSM3 (Collinset al., 2006). The atmospheric components in CCSM2 and CCSM3are the NCAR Community Atmospheric Model version 2 (CAM2)and version 3 (CAM3, Collins et al., 2004), respectively. Both usespectral dynamics at T42 resolution and 26 hybrid levels vertically.The ocean component of both models is a version of the ParallelOcean Program (POP) developed at Los Alamos National Lab with1� horizontal resolution and enhanced meridional resolution
a
c
e
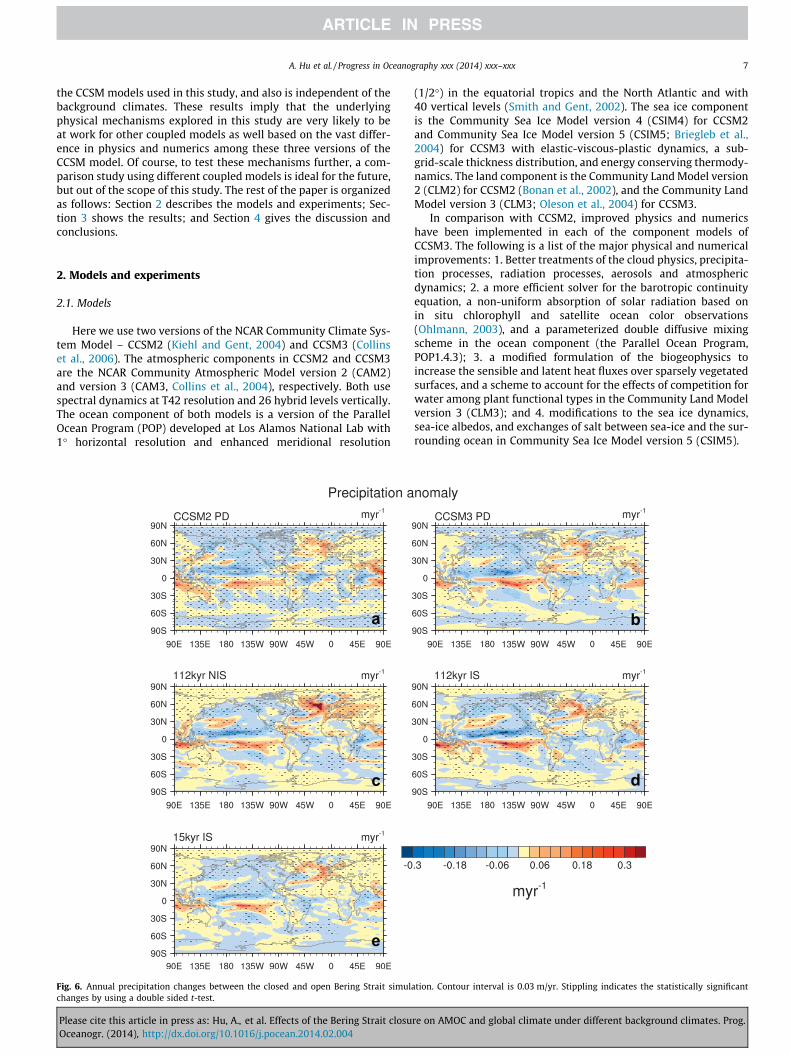
Fig. 6. Annual precipitation changes between the closed and open Bering Strait simulchanges by using a double sided t-test.
Please cite this article in press as: Hu, A., et al. Effects of the Bering Strait closuOceanogr. (2014), http://dx.doi.org/10.1016/j.pocean.2014.02.004
(1/2�) in the equatorial tropics and the North Atlantic and with40 vertical levels (Smith and Gent, 2002). The sea ice componentis the Community Sea Ice Model version 4 (CSIM4) for CCSM2and Community Sea Ice Model version 5 (CSIM5; Briegleb et al.,2004) for CCSM3 with elastic-viscous-plastic dynamics, a sub-grid-scale thickness distribution, and energy conserving thermody-namics. The land component is the Community Land Model version2 (CLM2) for CCSM2 (Bonan et al., 2002), and the Community LandModel version 3 (CLM3; Oleson et al., 2004) for CCSM3.
In comparison with CCSM2, improved physics and numericshave been implemented in each of the component models ofCCSM3. The following is a list of the major physical and numericalimprovements: 1. Better treatments of the cloud physics, precipita-tion processes, radiation processes, aerosols and atmosphericdynamics; 2. a more efficient solver for the barotropic continuityequation, a non-uniform absorption of solar radiation based onin situ chlorophyll and satellite ocean color observations(Ohlmann, 2003), and a parameterized double diffusive mixingscheme in the ocean component (the Parallel Ocean Program,POP1.4.3); 3. a modified formulation of the biogeophysics toincrease the sensible and latent heat fluxes over sparsely vegetatedsurfaces, and a scheme to account for the effects of competition forwater among plant functional types in the Community Land Modelversion 3 (CLM3); and 4. modifications to the sea ice dynamics,sea-ice albedos, and exchanges of salt between sea-ice and the sur-rounding ocean in Community Sea Ice Model version 5 (CSIM5).
b
d
ation. Contour interval is 0.03 m/yr. Stippling indicates the statistically significant
re on AMOC and global climate under different background climates. Prog.
8 A. Hu et al. / Progress in Oceanography xxx (2014) xxx–xxx
Although both versions of the CCSM model used in this studyproduce stable global mean climate comparable to observations(Kiehl and Gent, 2004; Otto-Bliesner et al., 2006b; Collins et al.,2006), with all of the above-mentioned improvements in physicsand numerics, the simulated climate in the CCSM3 control experi-ment run under 1990s conditions is better than that in CCSM2when compared with observations (Collins et al., 2006, e.g. theirFigs. 5 and 6, and see also the references therein). The majorimprovements of the simulated climate in CCSM3 relative toCCSM2 include a reduced cold bias in the polar regions of the uppertroposphere and in the tropical tropopause, a better energy balanceat both surface and top of the atmosphere, a reduced sea surfacetemperature and salinity bias in many regions of the world ocean,a closer to observed Atlantic meridional heat transport, and a bet-ter sea ice thickness distribution. A more detailed description ofthese improvements can be found in Collins et al. (2006) and thereferences therein.
We run experiments, described below, in both model versionswith their various differences to document how consistent are
a
c
e
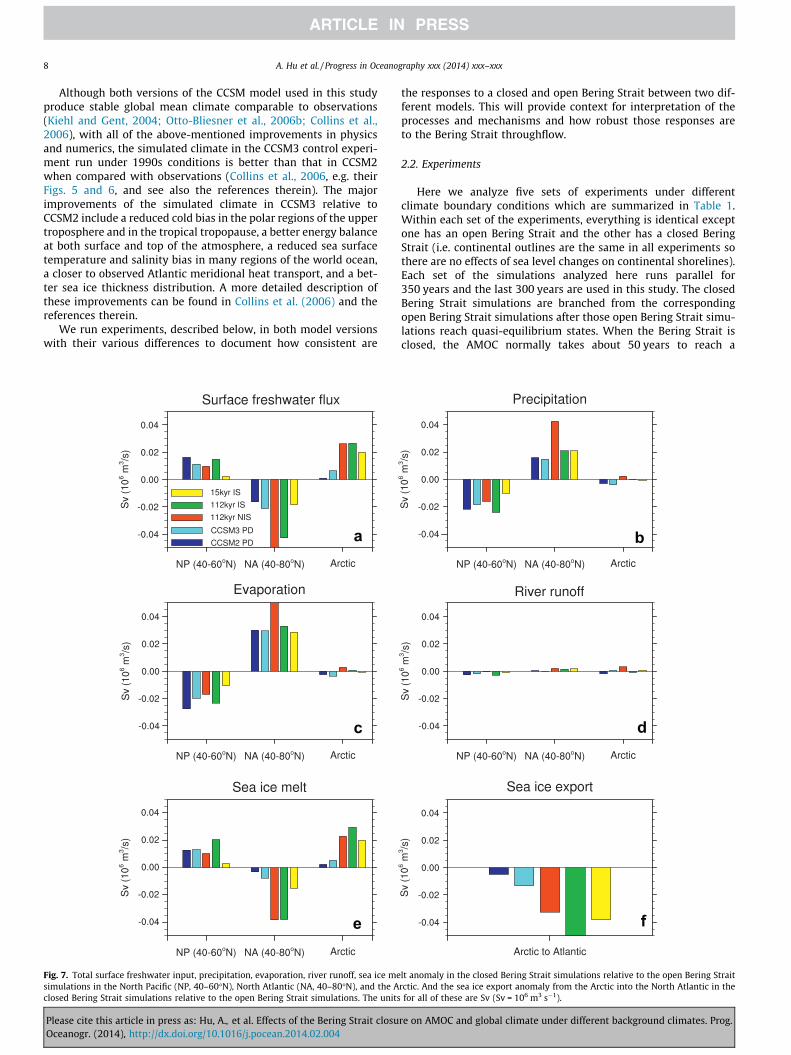
Fig. 7. Total surface freshwater input, precipitation, evaporation, river runoff, sea ice mesimulations in the North Pacific (NP, 40–60�N), North Atlantic (NA, 40–80�N), and the Aclosed Bering Strait simulations relative to the open Bering Strait simulations. The units
Please cite this article in press as: Hu, A., et al. Effects of the Bering Strait closuOceanogr. (2014), http://dx.doi.org/10.1016/j.pocean.2014.02.004
the responses to a closed and open Bering Strait between two dif-ferent models. This will provide context for interpretation of theprocesses and mechanisms and how robust those responses areto the Bering Strait throughflow.
2.2. Experiments
Here we analyze five sets of experiments under differentclimate boundary conditions which are summarized in Table 1.Within each set of the experiments, everything is identical exceptone has an open Bering Strait and the other has a closed BeringStrait (i.e. continental outlines are the same in all experiments sothere are no effects of sea level changes on continental shorelines).Each set of the simulations analyzed here runs parallel for350 years and the last 300 years are used in this study. The closedBering Strait simulations are branched from the correspondingopen Bering Strait simulations after those open Bering Strait simu-lations reach quasi-equilibrium states. When the Bering Strait isclosed, the AMOC normally takes about 50 years to reach a
b
d
f
lt anomaly in the closed Bering Strait simulations relative to the open Bering Straitrctic. And the sea ice export anomaly from the Arctic into the North Atlantic in thefor all of these are Sv (Sv = 106 m3 s�1).
re on AMOC and global climate under different background climates. Prog.
A. Hu et al. / Progress in Oceanography xxx (2014) xxx–xxx 9
quasi-equilibrium state (Hu et al., 2007, 2008). Therefore we usedthe simulated results of the last 300 years.
The first two sets of the experiments are under present day cli-mate boundary conditions in which the CO2 concentration is fixedat 355 parts per million by volume (ppmv) using both CCSM2 andCCSM3 (hereafter referred as CCSM2 PD and CCSM3 PD, respec-tively). The second two sets of the experiments are under 112thousand year before present (kyr BP) climate boundary conditionswith a concentration CO2 fixed at 257 ppmv and methane (CH4) at456 parts per billion by volume (ppbv, Petit et al., 1999; Loulergueet al., 2008). This is the first time during the last glacial period thatthe Bering Strait was closed due to the intensified growth of theNorth American Ice Sheets. In one of this second two sets of exper-iments, the Larentide Ice Sheet is included, but excluded in theother. Hereafter these two sets of experiments are referred as112 kyr IS and 112 kyr NIS, respectively. The final set of experi-ments uses the climate boundary conditions of 15 kyr BP with aCO2 concentration of 214 ppmv, CH4 at 350 ppbv (Petit et al.,1999; Loulergue et al., 2008), and the Larentide Ice Sheet is in-cluded. The 15 kyr BP condition is chosen for this study becauseit represents the mid-glacial condition which may characterizethe general glacial condition better than the more widely used lastglacial maximum (LGM). This set of simulations will aid us to fur-ther investigate how the Bering Strait status would affect theAMOC hysteresis under mid-glacial conditions which will be a fol-low up to the study of Hu et al. (2012a). This set of experimentswill be referred as 15 kyr IS later.
a
c
e
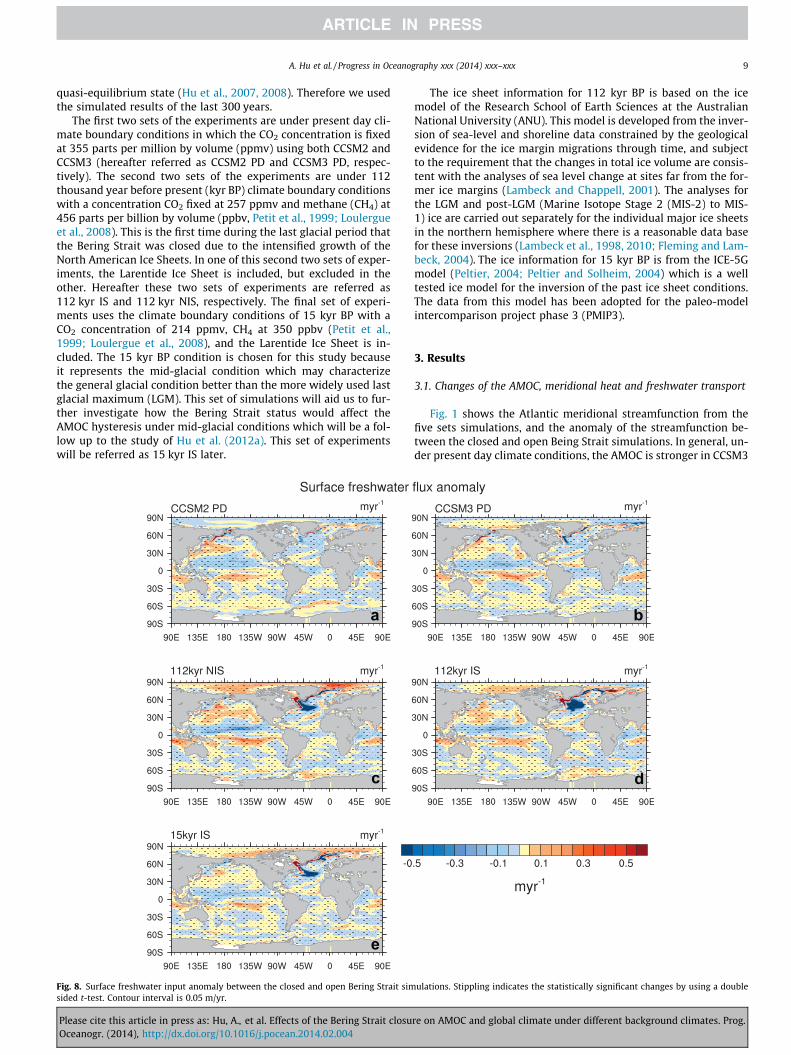
Fig. 8. Surface freshwater input anomaly between the closed and open Bering Strait simsided t-test. Contour interval is 0.05 m/yr.
Please cite this article in press as: Hu, A., et al. Effects of the Bering Strait closuOceanogr. (2014), http://dx.doi.org/10.1016/j.pocean.2014.02.004
The ice sheet information for 112 kyr BP is based on the icemodel of the Research School of Earth Sciences at the AustralianNational University (ANU). This model is developed from the inver-sion of sea-level and shoreline data constrained by the geologicalevidence for the ice margin migrations through time, and subjectto the requirement that the changes in total ice volume are consis-tent with the analyses of sea level change at sites far from the for-mer ice margins (Lambeck and Chappell, 2001). The analyses forthe LGM and post-LGM (Marine Isotope Stage 2 (MIS-2) to MIS-1) ice are carried out separately for the individual major ice sheetsin the northern hemisphere where there is a reasonable data basefor these inversions (Lambeck et al., 1998, 2010; Fleming and Lam-beck, 2004). The ice information for 15 kyr BP is from the ICE-5Gmodel (Peltier, 2004; Peltier and Solheim, 2004) which is a welltested ice model for the inversion of the past ice sheet conditions.The data from this model has been adopted for the paleo-modelintercomparison project phase 3 (PMIP3).
3. Results
3.1. Changes of the AMOC, meridional heat and freshwater transport
Fig. 1 shows the Atlantic meridional streamfunction from thefive sets simulations, and the anomaly of the streamfunction be-tween the closed and open Being Strait simulations. In general, un-der present day climate conditions, the AMOC is stronger in CCSM3
b
d
ulations. Stippling indicates the statistically significant changes by using a double
re on AMOC and global climate under different background climates. Prog.
10 A. Hu et al. / Progress in Oceanography xxx (2014) xxx–xxx
than in CCSM2. As shown in Table 2, the mean strength of theAMOC in both CCSM3 and CCSM2 with an open Bering Strait issimilar to that suggested by observations (e.g., Ganachaud andWunsch, 2000; Cunningham et al., 2007; Cunningham and Marsh,2010; Johns et al., 2011). Under glacial conditions, the AMOC withan open Bering Strait is as strong as or even stronger than theAMOC under present day conditions. It is still under debatewhether the AMOC was stronger or not under glacial conditionsrelative to the AMOC under present day conditions (Yu et al.,1996; McManus et al., 2004). Results from the paleo-model inter-comparison project phase 2 (PMIP2) suggest that the AMOC duringthe last glacial maximum was neither appreciably weaker or stron-ger than modern (Weber et al., 2007; Otto-Bliesner et al., 2007).When the Bering Strait is closed, all simulations show that theAMOC is about 2�3 Sv stronger than that in the open Bering Straitsimulations. Thus, it is clear that a strengthened mean AMOC is arobust result across all experiments in spite of different modelsand drastically different background climate conditions.
Fig. 2a confirms this result and shows that the AMOC is morethan 10% stronger with a closed Bering Strait than with an openBering Strait in all of the simulations regardless of the versions ofCCSM model used or the background climate conditions (The abso-lute values of the AMOC in all simulations are shown in Table 2). Asthe AMOC becomes stronger in all cases with a closed Bering Strait,warmer tropical–subtropical water is pulled into the subpolarNorth Atlantic, leading to a strengthened northward meridional
a
c
e
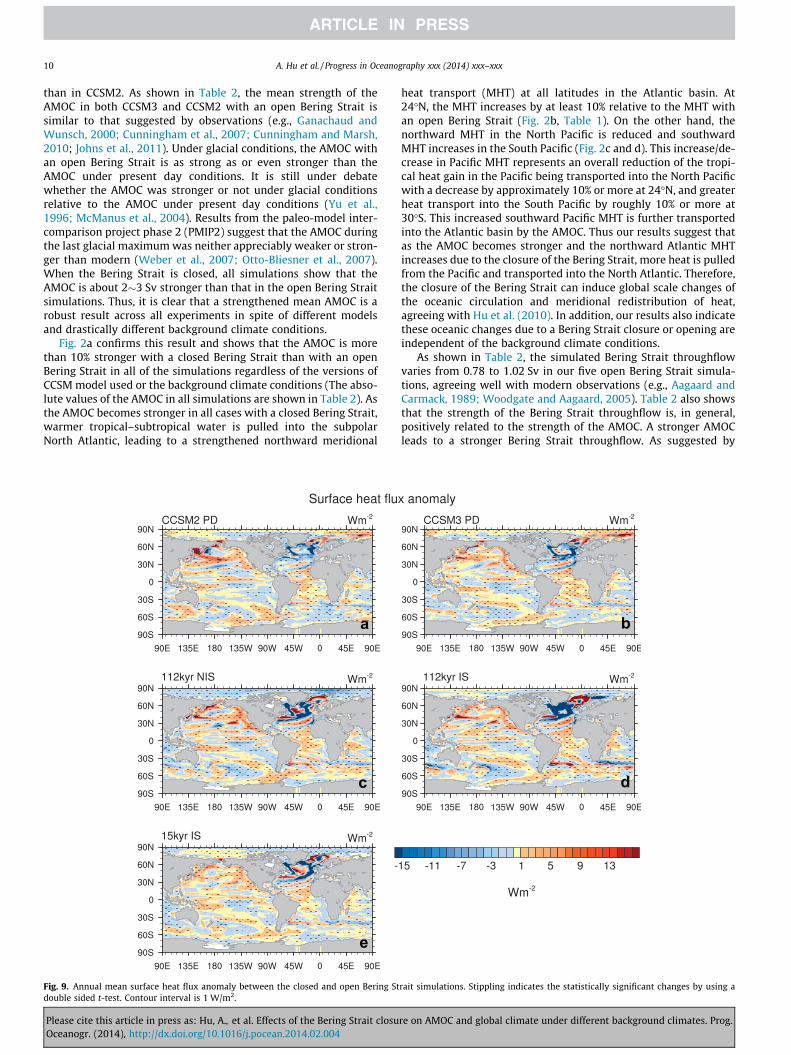
Fig. 9. Annual mean surface heat flux anomaly between the closed and open Bering Stdouble sided t-test. Contour interval is 1 W/m2.
Please cite this article in press as: Hu, A., et al. Effects of the Bering Strait closuOceanogr. (2014), http://dx.doi.org/10.1016/j.pocean.2014.02.004
heat transport (MHT) at all latitudes in the Atlantic basin. At24�N, the MHT increases by at least 10% relative to the MHT withan open Bering Strait (Fig. 2b, Table 1). On the other hand, thenorthward MHT in the North Pacific is reduced and southwardMHT increases in the South Pacific (Fig. 2c and d). This increase/de-crease in Pacific MHT represents an overall reduction of the tropi-cal heat gain in the Pacific being transported into the North Pacificwith a decrease by approximately 10% or more at 24�N, and greaterheat transport into the South Pacific by roughly 10% or more at30�S. This increased southward Pacific MHT is further transportedinto the Atlantic basin by the AMOC. Thus our results suggest thatas the AMOC becomes stronger and the northward Atlantic MHTincreases due to the closure of the Bering Strait, more heat is pulledfrom the Pacific and transported into the North Atlantic. Therefore,the closure of the Bering Strait can induce global scale changes ofthe oceanic circulation and meridional redistribution of heat,agreeing with Hu et al. (2010). In addition, our results also indicatethese oceanic changes due to a Bering Strait closure or opening areindependent of the background climate conditions.
As shown in Table 2, the simulated Bering Strait throughflowvaries from 0.78 to 1.02 Sv in our five open Bering Strait simula-tions, agreeing well with modern observations (e.g., Aagaard andCarmack, 1989; Woodgate and Aagaard, 2005). Table 2 also showsthat the strength of the Bering Strait throughflow is, in general,positively related to the strength of the AMOC. A stronger AMOCleads to a stronger Bering Strait throughflow. As suggested by
b
d
rait simulations. Stippling indicates the statistically significant changes by using a
re on AMOC and global climate under different background climates. Prog.
A. Hu et al. / Progress in Oceanography xxx (2014) xxx–xxx 11
previous studies, the strength of the Bering Strait throughflow ismainly dynamically controlled and determined by the sea level dif-ference between the North Pacific and the North Atlantic (Shafferand Bendtsen, 1994; Hu et al., 2008, 2009, 2011), and may alsopartly influenced by the southern ocean winds (Nof, 2000; Ortizet al., 2012). As the AMOC becomes stronger, the water in the sub-polar North Atlantic becomes denser and the sea level becomeslower, leading to an increased sea level contrast between the sub-polar North Pacific and subpolar North Atlantic, and a stronger Ber-ing Strait throughflow, and vice versa for a weaker AMOC (Hu et al.,2009, 2011).
In our simulations, the liquid freshwater transport via the Ber-ing Strait from the Pacific into the Arctic varies from 0.062 to0.093 Sv which is also within the uncertainty range of the modernobservations (Woodgate and Aagaard, 2005). As suggested by Aag-aard and Carmack (1989), the freshwater imported from the Pacificvia the Bering Strait makes up roughly 30% of the total freshwater
a
c
e
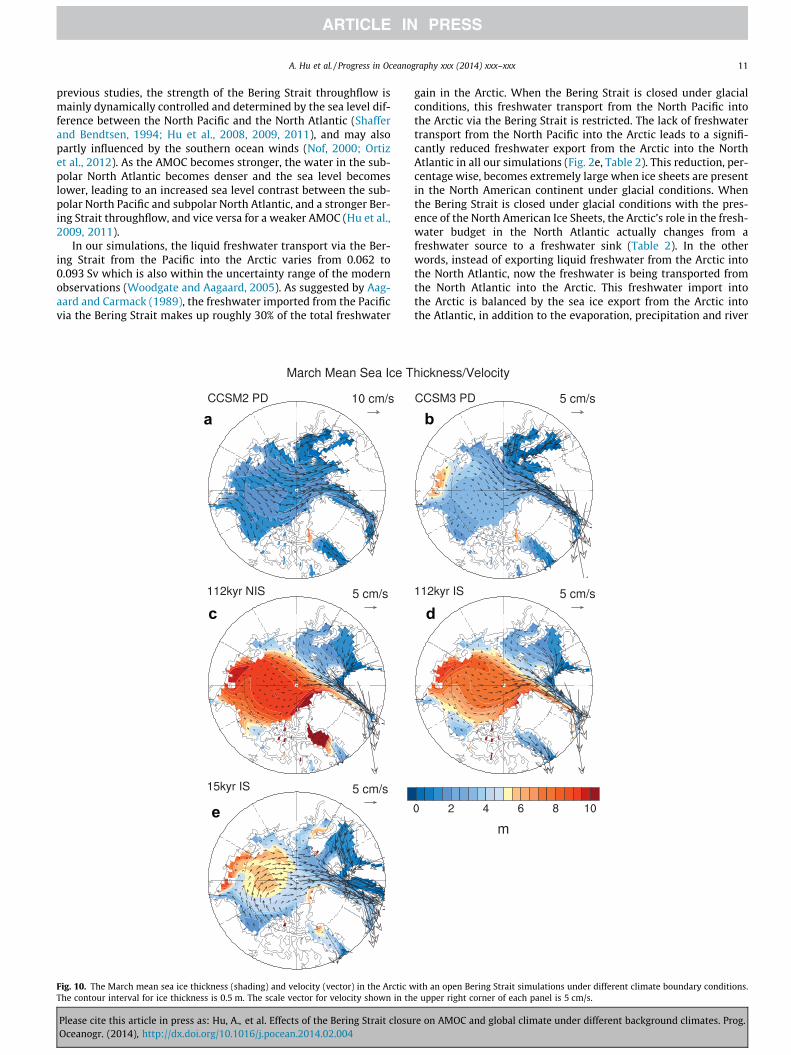
Fig. 10. The March mean sea ice thickness (shading) and velocity (vector) in the Arctic wThe contour interval for ice thickness is 0.5 m. The scale vector for velocity shown in th
Please cite this article in press as: Hu, A., et al. Effects of the Bering Strait closuOceanogr. (2014), http://dx.doi.org/10.1016/j.pocean.2014.02.004
gain in the Arctic. When the Bering Strait is closed under glacialconditions, this freshwater transport from the North Pacific intothe Arctic via the Bering Strait is restricted. The lack of freshwatertransport from the North Pacific into the Arctic leads to a signifi-cantly reduced freshwater export from the Arctic into the NorthAtlantic in all our simulations (Fig. 2e, Table 2). This reduction, per-centage wise, becomes extremely large when ice sheets are presentin the North American continent under glacial conditions. Whenthe Bering Strait is closed under glacial conditions with the pres-ence of the North American Ice Sheets, the Arctic’s role in the fresh-water budget in the North Atlantic actually changes from afreshwater source to a freshwater sink (Table 2). In the otherwords, instead of exporting liquid freshwater from the Arctic intothe North Atlantic, now the freshwater is being transported fromthe North Atlantic into the Arctic. This freshwater import intothe Arctic is balanced by the sea ice export from the Arctic intothe Atlantic, in addition to the evaporation, precipitation and river
b
d
ith an open Bering Strait simulations under different climate boundary conditions.e upper right corner of each panel is 5 cm/s.
re on AMOC and global climate under different background climates. Prog.
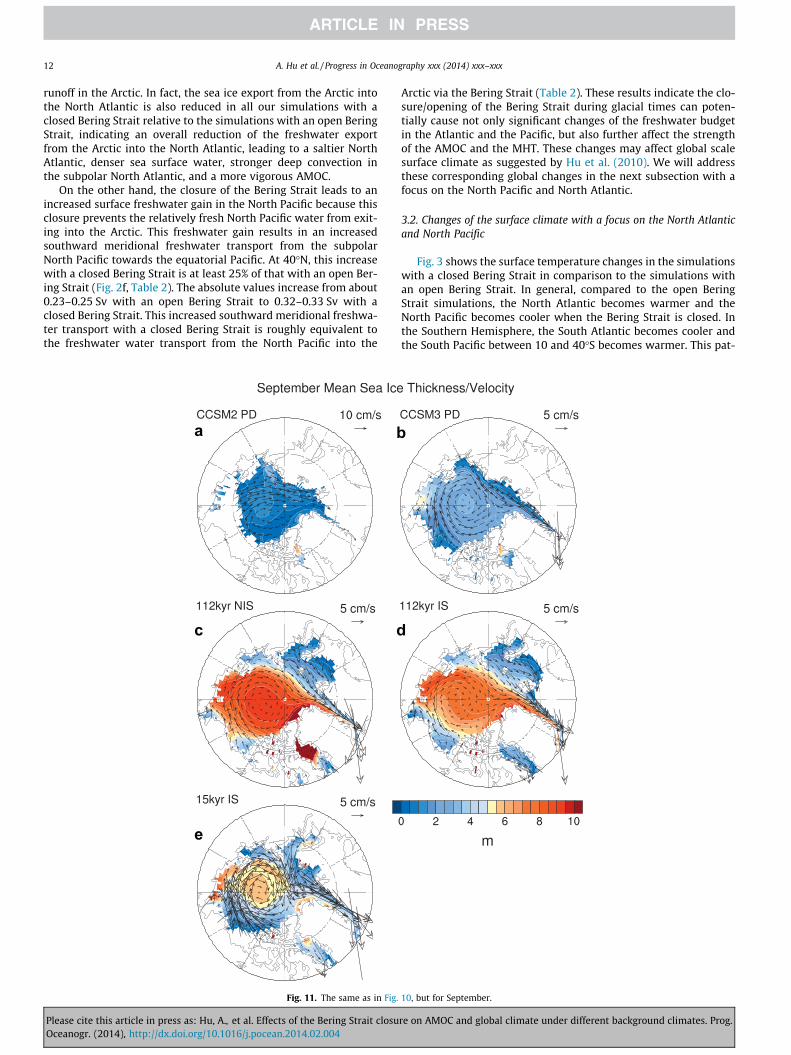
12 A. Hu et al. / Progress in Oceanography xxx (2014) xxx–xxx
runoff in the Arctic. In fact, the sea ice export from the Arctic intothe North Atlantic is also reduced in all our simulations with aclosed Bering Strait relative to the simulations with an open BeringStrait, indicating an overall reduction of the freshwater exportfrom the Arctic into the North Atlantic, leading to a saltier NorthAtlantic, denser sea surface water, stronger deep convection inthe subpolar North Atlantic, and a more vigorous AMOC.
On the other hand, the closure of the Bering Strait leads to anincreased surface freshwater gain in the North Pacific because thisclosure prevents the relatively fresh North Pacific water from exit-ing into the Arctic. This freshwater gain results in an increasedsouthward meridional freshwater transport from the subpolarNorth Pacific towards the equatorial Pacific. At 40�N, this increasewith a closed Bering Strait is at least 25% of that with an open Ber-ing Strait (Fig. 2f, Table 2). The absolute values increase from about0.23–0.25 Sv with an open Bering Strait to 0.32–0.33 Sv with aclosed Bering Strait. This increased southward meridional freshwa-ter transport with a closed Bering Strait is roughly equivalent tothe freshwater water transport from the North Pacific into the
a
c
e
b
d
Fig. 11. The same as in Fig.
Please cite this article in press as: Hu, A., et al. Effects of the Bering Strait closuOceanogr. (2014), http://dx.doi.org/10.1016/j.pocean.2014.02.004
Arctic via the Bering Strait (Table 2). These results indicate the clo-sure/opening of the Bering Strait during glacial times can poten-tially cause not only significant changes of the freshwater budgetin the Atlantic and the Pacific, but also further affect the strengthof the AMOC and the MHT. These changes may affect global scalesurface climate as suggested by Hu et al. (2010). We will addressthese corresponding global changes in the next subsection with afocus on the North Pacific and North Atlantic.
3.2. Changes of the surface climate with a focus on the North Atlanticand North Pacific
Fig. 3 shows the surface temperature changes in the simulationswith a closed Bering Strait in comparison to the simulations withan open Bering Strait. In general, compared to the open BeringStrait simulations, the North Atlantic becomes warmer and theNorth Pacific becomes cooler when the Bering Strait is closed. Inthe Southern Hemisphere, the South Atlantic becomes cooler andthe South Pacific between 10 and 40�S becomes warmer. This pat-
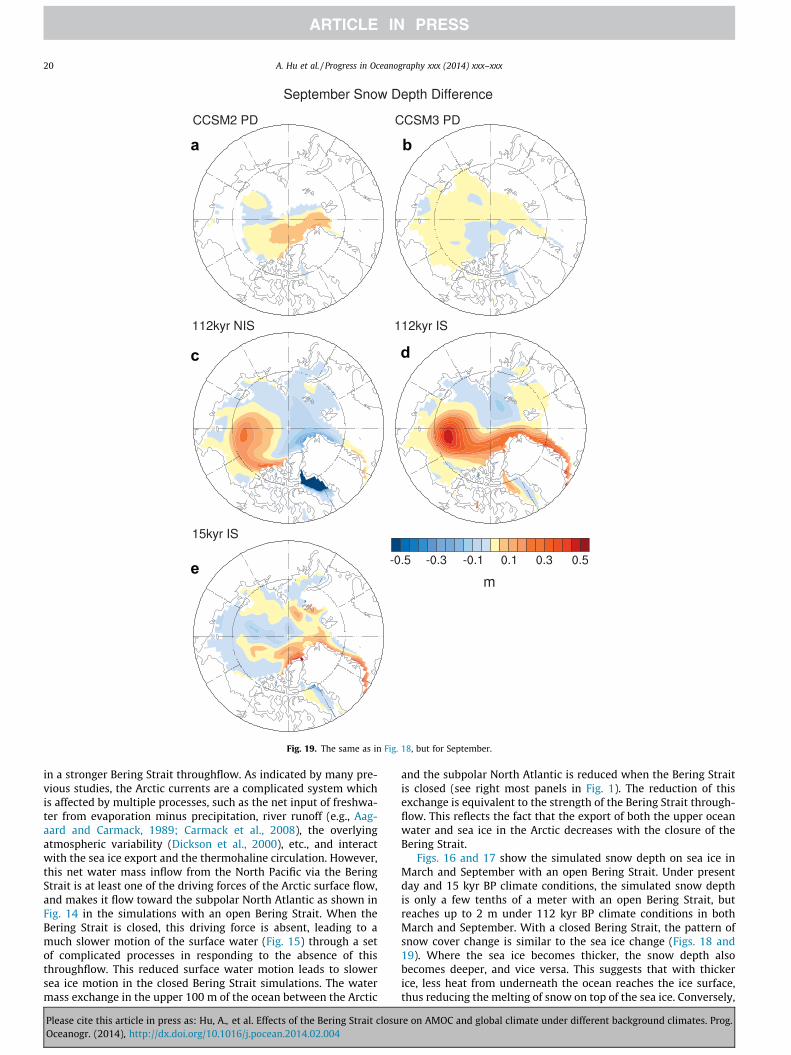
10, but for September.
re on AMOC and global climate under different background climates. Prog.
A. Hu et al. / Progress in Oceanography xxx (2014) xxx–xxx 13
tern of surface temperature change in these basins is consistentwith changes of the oceanic MHT as discussed in the previous sub-section and suggested by Hu et al. (2010). As the AMOC strength-ens, more heat is transported into the North Atlantic inducing awarming there. At the same time, in the Pacific basin, there is re-duced northward MHT from the tropics into the subpolar North Pa-cific, and the southward MHT into the South Pacific increases(Fig. 2b and c, Table 2). This excess heat is further transported intothe Atlantic basin via the Drake Passage. This is why there is sur-face warming in the Drake Passage and the Atlantic sector of theSouthern Oceans in all simulations with a closed Bering Strait(Fig. 3).
Earlier studies based on standalone ocean model simulations(Saenko et al., 2004) indicate that the climate changes betweenthe North Atlantic and the North Pacific could oppose each other,with seesaw-like climate fluctuations between the two basins. This
a
c
e
Fig. 12. The March mean sea ice thickness (shading) and velocity (vector) anomalies in thcontour interval is 0.1 m for the ice thickness. The scale vector shown at the upper righ
Please cite this article in press as: Hu, A., et al. Effects of the Bering Strait closuOceanogr. (2014), http://dx.doi.org/10.1016/j.pocean.2014.02.004
seesaw-like climate change is associated with variations of theAMOC. By using a standalone ocean model with a closed BeringStrait, Saenko et al. (2004) found that by increasing the freshwaterinput into the North Atlantic, the AMOC weakens and the NorthAtlantic cools. However, the Pacific MOC (PMOC) strengthens andthe North Pacific warms up. If the freshwater input in the North Pa-cific increases, the AMOC strengthens and the PMOC weakens,resulting in a warming in the North Atlantic and a cooling in theNorth Pacific. By employing a coarse resolution ocean model, Sei-dov and Haupt (2003, 2005) suggested that the sea surface salinity(SSS) changes between the North Atlantic and North Pacific areopposite to each other in association with the AMOC fluctuations.They proposed that the SSS contrast between these two basinscan be used as an indicator of the AMOC changes. Later this ideawas proved in two fully coupled climate models (Hu et al.,2004a,b). An observation-based modelling study (Okazaki et al.,
b
d
e closed Bering Strait simulations relative to the open Bering Strait simulations. Thet of each panel is 1 cm/s for panels b, c and d, but 5 cm/s for panels a and e.
re on AMOC and global climate under different background climates. Prog.
14 A. Hu et al. / Progress in Oceanography xxx (2014) xxx–xxx
2010) showed that the paleo proxy record indicates that duringHeinrich event 1 (H1), the North Pacific was warmer. They usedan Earth System Model of Intermediate Complexity (EMIC) to illus-trate that this warmer North Pacific during H1 is due to a setup ofthe PMOC when the AMOC collapsed. A recent coupled modelstudy (Hu et al., 2012b) illustrated that these seesaw-like SSSand surface temperature changes between the two basins onlywork if the Bering Strait is closed. The results from all our simula-tions show that closing the Bering Strait can induce a seesaw-likesurface temperature change between these two basins in compar-ison to the simulations with an open Bering Strait (Figs. 3 and 4,and Table 3), and that this too is a robust result.
Further, we find that the closing of the Bering Strait not onlycauses a seesaw-like surface temperature change between theNorth Pacific and North Atlantic, but also induces seesaw-likechanges in SSS, precipitation, net surface heat flux, and net surface
a
c
e
Fig. 13. The same as in Fig.
Please cite this article in press as: Hu, A., et al. Effects of the Bering Strait closuOceanogr. (2014), http://dx.doi.org/10.1016/j.pocean.2014.02.004
freshwater input in these two basins (Figs. 4–9, and Table 3). TheSSS changes show increases in the North Atlantic, Arctic and the re-gions in the Southern Oceans where sea ice is present, and de-creases in other basins, especially the North Pacific in all closedBering Strait simulations in comparison to the ones with an openBering Strait (Figs. 4 and 5). The precipitation patterns betweenthe closed and open Bering Strait simulations show a reductionin the North Pacific and an increase in the North Atlantic (Figs. 6and 7), which is opposite to the SSS changes in these two basins(Figs. 4 and 5), suggesting that other processes may be responsiblefor the SSS changes. On the other hand, the tropical precipitationchanges show a southward movement of the inter-tropical conver-gence zone (ITCZ) in the Pacific and a northward movement in theAtlantic associated with the cooling in the North Pacific and thewarming in the North Atlantic. This is consistent with previousstudies (e.g., Hu et al., 2010; Brady and Otto-Bliesner, 2011).
b
d
12, but for September.
re on AMOC and global climate under different background climates. Prog.
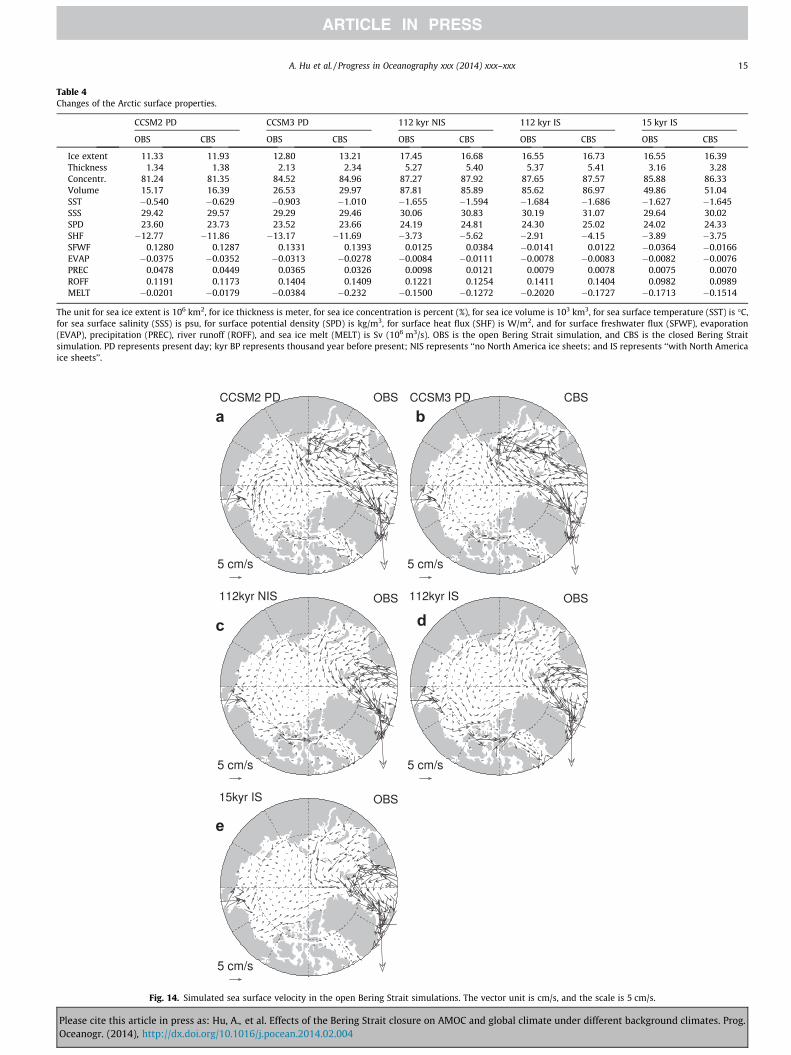
Table 4Changes of the Arctic surface properties.
CCSM2 PD CCSM3 PD 112 kyr NIS 112 kyr IS 15 kyr IS
OBS CBS OBS CBS OBS CBS OBS CBS OBS CBS
Ice extent 11.33 11.93 12.80 13.21 17.45 16.68 16.55 16.73 16.55 16.39Thickness 1.34 1.38 2.13 2.34 5.27 5.40 5.37 5.41 3.16 3.28Concentr. 81.24 81.35 84.52 84.96 87.27 87.92 87.65 87.57 85.88 86.33Volume 15.17 16.39 26.53 29.97 87.81 85.89 85.62 86.97 49.86 51.04SST �0.540 �0.629 �0.903 �1.010 �1.655 �1.594 �1.684 �1.686 �1.627 �1.645SSS 29.42 29.57 29.29 29.46 30.06 30.83 30.19 31.07 29.64 30.02SPD 23.60 23.73 23.52 23.66 24.19 24.81 24.30 25.02 24.02 24.33SHF �12.77 �11.86 �13.17 �11.69 �3.73 �5.62 �2.91 �4.15 �3.89 �3.75SFWF 0.1280 0.1287 0.1331 0.1393 0.0125 0.0384 �0.0141 0.0122 �0.0364 �0.0166EVAP �0.0375 �0.0352 �0.0313 �0.0278 �0.0084 �0.0111 �0.0078 �0.0083 �0.0082 �0.0076PREC 0.0478 0.0449 0.0365 0.0326 0.0098 0.0121 0.0079 0.0078 0.0075 0.0070ROFF 0.1191 0.1173 0.1404 0.1409 0.1221 0.1254 0.1411 0.1404 0.0982 0.0989MELT �0.0201 �0.0179 �0.0384 �0.232 �0.1500 �0.1272 �0.2020 �0.1727 �0.1713 �0.1514
The unit for sea ice extent is 106 km2, for ice thickness is meter, for sea ice concentration is percent (%), for sea ice volume is 103 km3, for sea surface temperature (SST) is �C,for sea surface salinity (SSS) is psu, for surface potential density (SPD) is kg/m3, for surface heat flux (SHF) is W/m2, and for surface freshwater flux (SFWF), evaporation(EVAP), precipitation (PREC), river runoff (ROFF), and sea ice melt (MELT) is Sv (106 m3/s). OBS is the open Bering Strait simulation, and CBS is the closed Bering Straitsimulation. PD represents present day; kyr BP represents thousand year before present; NIS represents ‘‘no North America ice sheets; and IS represents ‘‘with North Americaice sheets’’.
a b
c d
e
Fig. 14. Simulated sea surface velocity in the open Bering Strait simulations. The vector unit is cm/s, and the scale is 5 cm/s.
A. Hu et al. / Progress in Oceanography xxx (2014) xxx–xxx 15
Please cite this article in press as: Hu, A., et al. Effects of the Bering Strait closure on AMOC and global climate under different background climates. Prog.Oceanogr. (2014), http://dx.doi.org/10.1016/j.pocean.2014.02.004
16 A. Hu et al. / Progress in Oceanography xxx (2014) xxx–xxx
The surface freshwater input includes precipitation, evapora-tion, river runoff, and sea ice melt-freeze (Fig. 8). In general, witha closed Bering Strait, the surface freshwater input in the NorthAtlantic is reduced (Figs. 7 and 8). But the changes of surface fresh-water input are mixed in the North Pacific with a Bering Strait clo-sure (Figs. 7 and 8). As shown in Table 3 and Fig. 7, the net surfacefreshwater input in the North Pacific between 40 and 60�N is actu-ally increased in the simulations with a closed Bering Strait com-pared to the simulations with an open Bering Strait, withcorresponding decreases in SSS. In the North Atlantic (40–80�N),the surface freshwater input with a closed Bering Strait is de-creased, contributing positively to the SSS increase there (Table 3,Fig. 7). This indicates that other components in the surface fresh-water input overcome the reduction of precipitation in the NorthPacific and the increase in precipitation in the North Atlantic. Ananalysis of each surface freshwater component shows that as theBering Strait is closed, surface evaporation and river runoff intothe North Pacific decrease, but freshwater input from sea ice meltincreases (Table 3, Fig. 7). Thus it is the increased sea ice melt andespecially the reduced evaporation in this basin that cause theoverall increase in surface freshwater input. In the North Atlantic
a
c
e
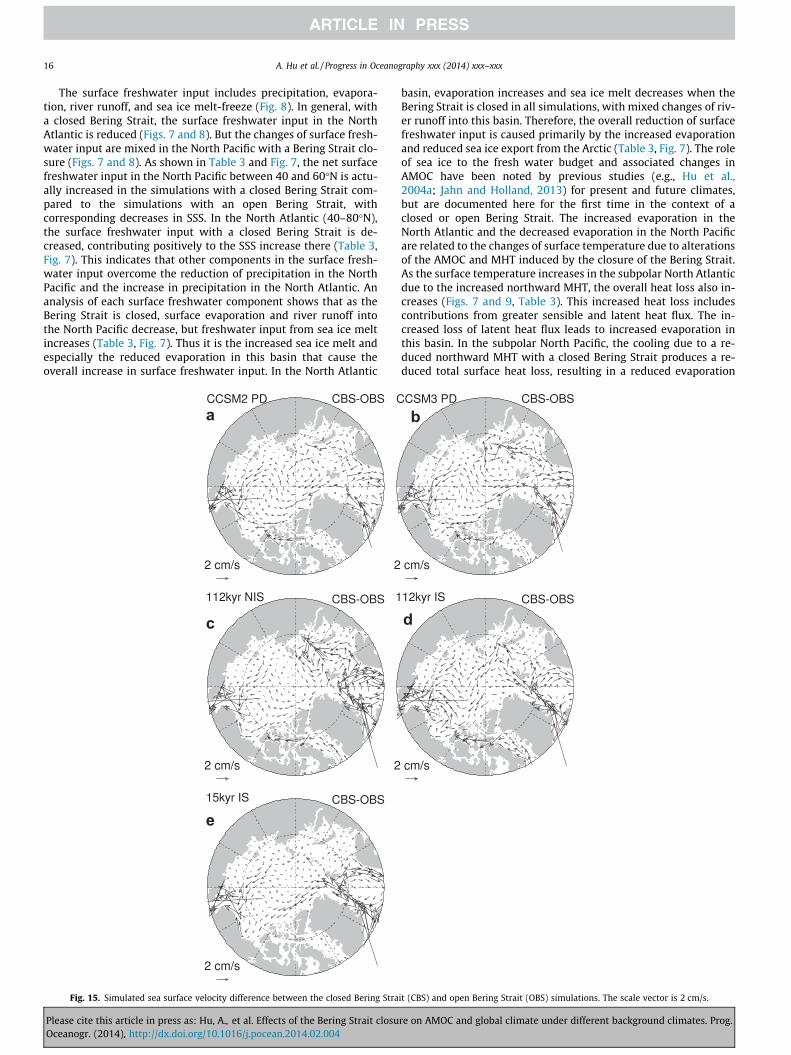
Fig. 15. Simulated sea surface velocity difference between the closed Bering Stra
Please cite this article in press as: Hu, A., et al. Effects of the Bering Strait closuOceanogr. (2014), http://dx.doi.org/10.1016/j.pocean.2014.02.004
basin, evaporation increases and sea ice melt decreases when theBering Strait is closed in all simulations, with mixed changes of riv-er runoff into this basin. Therefore, the overall reduction of surfacefreshwater input is caused primarily by the increased evaporationand reduced sea ice export from the Arctic (Table 3, Fig. 7). The roleof sea ice to the fresh water budget and associated changes inAMOC have been noted by previous studies (e.g., Hu et al.,2004a; Jahn and Holland, 2013) for present and future climates,but are documented here for the first time in the context of aclosed or open Bering Strait. The increased evaporation in theNorth Atlantic and the decreased evaporation in the North Pacificare related to the changes of surface temperature due to alterationsof the AMOC and MHT induced by the closure of the Bering Strait.As the surface temperature increases in the subpolar North Atlanticdue to the increased northward MHT, the overall heat loss also in-creases (Figs. 7 and 9, Table 3). This increased heat loss includescontributions from greater sensible and latent heat flux. The in-creased loss of latent heat flux leads to increased evaporation inthis basin. In the subpolar North Pacific, the cooling due to a re-duced northward MHT with a closed Bering Strait produces a re-duced total surface heat loss, resulting in a reduced evaporation
b
d
it (CBS) and open Bering Strait (OBS) simulations. The scale vector is 2 cm/s.
re on AMOC and global climate under different background climates. Prog.
A. Hu et al. / Progress in Oceanography xxx (2014) xxx–xxx 17
there. Therefore, the closure of the Bering Strait not only causeschanges of the AMOC and MHT, but also modulates the surfacefreshwater and heat balance, especially in the subpolar North Paci-fic and North Atlantic. These changes induce a seesaw-like climatechange between these two basins.
It is worth noting that as the Bering Strait is closed, the freshwa-ter and sea ice exchanges between the North Pacific and the Arcticare restricted. The increased ice melt in the North Pacific with aclosed Bering Strait is a result of the cooler climate which causesincreased sea ice formation during the winter season. Thereforethis increased ice melt does not contribute much to the annualmean SSS change there, and the increased surface freshwater inputin this basin is mainly due to the reduction of evaporation morethan the decrease of precipitation in the North Pacific. On the otherhand, in the subpolar North Atlantic basin, the sea ice melt in-cludes two parts: the sea ice export from the Arctic and the local
a
c
e
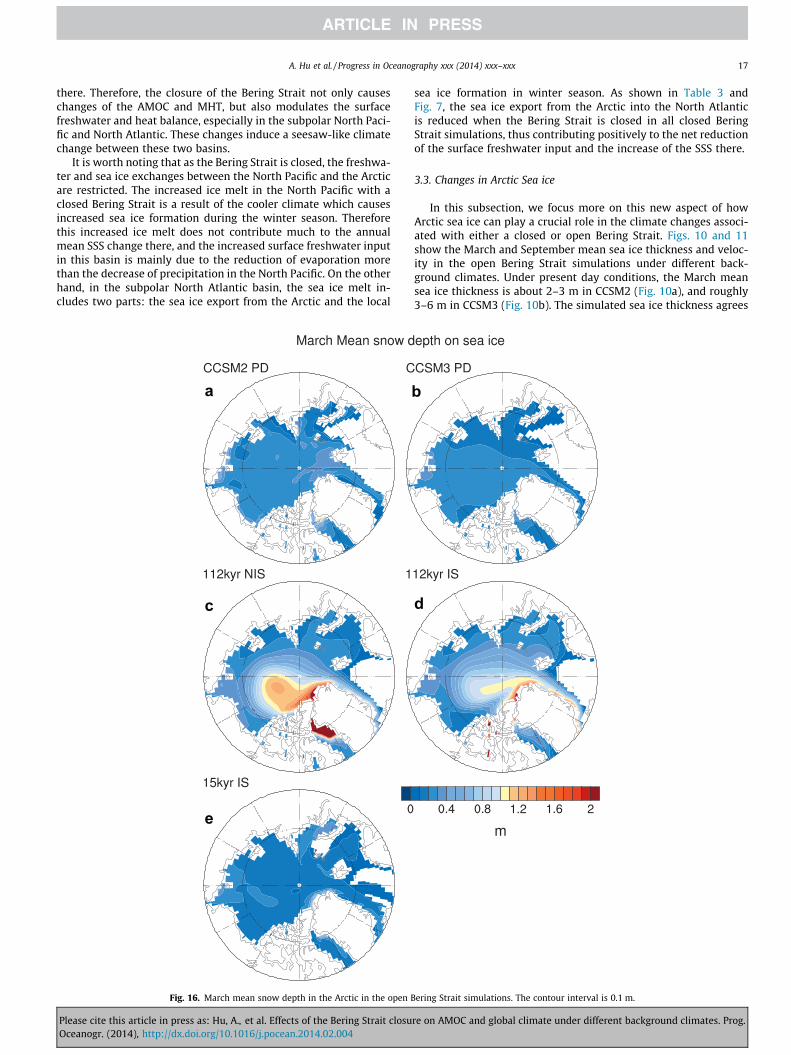
Fig. 16. March mean snow depth in the Arctic in the open B
Please cite this article in press as: Hu, A., et al. Effects of the Bering Strait closuOceanogr. (2014), http://dx.doi.org/10.1016/j.pocean.2014.02.004
sea ice formation in winter season. As shown in Table 3 andFig. 7, the sea ice export from the Arctic into the North Atlanticis reduced when the Bering Strait is closed in all closed BeringStrait simulations, thus contributing positively to the net reductionof the surface freshwater input and the increase of the SSS there.
3.3. Changes in Arctic Sea ice
In this subsection, we focus more on this new aspect of howArctic sea ice can play a crucial role in the climate changes associ-ated with either a closed or open Bering Strait. Figs. 10 and 11show the March and September mean sea ice thickness and veloc-ity in the open Bering Strait simulations under different back-ground climates. Under present day conditions, the March meansea ice thickness is about 2–3 m in CCSM2 (Fig. 10a), and roughly3–6 m in CCSM3 (Fig. 10b). The simulated sea ice thickness agrees
b
d
ering Strait simulations. The contour interval is 0.1 m.
re on AMOC and global climate under different background climates. Prog.
a b
c d
e
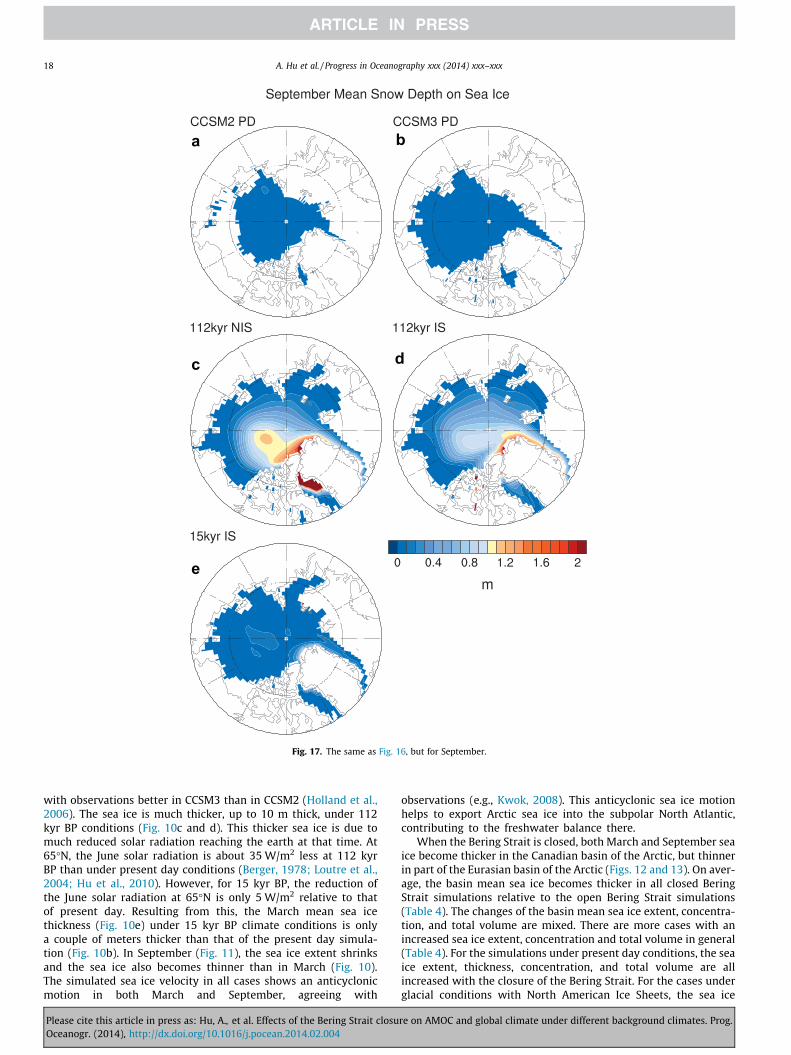
Fig. 17. The same as Fig. 16, but for September.
18 A. Hu et al. / Progress in Oceanography xxx (2014) xxx–xxx
with observations better in CCSM3 than in CCSM2 (Holland et al.,2006). The sea ice is much thicker, up to 10 m thick, under 112kyr BP conditions (Fig. 10c and d). This thicker sea ice is due tomuch reduced solar radiation reaching the earth at that time. At65�N, the June solar radiation is about 35 W/m2 less at 112 kyrBP than under present day conditions (Berger, 1978; Loutre et al.,2004; Hu et al., 2010). However, for 15 kyr BP, the reduction ofthe June solar radiation at 65�N is only 5 W/m2 relative to thatof present day. Resulting from this, the March mean sea icethickness (Fig. 10e) under 15 kyr BP climate conditions is onlya couple of meters thicker than that of the present day simula-tion (Fig. 10b). In September (Fig. 11), the sea ice extent shrinksand the sea ice also becomes thinner than in March (Fig. 10).The simulated sea ice velocity in all cases shows an anticyclonicmotion in both March and September, agreeing with
Please cite this article in press as: Hu, A., et al. Effects of the Bering Strait closuOceanogr. (2014), http://dx.doi.org/10.1016/j.pocean.2014.02.004
observations (e.g., Kwok, 2008). This anticyclonic sea ice motionhelps to export Arctic sea ice into the subpolar North Atlantic,contributing to the freshwater balance there.
When the Bering Strait is closed, both March and September seaice become thicker in the Canadian basin of the Arctic, but thinnerin part of the Eurasian basin of the Arctic (Figs. 12 and 13). On aver-age, the basin mean sea ice becomes thicker in all closed BeringStrait simulations relative to the open Bering Strait simulations(Table 4). The changes of the basin mean sea ice extent, concentra-tion, and total volume are mixed. There are more cases with anincreased sea ice extent, concentration and total volume in general(Table 4). For the simulations under present day conditions, the seaice extent, thickness, concentration, and total volume are allincreased with the closure of the Bering Strait. For the cases underglacial conditions with North American Ice Sheets, the sea ice
re on AMOC and global climate under different background climates. Prog.
a b
c d
e
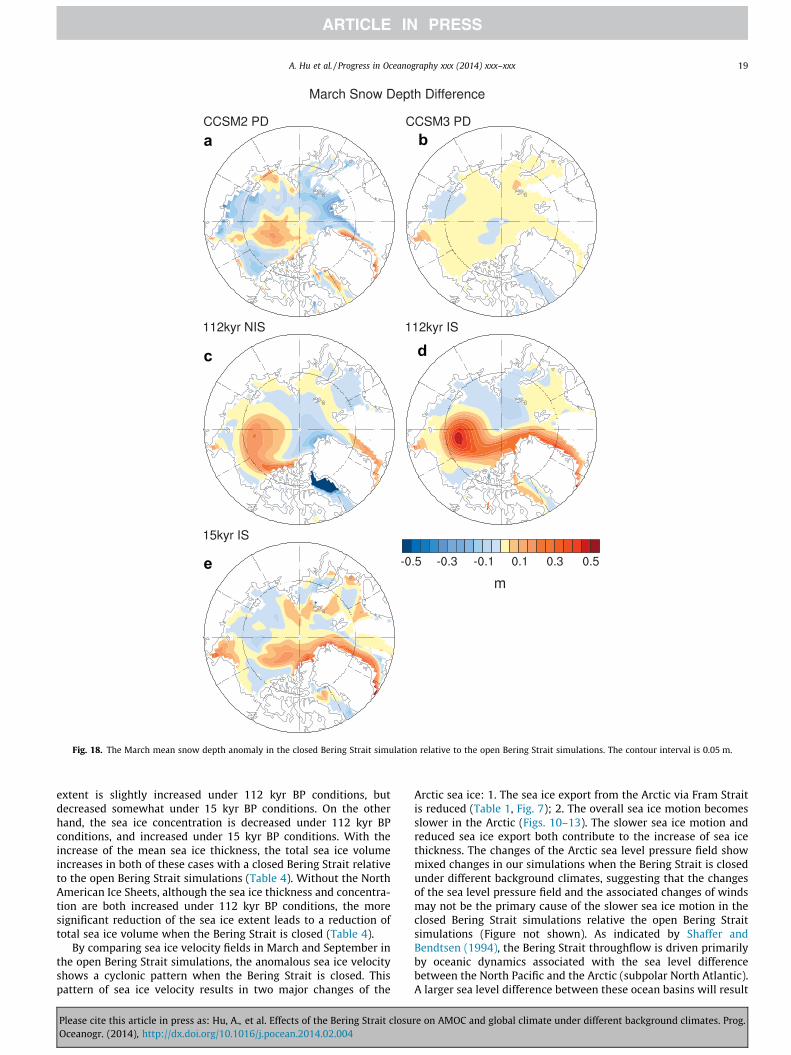
Fig. 18. The March mean snow depth anomaly in the closed Bering Strait simulation relative to the open Bering Strait simulations. The contour interval is 0.05 m.
A. Hu et al. / Progress in Oceanography xxx (2014) xxx–xxx 19
extent is slightly increased under 112 kyr BP conditions, butdecreased somewhat under 15 kyr BP conditions. On the otherhand, the sea ice concentration is decreased under 112 kyr BPconditions, and increased under 15 kyr BP conditions. With theincrease of the mean sea ice thickness, the total sea ice volumeincreases in both of these cases with a closed Bering Strait relativeto the open Bering Strait simulations (Table 4). Without the NorthAmerican Ice Sheets, although the sea ice thickness and concentra-tion are both increased under 112 kyr BP conditions, the moresignificant reduction of the sea ice extent leads to a reduction oftotal sea ice volume when the Bering Strait is closed (Table 4).
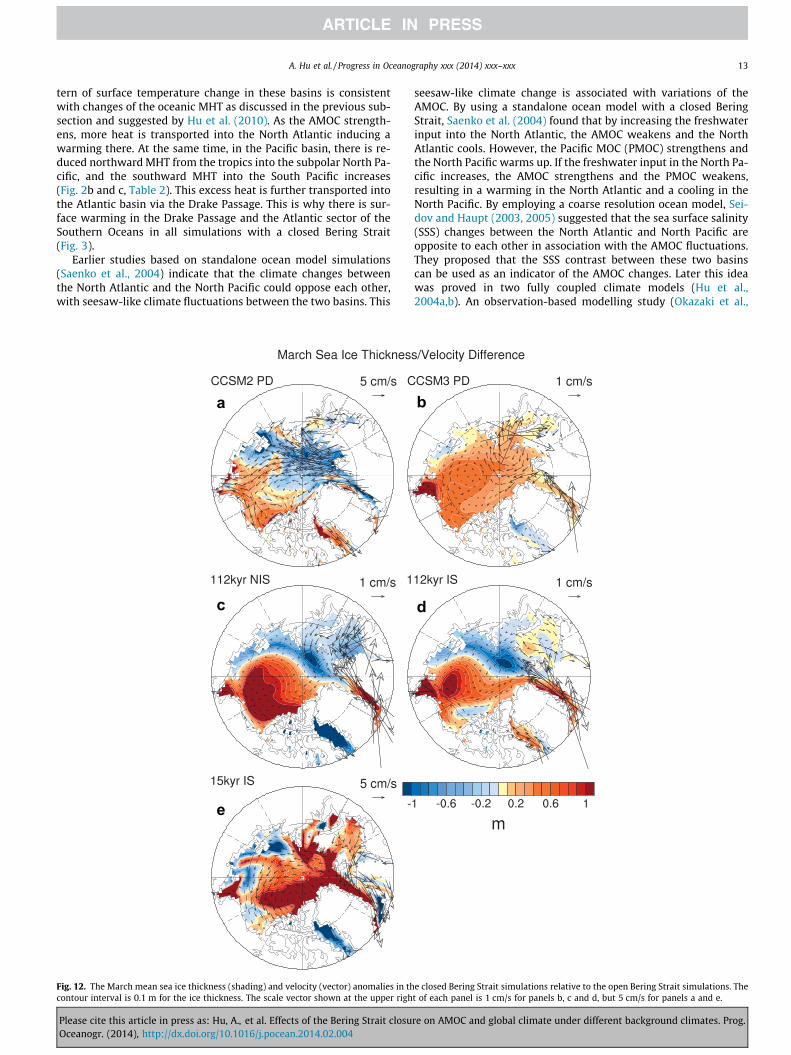
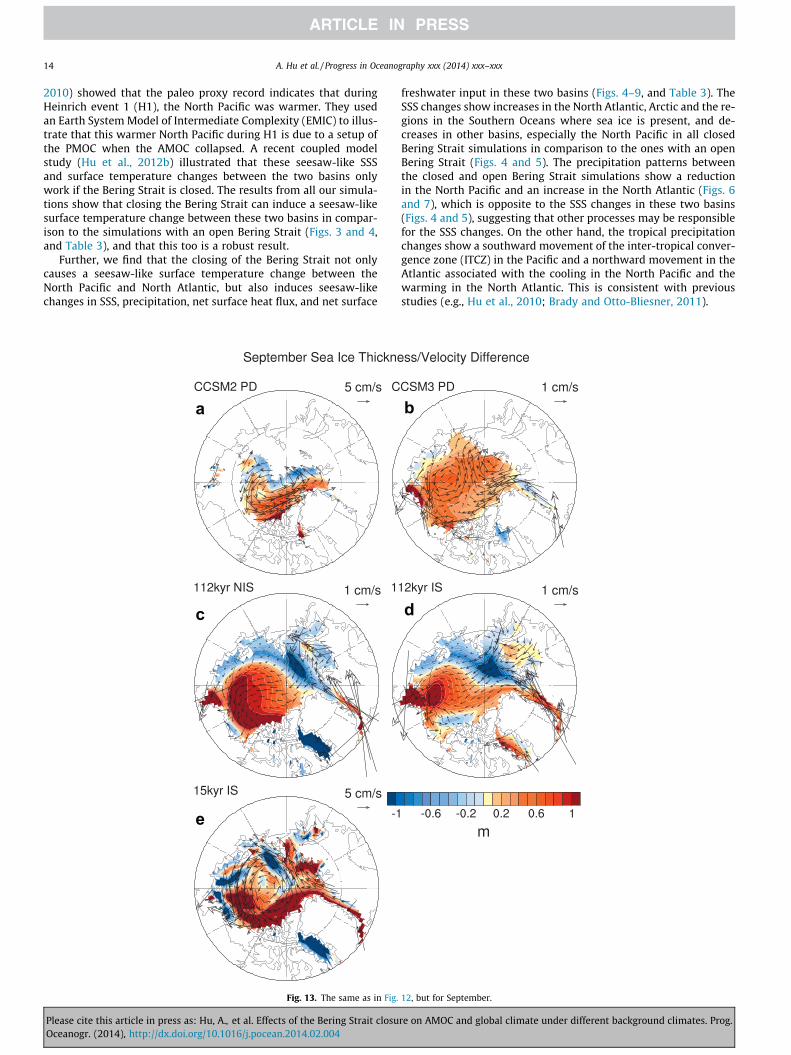
By comparing sea ice velocity fields in March and September inthe open Bering Strait simulations, the anomalous sea ice velocityshows a cyclonic pattern when the Bering Strait is closed. Thispattern of sea ice velocity results in two major changes of the
Please cite this article in press as: Hu, A., et al. Effects of the Bering Strait closuOceanogr. (2014), http://dx.doi.org/10.1016/j.pocean.2014.02.004
Arctic sea ice: 1. The sea ice export from the Arctic via Fram Straitis reduced (Table 1, Fig. 7); 2. The overall sea ice motion becomesslower in the Arctic (Figs. 10–13). The slower sea ice motion andreduced sea ice export both contribute to the increase of sea icethickness. The changes of the Arctic sea level pressure field showmixed changes in our simulations when the Bering Strait is closedunder different background climates, suggesting that the changesof the sea level pressure field and the associated changes of windsmay not be the primary cause of the slower sea ice motion in theclosed Bering Strait simulations relative the open Bering Straitsimulations (Figure not shown). As indicated by Shaffer andBendtsen (1994), the Bering Strait throughflow is driven primarilyby oceanic dynamics associated with the sea level differencebetween the North Pacific and the Arctic (subpolar North Atlantic).A larger sea level difference between these ocean basins will result
re on AMOC and global climate under different background climates. Prog.
a
c
e
b
d
Fig. 19. The same as in Fig. 18, but for September.
20 A. Hu et al. / Progress in Oceanography xxx (2014) xxx–xxx
in a stronger Bering Strait throughflow. As indicated by many pre-vious studies, the Arctic currents are a complicated system whichis affected by multiple processes, such as the net input of freshwa-ter from evaporation minus precipitation, river runoff (e.g., Aag-aard and Carmack, 1989; Carmack et al., 2008), the overlyingatmospheric variability (Dickson et al., 2000), etc., and interactwith the sea ice export and the thermohaline circulation. However,this net water mass inflow from the North Pacific via the BeringStrait is at least one of the driving forces of the Arctic surface flow,and makes it flow toward the subpolar North Atlantic as shown inFig. 14 in the simulations with an open Bering Strait. When theBering Strait is closed, this driving force is absent, leading to amuch slower motion of the surface water (Fig. 15) through a setof complicated processes in responding to the absence of thisthroughflow. This reduced surface water motion leads to slowersea ice motion in the closed Bering Strait simulations. The watermass exchange in the upper 100 m of the ocean between the Arctic
Please cite this article in press as: Hu, A., et al. Effects of the Bering Strait closuOceanogr. (2014), http://dx.doi.org/10.1016/j.pocean.2014.02.004
and the subpolar North Atlantic is reduced when the Bering Straitis closed (see right most panels in Fig. 1). The reduction of thisexchange is equivalent to the strength of the Bering Strait through-flow. This reflects the fact that the export of both the upper oceanwater and sea ice in the Arctic decreases with the closure of theBering Strait.
Figs. 16 and 17 show the simulated snow depth on sea ice inMarch and September with an open Bering Strait. Under presentday and 15 kyr BP climate conditions, the simulated snow depthis only a few tenths of a meter with an open Bering Strait, butreaches up to 2 m under 112 kyr BP climate conditions in bothMarch and September. With a closed Bering Strait, the pattern ofsnow cover change is similar to the sea ice change (Figs. 18 and19). Where the sea ice becomes thicker, the snow depth alsobecomes deeper, and vice versa. This suggests that with thickerice, less heat from underneath the ocean reaches the ice surface,thus reducing the melting of snow on top of the sea ice. Conversely,
re on AMOC and global climate under different background climates. Prog.
A. Hu et al. / Progress in Oceanography xxx (2014) xxx–xxx 21
more snow on top of sea ice will increase the albedo during sum-mer, leading to a reduced melt of sea ice and snow.
4. Conclusions
In this study, we investigated the changes of the AMOC, NorthPacific and North Atlantic climate, and Arctic sea ice due to open-ing or closing of the Bering Strait under different climate boundaryconditions using two global coupled climate models, the NCARCCSM2 and CCSM3. Our results suggest that, in general, the re-sponse of the AMOC to the Bering Strait closure is qualitativelythe same across the two model versions and across quite differentclimate boundary conditions, with the AMOC becoming stronger inall simulation pairs. This stronger AMOC transports more heat fromthe rest of the ocean into the North Atlantic, leading to a warmingin the North Atlantic and a cooling in the North Pacific in compar-ison to the mean climate with an open Bering Strait, a seesaw-likeclimate change between the North Atlantic and the North Pacific.This seesaw-like change can not only be found in SST, but also inSSS, precipitation, evaporation, surface freshwater input and totalheat loss in these two basins. Furthermore, we also show thatthe lack of Bering Strait throughflow due to a Bering Strait closurecauses a slower upper Arctic water and sea ice motion, resulting inthicker sea ice and deeper snow on top of sea ice in the Arctic, andreduced sea ice export from the Arctic into the North Atlantic. Thishelps to maintain a more saline and dense subpolar North Atlantic,and a more vigorous AMOC.
From our results, it is clear that although the Bering Strait is ashallow and narrow strait, the status of this strait – open orclosed – possibly has played not only a vital role in modulatingpast global climate (Shaffer and Bendtsen, 1994; De Bore andNof, 2004a,b; Hu and Meehl, 2005; Hu et al., 2007, 2008, 2010,2012a,b; Keigwin and Cook, 2007; Sandal and Nof, 2008a,b,c;Sarnthein et al., 2009), but also could play a key role in under-standing the mechanisms involved with the future climateresponse to increasing greenhouse gases (Hu et al., 2009, 2011,2013). Our study also suggests that it is important that a properBering Strait condition is used for studies of paleoclimate, as wellas modern and future climates. Biases will arise if an open BeringStrait is used for studies of past glacial climates when the BeringStrait was actually closed, or if a closed Bering Strait is used forpresent day or future climate simulations when the Bering Straitis actually open (e.g. Hu et al., 2012a, b).
Acknowledgements
This research was supported by the Regional Climate ModelingProgram (RGCM) of the U.S. Department of Energy’s, Office ofScience (BER), Cooperative Agreement DE-FC02-97ER62402. TheNational Center for Atmospheric Research is sponsored by theNational Science Foundation.
References
Aagaard, K., Carmack, E.C., 1989. The role of sea ice and other fresh water in theArctic circulation. Journal of Geophysical Research 94, 14,485–14,498.
Alley, R.B., MacAyeal, D.R., 1994. Ice-rafted debris associated with bing/purgeoscillations of the Laurentide ice sheet. Paleoceanography 9, 503–511.
Berger, A., 1978. Long-term variations of daily insolation and Quaternary ClimaticChanges. Journal of Atmospheric Science 35, 2362–2367.
Bonan, G.B., Levis, S., Kergoat, L., Oleson, K.W., 2002. Landscapes as patches of plantfunctional types: an integrating concept for climate and ecosystem models.Global Biogeochemical Cycles 16, 5.1–5.23.
Brady, E.C., Otto-Bliesner, B.L., 2011. The role of meltwater-induced subsurfaceocean warming in regulating the Atlantic meridional overturning in glacialclimate simulations. Climate Dynamics 37, 1517–1532. http://dx.doi.org/10.1007/s00382-010-0925-9.
Please cite this article in press as: Hu, A., et al. Effects of the Bering Strait closuOceanogr. (2014), http://dx.doi.org/10.1016/j.pocean.2014.02.004
Briegleb, B.P., Bitz, C.M., Hunke, E.C., Lipscomb, W.H., Holland, M.M., Schramm, J.L.,Moritz, R.E., 2004. Scientific description of the sea ice component in theCommunity Climate System Model, Version Three. Tech. Rep. NCAR/TN-463STR,National Center for Atmospheric Research, Boulder, CO, 78 pp.
Broccoli, A.J., Dahl, K.A., Stouffer, R.J., 2006. Response of the ITCZ to NorthernHemisphere cooling. Geophysical Research Letters 33, L01702. http://dx.doi.org/10.1029/2005GL024546.
Broecker, W.S., 1994. Massive iceberg discharges as triggers for global climatechange. Nature 372, 421–424.
Carmack, E., McLaughlin, F., Yamamoto-Kawail, M., Itoh, M., Shimada, K., Krishfield,R., Proshutinsky, A., 2008. Freshwater Storage in the Northern Ocean and theSpecial Role of the Beaufort Gyre. In: Dickson, R.R., Meincke, J., Rhines, P. (Eds.),Arctic-Subarctic Ocean Fluxes: Defining the Role of the Northern Seas inClimate. Springer, The Netherlands.
Clark, P.U. et al., 2007. In Ocean Circulation: Mechanisms and Impacts, edsSchmittner A, Chiang J, and Hemming S (American Geophysical Union,Washington, D.C.). Geophysical Monograph 173, 209–246.
Collins, W.D., et al., 2004. Description of the NCAR Community Atmosphere Model(CAM3). Tech. Rep. NCAR/TN-464 STR, National Center for AtmosphericResearch, Boulder, CO, 226 pp.
Collins, W.D. et al., 2006. The Community Climate System Model: CCSM3. Journal ofClimate 19, 2122–2143.
Cunningham, S.A., Marsh, R., 2010. Observing and Modeling Changes in the AtlanticMOC. Wiley Interdisciplinary Reviews: Climate Change. John Wiley & Sons,180–191.
Cunningham, S.A. et al., 2007. Temporal variability of the Atlantic meridionaloverturning circulation at 26.58N. Science 317, 935–938.
Dahl, K. et al., 2005. Assessing the role of North Atlantic freshwater forcing inmillennial scale climate variability: a tropical Atlantic perspective. ClimateDynamics 24, 325–346.
Dansgaard, W. et al., 1993. Evidence for general instability for past climate from a250-kyr ice-core record. Nature 364, 218–220.
De Bore, A.M., Nof, D., 2004a. The exhaust valve of the North Atlantic. Journal ofClimate 17, 417–422.
De Bore, A.M., Nof, D., 2004b. The Bering Strait’s grip on the northern hemisphereclimate. Deep Sea Research I 51, 1347–1366.
Delworth, T., Manabe, S., Stouffer, R.J., 1993. Interdecadal variations of thethermohaline circulation in a coupled ocean-atmosphere model. Journal ofClimate 6, 1993–2011.
Dickson, R.R., Brown, J., 1994. The production of North Atlantic Deep Water:sources, rates, and pathways. Journal of Geophysical Research 99, 12319–12341.
Dickson, R.R., Osborn, T.J., Hurrell, J.W., Meincke, J., Blindheim, J., Adlandsvik, B.,Vinje, T., Alekseev, G., Maslowski, W., 2000. The Arctic Ocean Response to theNorth Atlantic Oscillation. Journal of Climate 13, 2671–2696.
Ditlevsen, P.D., Kristensen, M.S., Andersen, K.K., 2005. The recurrence time ofDansgaard-Oeschger events and limits on the possible periodic component.Journal of Climate 18, 2594–2603.
Fleming, K., Lambeck, K., 2004. Constraints on the Greenland ice Sheet since the LastGlacial Maximum from observations of sea-level change and glacial-reboundmodeling. Quaternary Science Reviews 23, 1053–1077.
Ganachaud, A., Wunsch, C., 2000. Improved estimates of global ocean circulation,heat transport and mixing from hydrographic data. Nature 408, 453–457.
Gregory, J.M. et al., 2005. A model intercomparison of changes in the Atlanticthermohaline circulation in response to increasing atmospheric CO2
concentration. Geophysical Research Letters 32, L12703. http://dx.doi.org/10.1029/2005GL023209.
Grützner, J., Higgins, S.M., 2010. Threshold behaviour of millennial scale variabilityin deep water hydrography inferred from a 1.1 Ma long record of sedimentprovenace at the southern Gardar Drift. Paleoceanography 25, PA4204. http://dx.doi.org/10.1029/2009PA001873.
Gutjahr, M., Hoogakker, B., Frank, M., McCave, I., 2010. Changes in North AtlanticDeep Water strength and bottom water masses during Marine Isotope Stage 3(45–35 ka BP). Quaternary Science Reviews 29, 2451–2461.
Heinrich, H., 1988. Origin and consequences of cyclic ice rafting in the northeastAtlantic Ocean during the past 130,000 years. Quaternary Research 29, 143–152.
Hemming, S.R., 2004. Heinrich events: massive late Pleistocene detritus layers ofthe North Atlantic and their global climate imprint. Reviews of Geophysics 42,RG1005. http://dx.doi.org/10.1029/2003RG000128.
Holland, M.M., Bitz, C.M., Hunke, E.C., Lipscomb, W.H., Schramm, J.L., 2006.Influence of the sea ice thickness distribution on polar climate in CCSM3.Journal of Climate 19, 2398–2414.
Hu, A. et al., 2004a. Response of the Atlantic thermohaline circulation to increasedatmospheric CO2 in a coupled model. Journal of Climate 17, 4267–4279.
Hu, A., Meehl, G.A., Han, W., 2004b. Detecting thermohaline circulation changesfrom ocean properties in a coupled model. Geophysical Research Letters 31,L13204. http://dx.doi.org/10.1029/2004GL020218.
Hu, A., Meehl, G.A., 2005. Bering Strait throughflow and the thermohalinecirculation. Geophysical Research Letters 32, L24610. http://dx.doi.org/10.1029/2005GL024424.
Hu, A., Meehl, G.A., Han, W., 2007. Role of the Bering Strait in the thermohalinecirculation and abrupt climate change. Geophysical Research Letters 34,L05704. http://dx.doi.org/10.1029/2006GL028906.
re on AMOC and global climate under different background climates. Prog.
22 A. Hu et al. / Progress in Oceanography xxx (2014) xxx–xxx
Hu, A., Otto-Bliesner, B.L., Meehl, G.A., Han, W., Morrill, C., Brady, E.C., Briegleb, B.,2008. Response of Thermohaline Circulation to Freshwater Forcing underPresent Day and LGM Conditions. Journal of Climate 21, 2239–2258.
Hu, A., Meehl, G.A., Han, W., Yin, J., 2009. Transient response of the MOC and climateto potential melting of the Greenland Ice Sheet in the 21st century. GeophysicalResearch Letters 36, L10707. http://dx.doi.org/10.1029/2009GL037998.
Hu, A., Meehl, G.A., Otto-Bliesner, B.L., Waelbroeck, C., Han, W., Loutre, M.-F.,Lambeck, K., Mitrovica, J.X., Rosenbloom, N., 2010. Influence of Bering Straitflow and North Atlantic circulation on glacial sea level changes. NatureGeosciences 3, 118–121. http://dx.doi.org/10.1038/NGEO729.
Hu, A., Meehl, G.A., Han, W., Yin, J., 2011. Effect of the Potential Melting of theGreenland Ice Sheet on the Meridional Overturning Circulation and GlobalClimate in the Future. Deep Sea Research Part II: Topical Studies inOceanography 58, 1914. http://dx.doi.org/10.1016/j.dsr2.2010.10.069-192.
Hu, A., Meehl, G.A., Han, W., Abe-Ouchi, A., Morrill, C., Okazaki, Y., Chikamoto, M.O.,2012a. The Pacific –Atlantic Seesaw and the Bering Strait. Geophysical ResearchLetters 39, L03702. http://dx.doi.org/10.1029/2011GL050567.
Hu, A., Meehl, G.A., Han, W., Timmermann, A., Otto-Bliesner, B.L., Liu, Z.,Washington, W.M., Large, W., Abe-Ouchi, A., Kimoto, M., Lambeck, K., Wu, B.,2012b. Role of the Bering Strait on the hysteresis of the ocean conveyor beltcirculation and glacial climate stability. PNAS 109, 6417–6422. http://dx.doi.org/10.1073/pnas.1116014109.
Hu, A., Meehl, G.A., Han, W., Yin, J., Wu, B., Kimoto, M., 2013. Influence ofcontinental ice retreat on future global climate. Journal of Climate 26, 3087–3111, http://dx.doi.org/10.1175/JCLI-D-12-00102.1.
Jahn, A., Holland, M.M., 2013. Implications of Arctic sea ice changes for NorthAtlantic deep convection in CCSM4-CMIP5 simulations. Geophysical ResearchLetters 40. http://dx.doi.org/10.1002/grl.50183.
Johns, W.E., Baringer, M.O., Beal, M.O., Cunningham, S.A., Kanzow, T., Bryden, H.L.,Hirschi, J.J.M., Marotzke, J., Meinen, C.S., Shaw, B., Curry, R., 2011. Continuous,array-based estimates of Atlantic Ocean heat transport at 26.5�N. Journal ofClimate 24, 2429–2449. http://dx.doi.org/10.1175/2010JCLI3997.1.
Keigwin, L.D., Jones, G.A., 1994. Western North Atlantic evidence for millennial-scale changes in ocean circulation and climate. Journal of Geophysical Research99, 12397–12410.
Keigwin, L.D., Cook, M.S., 2007. A role for North Pacific salinity in stabilizing NorthAtlantic climate. Paleoceanography 22, PA3102. http://dx.doi.org/10.1029/2007PA001420.
Kiehl, J.T., Gent, P.R., 2004. The Community Climate System Model, version two.Journal of Climate 17, 3666–3682.
Kwok, R., 2008. Outflow of Arctic sea ice into the Greenland and Barents Seas:1979–2007. Journal of Climate 22, 2438–2457. http://dx.doi.org/10.1175/2008JCLI2819.1.
Lambeck, K., Chappell, J., 2001. Sea level change through the last glacial cycle.Science 292, 679–686.
Lambeck, K., Smither, C., Johnston, P., 1998. Sea-level change, glacial rebound andmantle viscosity for northern Europe. Geophysical Journal International 134,102–144.
Lambeck, K., Purcell, A., Zhao, J., Svensson, N.O., 2010. The Scandinavian ice sheet:from MIS 4 to the end of the Last Glacial Maximum. Boreas 39, 410–435. http://dx.doi.org/10.1111/j.1502-3885.2010.00140.x.
Levermann, A. et al., 2005. Dynamic sea level changes following changes in thethermohaline circulation. Climate Dynamics 24, 347–354.
Loulergue, L. et al., 2008. Orbital and millennial-scale features of atmospheric CH4over the past 800,000 years. Nature 453, 383–386. http://dx.doi.org/10.1038/nature06950.
Loutre, M.F. et al., 2004. Does mean annual insolation have the potential to changethe climate? Earth and Planetary Science Letter 221, 1–14.
Manabe, S., Stouffer, R.J., 1988. Two stable equilibria of a coupled ocean-atmospheremodel. Journal of Climate 1, 841–866.
Manabe, S., Stouffer, R.J., Spelman, M.J., Bryan, K., 1991. Transient responses of acoupled ocean-atmosphere model to gradual changes of atmospheric CO2. PartI: Annual mean response. Journal of Climate 4, 785–818.
Marincovich Jr, L., Gladenkov, A.Y., 2001. New evidence for the age of Bering Strait.Quaternary Science Review 20, 329–335.
McManus, J.F., Francois, R., Gherardi, J.-M., Keigwin, L., Brown-Leger, S., 2004.Collapse and rapid resumption of Atlantic meridional circulation linked todeglacial climate changes. Nature 428, 834–837.
Meehl, G.A., Washington, W.M., Collins, W.D., Arblaster, J.M., Hu, A., Buja, L.E.,Strand, W.G., Teng, H., 2005. How much more global warming and sea levelrise? Science 307, 1769–1772.
Meehl, G.A., Hu, A., Tebaldi, C., 2010. Decadal prediction in the Pacific region.Journal of Climate 23. http://dx.doi.org/10.1175/2010JCLI3296.1, 2959-2973.
Mikolajewicz, U., Gröger, M., Maier-Reimer, E., Schurgers, G., Vizcaíno, M., Winguth,A.M.E., 2007. Long-term effects of anthropogenic CO2 emissions simulatedwuth a complex earth system model. Climate Dynamics 28, 599–633. http://dx.doi.org/10.1007/s00382-006-0204-y.
Nof, D., 2000. Does the wind control the import and export of the South Atlantic?Journal of Physical Oceanography 30, 2650–2667.
Nof, D., Van Gorder, S., 2003. Did an open Panama Isthmus correspond to aninvasion of Pacific water into the Atlantic? Journal of Physical Oceanography 33,1324–1336.
Ohlmann, J.C., 2003. Ocean radiant heating in climate models. Journal of Climate 16,1337–1351.
Okazaki, Y. et al., 2010. Deepwater formation in the North Pacific during the lastglacial termination. Science 329, 200–204.
Please cite this article in press as: Hu, A., et al. Effects of the Bering Strait closuOceanogr. (2014), http://dx.doi.org/10.1016/j.pocean.2014.02.004
Oleson, K.W., et al., 2004. Technical Description of the Community Land Model(CLM). Tech. Rep. NCAR/TN-461STR, National Center for Atmospheric Research,Boulder, CO, 174 pp.
Ortiz, J.D., Nof, D., Polyak, L., St-Onge, G., Lise-Pronovost, A., Naidu, S., Darby, D.,Brachfeld, S., 2012. The late Quaternary flow through the Bering Strait has beenforced by the southern ocean winds. Journal of Physical Oceanography 42,2014–2029. http://dx.doi.org/10.1175/JPO-D-11-0167.1.
Otto-Bliesner, B.L., Marshall, S., Overpeck, J., Miller, G., Hu, A., CAPE Last InterglacialProject Members, 2006a. Simulating Arctic climate warmth and icefield retreatin the last interglaciation. Science 311, 1751–1753.
Otto-Bliesner, B.L., Brady, E.C., Clauzet, G., Tomas, R., Levis, S., Kothavala, Z., 2006b.Last Glacial Maximum and Holocene climate in CCSM3. Journal of Climate 19,2526–2544.
Otto-Bliesner, B.L., Hewitt, C.D., Marchitto, T.M., Brady, E., Abe-Ouchi, A., Crucific,M., Murakami, S., Weber, S.L., 2007. Last glacial maximum ocean thermohalinecirculation: PMIP2 model intercomparisons and data constraints. GeophysicalResearch Letters 34, L12707. http://dx.doi.org/10.1029/2007GL029475.
Petit, J.R. et al., 1999. Climate and atmospheric history of the past 420,000 yearsfrom the Vostok ice core, Antarctica. Nature 399, 429–436.
Peltier, W.R., 2004. Global Glacial Isostasy and the Surface of the Ice-Age Earth: TheICE-5G (VM2) Model and GRACE, Invited Paper. Annual Review of Earth andPlanetary Science 32, 111–149.
Peltier, W.R., Solheim, L.P., 2004. The climate of the Earth at Last Glacial Maximum:statistical equilibroum state and a mode of internal variability. QuaternaryScience Reviews 23, 335–357.
Rahmstorf, S., 1996. On the freshwater forcing and transport of the Atlanticthermohaline circulation. Climate Dynamics 12, 799–811.
Rahmstorf, S., 2002. Ocean circulation and climate during the last 120,000 years.Nature 419, 207–214.
Rahmstorf, S. et al., 2005. Thermohaline circulation hysteresis: a modelintercomparison. Geophysical Research Letters 32, L23605. http://dx.doi.org/10.1029/2005GL023655.
Saenko, O.A., Schmittner, A., Weaver, A.J., 2004. The Atlantic-Pacific seesaw. Journalof Climate 17, 2033–2038.
Sakai, K., Peltier, W.R., 1997. Dansgaard-Oeschger Oscillation in a coupledatmosphere-ocean climate model. Journal of Climate 10, 949–970.
Sandal, C., Nof, D., 2008a. Laboratory experiments on the paleo-jamming of theBering Strait. Deep-Sea Research I 55, 1105–1117.
Sandal, C., Nof, D., 2008b. The collapse of the Bering Strait ice-dam and the abrupttemperature rise in the beginning of the Holocene. Journal of PhysicalOceanography 38, 1979–1991.
Sandal, C., Nof, D., 2008c. A new analytical model for Heinrich events and climateinstability. Journal of Physical Oceanography 38, 451–466.
Sarnthein, M., Bartoli, G., Prange, M., Schmittner, A., Schneider, B., Weinelt, M.,Andersen, N., Garbe-Schönberg, D., 2009. Mid-Pliocene shifts in oceanoverturning circulation and the onset of Quaternary-style climates. ClimatePast 5, 269–283.
Seidov, D., Haupt, B.J., 2003. Freshwater teleconnection and ocean thermohalinecirculation. Geophysical Research Letters 30 (1329), 2002G. http://dx.doi.org/10.1029/L016564.
Seidov, D., Haupt, B.J., 2005. How to run a minimalist’s global ocean conveyor.Geophysical Research Letters 32, L07610. http://dx.doi.org/10.1029/2005GL022559.
Shaffer, G., Bendtsen, J., 1994. Role of the Bering Strait in controlling North AtlanticOcean circulation and climate. Nature 367, 354–357.
Schmittner, A., Stocker, T.F., 1999. The stability of the thermohaline circulation inglobal warming experiments. Journal of Climate 12, 1117–1133.
Schmittner, A., Latif, M., Schneider, B., 2005. Model projections of the North Atlanticthermohaline circulation for the 21st century assessed by observations.Geophysical Research Letters 32, L23710. http://dx.doi.org/10.1029/2005GL024368.
Smith, R.D., Gent, P.R., 2002. Reference Manual for the Parallel Ocean Program(POP), Ocean Component of the Community Climate System Model (CCSM2.0and 3.0).Tech. Rep. LA-UR-02-2484, Los Alamos National Laboratory. <http://www.ccsm.ucar.edu/models/ccsm3.0/pop>.
Stouffer, R.J. et al., 2006. Investigating the Causes of the response of thethermohaline circulation to past and future climate changes. Journal ofClimate 19, 1365–1387.
Stouffer, R.J., Seidov, D., Haupt, B.J., 2007. Climate response to external sources offreshwater: North Atlantic versus the Southern Ocean. Journal of Climate 20,436–448.
Stocker, T.F., Wright, D.G., 1991. Rapid transitions of the ocean’s deep circulationinduced by changes in surface water fluxes. Nature 351, 729–732.
Stocker, T.F., Broecker, W.S., 1994. Observation and modeling of North Atlantic deepwater formation and its variability: introduction. Journal of GeophysicalResearch 99, 12317.
Stocker, T.F., Schmittner, A., 1997. Influence of CO2 emission rates on the stability ofthe thermohaline circulation. Nature 388, 862–865.
Stocker, T.F., 2000. Past and future reorganisations in the climate system.Quaternary Science Reviews 19, 301–319.
Stocker, T.F., Marchal, O., 2000. Abrupt climate change in the computer: is it real?Proceedings of the US National Academy of Sciences 97, 1362–1365.
Stocker, T.F., 2002. North-South connections. Science 297, 1814–1815.Timmermann, A., Latif, M., Voss, R., Groetzner, A., 1998. Northern Hemispheric
Interdecadal Variability: a coupled Air-Sea Mode. Journal of Climate 11, 1906–1931.
re on AMOC and global climate under different background climates. Prog.

A. Hu et al. / Progress in Oceanography xxx (2014) xxx–xxx 23
Timmermann, A., An, S.-I., Krebs, U., Goosse, H., 2005a. ENSO suppression due toweakening of the North Atlantic thermohaline circulation. Journal of Climate18, 3122–3139.
Timmermann, A., Krebs, U., Justino, F., Goosse, H., Ivanochko, T., 2005b. Mechanismsfor millennial-scale global synchronization during the last glacial period.Paleoceanography 20, PA4008. http://dx.doi.org/10.1029/2004PA00109.
Weber, S.L. et al., 2007. The modern and glacial overturning circulation in theAtlantic Ocean in PMIP coupled model simulations. Climate of the Past 3, 51–64.
Woodgate, R.A., Aagaard, K., 2005. Revising the Bering Strait freshwater flux into theArctic Ocean. Geophysical Research Letters 32, L02602. http://dx.doi.org/10.1029/2004GL021747.
Please cite this article in press as: Hu, A., et al. Effects of the Bering Strait closuOceanogr. (2014), http://dx.doi.org/10.1016/j.pocean.2014.02.004
Yu, E.-F., Francois, R., Bacon, P., 1996. Similar rates of modern and last-glacialocean thermohaline circulation inferred from radiochemical data. Nature379, 689–694.
Zahn, R. et al., 1997. Thermohaline instability in the North Atlantic duringmeltwater events: Stable isotope and ice-rafted detritus records from coreSO75-26KL, Portuguese margin. Paleoceanography 12, 696–710.
Zhang, R., Delworth, T.L., 2005. Simulated tropical response to a substantialweakening of the Atlantic thermohaline circulation. Journal of Climate 18,1853–1860. http://dx.doi.org/10.1175/JCLI3460.1.
re on AMOC and global climate under different background climates. Prog.