Embed Size (px)
Citation preview

1
4th IASPEI / IAEE International Symposium:
Effects of Surface Geology on Seismic Motion August 23–26, 2011 · University of California Santa Barbara
SITE CHARACTERIZATION FOR URBAN SEISMIC HAZARD IN SINGAPORE FROM MICROTREMOR STUDY
Cheng ZHU Kusnowidjaja MEGAWATI Meya Yanger WALLING Earth Observatory of Singapore, Earth Observatory of Singapore and Earth Observatory of Singapore, Nanyang Technological University, School of Civil & Environmental Engineering, Nanyang Technological University, Singapore Nanyang Technological University, Singapore Singapore ABSTRACT The S-wave velocity structure of the subsurface layers or the fundamental frequency of the site represents the local site condition and can help to estimate the site response. They are the key factors in assessing seismic hazard and understanding ground motion characteristics. Triaxial measurements of microtremors were carried out at 146 locations in Singapore to investigate the fundamental frequencies at sites underlying different geological conditions. The fundamental frequency of each site is determined by the Nakamura’s H/V spectral ratio method (Nakamura, 1989). Correlations between fundamental frequency with geological formation and topographic slope are established. The maximum effective soil depth for profiling is defined by comparing the fundamental frequency obtained from the H/V spectrum with that of a horizontally layered model. Geotechnical information obtained from 71 neighboring borehole sites is used to correlate the fundamental frequency with sediment thickness. Inverse power formulas are thus developed for these quantitative relationships with respect to different S-wave velocity ranges. This allows the estimation of sediment thickness from the fundamental frequency in the H/V spectrum, which is particularly useful in investigating sites where no geotechnical information is available. This study shows how microtremor measurements can be used to characterize near-surface soil structure. INTRODUCTION Surface geology and soil properties have significant influences on the intensity of earthquake ground motion. Understanding site conditions are of great importance in site effect evaluation. As a conventional investigation method, drilling boreholes acquires detailed geotechnical information, but it is expensive and time-consuming. Microtremor survey method provides an alternative tool for site exploration as it is simple, much cheaper and noninvasive. Using this method, fundamental frequency of a site can be determined by applying the horizontal-to-vertical spectral ratio method (Nakamura, 1989). This method has been widely utilized for various applications, including seismic microzonation (e.g., Bour et al., 1998), bedrock depth mapping (e.g., Seht and Wohlenberg, 1999), and shallow soil shear-wave velocity (VS) structure profiling (e.g., Scherbaum et al., 2003). However, few studies have been conducted to understand the site effects in Singapore. Singapore is an island country experiencing land shortage, with most inhabitants working and living in high-rise buildings. Current building design code in Singapore largely follows the British Standard BS8110 (British Standards Institute, 1985) and does not have any provision for seismic loading. In the past, tremors from large earthquakes in Sumatra have been felt in tall buildings in Singapore. Therefore, considering its vulnerable infrastructure, dense population and substantial economic value, a comprehensive site effect study and seismic hazard assessment in Singapore become necessary. In the present study, the correlation of the fundamental frequency with geological formation and topographic slope will be emphasized. Based on the bore log data, the maximum depth for soil structure exploration using microtremor measurements is estimated for Singapore. Empirical relations between peak frequencies of H/V spectra and sediment thickness are derived. GEOLOGICAL SETTING

2
Singapore lies off the southern tip of the Malay Peninsula, 137 kilometers north of the Equator, in Southeast Asia. The current area, comprising the mainland and other islands, is about 710.3 km2, with 23% of the land area consisting of forest and nature reserves. On the basis of numerous geotechnical boreholes drilled for building constructions, it is well known that Singapore is underlain by sedimentary rocks, decomposed granite and Old Alluvium which, in many areas, are overlain by soft soil deposits comprising peats, sands and soft marine clays up to 50 m below the ground level (Fig. 1). A large area of granite (Bukit Timah Granite, BTG) was found in the central and northern parts of Singapore. It is normally completely decomposed near the surface to form a firm to stiff sandy clayey soil, with a large variation in the depth. Stratified sedimentary rocks (Jurong Formation, JF) form the bedrock at most areas of south and southwest of Singapore. Their structure is complicated due to folding and faulting. Old Alluvium (OA), comprising dense cemented sands, stiff silty clay and gravel, overlies granite, quartzite and sandstone at the east and northwest parts. Kallang Formation (KF) includes both marine and terrestrial sediment laid down from late Pleistocene to the present. The Singapore island is also surrounded by reclamation fill, using earth obtained from its own hills, the seabed, and neighboring countries. The typical bedrock in Singapore can be mainly divided into granitic rock and sedimentary rock, with a large variation in VS. This variation is probably due to weathering grade and rock mass factors such as joint spacing and joint infilling. GEOTECHNICAL INFORMATION The borehole information was provided by the Building and Construction Authority of Singapore. Most of them are shallow boreholes drilled mainly for residential building construction in specific areas, but do have a good coverage of all major geological groups (Fig. 1). The empirical correlation relationships between VS and SPT-N values for fill, marine deposits (silt/clay), alluvium deposits (silt/clay), alluvium deposits (sand), completely weathered sedimentary rock, and completely weathered granite, are derived by least square analysis according to VS obtained for various sites and tabulated in the Table 1. A large scatter exists for these correlations, which can be attributed to both the inherent variability of the materials and the variation in results from different VS and SPT-N testing techniques. A large number of the site investigation works are normally up to very dense or stiff decomposed soil only, instead of reaching rigid bedrock. Hence, according to the International Building Code (International Code Council, 2006), soil layers with SPT-N values larger than 100 are taken as the engineering bedrock in this study. The average shear wave velocity VS,D for the specified soil stratum with total depth D is computed by:
)/(/1
,1
, ∑∑=
=
=
=
=ni
iiSi
ni
iiDS VhhV (1)
where hi is the thickness of the i-th layer, VS,i is the shear wave velocity in the i-th layer. Using expression for a 1-D model of a single layer, the corresponding site frequency for the upper layer soils with an overall thickness D can be estimated:
DVf DSD 4/,= (2)
Fig. 1. Geological map of Singapore

3
Table 1. Correlation of SPT-N and VS for various soil types
Soil type Correlation relationship
Fill (Sand & Silt) 24.0,111 220.0 == RNVS
Alluvium Deposits (Sand) 65.0,6.66 249.0 == RNVS
Alluvium & Marine Clay 63.0,1.78 241.0 == RNVS
Residual Soil & Completely Weathered Sedimentary Rock 61.0,112 233.0 == RNVS
Residual Soil & Completely Weathered Granite 87.0,3.98 236.0 == RNVS
METHODOLOGY Measurements of ambient vibrations were performed with two portable stations equipped with a three-component servo velocity sensor and HKS-9550 or SAMTAC-902C data acquisition system. Survey location was chosen in the vicinity of the borehole sites, but away from the buildings or underground structures such as car park, sewer or pipes, as these structures may significantly alter the recordings. Weather conditions were also noticed and hence windy or rainy days are avoided. To assure data quality, measurements were generally carried out between 11 pm and 4 am so that the influence of passing vehicles and pedestrians could be minimized. At each location, recording duration was at least 20 minutes with a sampling rate of 100 Hz. Altogether, 146 free-field measurements were performed. To remove intensive artificial disturbance, all signals were band-pass filtered in a pass band of 0.2-20 Hz and visually checked afterwards. Then they were divided into 20.48-second-long windows and tapered individually using Hanning window. For each window, the amplitude spectra of the three components were computed using a fast Fourier transform (FFT) algorithm. The resulting FFT amplitude spectra were smoothed afterwards using a moving average window. Two orthogonal horizontal spectral components (H1, H2) were merged by the geometric mean before dividing the vertical component (V). The average spectral ratio of horizontal-to-vertical noise components (HVSR) was thus calculated using:
VHHHVSR /21 ⋅= (3) The arithmetic average of the HVSRs from all segments at one site was assigned as the H/V value of that site, from which the peak frequency f(hv) can be directly identified. RESULTS AND DISCUSSIONS Consistency and reliability check Two local sites, National Institute of Education (NIE) and Katong Park (KP), are selected for consistency check. They represent two different geological formations: Jurong formation (NIE) and Kallang Formation (KP). Similar responses are obtained for the H/V spectral ratio curves from microtremor recordings under the following situations (Fig. 2): (a) at different dates (NIE); (b) during different time segments of a single day (KP). The derived fundamental frequency f(hv) of NIE and KP sites are 6.2 Hz and 1.1 Hz respectively. This checking suggests that the fundamental frequency f(hv) determined from the H/V curves are almost time-independent and represent a constant and unique feature for each site.

4
100 1010
1
2
3
4
Frequency (Hz)
HVS
R
(a) NIE
2010-07-212010-09-182010-09-20
100 1010
2
4
6
8
10(b) KP
Frequency (Hz)
HVS
R
1100hrs 2009-12-021400hrs 2009-12-021500hrs 2009-12-021600hrs 2009-12-021700hrs 2009-12-021800hrs 2009-12-02
Fig. 2. Consistency check of the microtremor measurements at two places: (a) National Institute of Education; (b) Katong Park The Meteorological Services Division of the National Environment Agency set up a national network of digital seismic stations in Singapore. Three of them (KAPK, BESC, and NTU) have been covered by the microtremor measurements (Fig. 1). Based on the ground motion data recorded for the earthquake occurred in Padang Indonesia on 30 September 2009, the response spectral acceleration (RSA) curves are plotted (Fig. 3). At site KAPK, BESC, and NTU, the corresponding natural frequencies (1.2 Hz, 1.6 Hz, 3.4 Hz), where response spectral acceleration peaks appear, correlate well to site frequencies obtained from the microtremor survey method and frequencies results estimated using neighboring bore log data.
Fig. 3. Ground acceleration data and RSA curves for site KAPK, BESC, and NTU Effect of geological formation Geological conditions play a pivotal role in the local site response. Fundamental frequencies obtained from microtremor measurements reveal that the influences made by four major geological groups, i.e. Jurong Formation (JF), Bukit Timah Granite (BTG), Kallang Formation (KF) and Old Alluvium (OA), are evidently distinct. Frequencies results achieved from 146 sites are superimposed on the geological map of Singapore (Fig. 4). As shown, for soft sites in the KF and reclaimed land, peaks are conspicuous and the fundamental frequency values are usually small. On the other hand, H/V frequency results for stiff or hard sites, locating in formations such as JF, BTG, and Gombak Norite, are normally high expect for certain regions in the BTG area. Diverse extent of the weathering effect contributes to the large variance in strength for soils in the BTG. Most results in the OA and few results in the JF and BTG consistently present flat H/V spectral curve with no peak available, which is due to the high Vs of subsurface soils and the lack of clear contrast in VS with underlying sedimentary layers. Borehole data nearby verify these results: the OA normally has

5
high SPT-N value greater than 20. The findings suggest that soil deposits in the OA and JF are uniformly very dense while those in the KF are much softer. In sum, the different frequency responses conform to the geological signatures in the study region. The frequency f(hv) ranges of each major geological category based on the data collected so far are summarized in Table 2.
Fig. 4. Singapore geological map plotted with f(hv) determined from the HVSR method
Table 2. Fundamental frequency ranges for four major geological groups
Site Geology Type Fundamental Frequency (Hz) Jurong Formation (JF) 3 – 6.6
Bukit Timah Granite (BTG) 1.2 – 5.3 Kallang Formation (KF) 0.7 – 2.5
Old Alluvium (OA) No clear H/V peak frequency for most sites Effect of topographic slope Site response relies not only on the uppermost soils but also the surface topography at the recording site. Site effect indicators, such as the fundamental frequencies f(hv) or VS,30 (the VS of the upper 30 m soil), are correlated to the corresponding topographic slopes. The relationship is characterized in terms of discrete steps in VS according to the U.S. National Earthquake Hazards Reduction Program (NEHRP) VS,30 boundaries (Federal Emergency Management Agency [FEMA] 222A, 1994). The gradient ranges are calculated using the technique described in Wald & Allen (2007). The corresponding frequencies, computed from Eqn. (2) substituting D by 30 m, are also grouped into different ranges for site classification. Results are listed in Table 3 with each site classification scheme described. The topographic map of Singapore, provided by the Defence Science and Technology Agency of Singapore, denotes that morphology of Singapore is predominantly low (Fig. 5). Based on this high quality topographic map (about 1/6 arcsec resolution), a map of site classification is produced (Fig. 6). It can be seen that the site class boundaries broadly coincide with geological boundaries. In particular, the boundaries between Kallang Formation and other formations coincide with the Site Class E and D to Site Class C boundaries. Site Class B is restricted to a few locations where there is outcrop of rocks at the ground surface. This occurs at ground that is at a higher level than the surrounding area. Although the coverage of measurement sites is limited, the frequency ranges agree well with the site classifications.

6
Table 3. Summary of slope and frequency ranges for NEHRP VS,30 Categories
NEHRP Site Class
VS,30 Range (m/sec)
1/6 arcsec Gradient Range (m/m) (Stable Continent)
Frequency range from microtremor measurement (Hz)
E (soft soil) <180 <0.001588 <1.5
D (stiff soil)
180-240 0.001588-0.005637 1.5-2 240-300 0.005637-0.015 2-2.5 300-360 0.015-0.052 2.5-3
C (dense soil/soft rock)
360-490 0.052-0.11 3-4.1 490-620 0.11-0.21 4.1-5.2 620-760 0.21-0.33 5.2-6.3
B (rock) >760 >0.33 >6.3
Fig. 5. Topographic map of Singapore (black dot - the site of microtremor measurement; blank area - the elevation is below 5 m)
Fig. 6. Map of site classification derived from topographic slope plotted with f(hv) determined from the H/V method

7
Effective depth for soil structure profiling The horizontal-to-vertical spectral ratio obtained from microtremor survey method has been extensively applied for retrieving local shear-wave velocity structures. But there is a restriction in depth for this method to establish the soil layer structure. The depth is determined by ambient noise energy source and the site conditions. For a typical urban area like Singapore, where urban noise is high and long period wave excitation energy is limited because the incoming ocean waves are weak, it is of great interest to know the maximum effective depth for microtremor usage in site characterization. Using Eqn. (1) & (2), fundamental frequencies f(hv) of 71 neighboring borehole sites were calculated for different depths: 10m, 20m, 25m, 30m, 35m, and 40m. Frequencies obtained from bore log data (f(D)) are compared with those estimated from microtremor analysis (f(hv)). The arithmetic average is taken to represent the ratio of f(D) and f(hv) at each depth. The values are plotted versus individual depth with vertical lines representing ±1 standard deviation (Fig. 7). As the depth increases to 31.7 m, the ratio will drop and approach to 1 with the standard deviation equaling 0.31. Therefore, microtremor survey method gives the best characterization of the upper 32 m soil.
Fig. 7. The ratio of f(D) to f(hv) with respect to the calculation of different depths Similar computations were carried out for different frequency ranges: 0.7-1.5 Hz, 1.5-2.5 Hz, 2.5-4 Hz, and 4-6.6 Hz. Regression lines showing the f(D)/f(hv) ratio versus depth are plotted in Fig. 8. The effective depth for each category is identified at f(D)/f(hv) = 1. As shown, when site fundamental frequency f(hv) increases from 0.7 to 6.6 Hz, the effective depth for soil exploration drops from 41.6 m to 17.8 m. Hence, as the site gets harder, the depth of bedrock or much stiffer sediments becomes smaller. Microtremor study will only be able to reveal a shallower soft soil layer structure. This implies that the efficiency of the microtremor H/V technique is largely dependent on the underlying soil properties, specifically, the location of the impedance contrast.
Fig. 8. The ratio of f(D) to f(hv) with respect to D for different f intervals Sediment thickness mapping Microtremor study has been extensively applied for the bedrock depth mapping. After the proposed study that fundamental frequency f correlated well with the overall sediment thickness based on the study of western part of the Lower Rhine Embayment in Germany (Seht and Wohlenberg, 1999), researchers have also conducted similar measurements and further confirmed the validity of this method by comparing with geotechnical information (e.g., Delgado et al., 2000; Hinzen et al., 2004; Parolai et al., 2002). The
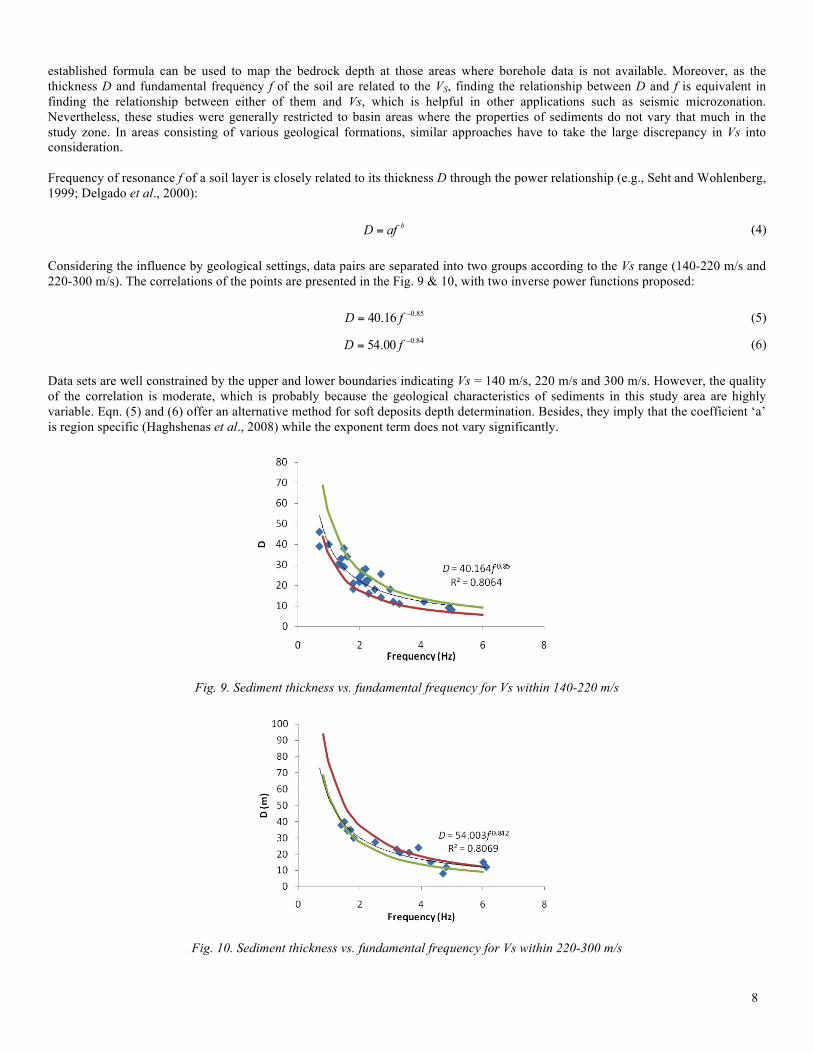
8
established formula can be used to map the bedrock depth at those areas where borehole data is not available. Moreover, as the thickness D and fundamental frequency f of the soil are related to the VS, finding the relationship between D and f is equivalent in finding the relationship between either of them and Vs, which is helpful in other applications such as seismic microzonation. Nevertheless, these studies were generally restricted to basin areas where the properties of sediments do not vary that much in the study zone. In areas consisting of various geological formations, similar approaches have to take the large discrepancy in Vs into consideration. Frequency of resonance f of a soil layer is closely related to its thickness D through the power relationship (e.g., Seht and Wohlenberg, 1999; Delgado et al., 2000):
bafD = (4) Considering the influence by geological settings, data pairs are separated into two groups according to the Vs range (140-220 m/s and 220-300 m/s). The correlations of the points are presented in the Fig. 9 & 10, with two inverse power functions proposed:
85.016.40 −= fD (5) 84.000.54 −= fD (6)
Data sets are well constrained by the upper and lower boundaries indicating Vs = 140 m/s, 220 m/s and 300 m/s. However, the quality of the correlation is moderate, which is probably because the geological characteristics of sediments in this study area are highly variable. Eqn. (5) and (6) offer an alternative method for soft deposits depth determination. Besides, they imply that the coefficient ‘a’ is region specific (Haghshenas et al., 2008) while the exponent term does not vary significantly.
Fig. 9. Sediment thickness vs. fundamental frequency for Vs within 140-220 m/s
Fig. 10. Sediment thickness vs. fundamental frequency for Vs within 220-300 m/s

9
CONCLUSION This study is the first attempt to investigate site effects in Singapore using microtremor survey method. The relationships between the fundamental frequency of the site, underlying geological formation, topographic slope, and its sedimentary soil thickness are analyzed based on the microtremor recordings at 146 locations. The consistency check for two sites locating in Jurong Formation and Kallang Formation correspondingly reveals that the H/V peak frequency is stable, unique, and can be utilized for site characterization. Validation is made by contrasting of frequency results obtained from empirical method with those derived from ground motion data and bore log data. Two main aspects of the site effects in Singapore, the geological effects as well as the topographic effects, have been investigated in detail. Site frequencies determined from microtremor survey method correlates with the geological formation of Singapore. Therefore, they are used to interpret the characteristics of four major geological groups in Singapore: 3-6.6 Hz for Jurong Formation; 1.2-5.3 Hz for Bukit Timah Granite; 0.7-2.5 Hz for Kallang Formation; no clear peak in the H/V curve for Old Alluvium. Based on the topographic slope and respective VS,30, a map of site classification was roughly established, which agrees well with microtremor measurement results. Majority of the island is classified as Site Class C, D and E, except for a few locations with rock outcrop and steeper slopes, which belongs to Site Class B. Detailed down-hole bore log data reveals that microtremor survey method is most effective in profiling the upper 32 m soil structure. In terms of frequency ranges, this method is able to retrieve a deeper soil structure when site is softer and site frequency is smaller. The geotechnical information is also applied to derive the sediment thickness and fundamental frequency relationship. In this study, two formulas have been developed for different shear-wave velocity ranges. REFERENCES Bour, M., Fouissac, D., Dominique, P., and Martin, C. [1998]. “On the Use of Microtremor Recordings in Seismic Microzonation”,
Soil Dynamics and Earthquake Engineering, Vol. 17, No. 7-8, pp. 465-474. British Standards Institute [1985]. “Structural Use of Concrete, Part 1”, Code of Practice for Design and Construction. BS8110: Part 1:
1985, British Standards Institute, London. Delgado, J., Lopez Casado, C., Giner, J., Estevez, A., Cuenca, A., and Molina, S. [2000]. “Microtremors as a geophysical exploration
tool: Applications and limitations”, Pure and Applied Geophysics, Vol. 157, pp. 1445-1462. Federal Emergency Management Agency (FEMA) 222A [1994]. “NEHRP recommended provisions for the development of seismic
regulations for new buildings, Part 1: Provisions”, 1994 edition, Federal Emergency Management Agency, Washington, D.C., pp. 290.
Haghshenas, E., Bard, P.Y., Theodulidis, N., Atakan, K., Cara, F., Cornou, C., Cultrera, G., Di Giulio, G., Dimitriu, P., Fäh, D., De
Franco, R., Marcellini, A., Pagani, M., Rovelli, A., Savvaidis, A., Tento, A., Vidal, S., and Zacharopoulos, S. [2008]. “Empirical evaluation of microtremor H/V spectral ratio”, Bulletin of Earthquake Engineering, Vol. 6, pp. 75-108.
Hinzen, K.G., Weber, B., and Scherbaum, F. [2004]. “On the resolution of H/V measurements to determine sediment thickness, a case
study across a normal fault in the lower rhine embayment, Germany”, Journal of Earthquake Engineering, Vol. 8, pp. 909-926. International Code Council [2006]. International Building Code IBC-2006. USA. Nakamura, Y. [1989]. “Method for Dynamic Characteristics Estimation of Subsurface Using Microtremor on the Ground Surface”,
Quarterly Report of RTRI (Railway Technical Research Institute) (30), Japan, pp. 25-33. Parolai, S., Bormann, P., and Milkereit, C. [2002]. “New relationships between Vs, thickness of sediments, and resonance frequency
calculated by the H/V ratio of seismic noise for the cologne area (Germany)”, Bulletin of the Seismological Society of America, Vol. 92, pp. 2521-2527.
Scherbaum, F., Hinzen, K. G., and Ohrnberger, M. [2003]. “Determination of Shallow Shear Wave Velocity Profiles in the Cologne,
Germany Area Using Ambient Vibrations”, Geophysical Journal International, Vol. 152, No. 3, pp. 597-612.

10
Seht, M. I. V. and Wohlenberg, J. [1999]. “Microtremor Measurements Used to Map Thickness of Soft Sediments”, Bulletin of the
Seismological Society of America, Vol. 89, No. 1, pp. 250-259. Wald, D.J., and Allen, T.I. [2007]. “Topographic slope as a proxy for seismic site conditions and amplification”, Bulletin of the
Seismological Society of America, Vol. 97, pp. 1379-1395.