Embed Size (px)
Citation preview
EFFECTS OF STORAGE TEMPERATURE AND RELATIVE HUMIDITY ON THE PROPERTIES OF EGG WHITE PROTEIN-BASED FILMS OBTAINED THROUGH
EXTRUSION AND CALENDERING PROCESSES
By
Maruscha Pfeiffer Pranata
A THESIS
Submitted to Michigan State University
in partial fulfillment of the requirements for the degree of
Packaging—Master of Science
2014
ABSTRACT
EFFECTS OF STORAGE TEMPERATURE AND RELATIVE HUMIDITY ON THE PROPERTIES OF EGG WHITE PROTEIN-BASED FILMS OBTAINED THROUGH
EXTRUSION AND CALENDERING PROCESSES
by
Maruscha Pfeiffer Pranata
The goals of this study were: (1) to identify the conditions for egg white protein (EWP) film
making through extrusion and calendering processes for industry adaptation, and (2) to
investigate the current possibilities of the EWP film as a food packaging material by inquiring
into the effect of surrounding environment on its properties and by comparing EWP film with
PLA. The necessary processing conditions of extrusion and calendering to obtain EWP films
were identified and led to transparent (90-94% at 600nm), continuous, and uniform films with a
thickness of 110μm. Exposing the films to combinations of temperature (4 or 23°C) and RH (0,
55, or 95%) showed that temperature, RH, and their interactions have significant effect on the
properties of EWP films. At 23°C, the film has higher transmittance and lower water and ethanol
permeability than at 4°C (p≤0.05). The decrease in RH increases the flexibility and thickness but
it decreases the water permeability and transmittance of the films significantly (p≤0.05). The
films became more reddish and less yellowish at 55%RH. Neither temperature nor RH had an
effect on the tensile strength, first second-order transmission temperature, fungal resistance and
lightness of the films. Comparison of EWP films with PLA films shows that both materials have
similar optical properties but different tensile and barrier properties. The EWP films reduced the
growth of P. pinophilum and A. niger after 48 hours at 100%RH and 23°C. This study proves the
feasibility of producing EWP films using the most common filmmaking processing technology
and shows that EWP film can be used for specific food packaging applications.
ACKNOWLEDGMENTS
First and foremost, I would like to offer my sincerest gratitude to my major advisor, Dr.
Eva Almenar, who introduced me to this topic and who has provided me with guidance and
support from the start. I attribute the completion of this thesis and my Masters study to her
encouragement and effort.
I am also extremely indebted to my committee members; Dr. Laurent Matuana, who
has always been very generous with his time, and Dr. Perry Ng who has always been very
attentive throughout the process. I appreciate their understandings and their insightful comments.
I owe a special gratitude to Dr. Jaime González-Buesa, who has been an invaluable
friend and mentor. His patience, enthusiasms, and immense knowledge enabled me to complete
my research successfully.
Extended gratitude is expressed to the students in Dr. Almenar’s research group who
have shared this journey with me. I would also like to thank fellow graduate students and the
faculty/staff at the School of Packaging who have helped me out by offering their knowledge and
supports throughout my graduate program.
A thank you is extended to the Michigan State University School of Packaging for
awarding me a graduate fellowship that helped fund my graduate program.
Finally, I would like to thank my family for their love and support. Thanks to my parents
for giving me the opportunity to study in the other side of the world. Thanks to my brother for
being my reliable companion, and thanks to my sister for her words of encouragement.
iii
TABLE OF CONTENTS
LIST OF TABLES ......................................................................................................................... vi
LIST OF FIGURES ...................................................................................................................... vii
1. INTRODUCTION .......................................................................................................................1
2. LITERATURE REVIEW ............................................................................................................3 2.1. Packaging materials for food products ..............................................................................3 2.2. Petroleum-based materials ................................................................................................3 2.3. Bio-based materials (bioplastics) ......................................................................................3 2.4. Protein-based bioplastics ...................................................................................................4 2.5. Egg white protein (EWP)-based bioplastic .......................................................................5
2.5.1. Casting ....................................................................................................................5 2.5.2. Compression molding .............................................................................................5 2.5.3. Injection molding ....................................................................................................5 2.5.4. Extrusion .................................................................................................................6
2.6. Potential of EWP bioplastic as food packaging material ..................................................6 2.7. Effect of temperature and relative humidity on protein-based bioplastics properties ......6
3. CHARACTERIZATION OF EGG WHITE PROTEIN-BASED FILMS OBTAINED THROUGH EXTRUSION AND CALENDERING PROCESSESS ..............................................8
3.1. Materials and methods .......................................................................................................8 3.1.1. Materials .................................................................................................................8 3.1.2. Preparation of EWP films .......................................................................................8 3.1.3. Storage conditions ...................................................................................................9 3.1.4. EWP film characterization ....................................................................................10
3.1.4.1 Thickness determination ............................................................................10 3.1.4.2. Thermal characterization ..........................................................................10
3.1.4.2.1. Differential scanning calorimetry ..............................................10 3.1.4.2.2. Thermogravimetric analyses ......................................................10
3.1.4.3. Mechanical characterization .....................................................................11 3.1.4.4. Barrier characterization .............................................................................11
3.1.4.4.1. Water vapor permeability ..........................................................11 3.1.4.4.2. Oxygen permeability ..................................................................12 3.1.4.4.3. Ethanol permeability ..................................................................13
3.1.4.5. Optical characterization ............................................................................13 3.1.4.5.1. Color ..........................................................................................14 3.1.4.5.2. Transmittance .............................................................................14
3.1.4.6. Fungal resistance .......................................................................................14 3.1.4.7. Statistical analysis .....................................................................................15
3.2. Results and discussions ...................................................................................................15 3.2.1. Extrusion and calendering processing conditions for EWP film development ...15
iv
3.2.2. Thickness of EWP films .......................................................................................17 3.2.3. Thermal properties of EWP films .........................................................................19 3.2.4. Mechanical properties of EWP films ....................................................................23 3.2.5. Barrier properties of EWP films ...........................................................................26 3.2.6. Optical properties of EWP films ...........................................................................28 3.2.7. Fungal resistance of EWP films ............................................................................30
4. CONCLUSIONS........................................................................................................................32
5. FUTURE WORK .......................................................................................................................33
APPENDIX ....................................................................................................................................34
BIBLIOGRAPHY ..........................................................................................................................41
v
LIST OF TABLES
Table 1: Extrusion and calendaring processing conditions used to obtain EWP films .................16 Table 2: Thickness of EWP films after exposure to different conditioning treatments ................17 Table 3: P values resulting from Univariate ANOVA (SPSS) (*p < 0.05 indicates effect of factor (single or combined (interaction)) on each variable). ....................................................................18 Table 4: First and second second-order transition temperatures of EWP films after exposure to different conditioning treatments. ..................................................................................................20 Table 5: EWP films permeability values for water, oxygen, and ethanol after exposure to different conditioning treatments .......................................................................27 Table 6: Optical properties (color and transmittance) of EWP films after exposure to different conditioning treatments ......................................................................29
vi
LIST OF FIGURES
Figure 1: Preparation of ewp films by extrusion and calendering processes ...................................9 Figure 2: EWP film obtained by extrusion and calendering processes. ........................................16 Figure 3: DSC thermograms of EWP films after exposure to different conditioning treatments ..................................................................................................21 Figure 4: TGA thermograms ((a) derivative weight change and (b) weight loss) of EWP films after exposure to different conditioning treatments ...............................................22 Figure 5: Tensile properties of EWP films after exposure to different conditioning treatments ..................................................................................................................25 Figure 6: The growth area of P. pinophilum and A. niger on EWP films after 48 hours incubation ...............................................................................................................31 Figure 7: Method I of EWP bioplastic extrusion ..........................................................................37 Figure 8: Method II of EWP bioplastic extrusion .........................................................................38 Figure 9: Method III of EWP bioplastic extrusion ........................................................................39
vii
1. INTRODUCTION
Due to the economic and environmental issues surrounding petroleum-based plastics, there
has been an increased pressure in finding more sustainable plastics. This move towards
sustainability has stimulated research in the field of bioplastics. Plant and animal proteins are
readily available and have been proven to be adequate raw materials for bioplastic development
(Hernandez-Izquierdo and Krochta, 2008). Recent studies have shown the potential of egg white
protein (EWP) as raw material for the development of a highly transparent bioplastic (Jerez et
al., 2007; Lee et al., 2013; Martínez et al., 2013; Félix et al., 2014). These studies have focused
on the development of EWP bioplastic by compression molding and injection molding processes.
Despite the importance of the extrusion process, the most common processing method for
plastics, limited information is available on the extrusion of EWP. To our knowledge, there is
only one study related to EWP extrusion and this investigates the use of extrusion to produce
EWP-starch bioplastic (González-Gutiérrez et al., 2011). Therefore, there is no information in
the literature about obtaining EWP bioplastic using extrusion. Furthermore, the combination of
extrusion with other processing methods to obtain EWP film has not yet been reported. Film
making process commonly comprises extrusion and chill roll or calendering. Thus, in this study,
the appropriate extrusion and calendering conditions for the development of EWP films were
determined. Furthermore, the effect of temperature and relative humidity (RH) on the properties
of the developed films was investigated due to the increased attention that bioplastics are
receiving as materials for food packaging applications. Most of the published literature
regarding protein-based bioplastics focuses primarily on new approaches for their development
and not quite as much on exploring the potential of these materials for food packaging
applications. The use of this new generation of plastics for such applications requires the
1
understanding of the interactions occurring between food and material as well as of the effect of
the surrounding environment. This understanding is needed since these interactions result in
changes in the packaging material (e.g. permeability, thermal properties, mechanical properties)
and consequently, in changes in the quality and safety of the food product (e.g. flavor, texture,
weight loss, microbial growth).
Recognizing the lack of knowledge in the two above-mentioned areas, the goals of this study
were: (1) to identify the conditions for EWP film making through extrusion and calendering
processes, and (2) to investigate the current possibilities and limitations of EWP films as
food packaging materials by inquiring into the effect of both temperature and RH on the thermal,
mechanical, barrier (oxygen, water vapor and ethanol) and optical properties as well as on the
fungal resistance of the films; and by comparing EWP films to the most commonly used
bioplastic in food packaging, poly(lactic acid) (PLA).
2
2. LITERATURE REVIEW
2.1. Packaging materials for food products
The principal functions of a packaging material intended for use in food packaging is to
contain the food, protect it from the environment, and maintain its quality (Coles et al., 2003).
Food and beverage plastic packaging contribute 70% of the plastic packaging market in the
United States (Comstock et al., 2004). The two categories of plastics used for food packaging
purposes are petroleum-based plastic and bioplastic.
2.2. Petroleum-based materials
The plastic packaging materials that have been used in the food industry for the past 50 years
are polyethylene or co-polymer based (Cutter, 2006). They are safe, inexpensive, versatile, and
flexible (Tice et al., 2003). In 2012, only 9% of all plastic packaging materials were recovered
to be recycled, which means the majority of the plastic materials were not reused (Plastics,
2014). The presence of this plastic waste is problematic because once it is dumped in a landfill it
will not degrade and will last for an unknown, but certainly long period of time. Rising
petroleum costs also generate concern about the efficient production of plastic packaging
materials (Weber et al., 2002). Given the increasing rate at which petroleum is being consumed
by industry, there are fears that the supplies will dwindle in the future (Khare and Deshmukh,
2006).
2.3. Bio-based materials (bioplastics)
Due to the issues surrounding the petroleum-based plastics and the growing consumer
demands for recyclable or natural packaging materials (Koutsimanis et al., 2012), the pressure to
find a more sustainable plastic has increased. This move towards sustainability has intensified
research in the field of bioplastics. Bioplastics can be categorized based on their production
3
processes and sources (Comstock et al., 2004). One of the categories is polymer extracted from
biomass, which includes proteins, lipids, and polysaccharides. This type of raw material has
been used as a source of bioplastics for many years (Irissin-Mangata et al., 2001; De Graaf,
2000).
2.4. Protein-based bioplastics
Proteins derived from plants and animals are readily available and are adequate raw materials
for bioplastic development (Gennadios, 1996). Various studies have been conducted on the
manufacturing of bioplastic based on vegetable proteins (corn, wheat gluten, soy proteins, etc.)
and animal proteins (milk proteins, collagen, gelatin, etc.) (Pommet et al., 2003; Cuq et al.,
1998). According to Domenek et al. (2004), the biodegradation rate of protein-based bioplastics
is one of the highest among fast-degrading polymers. The use of proteins is a promising way to
produce biodegradable materials due to their chemical structure. Protein consists of hundreds of
amino acids that are able to form weak and strong bonds; therefore, a large range of functional
properties of protein-based materials can be obtained (Domenek et al., 2004).
Processing protein-based materials is not an easy task as the softening temperature of protein
often lies above their degradation temperature; thus the use of plasticizers is required to increase
the range of processing temperatures (Verbeek and Van den Berg, 2010). Two plasticizers that
have been widely used to extrude bioplastics; water and glycerol. Water is considered a natural
plasticizer of proteins and has been used widely in protein extrusion (Verbeek and Van den Berg,
2010). Glycerol is also an ideal plasticizer due to its small molecular size, which allows it to
interpose within the protein chains and modify the forces holding the chain together (Sharmā et
al., 2011).
4
2.5. Egg white protein (EWP)-based bioplastics
Recent studies have shown the potential of EWP as raw material for the development of a
highly transparent bioplastic (Gennadios et al., 1996; Jerez et al., 2007; Lee et al., 2013).
Researchers have investigated various methods of processing EWP-based bioplastic. The
different processing methods are presented below:
2.5.1. Casting
Film formation by casting can be accomplished easily due to the water solubility of EWP.
Gennadios (1996) and Ko et al. (2001) developed an egg albumen-based film by mixing egg
albumen with glycerol. The solution was then heated to denature the protein and to form the film
matrix. After heating, the solution was poured into a container and air-dried in a laminar flow
hood.
2.5.2. Compression molding
Lee et al. (2013) successfully prepared egg white protein-based sheets with various water
activity and glycerol contents by a thermo-mechanical procedure using compression-molding
equipment. González-Gutiérrez et al. (2011) completed similar studies, applying thermo-
mechanical procedures to a mixture of EWP and starch. Martinez et al. (2013) focused on
compression of EWP sheets containing some antimicrobial compounds.
2.5.3. Injection molding
Félix et al. (2014) successfully obtained albumen/soy protein-based bioplastics through an
injection molding process. The authors utilized 100% albumen, 100% soy protein, and mixtures
containing varying ratios of the two components.
5
2.5.4. Extrusion
Despite the practicality of the extrusion process, limited information is available on the
extrusion of EWP bioplastics. To our knowledge, the only article on the use of extrusion for
producing bioplastic that involves EWP was published by González-Gutiérrez et al. (2011). The
researchers created a mixture of albumen, starch, and glycerol, followed by conditioning and
extrusion. The authors also developed a procedure that involved a combination of extrusion and
compression molding (González-Gutiérrez et al., 2011).
2.6. Potential of EWP Bioplastics as food packaging material
Most of the published articles focused primarily on new approaches in the development of bio-
based materials, and not quite as much on the compatibility of the materials to be used in food
packaging instances. There is only one study that suggested a potential for EWP bioplastics to
be used as food packaging material which demonstrated the antimicrobial activity of compressed
EWP bioplastics when mixed with formic acid or oregano essential oil (Martinez et al., 2013).
There is a lack of information regarding EWP plastics with regards to its interaction with the
storage environment.
2.7. Effect of temperature and relative humidity on protein-based bioplastic properties
The hygroscopic nature of protein-based bioplastic is well known. Thus, plenty of studies have
investigated the effects of temperature and relative humidity on the properties of bioplastics.
Gontard et al. (1996) studied the effect of temperature and relative humidites on the barrier
properties of protein-based film. The authors suggested at low relative humidity (RH) and room
condition (25°C), an edible wheat gluten film presents very low oxygen and carbon dioxide
permeabilities. The permeability increases exponentially once the RH is increased (Gontard et
al., 1996). To our knowledge, the permeability values of EWP bioplastics have not been
6
presented yet. The permeability value is a significant information in exploring the potentiality of
EWP bioplastics in packaging a specific food product.
7
3. CHARACTERIZATION OF EGG WHITE PROTEIN-BASED FILMS OBTAINED THROUGH EXTRUSION AND CALENDERING PROCESSES 3. 1. Materials and Methods
3.1.1. Materials
Spray dried egg white protein (EWP) powder (82.1 ± 0.61% protein, 0.37 ± 0.17% fat,
6.04 ± 0.20% ash, and 3.51 ± 0.22% moisture determined by proximate analysis) was obtained
from Rose Acre Inc. (Seymour, IN, USA). Food grade vegetable glycerin (GLY) was obtained
from Starwest Botanicals (Sacramento, CA, USA). Magnesium nitrate (Mg(NO3)2) and
potassium sulfate (K2SO4) were purchased from Columbus Chemical Industries Inc. (Columbus,
WI, USA). Desiccant was obtained from W.A. Hammond Drierite Co. Ltd. (Xenia, OH, USA).
Ethanol (purity ≥ 99.5%) was obtained from VWR International (Radnor, PA, USA). Potato
dextrose agar was purchased from Sigma-Aldrich Corp. (Saint Louis, MO, USA). Single spore
isolates of Aspergillus niger and Penicillium pinophilum were originally isolated from spoiled
food.
3.1.2. Preparation of EWP films
EWP films were obtained by combining extrusion and calendering processes. Extrusion
was used to obtain EWP extrudates while calendaring was used to flatten these into films. EWP
powder and a mixture of water and glycerol in 2:1:1 ratio were introduced in a co-rotating twin-
screw extruder (Model MP19TC2-25, APV Baker; Grand Rapids, MI, United States) with a
screw speed of 150 rpm using a gravimetric feeder (Model K2V-T20, K-Tron; Pitman, NJ,
United States) and a pump (Model E2 Metripump, Brook Crompton; Hudders Field, England),
respectively. The different zones of the extruder were set to various temperature profiles until
the desired extrudates were obtained. The resulting extrudates were immediately placed between
8
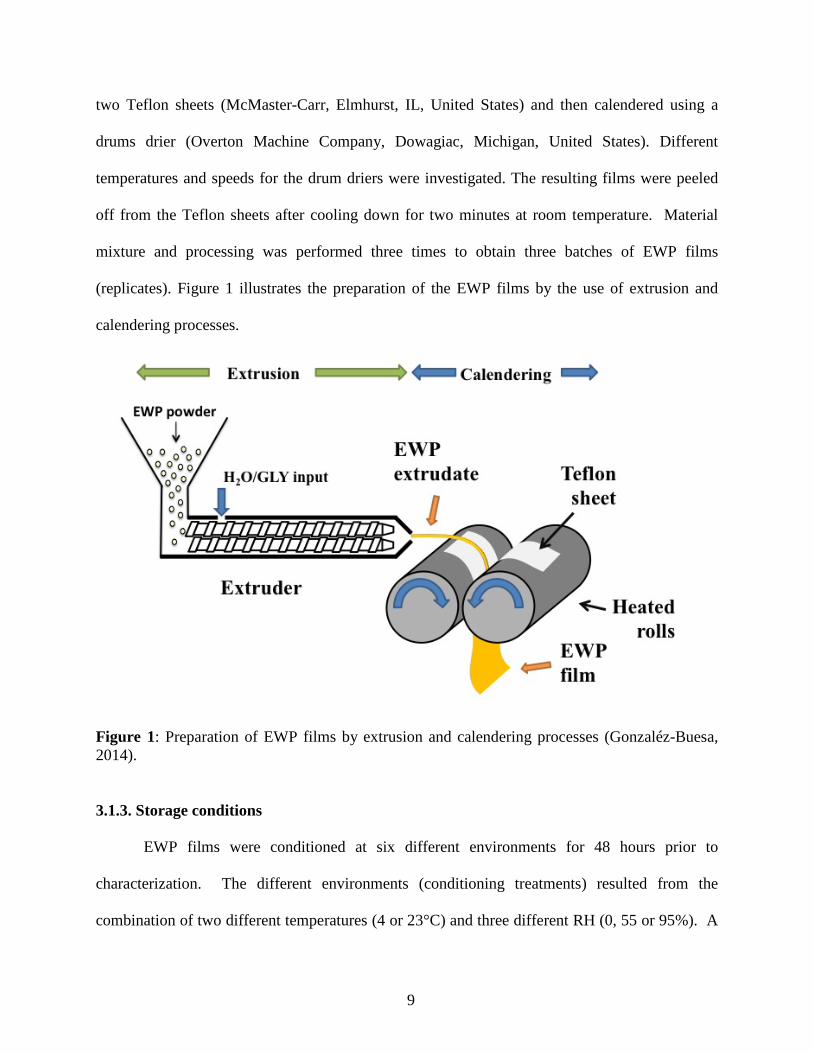
two Teflon sheets (McMaster-Carr, Elmhurst, IL, United States) and then calendered using a
drums drier (Overton Machine Company, Dowagiac, Michigan, United States). Different
temperatures and speeds for the drum driers were investigated. The resulting films were peeled
off from the Teflon sheets after cooling down for two minutes at room temperature. Material
mixture and processing was performed three times to obtain three batches of EWP films
(replicates). Figure 1 illustrates the preparation of the EWP films by the use of extrusion and
calendering processes.
Figure 1: Preparation of EWP films by extrusion and calendering processes (Gonzaléz-Buesa, 2014).
3.1.3. Storage conditions
EWP films were conditioned at six different environments for 48 hours prior to
characterization. The different environments (conditioning treatments) resulted from the
combination of two different temperatures (4 or 23°C) and three different RH (0, 55 or 95%). A
9
constant temperature and humidity room set at 23°C and a walk-in test chamber set at 4 °C were
used to obtain the two temperatures. K2SO4 and Mg(NO3)2 saturated solutions and desiccant
were placed inside buckets with air-tight lids to create environments of 95, 55 and 0% RH,
respectively, at both temperatures except for 55%RH at 23°C since this was the RH at which the
above-mentioned room was set.
3.1.4. EWP film characterization
3.1.4.1. Thickness determination
The thickness of the EWP films after exposure to the different conditioning treatments
was obtained by averaging the measurements from five random film positions obtained using an
electronic digital micrometer (Fowler® 0-1” Digital Counter Micrometer, Port Washington, NY,
USA). The results are expressed in μm.
3.1.4.2. Thermal characterization
3.1.4.2.1. Differential Scanning Calorimetry
The second-order transition temperature of the EWP films after exposure to the different
conditioning treatments was determined by using a differential scanning calorimeter (DSC Q100;
TA Instruments, Newcastle, DE) with a liquid nitrogen cooling system. An amount between 6
and 10 mg of each EWP film was hermetically sealed in an aluminum pan (TA Instruments,
Newcastle, DE, USA), equilibrated to 0°C, and then heated to 300°C at a rate of 30°C/min under
N2 atmosphere. TA analysis software was used to do the data analysis in accordance with the
ASTM Method D3418-12 (ASTM, 2012a). Two samples from each conditioning treatment, each
from a different replicate, were analyzed.
3.1.4.2.2. Thermogravimetric analyses
The decomposition temperature of the EWP films after exposure to the different
10
conditioning treatments was determined using a thermogravimetric analyzer (TGA Q50; TA
Instruments, Newcastle, DE, USA). An amount between 6 and 10 mg of each EWP film was
placed in an aluminum pan (TA Instruments, Newcastle, DE, USA) and then heated from 25 to
600°C at a rate of 30°C/min. The percent weight loss of each sample as a function of temperature
under a nitrogen- air (40–60%) atmosphere was analyzed. Two samples from each conditioning
treatment, each from a different replicate, were analyzed.
3.1.4.3. Mechanical characterization
EWP films were cut into rectangular strips of 0.1m x 0.01m and then exposed to the
different conditioning treatments. The elongation at break (Eb), tensile strength (σmax), and
modulus of elasticity (E) of each strip were measured according to the ASTM Method D882-12
(ASTM, 2012b) using an Instron Universal Testing Machine UTS SFM – 20 (United Calibration
Corporation, Huntington Beach, CA, USA) with a load cell of 453.6kg. A speed of 0.01m/s and
an initial grip separation of 0.05m were used. At least six strips from each of the three replicates
of each conditioning treatment were evaluated.
3.1.4.4. Barrier characterization
3.1.4.4.1. Water vapor permeability
The water vapor transmission rate (WVTR) of the EWP films after exposure to the
different conditioning treatments was measured using a Mocon PERMATRAN® W Model 3/33
Water Permeability Analyzer (Minneapolis, MN, USA) according to the ASTM Method F1249-
13 (ASTM, 2013). Film samples were double-masked with sticky aluminum foil, leaving a
circular uncovered film area of 0.4x10⁻⁴m2. Testing for samples stored at 4°C was performed at
10°C which is the lowest temperature the equipment can reach. The samples stored at 23°C were
11
analyzed at that same temperature. RH was matched with that of the storage conditions (55 or
95%). Water vapor permeability (WVP) determination at 0% RH was not carried out since the
equipment needs a difference of pressure to measure permeability. The WVP (kg.m/ m2.s.Pa) of
the EWP films was calculated using the following equation:
𝑊𝑊𝑊𝑊𝑃𝑃 =𝑊𝑊𝑊𝑊𝑊𝑊𝑊𝑊 × 𝐿𝐿
∆𝑃𝑃
where L is the mean film thickness (m) and ΔP is the partial water vapor pressure difference
(Pa). The permeability of three samples from each conditioning treatment, each from a different
replicate, was measured.
3.1.4.4.2. Oxygen permeability
The oxygen transmission rate (OTR) of the EWP films after exposure to the different
conditioning treatments was measured using a Mocon OX-TRAN® Model 2/21 (Minneapolis,
MN, United States) according to the ASTM Method D3985-05 (ASTM, 2005). Film samples
were double-masked with sticky aluminum foil, leaving a circular uncovered film area of 0.4x10-
4m2. Testing for samples stored at 4°C was performed at 10°C which is the lowest temperature
the equipment can reach. The samples stored at 23°C were analyzed at that same temperature.
RH was matched with that of the storage conditions (0, 55, or 95%). Samples stored at 95%RH
were tested for permeability at 90%RH because this is the highest RH the equipment sensor can
perform. The oxygen permeability (OP) (kg.m/ m2.s.Pa) of the EWP films was calculated using
the following equation:
𝑂𝑂𝑃𝑃 = 𝑂𝑂𝑊𝑊𝑊𝑊 × 𝐿𝐿
∆𝑃𝑃
where L is the mean film thickness (m) and ΔP is the partial oxygen pressure difference (Pa).
The permeability of three samples from each conditioning treatment, each from a different
12
replicate, was measured.
3.1.4.4.3. Ethanol permeability
The ethanol permeation rate of the EWP films was measured using permeation cells
made from poly(methylmethacrylate). The film samples were double-masked with sticky
aluminum foil, leaving a circular uncovered film area of 0.3x10⁻³m2. Cells were filled with 1ml
of ethanol and then placed inside buckets and moved to the chambers at 4 or 23°C. The buckets
were modified by equipping these with inlet-outlet ports that allowed the air from a cylinder to
pass through the bucket and thus, to remove from the bucket headspace the ethanol permeated
from the cells during storage. Precision needle valves were used to maintain a constant airflow
rate of about 200 mL/min. The RH of the bucket headspace was controlled by humidifying the
air of the inlet-port using washing bottles containing K2SO4 and Mg(NO3)2 saturated solutions.
Washing bottles were not used for the experiments at 0%RH. No buckets were used for the
experiment 55%RH-23°C. The weights of the cells were recorded daily using an analytical
balance (OHAUS Corp., Parsippany, NJ, USA). Linear regression-derived slopes of the steady
state (linear) portion of weight loss versus time curves were used to estimate the ethanol
transmission rate (EtOHTR). The ethanol permeability (EtOHP) (kg.m/m2.s.Pa) of the EWP
films was calculated using the following equation:
𝐸𝐸𝐸𝐸𝑂𝑂𝐸𝐸𝑃𝑃 = 𝐸𝐸𝐸𝐸𝑂𝑂𝐸𝐸𝑊𝑊𝑊𝑊 × 𝐿𝐿
∆𝑃𝑃
where L is the mean film thickness (m) and ΔP is the partial ethanol pressure difference (Pa).
The permeability of three samples from each conditioning treatment, each from a different
replicate, was measured.
3.1.4.5. Optical characterization
13
3.1.4.5.1. Color
The color of the EWP films after exposure to the different conditioning treatments was
measured using a Labscan XE colorimeter (Hunter Laboratories, Reston, VA, USA) and
characterized using the CIE L*a*b* system. The variable L* represents lightness ranging from
0% to 100%. The variable a* ranges from green (negative) to red (positive) and variable b*
ranges from blue (negative) to yellow (positive). Five measurements from each replicate from
each conditioning treatment were taken.
3.1.4.5.2. Transmittance
The transmittance (%) of each EWP films after exposure to the different conditioning
treatments was measured using a spectrophotometer (Lambda 25 UV/VIS Spectrometer;
PerkinElmer Instruments, Waltham, MA, USA) equipped with an integrating sphere in the
spectral range from 300 to 850 nm and with a scan speed of 480 nm per minute. The
transmittance values obtained at a wavelength of 600 nm are reported. Five measurements from
each replicate from each conditioning treatment were taken.
3.1.4.6. Fungal resistance
The fungal resistance of the EWP films after exposure to the different conditioning
treatments was measured according to a slightly modified ASTM Method G21-13 (ASTM,
2013b). 2 cm x 2 cm pieces of EWP film were placed on potato dextrose agar in plastic petri
dishes (9-cm diameter). 100μ l-inoculum (1 x 10⁶ spores/mL) of Aspergillus niger and
Penicillium pinophilum was deposited on the surface of the EWP films and the petri dishes were
closed with their lids to avoid external contamination. Culture preparation was performed as
described in Almenar et al. (2007). Petri dishes containing conidial suspensions without the films
14
were used as controls. Controls and treatments were incubated at 23°C and monitored daily until
fungal growth was observed. Once fungal growth was detected, growth of the cultures in both
controls and treatments was evaluated daily by measuring the diameter of the colony on the film
and agar surface. Measurement of diameters was made using a conventional ruler. Because of the
optical transparency of both the agar and Petri dish, these measurements could be made without
problem. One sample from each replicate from each conditioning treatment was evaluated.
3.1.4.7. Statistical analysis
A two-factor completely randomized experimental design was used to study the effects of
temperature (4 or 23°C) and RH (0, 55 or 95% RH) on the thickness and the mechanical, barrier,
and optical properties of the EWP films. Minitab 16 (Minitab Inc., State College, PA, USA) was
used to perform a one-way analysis of variance (ANOVA; Tukey test; p ≤ 0.05) between the
means to determine the effect of temperature and RH on each of the investigated film properties.
SPSS 21 (IBM Corporation, Armonk, NY, USA) was used to perform a two-way ANOVA
(Tukey test; p ≤ 0.05) between the means to determine interactions between temperature and RH.
3. 2. Results and discussions
3.2.1. Extrusion and calendering processing conditions for EWP film development
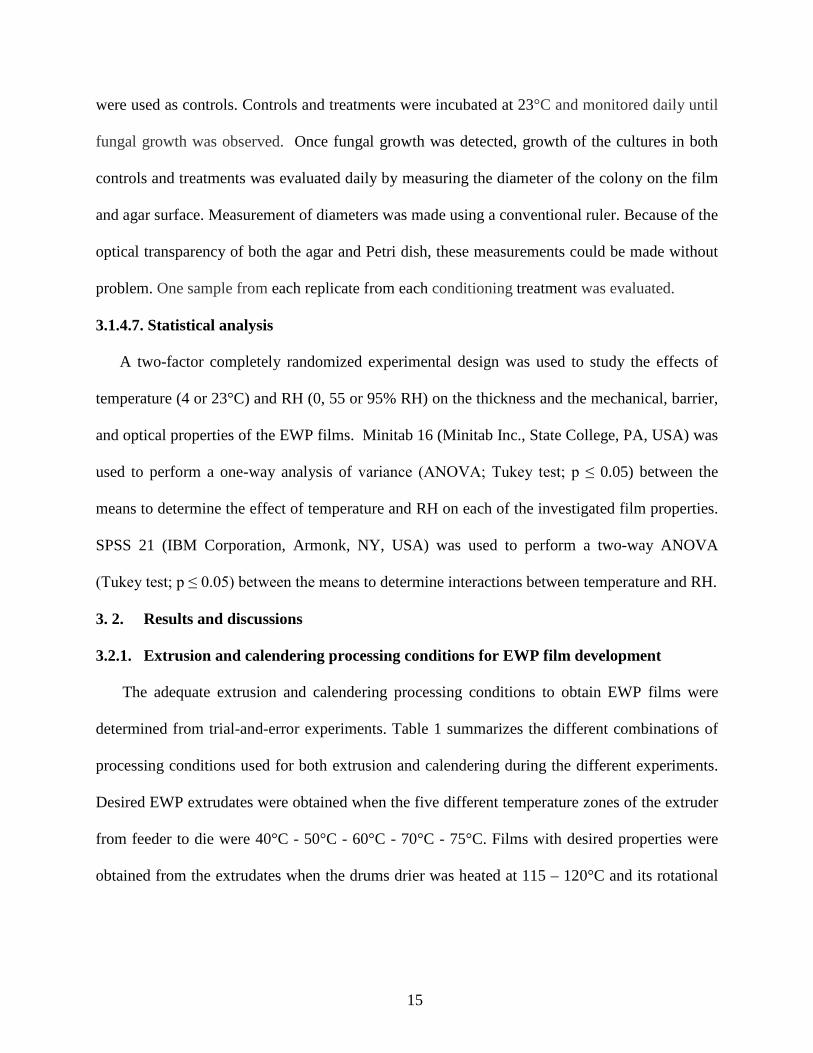
The adequate extrusion and calendering processing conditions to obtain EWP films were
determined from trial-and-error experiments. Table 1 summarizes the different combinations of
processing conditions used for both extrusion and calendering during the different experiments.
Desired EWP extrudates were obtained when the five different temperature zones of the extruder
from feeder to die were 40°C - 50°C - 60°C - 70°C - 75°C. Films with desired properties were
obtained from the extrudates when the drums drier was heated at 115 – 120°C and its rotational
15
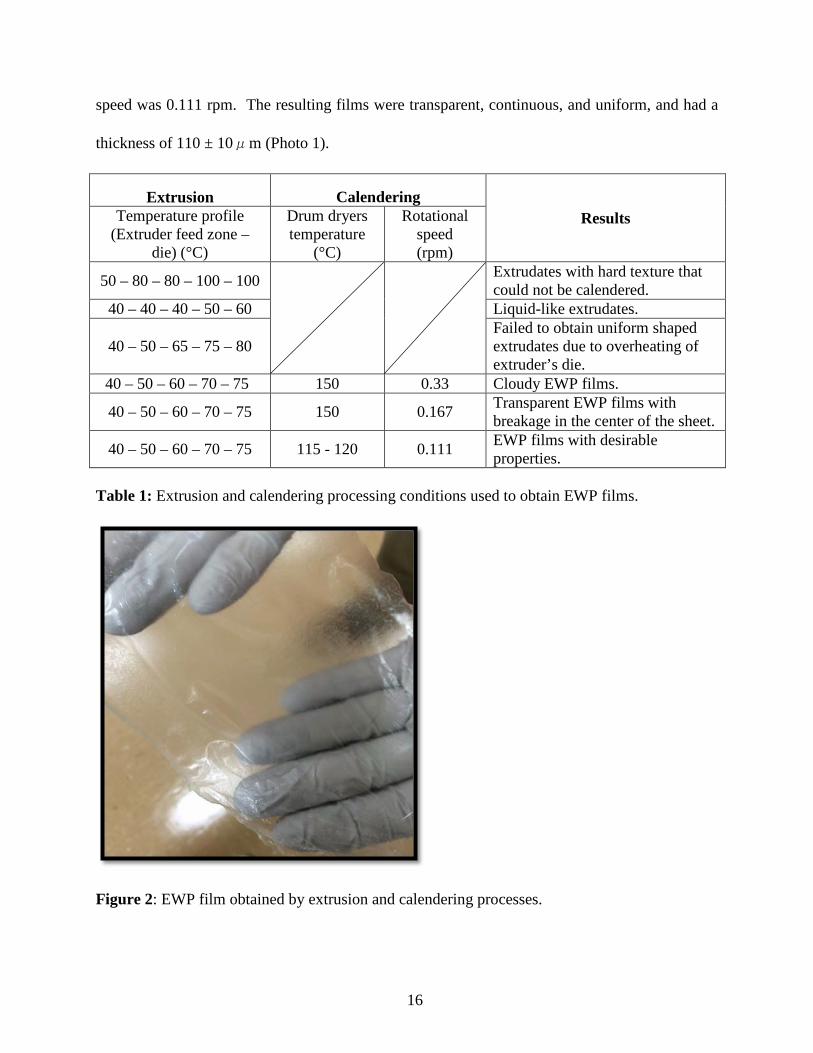
speed was 0.111 rpm. The resulting films were transparent, continuous, and uniform, and had a
thickness of 110 ± 10μm (Photo 1).
Extrusion Calendering Results Temperature profile
(Extruder feed zone – die) (°C)
Drum dryers temperature
(°C)
Rotational speed (rpm)
50 – 80 – 80 – 100 – 100
Extrudates with hard texture that could not be calendered.
40 – 40 – 40 – 50 – 60 Liquid-like extrudates.
40 – 50 – 65 – 75 – 80 Failed to obtain uniform shaped extrudates due to overheating of extruder’s die.
40 – 50 – 60 – 70 – 75 150 0.33 Cloudy EWP films.
40 – 50 – 60 – 70 – 75 150 0.167 Transparent EWP films with breakage in the center of the sheet.
40 – 50 – 60 – 70 – 75 115 - 120 0.111 EWP films with desirable properties.
Table 1: Extrusion and calendering processing conditions used to obtain EWP films.
Figure 2: EWP film obtained by extrusion and calendering processes.
16
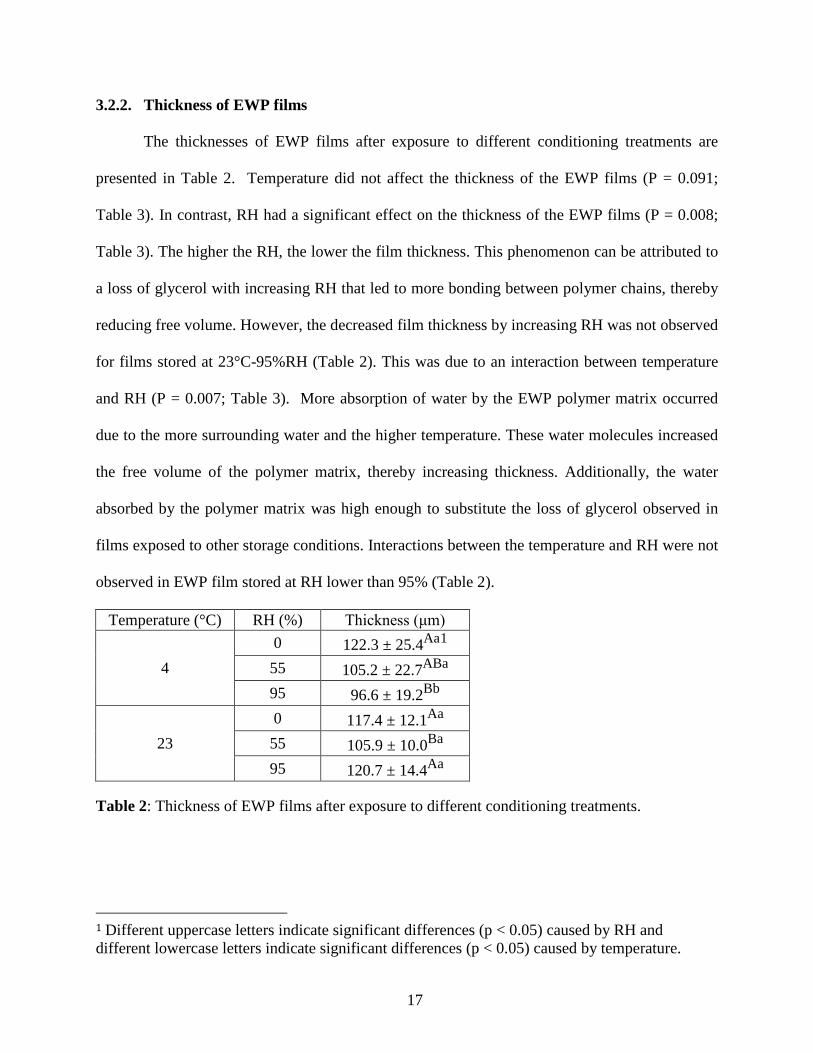
3.2.2. Thickness of EWP films
The thicknesses of EWP films after exposure to different conditioning treatments are
presented in Table 2. Temperature did not affect the thickness of the EWP films (P = 0.091;
Table 3). In contrast, RH had a significant effect on the thickness of the EWP films (P = 0.008;
Table 3). The higher the RH, the lower the film thickness. This phenomenon can be attributed to
a loss of glycerol with increasing RH that led to more bonding between polymer chains, thereby
reducing free volume. However, the decreased film thickness by increasing RH was not observed
for films stored at 23°C-95%RH (Table 2). This was due to an interaction between temperature
and RH (P = 0.007; Table 3). More absorption of water by the EWP polymer matrix occurred
due to the more surrounding water and the higher temperature. These water molecules increased
the free volume of the polymer matrix, thereby increasing thickness. Additionally, the water
absorbed by the polymer matrix was high enough to substitute the loss of glycerol observed in
films exposed to other storage conditions. Interactions between the temperature and RH were not
observed in EWP film stored at RH lower than 95% (Table 2).
Temperature (°C) RH (%) Thickness (μm)
4 0 122.3 ± 25.4Aa1 55 105.2 ± 22.7ABa 95 96.6 ± 19.2Bb
23 0 117.4 ± 12.1Aa 55 105.9 ± 10.0Ba 95 120.7 ± 14.4Aa
Table 2: Thickness of EWP films after exposure to different conditioning treatments.
1 Different uppercase letters indicate significant differences (p < 0.05) caused by RH and different lowercase letters indicate significant differences (p < 0.05) caused by temperature.
17
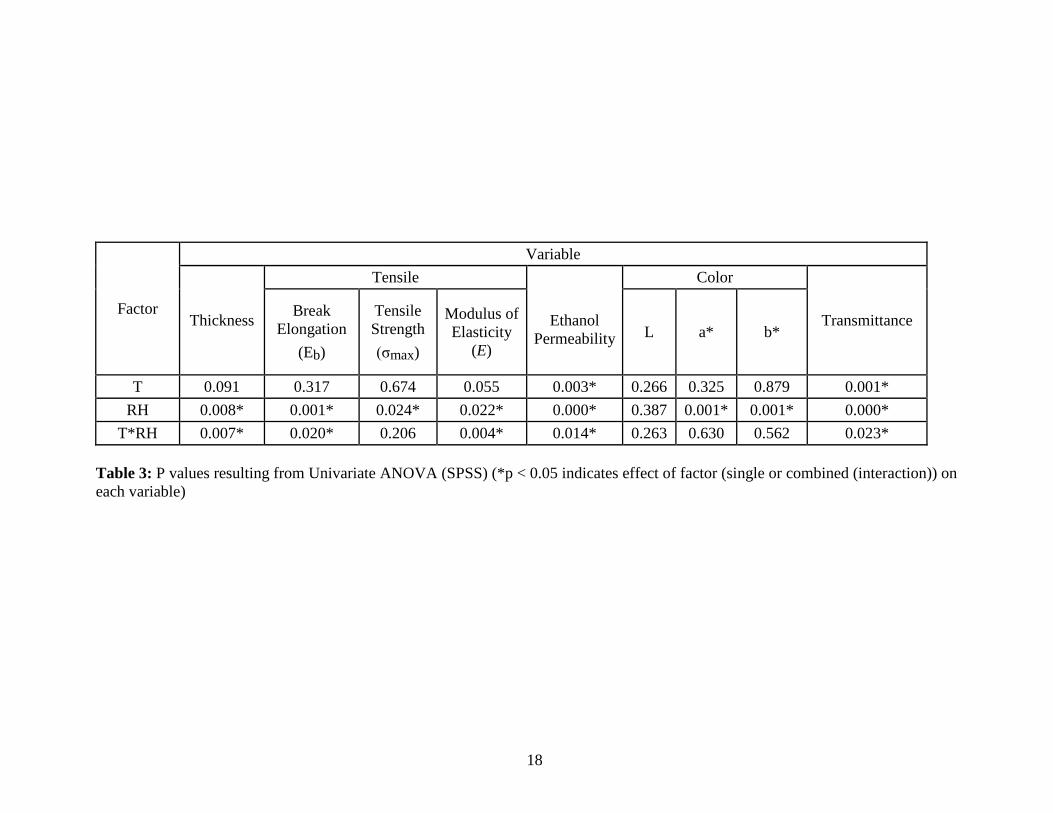
Factor
Variable
Thickness
Tensile
Ethanol Permeability
Color
Transmittance Break Elongation
(Eb)
Tensile Strength (σmax)
Modulus of Elasticity
(E) L a* b*
T 0.091 0.317 0.674 0.055 0.003* 0.266 0.325 0.879 0.001* RH 0.008* 0.001* 0.024* 0.022* 0.000* 0.387 0.001* 0.001* 0.000*
T*RH 0.007* 0.020* 0.206 0.004* 0.014* 0.263 0.630 0.562 0.023* Table 3: P values resulting from Univariate ANOVA (SPSS) (*p < 0.05 indicates effect of factor (single or combined (interaction)) on each variable)
18
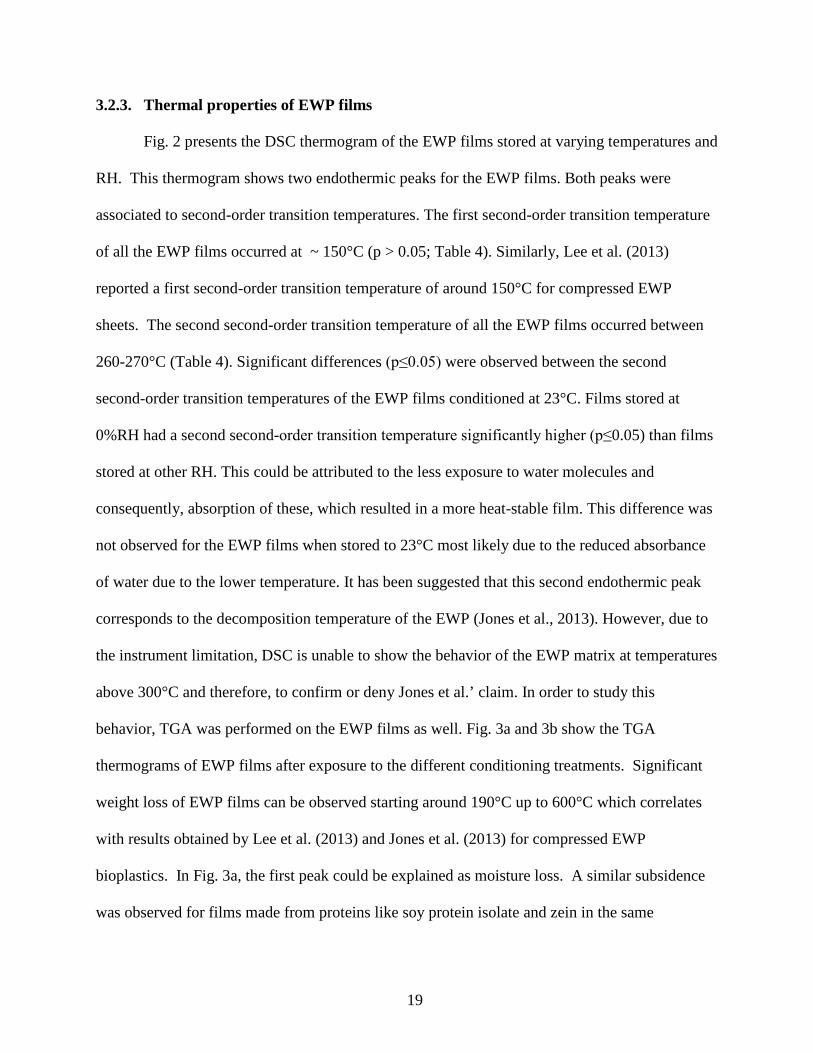
3.2.3. Thermal properties of EWP films
Fig. 2 presents the DSC thermogram of the EWP films stored at varying temperatures and
RH. This thermogram shows two endothermic peaks for the EWP films. Both peaks were
associated to second-order transition temperatures. The first second-order transition temperature
of all the EWP films occurred at ~ 150°C (p > 0.05; Table 4). Similarly, Lee et al. (2013)
reported a first second-order transition temperature of around 150°C for compressed EWP
sheets. The second second-order transition temperature of all the EWP films occurred between
260-270°C (Table 4). Significant differences (p≤0.05) were observed between the second
second-order transition temperatures of the EWP films conditioned at 23°C. Films stored at
0%RH had a second second-order transition temperature significantly higher (p≤0.05) than films
stored at other RH. This could be attributed to the less exposure to water molecules and
consequently, absorption of these, which resulted in a more heat-stable film. This difference was
not observed for the EWP films when stored to 23°C most likely due to the reduced absorbance
of water due to the lower temperature. It has been suggested that this second endothermic peak
corresponds to the decomposition temperature of the EWP (Jones et al., 2013). However, due to
the instrument limitation, DSC is unable to show the behavior of the EWP matrix at temperatures
above 300°C and therefore, to confirm or deny Jones et al.’ claim. In order to study this
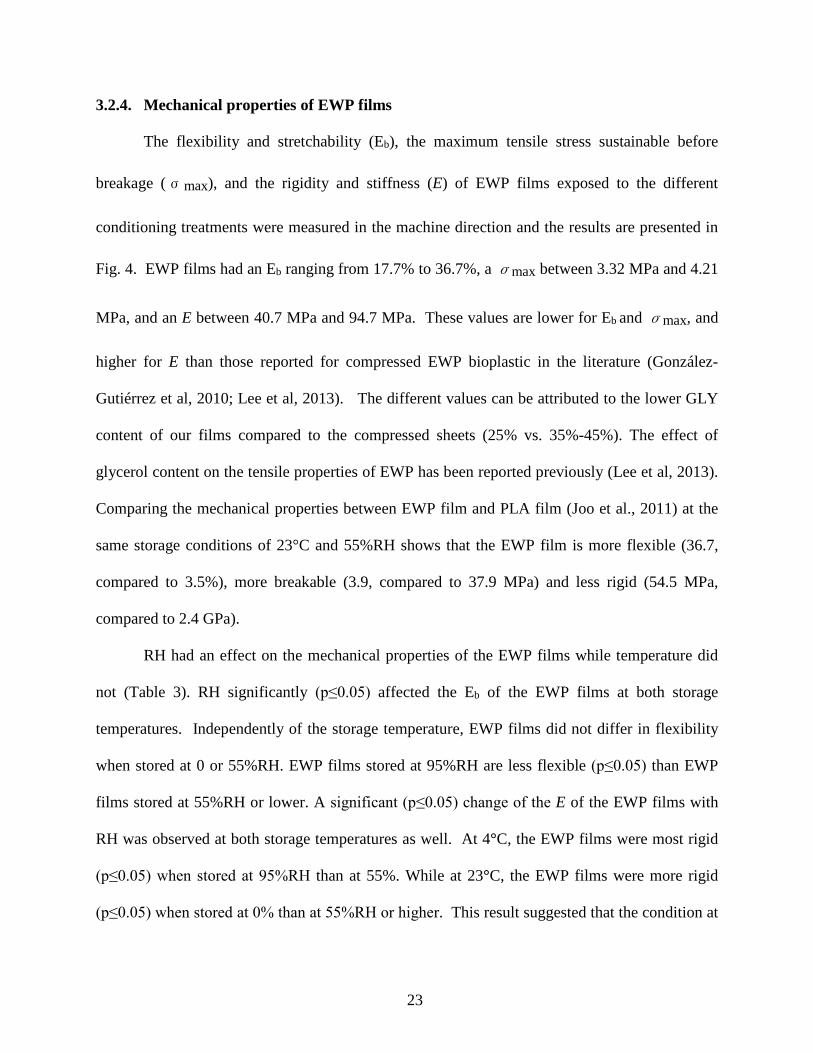
behavior, TGA was performed on the EWP films as well. Fig. 3a and 3b show the TGA
thermograms of EWP films after exposure to the different conditioning treatments. Significant
weight loss of EWP films can be observed starting around 190°C up to 600°C which correlates
with results obtained by Lee et al. (2013) and Jones et al. (2013) for compressed EWP
bioplastics. In Fig. 3a, the first peak could be explained as moisture loss. A similar subsidence
was observed for films made from proteins like soy protein isolate and zein in the same
19

temperature range and this was reported to be very likely due to the loss of moisture (Ogale &
Cunningham, 2000; Oliviero et al., 2010). The peaks starting around 190°C to 400°C can be
explained as the decomposition of glycerol and the breakage of bonds between EWP chains. A
complete breakdown or decomposition of EWP films can be seen started around 500°C until
around 580°C where the weight percentage of EWP films dropped to 0%. The decomposition
temperature of EWP by itself is 136.5°C ± 3°C (Sharma, 2008). Its decomposition temperature
shifted to a higher temperature after processing due to absorption of moisture and reorganization
in the polymer matrix due to the presence of GLY (Chen et al., 2005).
Higher peaks around 275-300°C are observed for films exposed to 55 and 95% RH at
23°C (Fig. 3a). These peaks indicates that breakage of polymer chains occurred earlier in these
samples This phenomenon could be attributed to the films being exposed to more water
molecules at higher temperature and consequently resulted in non-bonded water. Non-bonded
water has been reported as the reason for the faster decomposition rate of other bio-based
polymers like PLA when blended with modified starch (Joo et al., 2011). These results verify
that the significant differences shown in Table 4 for the EWP films stored at 23°C were caused
by differences in water content.
Temperature (°C) RH (%) First second-order
transition temperature (°C) Second second-order
transition temperature (°C)
4 0 147.7 ± 5.4ns 261.0 ± 2.3Aa1
55 143.3 ± 0.5ns 264.9 ± 2.6Aa 95 139.4 ± 2.5ns 267.7 ± 4.7Aa
23 0 128.2 ± 17ns 265.9 ± 0.1Aa 55 148.5± 3.5ns 260.4 ± 0.8 Ba 95 150.0 ± 3.5ns 259.7 ± 1.9 Ba
Table 4: First and second second-order transition temperatures of EWP films after exposure to different conditioning treatments.
20
Figure 3: DSC thermograms of EWP films after exposure to different conditioning treatments.
21
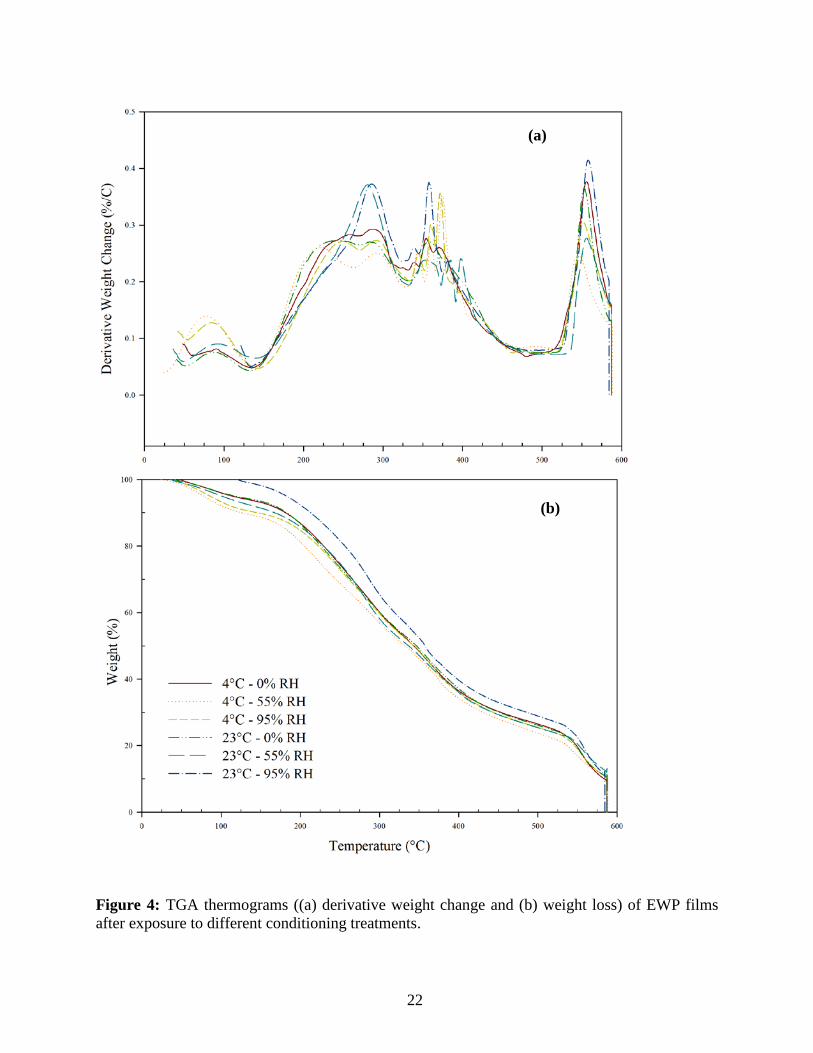
Figure 4: TGA thermograms ((a) derivative weight change and (b) weight loss) of EWP films after exposure to different conditioning treatments.
(a)
(b)
22
3.2.4. Mechanical properties of EWP films
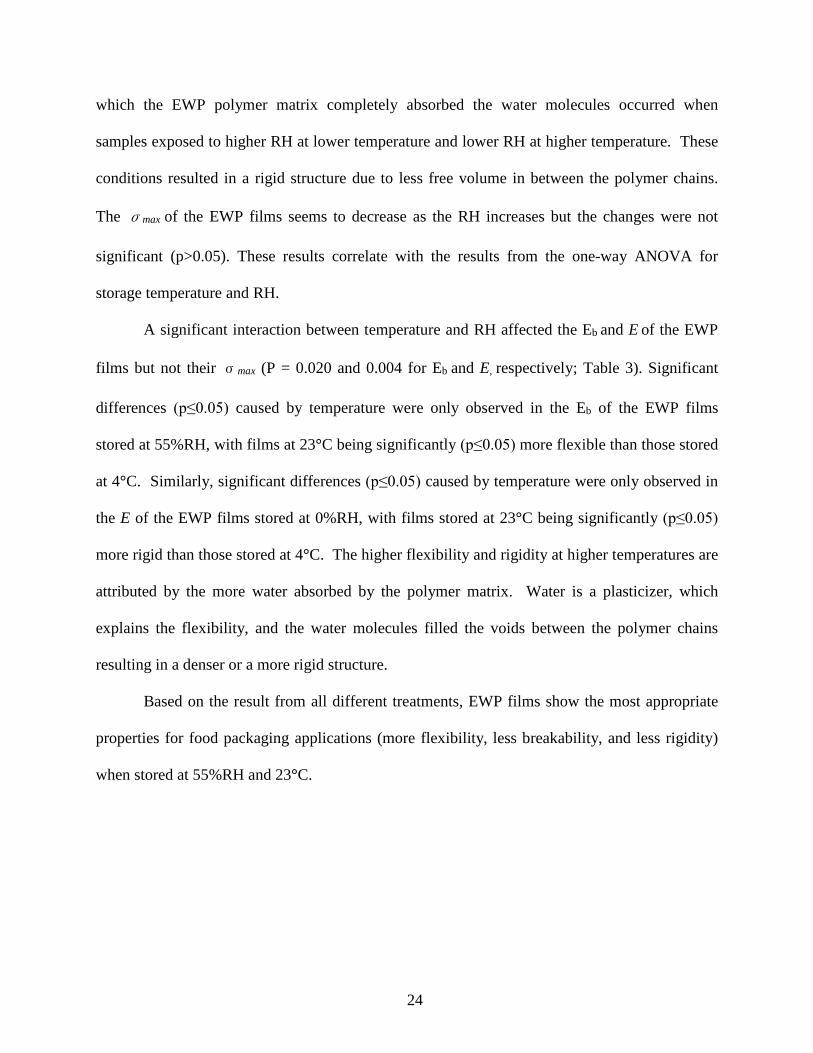
The flexibility and stretchability (Eb), the maximum tensile stress sustainable before
breakage (σmax), and the rigidity and stiffness (E) of EWP films exposed to the different
conditioning treatments were measured in the machine direction and the results are presented in
Fig. 4. EWP films had an Eb ranging from 17.7% to 36.7%, a σmax between 3.32 MPa and 4.21
MPa, and an E between 40.7 MPa and 94.7 MPa. These values are lower for Eb and σmax, and
higher for E than those reported for compressed EWP bioplastic in the literature (González-
Gutiérrez et al, 2010; Lee et al, 2013). The different values can be attributed to the lower GLY
content of our films compared to the compressed sheets (25% vs. 35%-45%). The effect of
glycerol content on the tensile properties of EWP has been reported previously (Lee et al, 2013).
Comparing the mechanical properties between EWP film and PLA film (Joo et al., 2011) at the
same storage conditions of 23°C and 55%RH shows that the EWP film is more flexible (36.7,
compared to 3.5%), more breakable (3.9, compared to 37.9 MPa) and less rigid (54.5 MPa,
compared to 2.4 GPa).
RH had an effect on the mechanical properties of the EWP films while temperature did
not (Table 3). RH significantly (p≤0.05) affected the Eb of the EWP films at both storage
temperatures. Independently of the storage temperature, EWP films did not differ in flexibility
when stored at 0 or 55%RH. EWP films stored at 95%RH are less flexible (p≤0.05) than EWP
films stored at 55%RH or lower. A significant (p≤0.05) change of the E of the EWP films with
RH was observed at both storage temperatures as well. At 4°C, the EWP films were most rigid
(p≤0.05) when stored at 95%RH than at 55%. While at 23°C, the EWP films were more rigid
(p≤0.05) when stored at 0% than at 55%RH or higher. This result suggested that the condition at
23
which the EWP polymer matrix completely absorbed the water molecules occurred when
samples exposed to higher RH at lower temperature and lower RH at higher temperature. These
conditions resulted in a rigid structure due to less free volume in between the polymer chains.
The σmax of the EWP films seems to decrease as the RH increases but the changes were not
significant (p>0.05). These results correlate with the results from the one-way ANOVA for
storage temperature and RH.
A significant interaction between temperature and RH affected the Eb and E of the EWP
films but not their σmax (P = 0.020 and 0.004 for Eb and E, respectively; Table 3). Significant
differences (p≤0.05) caused by temperature were only observed in the Eb of the EWP films
stored at 55%RH, with films at 23°C being significantly (p≤0.05) more flexible than those stored
at 4°C. Similarly, significant differences (p≤0.05) caused by temperature were only observed in
the E of the EWP films stored at 0%RH, with films stored at 23°C being significantly (p≤0.05)
more rigid than those stored at 4°C. The higher flexibility and rigidity at higher temperatures are
attributed by the more water absorbed by the polymer matrix. Water is a plasticizer, which
explains the flexibility, and the water molecules filled the voids between the polymer chains
resulting in a denser or a more rigid structure.
Based on the result from all different treatments, EWP films show the most appropriate
properties for food packaging applications (more flexibility, less breakability, and less rigidity)
when stored at 55%RH and 23°C.
24
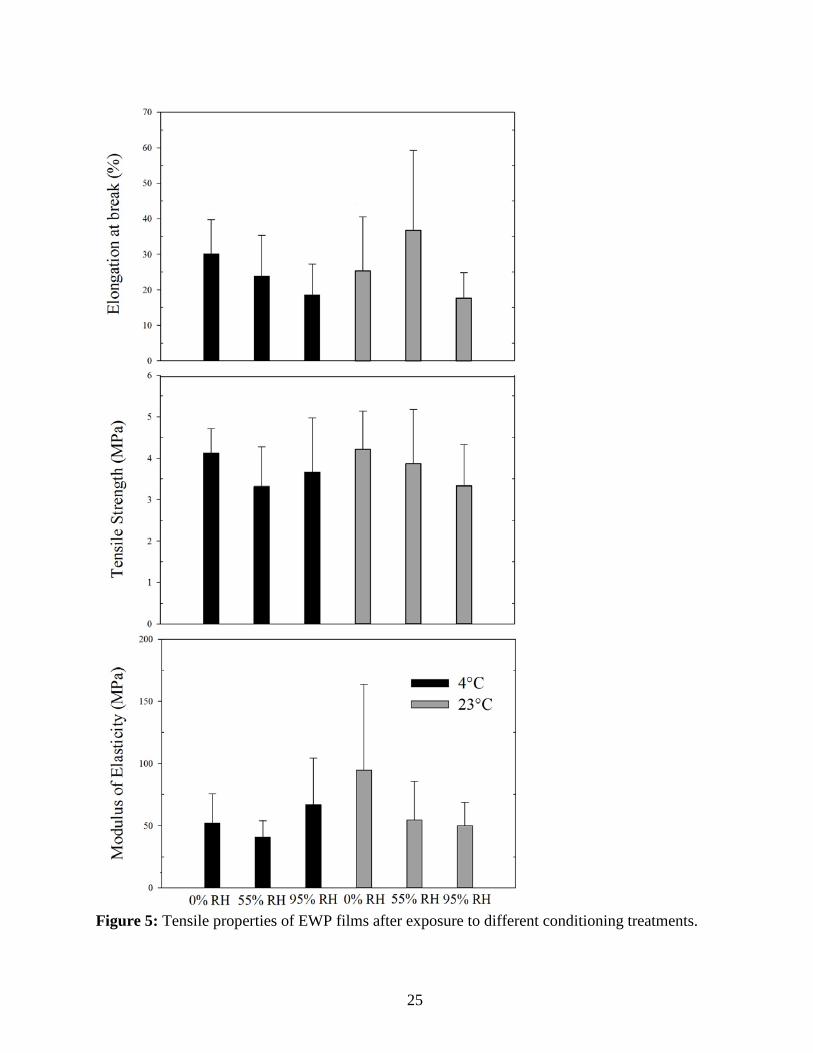
Figure 5: Tensile properties of EWP films after exposure to different conditioning treatments.
25
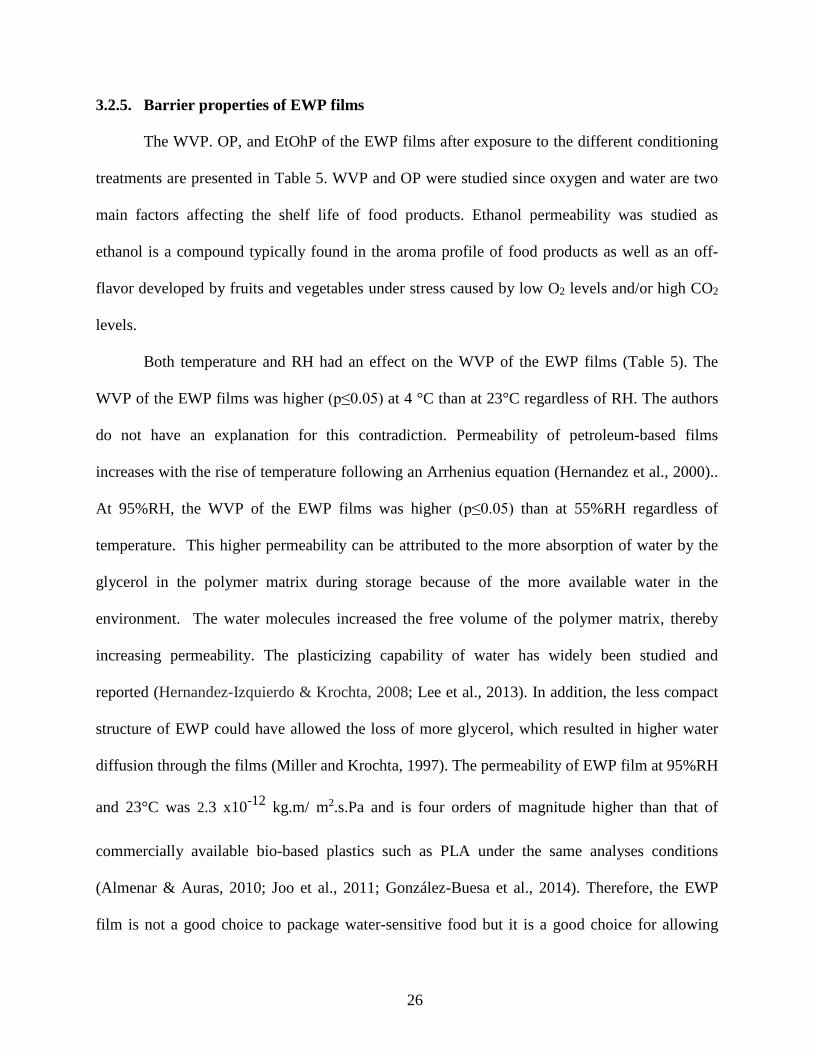
3.2.5. Barrier properties of EWP films
The WVP. OP, and EtOhP of the EWP films after exposure to the different conditioning
treatments are presented in Table 5. WVP and OP were studied since oxygen and water are two
main factors affecting the shelf life of food products. Ethanol permeability was studied as
ethanol is a compound typically found in the aroma profile of food products as well as an off-
flavor developed by fruits and vegetables under stress caused by low O2 levels and/or high CO2
levels.
Both temperature and RH had an effect on the WVP of the EWP films (Table 5). The
WVP of the EWP films was higher (p≤0.05) at 4 °C than at 23°C regardless of RH. The authors
do not have an explanation for this contradiction. Permeability of petroleum-based films
increases with the rise of temperature following an Arrhenius equation (Hernandez et al., 2000)..
At 95%RH, the WVP of the EWP films was higher (p≤0.05) than at 55%RH regardless of
temperature. This higher permeability can be attributed to the more absorption of water by the
glycerol in the polymer matrix during storage because of the more available water in the
environment. The water molecules increased the free volume of the polymer matrix, thereby
increasing permeability. The plasticizing capability of water has widely been studied and
reported (Hernandez-Izquierdo & Krochta, 2008; Lee et al., 2013). In addition, the less compact
structure of EWP could have allowed the loss of more glycerol, which resulted in higher water
diffusion through the films (Miller and Krochta, 1997). The permeability of EWP film at 95%RH
and 23°C was 2.3 x10⁻¹² kg.m/ m2.s.Pa and is four orders of magnitude higher than that of
commercially available bio-based plastics such as PLA under the same analyses conditions
(Almenar & Auras, 2010; Joo et al., 2011; González-Buesa et al., 2014). Therefore, the EWP
film is not a good choice to package water-sensitive food but it is a good choice for allowing
26
water to scape from the package avoiding condensation issues in packaged non water-sensitive
food products. Both temperature and RH also had a significant effect on the OP of the EWP
films. Significant differences in OP resulting from temperature and RH were observed in the
EWP films stored at higher RH. The increase of OP as the temperature increases was expected,
which correlates with Arrhenius equation. The increase of OP as the RH increases was due to
the plasticizing effect of water as mentioned previously. The OP of the EWP film at 0%RH and
23°C was 0.26 x 10⁻¹⁸ kg.m/ m2.s.Pa, which is in the same range as that of the PLA film under
the same conditions (5.67 x 10⁻¹⁸ kg.m/ m2.s.Pa) (González-Buesa et al., 2014). This finding
suggested that the EWP film would work as well as the PLA film for food packaging
applications where protection to avoid oxidation is needed.
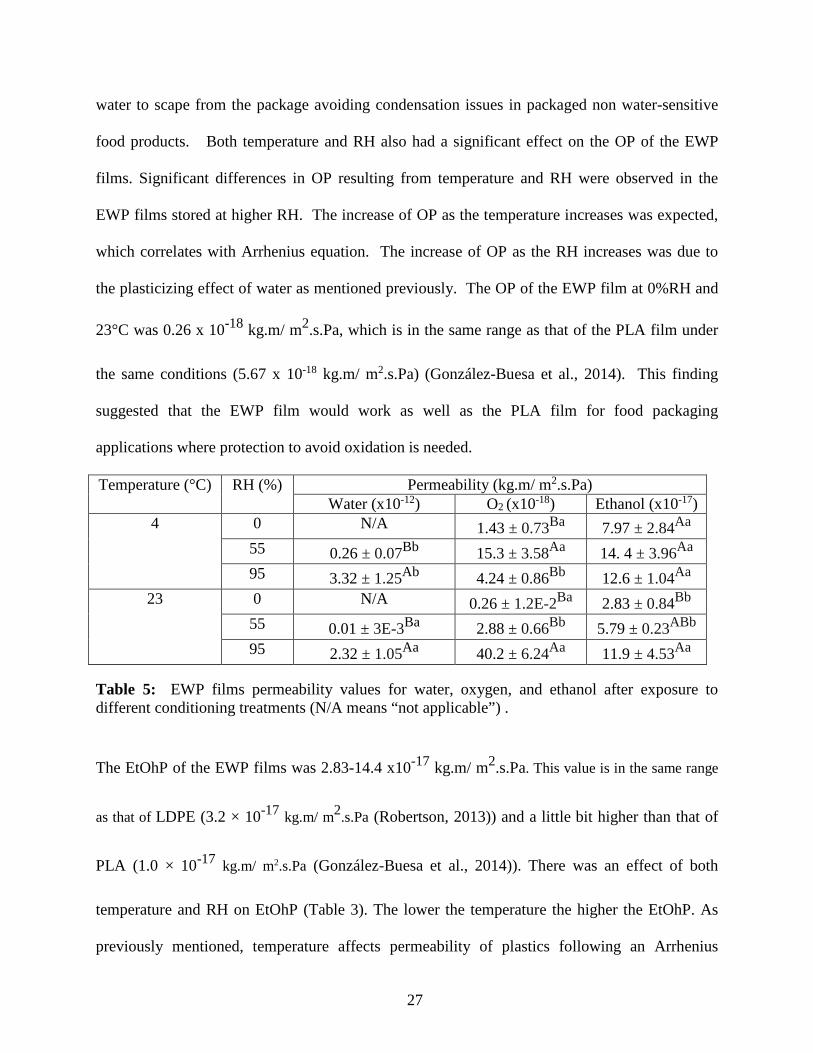
Temperature (°C) RH (%) Permeability (kg.m/ m2.s.Pa) Water (x10-12) O2 (x10-18) Ethanol (x10-17)
4 0 N/A 1.43 ± 0.73Ba 7.97 ± 2.84Aa 55 0.26 ± 0.07Bb 15.3 ± 3.58Aa 14. 4 ± 3.96Aa 95 3.32 ± 1.25Ab 4.24 ± 0.86Bb 12.6 ± 1.04Aa
23 0 N/A 0.26 ± 1.2E-2Ba 2.83 ± 0.84Bb
55 0.01 ± 3E-3Ba 2.88 ± 0.66Bb 5.79 ± 0.23ABb
95 2.32 ± 1.05Aa 40.2 ± 6.24Aa 11.9 ± 4.53Aa
Table 5: EWP films permeability values for water, oxygen, and ethanol after exposure to different conditioning treatments (N/A means “not applicable”) .
The EtOhP of the EWP films was 2.83-14.4 x10⁻¹⁷ kg.m/ m2.s.Pa. This value is in the same range
as that of LDPE (3.2 × 10⁻¹⁷ kg.m/ m2.s.Pa (Robertson, 2013)) and a little bit higher than that of
PLA (1.0 × 10⁻¹⁷ kg.m/ m2.s.Pa (González-Buesa et al., 2014)). There was an effect of both
temperature and RH on EtOhP (Table 3). The lower the temperature the higher the EtOhP. As
previously mentioned, temperature affects permeability of plastics following an Arrhenius
27
equation and therefore, the authors do not have an explanation for this contradiction. An
interaction between the temperature and RH was observed on the EWP EtOHP (P=0.014; Table
3), with the EWP films stored at 23°C increasing in EtOHP with the increase of RH but not the
EWP films stored at 4°C.
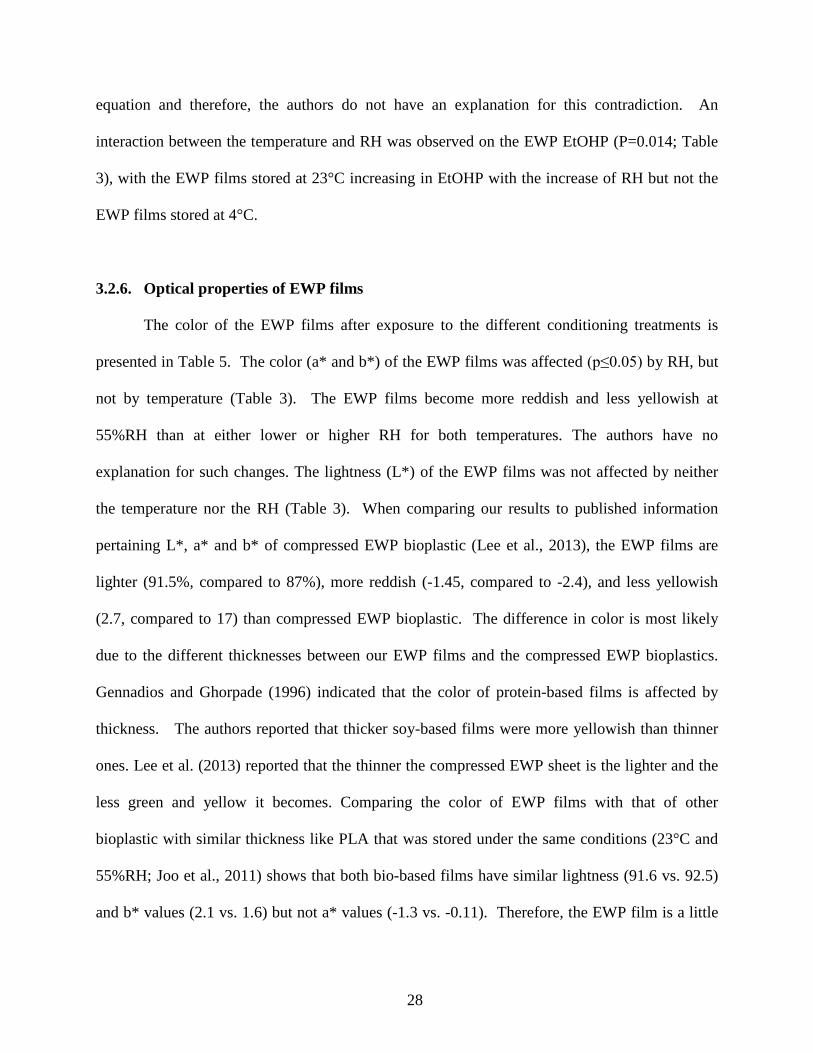
3.2.6. Optical properties of EWP films
The color of the EWP films after exposure to the different conditioning treatments is
presented in Table 5. The color (a* and b*) of the EWP films was affected (p≤0.05) by RH, but
not by temperature (Table 3). The EWP films become more reddish and less yellowish at
55%RH than at either lower or higher RH for both temperatures. The authors have no
explanation for such changes. The lightness (L*) of the EWP films was not affected by neither
the temperature nor the RH (Table 3). When comparing our results to published information
pertaining L*, a* and b* of compressed EWP bioplastic (Lee et al., 2013), the EWP films are
lighter (91.5%, compared to 87%), more reddish (-1.45, compared to -2.4), and less yellowish
(2.7, compared to 17) than compressed EWP bioplastic. The difference in color is most likely
due to the different thicknesses between our EWP films and the compressed EWP bioplastics.
Gennadios and Ghorpade (1996) indicated that the color of protein-based films is affected by
thickness. The authors reported that thicker soy-based films were more yellowish than thinner
ones. Lee et al. (2013) reported that the thinner the compressed EWP sheet is the lighter and the
less green and yellow it becomes. Comparing the color of EWP films with that of other
bioplastic with similar thickness like PLA that was stored under the same conditions (23°C and
55%RH; Joo et al., 2011) shows that both bio-based films have similar lightness (91.6 vs. 92.5)
and b* values (2.1 vs. 1.6) but not a* values (-1.3 vs. -0.11). Therefore, the EWP film is a little
28
bit more greenish than the PLA film. This should not be a problem from the consumer point of
view since there are several commercially available plastics with a green color tinge that are used
for food packaging applications like PVC and PVDC.
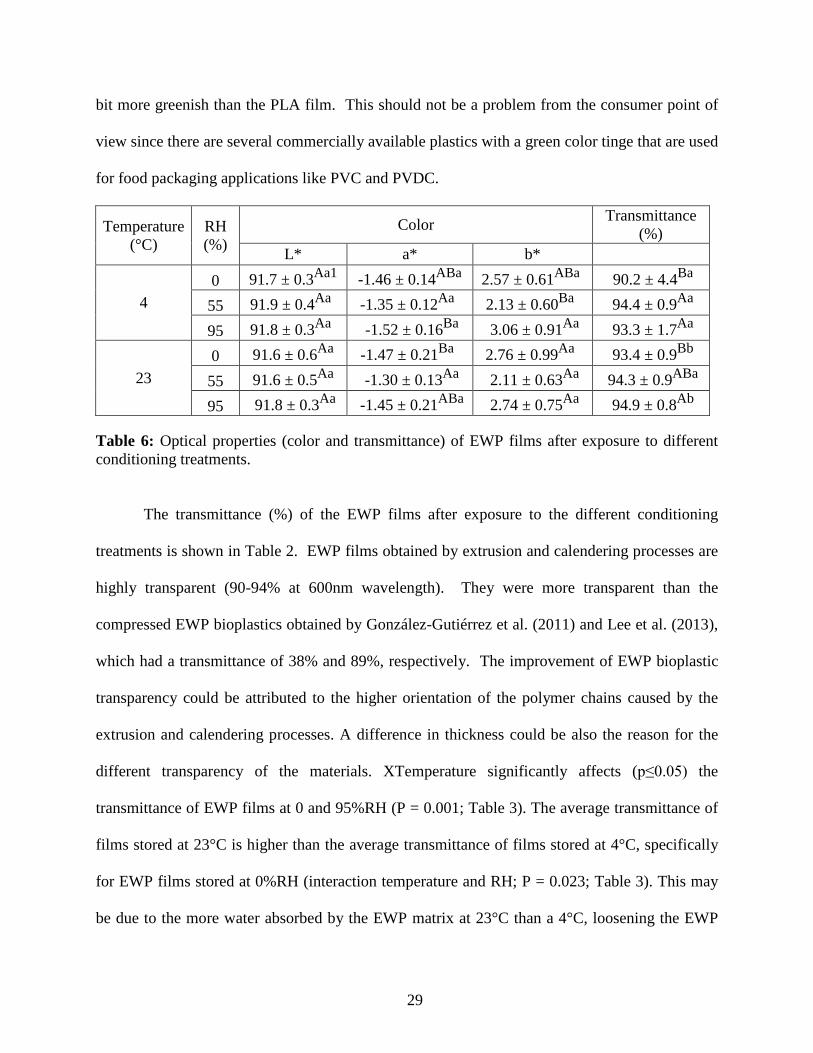
Temperature (°C)
RH (%)
Color Transmittance (%)
L* a* b*
4 0 91.7 ± 0.3Aa1 -1.46 ± 0.14ABa 2.57 ± 0.61ABa 90.2 ± 4.4Ba
55 91.9 ± 0.4Aa -1.35 ± 0.12Aa 2.13 ± 0.60Ba 94.4 ± 0.9Aa
95 91.8 ± 0.3Aa -1.52 ± 0.16Ba 3.06 ± 0.91Aa 93.3 ± 1.7Aa
23 0 91.6 ± 0.6Aa -1.47 ± 0.21Ba 2.76 ± 0.99Aa 93.4 ± 0.9Bb
55 91.6 ± 0.5Aa -1.30 ± 0.13Aa 2.11 ± 0.63Aa 94.3 ± 0.9ABa
95 91.8 ± 0.3Aa -1.45 ± 0.21ABa 2.74 ± 0.75Aa 94.9 ± 0.8Ab
Table 6: Optical properties (color and transmittance) of EWP films after exposure to different conditioning treatments.
The transmittance (%) of the EWP films after exposure to the different conditioning
treatments is shown in Table 2. EWP films obtained by extrusion and calendering processes are
highly transparent (90-94% at 600nm wavelength). They were more transparent than the
compressed EWP bioplastics obtained by González-Gutiérrez et al. (2011) and Lee et al. (2013),
which had a transmittance of 38% and 89%, respectively. The improvement of EWP bioplastic
transparency could be attributed to the higher orientation of the polymer chains caused by the
extrusion and calendering processes. A difference in thickness could be also the reason for the
different transparency of the materials. XTemperature significantly affects (p≤0.05) the
transmittance of EWP films at 0 and 95%RH (P = 0.001; Table 3). The average transmittance of
films stored at 23°C is higher than the average transmittance of films stored at 4°C, specifically
for EWP films stored at 0%RH (interaction temperature and RH; P = 0.023; Table 3). This may
be due to the more water absorbed by the EWP matrix at 23°C than a 4°C, loosening the EWP
29
matrix more and consequently, allowing more light to go through. The decrease in RH at both
temperatures decreases the transmittance of the EWP films significantly (p≤0.05) (P = 0.000;
Table 3). The loss of water may result in a tighter polymer matrix that allows less light to
transmit through the film.
3.2.7. Fungal resistance of EWP films
The EWP film did not pass the ASTM fungal resistance testing since the film did not
avoid the growth of P. pinophilum and A. niger for 21 days (Fig. 5). However, it needs to be
taken into consideration the ASTM method G21 was developed for petroleum-based plastics,
which do not interact with the agar of the petri dish as the EWP film does. This interaction most
likely resulted in the migration of agar nutrients from the agar into the EWP film, which most
likely fed the fungi. In addition, the testing was performed at 100%RH and 23°C instead of
85%RH and 23°C which substantially increases fungal growth. The closing of the petri dishes
with their lids created the higher RH environment. This was done to allow the manipulation of
the petri dishes to measure fungal colony size and compare controls and treatments. Controls
were petri dishes that were filled with the agar and then exposed to inoculated solutions, without
EWP films placed in them.
The growth of P. pinophilum and A. niger during 48 hours at 100%RH and 23°C was less
on the films than on the agar. The average growth area of P. pinophilum on the film was
1.06x10⁻⁴ m2 whereas the average growth area of P. pinophilum on the agar (controls) was
2.14x10⁻⁴m2. Similar results were observed for A. niger which had a growth area of 1.01x10⁻⁴
m2 on the films and 1.86x10⁻⁴ m2 on the agar. Comparing the different treatments, neither
30
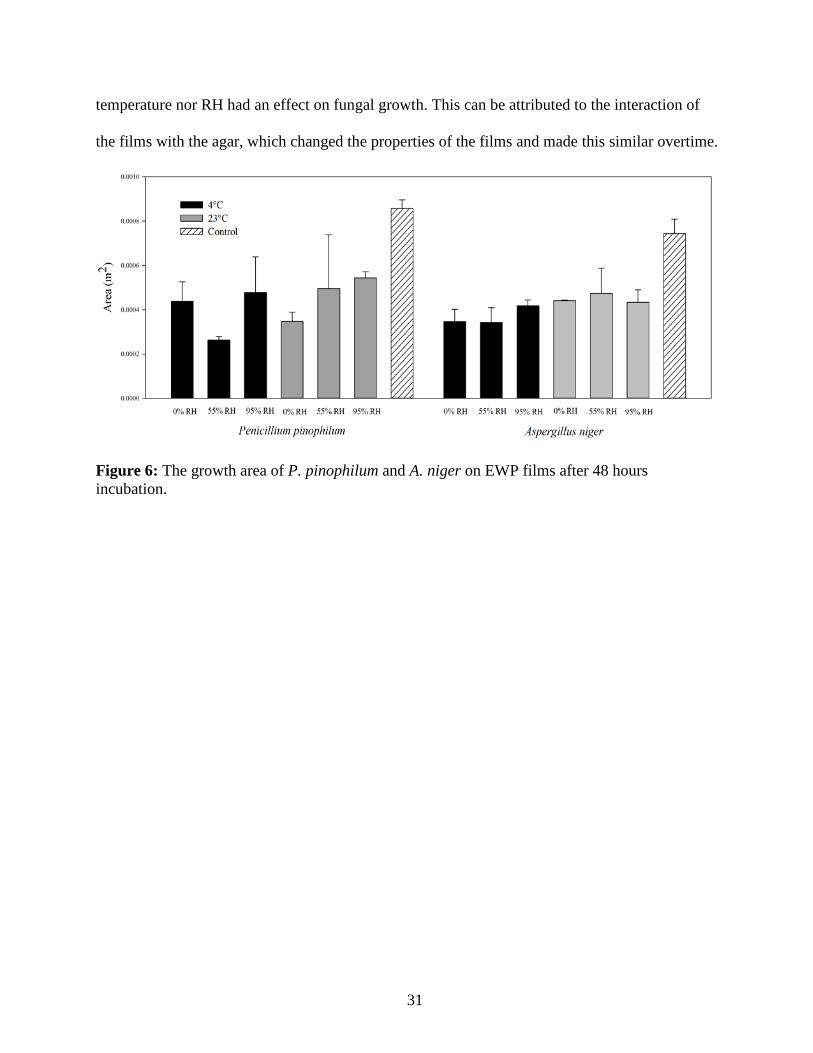
temperature nor RH had an effect on fungal growth. This can be attributed to the interaction of
the films with the agar, which changed the properties of the films and made this similar overtime.
Figure 6: The growth area of P. pinophilum and A. niger on EWP films after 48 hours incubation.
31
4. CONCLUSIONS
The processing conditions of both, extrusion and calendering necessary to obtain EWP films
were successfully identified and led to transparent (90-94% at 600nm), continuous, and uniform
films with a thickness of 110 ± 10μm. The exposure of the EWP films to combinations of
temperature (4 or 23°C) and RH (0, 55, or 95%) showed that both temperature and RH, and their
interactions have a significant (p≤0.05) effect on the properties of EWP films, with the later
being greater. At 23°C, EWP film has higher (p≤0.05) transmittance and lower (p≤0.05) WVP
and EtOHP than at 4°C. The decrease in RH at both temperatures decreases the transmittance
and water permeability, and increases the flexibility and thickness of the EWP films significantly
(p≤0.05). EWP films become more reddish and less yellowish at 55%RH at both temperatures.
Neither temperature nor RH had an effect on the tensile strength, first second-order transmission
temperatures, fungal resistance, and lightness of the EWP films. Interactions between
temperature and RH that affected the thickness, elongation at break, modulus of elasticity,
EtOHP and transmittance of the EWP films were found. Comparing EWP film to PLA film, the
bioplastic most widely used for food applications, at the same storage conditions (0%RH and
23°C) shows that both materials have similar color but different barrier and mechanical
properties. The EWP film is more flexible, more breakable, less rigid and more permeable to
water and ethanol than the PLA film. The oxygen permeability of EWP is similar to that of the
PLA. The EWP films did not avoid the growth of P. pinophilum and A. niger but did reduce
their growth after 48 hours at 100%RH and 23°C. This study proves the feasibility of producing
EWP films using the most common filmmaking processing technology and shows that EWP film
can be used for specific food applications.
32

5. FUTURE WORK
The results of this study indicated that the EWP films can be produced using the most
common filmmaking processing technology and can be used for specific food applications.
EWP films did not pass the ASTM fungal resistance testing, but shows reduction of fungal
growth after 48 hours. Therefore, future work would include:
1) Fungal resistance testing at lower temperature (4°C).
2) Develop an active packaging by adding an antimicrobial compound to EWP films.
3) Study the compatibility of EWP films for food packaging application by forming the film
into a pouch and then place food items inside the pouch.
4) Investigate the effect of food/package interaction to the properties of the films and the food
item itself.
33

APPENDIX
34
APPENDIX DEVELOPMENT OF EXTRUSION METHOD OF EGG WHITE PROTEIN-BASED FILM. The final extrusion method that led to desired EWP films resulted from several trial-and-error
experiments that are compiled in the methods presented below. In all experiments, prior to each
extrusion, calibration curves were performed for both the feeder and the pump in order to
determine the quantity of the solid and liquid feed per minute necessary to obtain extrudates with
stable properties. Calibration curves were obtained by measuring the weight of the EWP powder
or the liquid solution per minute for different feed rates and water pump percentages,
respectively, and then plotting weight/time (g/min) versus feed rate (rpm) or percentage (%).
The feed rates were 50, 100, and 150 rpm. The water pump percentages were 5, 10, and 15%.
These settings were selected as the desirable quantity of the liquid and solid feed were within the
range of the settings. Measurement of weight was completed twice per setting, and the results
were then averaged. However, if the weight varied in one setting, measurement of weight was
continued until two or more measurements close in value were obtained. The ratio of the water,
glycerol, and EWP used in all extrusions was 1:1:2. This mixture was selected because it was
the suitable mixture to extrude stable EWP bioplastic without diffusion of the glycerol that
resulted in oily surface of the extrudates (results not shown).
1. Method I
The first method was completed using two extruders, as seen in Fig. 6. Extrudates were obtained
using an APV Baker extruder (Model MP19TC2-25, APV Baker; Grand Rapids, MI, United
States) with temperature settings of 45 - 100 - 140 - 140 - 100°C from feeder to die, screw speed
of 125 rpm and a 4-mm circular die attached at its end. This extrusion settings and the
aforementioned raw material mixture created extrudates with glossy appearance (Fig. 6). These
35
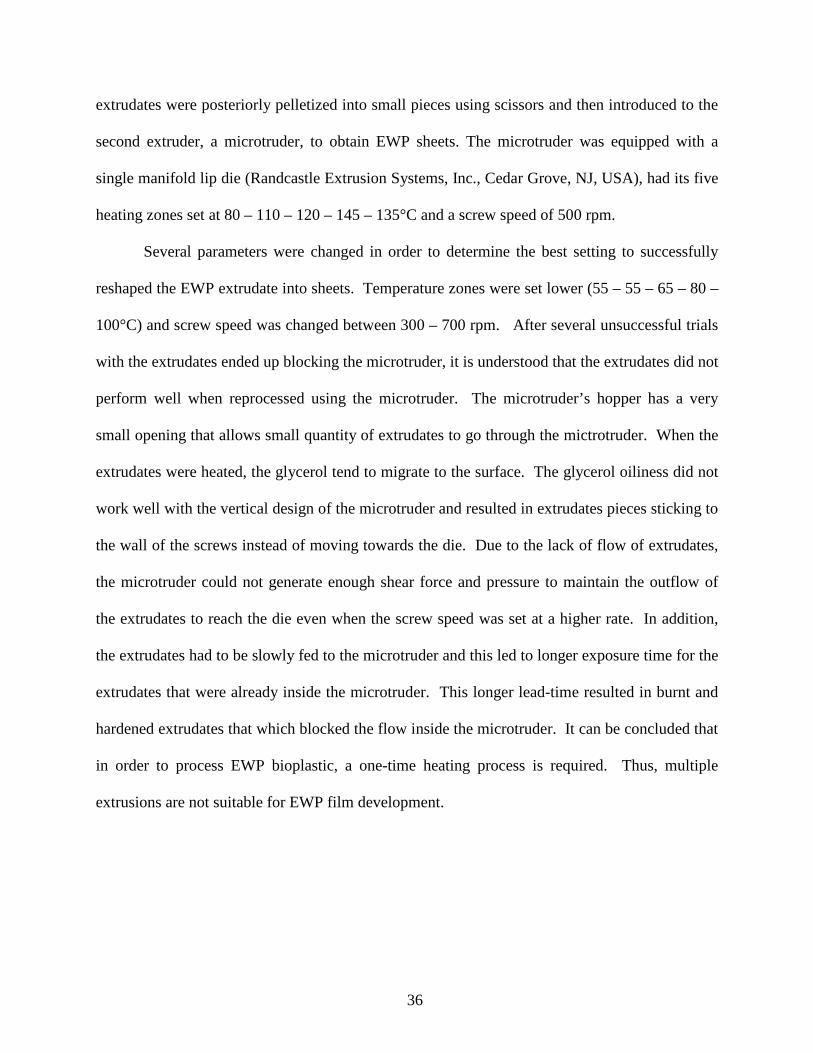
extrudates were posteriorly pelletized into small pieces using scissors and then introduced to the
second extruder, a microtruder, to obtain EWP sheets. The microtruder was equipped with a
single manifold lip die (Randcastle Extrusion Systems, Inc., Cedar Grove, NJ, USA), had its five
heating zones set at 80 – 110 – 120 – 145 – 135°C and a screw speed of 500 rpm.
Several parameters were changed in order to determine the best setting to successfully
reshaped the EWP extrudate into sheets. Temperature zones were set lower (55 – 55 – 65 – 80 –
100°C) and screw speed was changed between 300 – 700 rpm. After several unsuccessful trials
with the extrudates ended up blocking the microtruder, it is understood that the extrudates did not
perform well when reprocessed using the microtruder. The microtruder’s hopper has a very
small opening that allows small quantity of extrudates to go through the mictrotruder. When the
extrudates were heated, the glycerol tend to migrate to the surface. The glycerol oiliness did not
work well with the vertical design of the microtruder and resulted in extrudates pieces sticking to
the wall of the screws instead of moving towards the die. Due to the lack of flow of extrudates,
the microtruder could not generate enough shear force and pressure to maintain the outflow of
the extrudates to reach the die even when the screw speed was set at a higher rate. In addition,
the extrudates had to be slowly fed to the microtruder and this led to longer exposure time for the
extrudates that were already inside the microtruder. This longer lead-time resulted in burnt and
hardened extrudates that which blocked the flow inside the microtruder. It can be concluded that
in order to process EWP bioplastic, a one-time heating process is required. Thus, multiple
extrusions are not suitable for EWP film development.
36
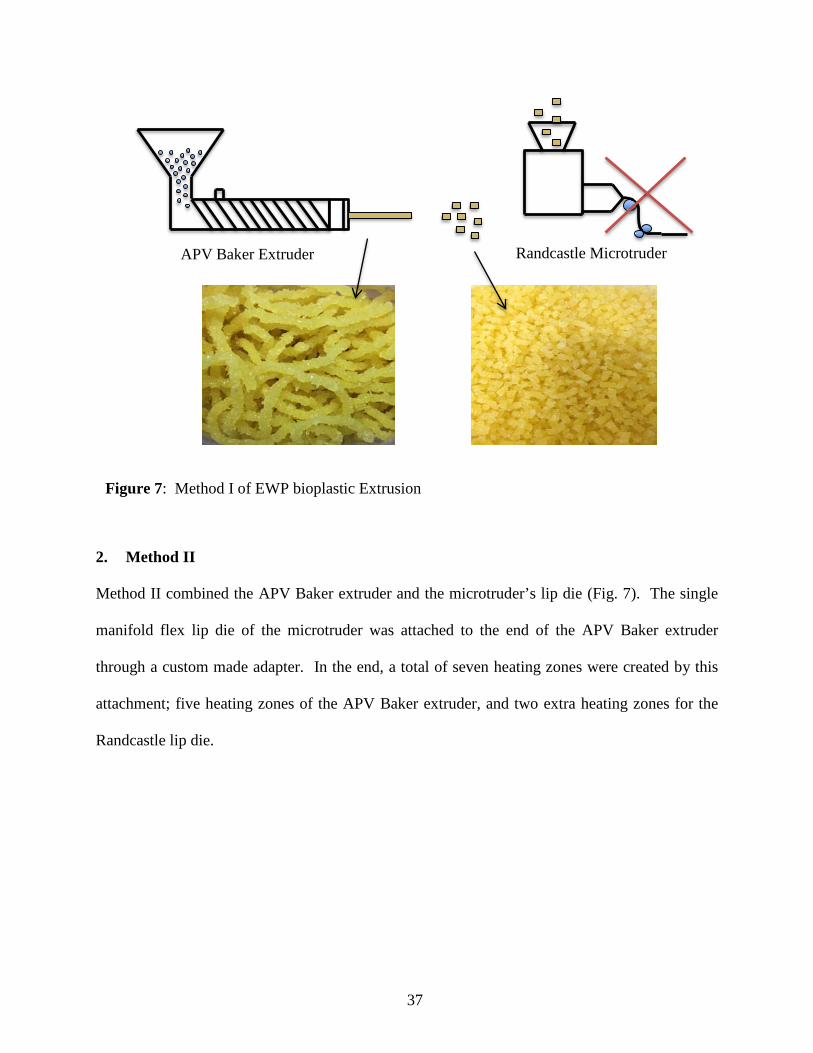
2. Method II
Method II combined the APV Baker extruder and the microtruder’s lip die (Fig. 7). The single
manifold flex lip die of the microtruder was attached to the end of the APV Baker extruder
through a custom made adapter. In the end, a total of seven heating zones were created by this
attachment; five heating zones of the APV Baker extruder, and two extra heating zones for the
Randcastle lip die.
APV Baker Extruder Randcastle Microtruder
Figure 7: Method I of EWP bioplastic Extrusion
37
The temperature setting used was 30 – 50 – 90 – 100 – 120 – 140 – 140°C with a screw speed of
200 rpm. Several paremeter changes were completed to determine the best setting to obtain
EWP films. Temperature settings were changed into higher and lower temperature and the screw
speed was increased due to the extra length, however, none of the settings worked. It was
observed that the size of the lip die was too big. It took a long period of time to completely fill
the lip die with the EWP mixture. The long period of time to fill the lip die resulted in burnt and
hard material that stopped the flow inside the extruder. When the temperatures in all zones were
decreased to 60 or 70°C, the material that came out of the lip die has a liquid appearance.
It can be concluded that the lip die from the microtruder was not suitable for extrusion of EWP
films. A better chance of obtaining EWP films could be achieved by utilizing a smaller lip die
that will not take a long time to fill. However, we cannot ensure that. Additionally, there is no
equipment that matched with the specifications that were needed. A further change of method
was proposed which resulted in a successful method that is described as method III.
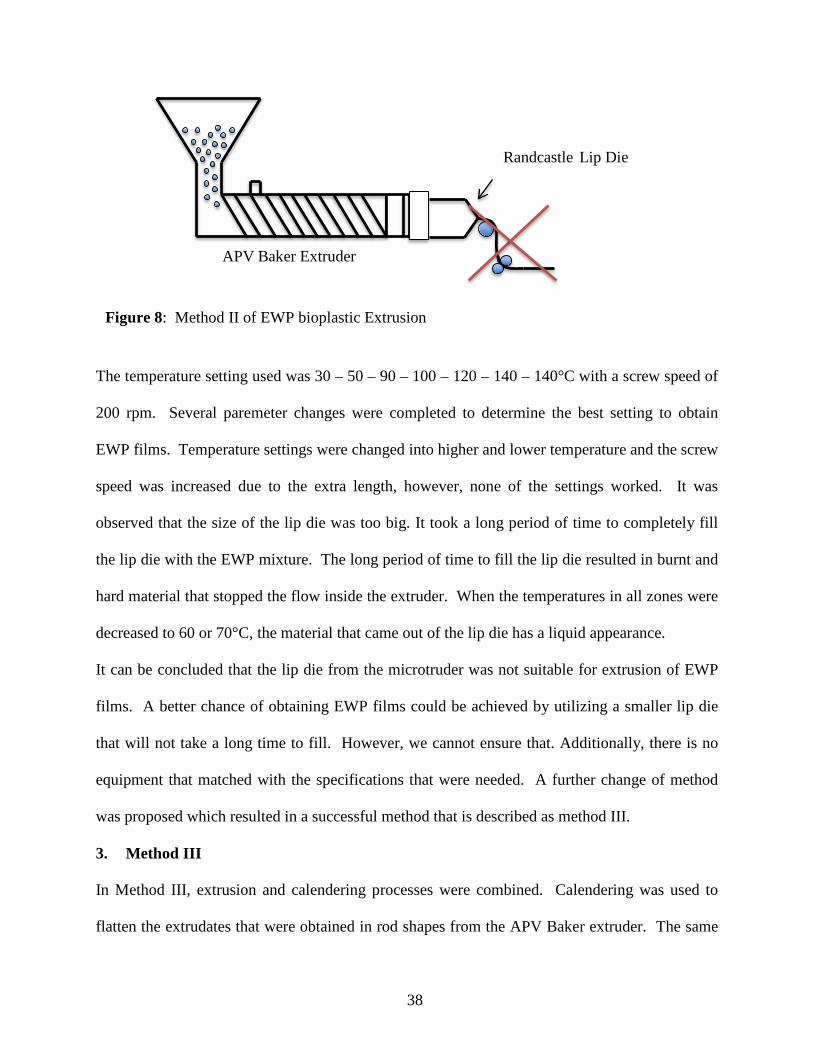
3. Method III
In Method III, extrusion and calendering processes were combined. Calendering was used to
flatten the extrudates that were obtained in rod shapes from the APV Baker extruder. The same
APV Baker Extruder
Randcastle Lip Die
Figure 8: Method II of EWP bioplastic Extrusion
38
temperature setting and screw speed as described in Method I were used in order to obtain the
rod shaped extrudates. Common calendering process does not reach temperature as high as
140°C. However, a drums drier works in a similar manner to calendering process and can reach
to a temperature as high as 160°C (temperature necessary to flatten the EWP extrudates). After
the extrudates were obtained, they were placed in between the two drums. Instead of flattening
the extrudates, the high heat and rotation broke the extrudates into smaller pieces. The next step
following this finding was to reduce the temperature setting used to produce EWP extrudates in
order to obtain extrudates with the right texture. Moreover, the speed of the drums is adjustable
through manual rotation which allow the extrudates to be exposed to a high temperature only for
a short period of time, which avoid burning and color change of the extrudates.
Several temperature combinations were tested (see table I) until obtaining the temperature
combination of 40 – 50 – 60 – 70 – 75°C which resulted in extrudates with desired properties to
Extrusion Calendering
Teflon sheet H20/GLY input
EWP powder
EWP extrudate
Figure 9: Method III of EWP bioplastic Extrusion
39
be calendered afterwards. The extrudates solidified but they were still softer in texture compared
to the extrudates from method I. Once the extrudates were obtained, they were placed in between
two Teflon sheets in order to create easily peelable surface. The drums were rotated at a speed
of 0.111 rpm. Once the extrudates and the Teflon sheets completely went through the drums
drier, they were cooled down at room temperature for several minutes before being peeled off
from the Teflon sheets. This method successfully created a EWP film with flexibility, uniform
thickness, and high transparency.
40
BIBLIOGRAPHY
41
BIBLIOGRAPHY
Almenar, E., & Auras, R. 2010. Permeation, sorption, and diffusion in poly(lactic acid). In: Poly(lactic acid): Synthesis, Structure, Properties and Applications, Eds. R Auras, L-T Lim, S E M Selke, H Tsuji, Wiley and Sons, New York (USA). Pp. 155-179. Almenar, E., Auras, R., Wharton, P., Rubino, M., & Harte, B. (2007) Release of acetaldehyde from β-Cyclodextrins inhibits postharvest decay fungi in vitro. Journal of agricultural and food chemistry, 55(7), 7205-7212 ASTM, 2005. Standard test method for oxygen gas transmission rate through plastic film and sheeting using a coulometric sensor. Method D3985-05. American Society for Testing Materials, Philadelphia. ASTM, 2012a. Standard test method for transition temperatures and enthalpies of fusion and crystallization of polymers by differential scanning calorimetry, Method D3418-12. American Society for Testing Materials, Philadelphia. ASTM, 2012b. Standard test methods for tensile properties of thin plastic sheeting, Method D882-12. American Society for Testing Materials, Philadelphia. ASTM, 2013a. Standard test method for water vapor transmission rate through plastic film and sheeting using a modulated infrared sensor. Method F1249-13. American Society for Testing Materials, Philadelphia. ASTM, 2013b. Standard practice for determining resistance of synthetic polymeric materials to fungi. Method G21-13. American Society for Testing Materials, Philadelphia.
Chen, P., Zhang, L., & Cao, F. (2005). Effects of moisture on glass transition and microstructure of glycerol‐plasticized soy protein. Macromolecular bioscience, 5(9), 872-880. Coles, R., McDowell, D., & Kirwan, M. J. (2003). Food packaging technology (Vol. 5): CRC Press. Comstock, K., Farrell, D., Godwin, C., & Xi, Y. (2004). From hydrocarbons to carbohydrates: food packaging of the future. Cuq, B., Gontard, N., & Guilbert, S. (1998). Proteins as agricultural polymers for packaging production. Cereal chemistry, 75(1), 1-9. Cutter, C. N. (2006). Opportunities for bio-based packaging technologies to improve the quality and safety of fresh and further processed muscle foods. Meat science, 74(1), 131-142. De Graaf, L. A. (2000). Denaturation of proteins from a non-food perspective. Journal of biotechnology, 79(3), 299-306.
42
Domenek, S., Feuilloley, P., Gratraud, J., Morel, M.-H., & Guilbert, S. (2004). Biodegradability of wheat gluten based bioplastics. Chemosphere, 54(4), 551-559. Félix, M., Martín-Alfonso, J. E., Romero, A., & Guerrero, A. (2014). Development of albumen/soy biobased plastic materials processed by injection molding. Journal of food engineering, 125, 7-16. Fitzsimons, S. M., Mulvihill, D. M., & Morris, E. R. (2007). Denaturation and aggregation processes in thermal gelation of whey proteins resolved by differential scanning calorimetry. Food hydrocolloids, 21(4), 638-644. Gennadios, A., Ghorpade, V. M., Weller, C. L., & Hanna, M. A. (1996). Heat curing of soy protein films. Biological systems engineering: papers and publications, 94. Gontard, N., Thibault, R., Cuq, B., & Guilbert, S. (1996). Influence of relative humidity and film composition on oxygen and carbon dioxide permeabilities of edible films. Journal of agricultural and food chemistry, 44(4), 1064-1069. González-Buesa, J., Page, N., Kaminski, C., Ryser, E., Beaudry, R., & Almenar, E. 2014. Effect of non-conventional atmospheres and bio-based packaging on the quality and safety of Listeria monocytogenes-inoculated fresh-cut celery (Apium graveolens L.) during storage. Postharvest Biology and Technology, 93: 29-37 González-Gutiérrez, J., Partal, P., García-Morales, M., & Gallegos, C. (2011). Effect of processing on the viscoelastic, tensile and optical properties of albumen/starch-based bioplastics. Carbohydrate Polymers, 84(1), 308-315. Hernandez, R. J., Selke, S. E., Culter, J. D., & Culter, J. D. (2000). Plastics packaging: properties, processing, applications, and regulations (pp. 21-352). Munich, Germany: Hanser. Hernandez‐Izquierdo, V. M., & Krochta, J. M. (2008). Thermoplastic processing of proteins for film formation—a review. Journal of food science, 73(2), R30-R39. Irissin-Mangata, J., Bauduin, G., Boutevin, B., & Gontard, N. (2001). New plasticizers for wheat gluten films. European polymer journal, 37(8), 1533-1541. Jerez, A., Partal, P., Martinez, I., Gallegos, C., & Guerrero, A. (2007). Egg white-based bioplastics developed by thermomechanical processing. Journal of food engineering, 82(4), 608-617. Jones, A., Zeller, M. A., & Sharma, S. (2013). Thermal, mechanical, and moisture absorption properties of egg white protein bioplastics with natural rubber and glycerol. Progress in Biomaterials, 2(1), 1-13. Joo, M., Auras, R., & Almenar, E. (2011). Preparation and characterization of blends made of
43
poly(lactic acid) and βreparation and c improvement of the blend properties by using a masterbatch. Carbohydrate Polymers, 86(2): 1022-1030 Khare, A., & Deshmukh, S. (2006). Studies toward producing eco-friendly plastics. Journal of plastic film and sheeting, 22(3), 193-211. Ko, S., Janes, M. E., Hettiarachchy, N. S., & Johnson, M. G. (2001). Physical and chemical properties of edible films containing nisin and their action against Listeria monocytogenes. Journal of food science, 66(7), 1006-1011. Koutsimanis, G., Getter, K., Behe, B., Harte, J., & Almenar, E. (2012). Influences of packaging attributes on consumer purchase decisions for fresh produce. Appetite, 59(2), 270-280. Lee, R., Pranata, M., Ustunol, Z., & Almenar, E. (2013). Influence of glycerol and water activity on the properties of compressed egg white-based bioplastics. Journal of food engineering, 118(1), 132-140. Martínez, I., Partal, P., García-Morales, M., Guerrero, A., & Gallegos, C. (2013). Development of protein-based bioplastics with antimicrobial activity by thermo-mechanical processing. Journal of food engineering, 117(2), 247-254. Miller, K. S., & Krochta, J. M. (1997). Oxygen and aroma barrier properties of edible films: A review. Trends in food science & technology, 8(7), 228-237. Ogale, A., & Cunningham, P. (2000) Viscoelastic, thermal, and microstructural characterization of soy protein isolate films. Journal of food science, 65(4), 672-679. Oliviero, M., Maio, E. D., & Iannace, S. (2010) Effect of molecular structure on film blowing ability of thermoplastic zein. Journal of applied polymer science, 115(1), 277-287. Plastics. (2004) United States Environmental Protection Agency website. Retrieved April 17, 2014 from http://www.epa.gov/osw/conserve/materials/plastics.htm Pommet, M., Redl, A., Morel, M. H., & Guilbert, S. (2003). Study of wheat gluten plasticization with fatty acids. Polymer, 44(1), 115-122. Ringe, D., & Petsko, G. A. (2003). The glass transition in protein dynamics: what it is, why it occurs, and how to exploit it. Biophysical chemistry, 105(2), 667-680. Robertson, G. L. (2013). Food packaging: principles and practice (3rd ed.) CRC press. Sharmā, S., Hodges, J. N., & Luzinov, I. (2008). Biodegradable plastics from animal protein coproducts: feathermeal. Journal of applied polymer science,110(1), 459-467. Sharmā, S. K., Mudhoo, A., & Clark, J. H. (2011). A Handbook of Applied Biopolymer Technology: Synthesis, Degradation and Applications: Royal Society of Chemistry.
44
Tice, P., Europe, I., & Europe, I. (2003). Packaging Materials: Report. 4, Polyethylene for Food Packaging Applications: ILSI Europe. Weber, C. J., Haugaard, V., Festersen, R., & Bertelsen, G. (2002). Production and applications of biobased packaging materials for the food industry. Food Additives & Contaminants, 19(S1), 172-177. Verbeek, C. J. R., & van den Berg, L. E. (2010). Extrusion processing and properties of protein‐based thermoplastics. Macromolecular materials and engineering, 295(1), 10-21.
45