Embed Size (px)
Citation preview
Effects of stiffener geometric parameters on the buckling and post-buckling response of composite I-stiffened panels
RUI ZHOU and WEICHENG GAO*
Department of Astronautics Science and Mechanics, Harbin Institute of Technology, Harbin, China
e-mail: [email protected]
MS received 8 July 2020; revised 7 November 2020; accepted 7 December 2020
Abstract. The buckling instability and post-buckling carrying capacity are major concerns in the engineering
design of composite stiffened panels and are influenced by a series of design parameters. This work investigated
the rule and mechanism of the stiffener flange widths effects on the buckling instability and post-buckling
response of composite I-stiffened panels under axial compression. With the compression experiments, the
buckling instability and post-buckling response of the composite I-stiffened panels were obtained and further
used in the validation of the finite-element (FE) model. A parametric study was then implemented in analyzing
the effects of stiffener flange widths on the structural buckling instability and post-buckling response. The results
indicate that skin-stiffener debonding and intra-laminar damage are the main failure modes. The structural
buckling instability, carrying capacity and failure behavior are sensitive to the parameters of stiffener flange
widths. The bottom flange width wb linearly affects the critical buckling load, but has no effects on the buckling
mode. The top flange width wt simultaneously affects the critical buckling load and buckling mode, and an
obvious buckling mode change occurs around a critical wt value. Both the bottom and top flange widths affect
the structural damage process, failure mode and carrying capacity obviously.
Keywords. Composite I-stiffened panels; buckling and post-buckling; finite-element method; compressive
experiment; parametric study; stiffener flange width.
1. Introduction
Composite materials have been widely used in aerospace
industry due to their high specific properties and advantages
in design flexibility. Composite stiffened panels are typical
structures that have been extensively adopted in practical
engineering with the aim to increase structural efficiency
and reduce weight. Under axial compression, composite
stiffened panels maintain strong post-buckling carrying
capacity after the initiation of structural buckling. Post-
poning the buckling initiation and increasing the post-
buckling carrying capacity are major concerns in the
engineering design of composite stiffened panels. Investi-
gations have been widely implemented on composite
stiffened panels under axial compression. It is necessary to
understand the panels’ loading response, especially the
buckling and post-buckling behavior in order to enhance
the structural mechanical performance.
Different buckling modes appear at composite stiffened
panels with different boundary conditions, and the buckling
instability further induces interface debonding and inter-
laminar damage in the post-buckling process [1]. Local
damage such as fiber breakage, matrix cracking and
delamination are commonly observed in the collapse of the
panels, together with the skin-stiffener debonding, which is
caused by the mismatch in stiffness between skin and
stiffener [2–4]. Research projects have been extensively
implemented in studying the damage relationships and
characteristics through different methods.
Finite-element method has been widely applied in pre-
dicting the buckling and post-buckling behavior of com-
posite stiffened panels due to its advantages in analyzing
efficiency and low cost. It is important to validate the
prediction accuracy of the FE models in improving the
post-buckling carrying capacity and mechanical perfor-
mance of the composite stiffened panels [5, 6]. In order to
capture the important response details, improved tech-
niques such as the improved shell elements [7], the
improved ABAQUS user subroutines [8], the equivalent
damage model [9], the progressive failure model [10], and
the progressive stiffness degradation model [11] have been
utilized in the investigations.
Experimental methods are important in understanding
the failure behavior of composite stiffened panels, and from
the data and observed phenomenon, the failure mechanism
and process can be studied in detail [12]. Furthermore,
experimental results can also be used in validating theories
and FE models developed for the composite stiffened*For correspondence
Sådhanå (2021) 46:9 � Indian Academy of Sciences
https://doi.org/10.1007/s12046-020-01550-8Sadhana(0123456789().,-volV)FT3](0123456789().,-volV)
panels’ analyses [13]. Various experimental techniques and
optical methods [14–18] such as 3D-digital image corre-
lation, acoustic emission, vibration correlation, infrared
thermography, electronic strain gaging and digital fringe
projection profilometry have been utilized in capturing the
buckling and post-buckling response of composite stiffened
panels with stiffeners of different shapes.
Having the advantages in simplicity and usability, ana-
lytical methods have also been introduced to predict the
panels’ buckling and post-buckling behavior. Different
analytical formulations [19–21] based on different theories
such as energy principle and the Ritz theory have been
utilized in studying the linearized local skin buckling load
and nonlinear post-buckling behavior of composite stiff-
ened panels subjected to axial compression load, and the
ability of the formulation in assessing the panels’ buckling
and post-buckling responses have been revealed through
experiments.
The buckling behavior and post-buckling response of the
composite stiffened panels are influenced by many factors
[22–26] such as the boundary conditions, the stiffener
configuration and stiffness, the skin thickness, the existence
of damage and damage locations. For composite stiffened
panels with I-shaped stiffeners, important design parame-
ters such as the skin thickness, stiffener flange widths [27]
and web height have obvious effects on the structural
buckling instability, post-buckling carrying capacity and
failure modes. The effects of geometric parameters on the
bearing characteristics of composite stiffened panels are
complicated. Although previous relevant research projects
have been widely implemented, more detailed numerical
research projects and experiments are still needed in sat-
isfying the engineering design considering different mate-
rial systems, different boundary conditions and different
stiffener styles of the composite stiffened panels. Rules of
the effects need to be concluded, and mechanisms of the
effects need to be revealed in providing reference in the
engineering design process.
With the assistance of finite-element method and
experiments, the goal of this work is to conclude the rule
and analysis the mechanism of the stiffener flange widths
influence on the buckling and post-buckling behaviors of
the composite stiffened panels with a lateral support
boundary condition under axial compression.
The buckling instability, post-buckling carrying capacity
and failure mode of composite I-stiffened panels are first
investigated through experimental and numerical methods.
Based on the validated FE model, a parametric study is then
implemented. The effects of stiffener top and bottom flange
widths on the buckling and post-buckling behavior of the
composite stiffened panels are investigated respectively in
detail, with the rule of the effects concluded and the
mechanism of the effects analyzed.
2. Objects and methods
2.1 Material and geometry
The specimens tested in the investigation are composite
I-stiffened panels made of T300/CMS carbon-epoxy pre-
preg with a ply thickness of 0.19 mm. The stiffener is
integrated on the skin through co-curing method. A lateral
rib support is connected to the middle part of the panel
through rivets. Mechanical properties of the laminate are
listed in table 1. The monolayer stiffness and strength
include the elasticity modules in the 0� direction and 90�direction E11, E22; the shear modules G12, G13; the Pois-
son’s ratio m12; the tensile and compressive strengths in the
0� direction XT, XC; the tensile and compressive strengths in
the 90�d irection YT, YC, and the shear strengths S12, S23.The interface properties include the normal interface
strength tn0, the two tangential interface strengths ts
0, tt0, the
normal interface critical strain release rate GnC, and the two
tangential interface critical strain release rates GsC, Gt
C.
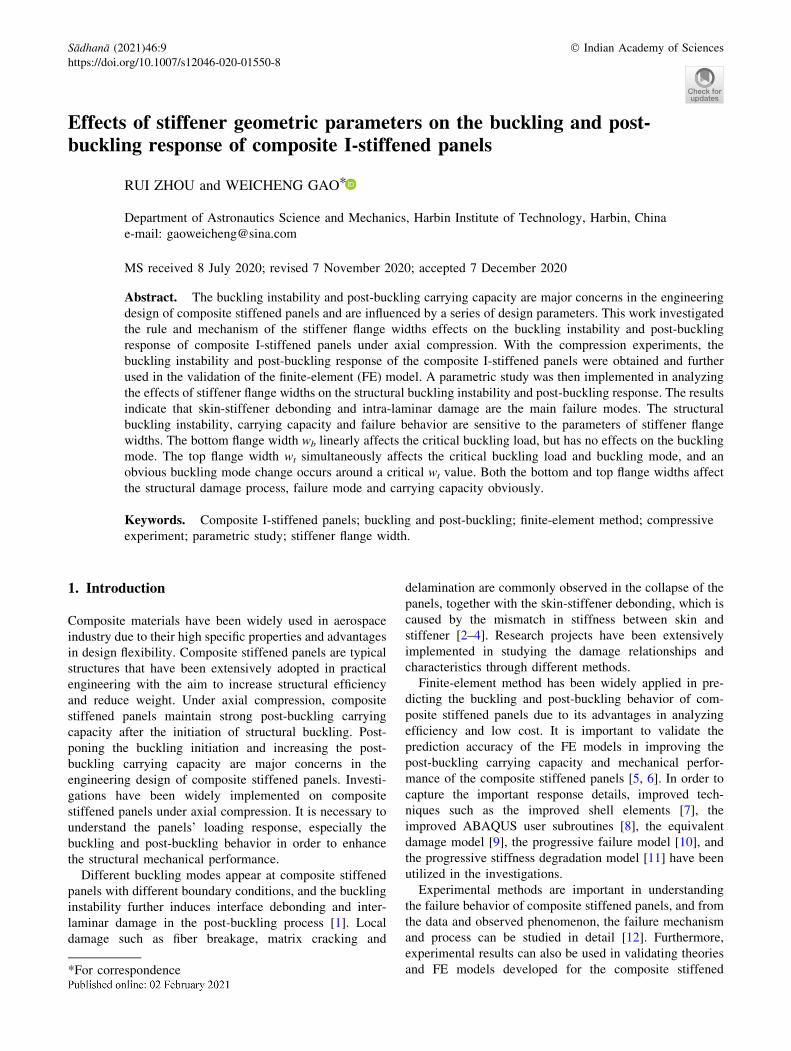
The composite stiffened panel is 1280 mm in length and
220 mm in width. The specimen configuration together
with detailed section parameters are shown in figure 1. The
end regions of the specimens are put into metal boxes and
potted with resin to provide uniform distribution of the
applied axial compression load. The ply sequences of the
top and bottom flanges, the skin and the web as shown in
figure 1 are listed in table 2.
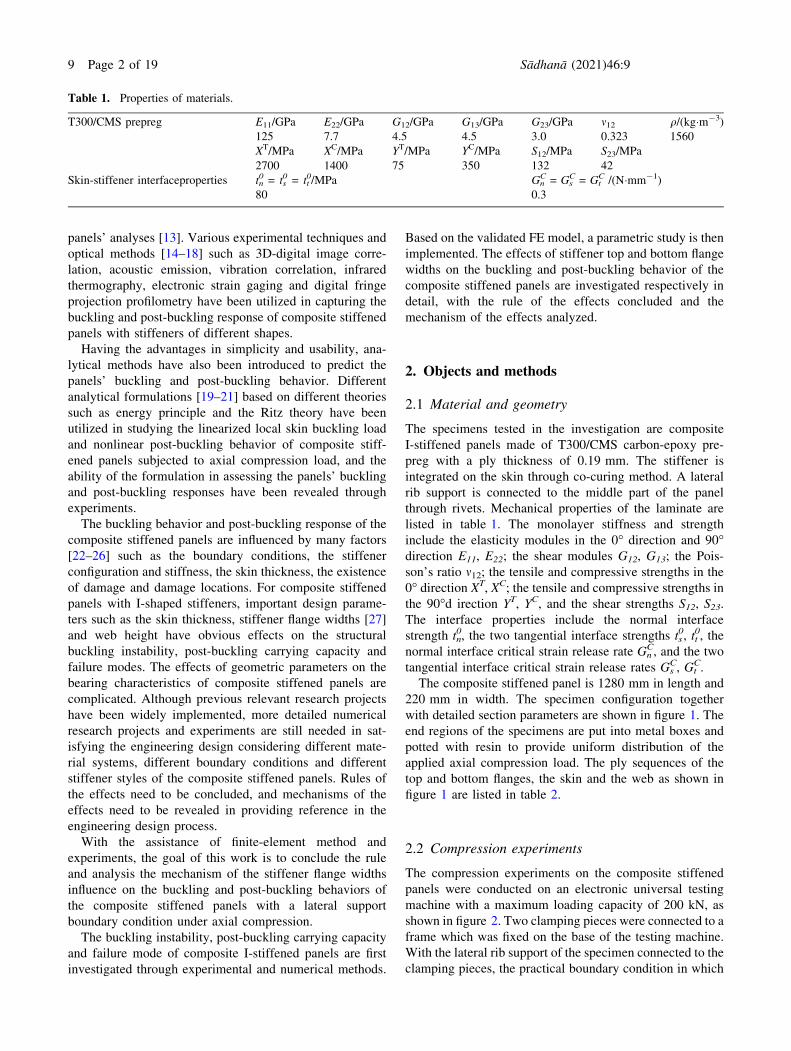
2.2 Compression experiments
The compression experiments on the composite stiffened
panels were conducted on an electronic universal testing
machine with a maximum loading capacity of 200 kN, as
shown in figure 2. Two clamping pieces were connected to a
frame which was fixed on the base of the testing machine.
With the lateral rib support of the specimen connected to the
clamping pieces, the practical boundary condition in which
Table 1. Properties of materials.
T300/CMS prepreg E11/GPa E22/GPa G12/GPa G13/GPa G23/GPa m12 q/(kg�m-3)
125 7.7 4.5 4.5 3.0 0.323 1560
XT/MPa XC/MPa YT/MPa YC/MPa S12/MPa S23/MPa
2700 1400 75 350 132 42
Skin-stiffener interfaceproperties tn0 = ts
0 = tt0/MPa Gn
C = GsC = Gt
C /(N�mm-1)
80 0.3
9 Page 2 of 19 Sådhanå (2021) 46:9
the composite stiffened panels worked was modeled. As the
clamping pieces were limited within the tracks, the lateral rib
support maintained only the translation degree of freedom in
the compression direction. Three specimens numbered 1 to 3
were tested in the experiments. The compression load was
applied under displacement control of 1 mm/min, and the
load-shortening curve was automatically recorded by the
testing machine. Resistance strain gauges were placed back-
to-back on specific positions of the specimen along the
compressive direction in monitoring the buckling behavior
and measuring the critical buckling load. Locations of typi-
cal measurement points are specified in figure 1.
3. Results and analysis
3.1 Load-shortening response
Strain-load curves and load-shortening curves of the three
specimens are compared in figure 3. Strain-load curves of
Figure 1. Configuration and dimensions of the composite stiffened panels.
Table 2. Ply sequences of regions in the composite stiffened
panels.
Region Ply sequence
Top flange [45/0/-45/90/0/45/0/-45/-45/45/
0/90/-45/0/45]
Web [45/0/-45/90/0/45/-45/-45/45/0/
90/-45/0/45]
Bottom flange [0/0/0/-45/45/0/90/-45/0/45]
Skin layup [45/90/-45/0/90/45/-45/0]s
Figure 2. Loading system and boundary conditions.
Sådhanå (2021) 46:9 Page 3 of 19 9
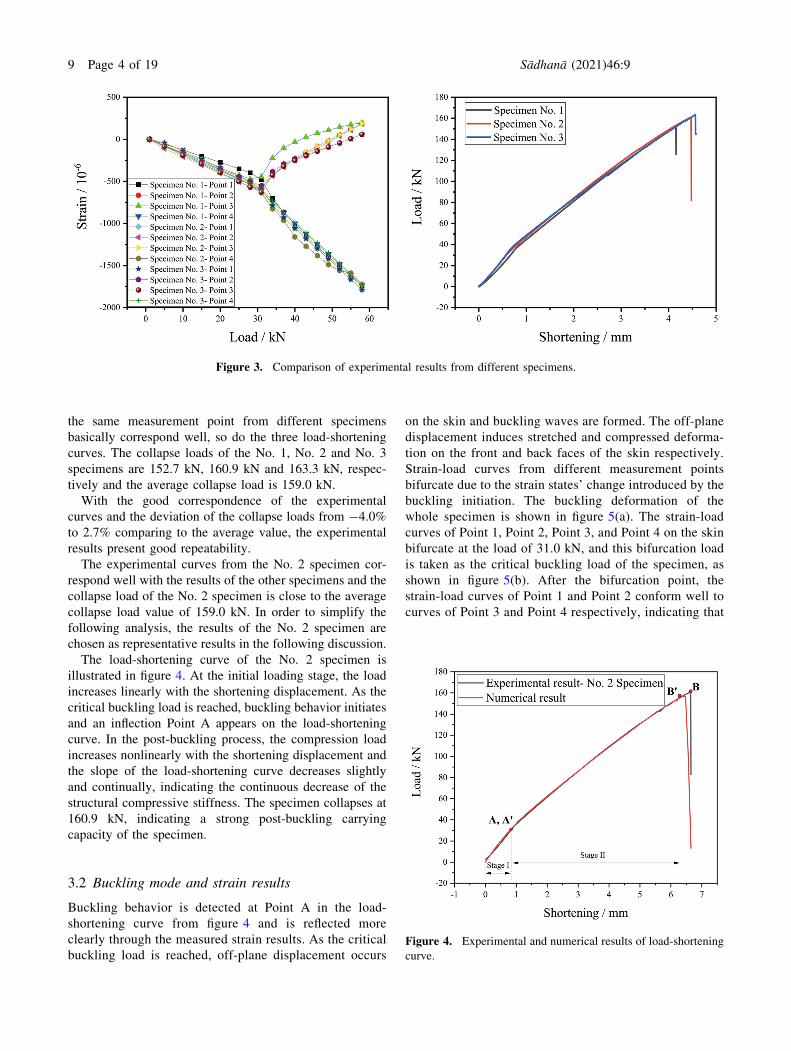
the same measurement point from different specimens
basically correspond well, so do the three load-shortening
curves. The collapse loads of the No. 1, No. 2 and No. 3
specimens are 152.7 kN, 160.9 kN and 163.3 kN, respec-
tively and the average collapse load is 159.0 kN.
With the good correspondence of the experimental
curves and the deviation of the collapse loads from -4.0%
to 2.7% comparing to the average value, the experimental
results present good repeatability.
The experimental curves from the No. 2 specimen cor-
respond well with the results of the other specimens and the
collapse load of the No. 2 specimen is close to the average
collapse load value of 159.0 kN. In order to simplify the
following analysis, the results of the No. 2 specimen are
chosen as representative results in the following discussion.
The load-shortening curve of the No. 2 specimen is
illustrated in figure 4. At the initial loading stage, the load
increases linearly with the shortening displacement. As the
critical buckling load is reached, buckling behavior initiates
and an inflection Point A appears on the load-shortening
curve. In the post-buckling process, the compression load
increases nonlinearly with the shortening displacement and
the slope of the load-shortening curve decreases slightly
and continually, indicating the continuous decrease of the
structural compressive stiffness. The specimen collapses at
160.9 kN, indicating a strong post-buckling carrying
capacity of the specimen.
3.2 Buckling mode and strain results
Buckling behavior is detected at Point A in the load-
shortening curve from figure 4 and is reflected more
clearly through the measured strain results. As the critical
buckling load is reached, off-plane displacement occurs
on the skin and buckling waves are formed. The off-plane
displacement induces stretched and compressed deforma-
tion on the front and back faces of the skin respectively.
Strain-load curves from different measurement points
bifurcate due to the strain states’ change introduced by the
buckling initiation. The buckling deformation of the
whole specimen is shown in figure 5(a). The strain-load
curves of Point 1, Point 2, Point 3, and Point 4 on the skin
bifurcate at the load of 31.0 kN, and this bifurcation load
is taken as the critical buckling load of the specimen, as
shown in figure 5(b). After the bifurcation point, the
strain-load curves of Point 1 and Point 2 conform well to
curves of Point 3 and Point 4 respectively, indicating that
Figure 3. Comparison of experimental results from different specimens.
Figure 4. Experimental and numerical results of load-shortening
curve.
9 Page 4 of 19 Sådhanå (2021) 46:9
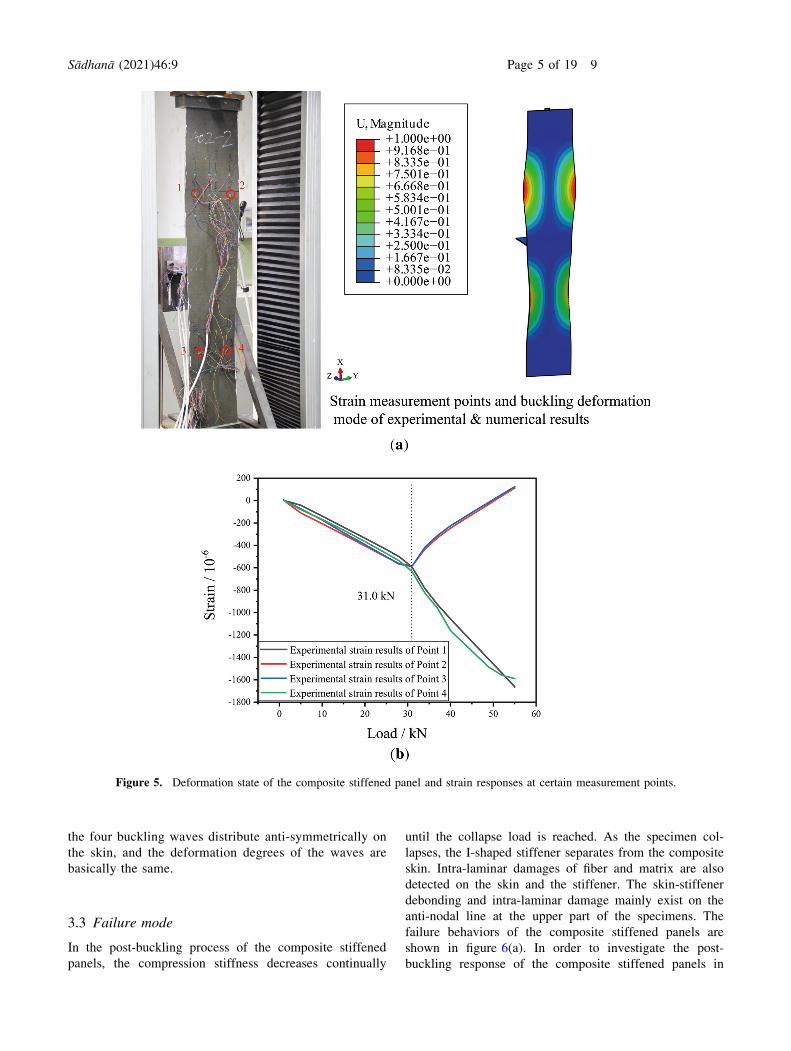
the four buckling waves distribute anti-symmetrically on
the skin, and the deformation degrees of the waves are
basically the same.
3.3 Failure mode
In the post-buckling process of the composite stiffened
panels, the compression stiffness decreases continually
until the collapse load is reached. As the specimen col-
lapses, the I-shaped stiffener separates from the composite
skin. Intra-laminar damages of fiber and matrix are also
detected on the skin and the stiffener. The skin-stiffener
debonding and intra-laminar damage mainly exist on the
anti-nodal line at the upper part of the specimens. The
failure behaviors of the composite stiffened panels are
shown in figure 6(a). In order to investigate the post-
buckling response of the composite stiffened panels in
Figure 5. Deformation state of the composite stiffened panel and strain responses at certain measurement points.
Sådhanå (2021) 46:9 Page 5 of 19 9
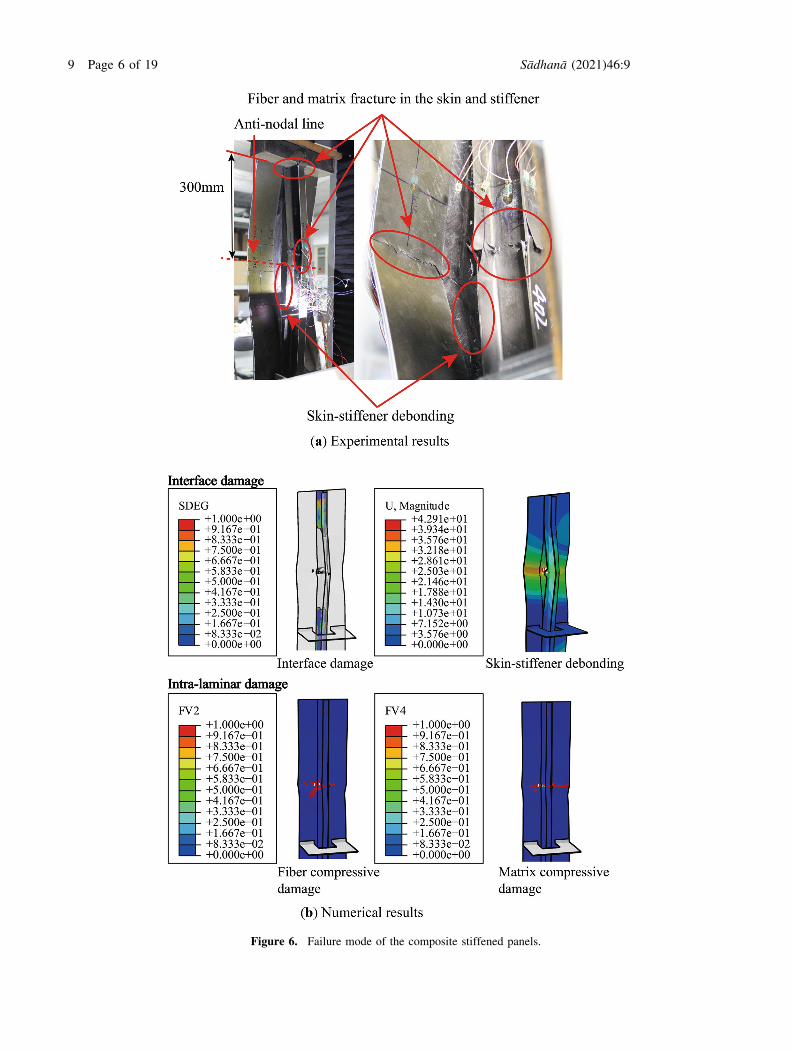
Figure 6. Failure mode of the composite stiffened panels.
9 Page 6 of 19 Sådhanå (2021) 46:9
detail, a numerical analysis based on finite-element method
is implemented.
4. Finite element analysis
4.1 Finite element model
The composite I-stiffened panel was numerically modeled
and analyzed through finite-element methods. The geome-
try and material properties of the FE model were consistent
with the specimen as shown in figure 1, table 1 and table 2.
As skin-stiffener debonding had remarkable influence on
the structural final collapse, interface cohesive elements
were utilized in the FE model in simulating the skin-stiff-
ener debonding. Sufficient amount of elements are needed
in discretizing the structure to model the details of the
composite stiffened panel. The minimum size of the ele-
ment is determined referring to the size of the strain gauge
in order to acquire the calculated strain results. With the
considerations of both the calculation precision and the
calculation efficiency, 8022 elements were finally used in
the FE model. 7314 elements were continuum shell ele-
ments of SC8R, which modeled the composite skin, stiff-
ener and the rib support. 708 elements were cohesive
elements of COH3D8, which modeled the interface
between the skin and the stiffener. The connection between
the lateral support and the composite panel skin was sim-
ulated by ‘Tie’.
4.2 Damage initiation criteria and evolutionmodel
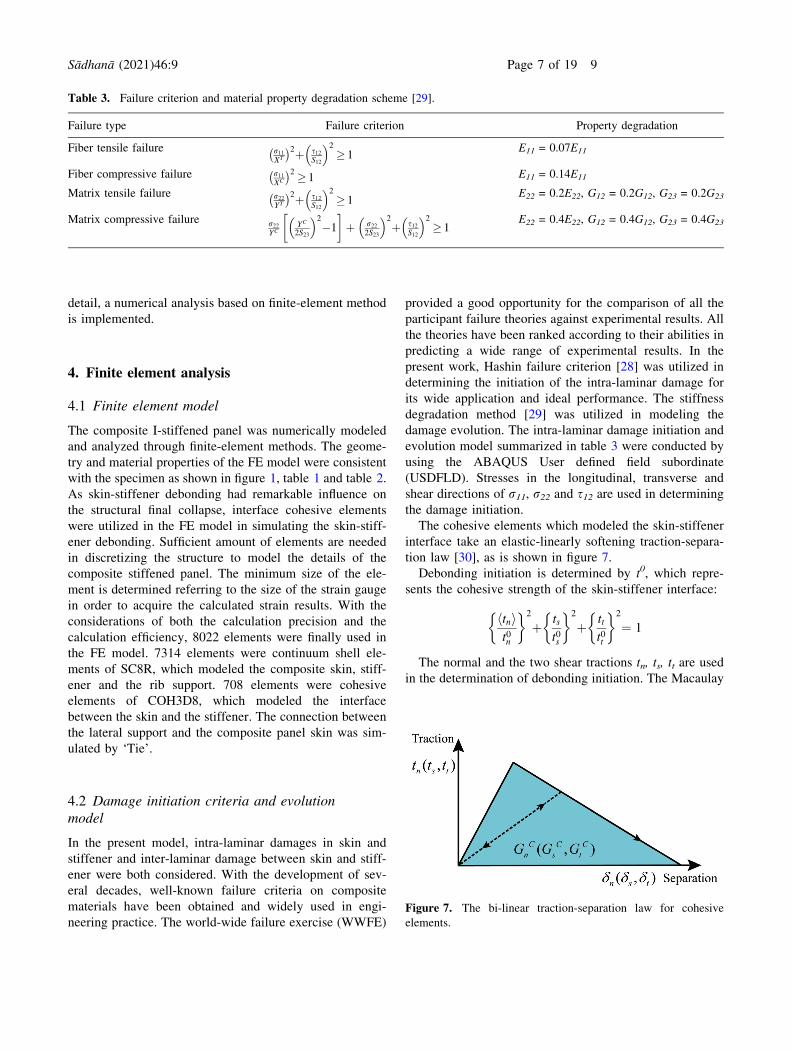
In the present model, intra-laminar damages in skin and
stiffener and inter-laminar damage between skin and stiff-
ener were both considered. With the development of sev-
eral decades, well-known failure criteria on composite
materials have been obtained and widely used in engi-
neering practice. The world-wide failure exercise (WWFE)
provided a good opportunity for the comparison of all the
participant failure theories against experimental results. All
the theories have been ranked according to their abilities in
predicting a wide range of experimental results. In the
present work, Hashin failure criterion [28] was utilized in
determining the initiation of the intra-laminar damage for
its wide application and ideal performance. The stiffness
degradation method [29] was utilized in modeling the
damage evolution. The intra-laminar damage initiation and
evolution model summarized in table 3 were conducted by
using the ABAQUS User defined field subordinate
(USDFLD). Stresses in the longitudinal, transverse and
shear directions of r11, r22 and s12 are used in determining
the damage initiation.
The cohesive elements which modeled the skin-stiffener
interface take an elastic-linearly softening traction-separa-
tion law [30], as is shown in figure 7.
Debonding initiation is determined by t0, which repre-
sents the cohesive strength of the skin-stiffener interface:
htnit0n
� �2
þ tst0s
� �2
þ ttt0t
� �2
¼ 1
The normal and the two shear tractions tn, ts, tt are used
in the determination of debonding initiation. The Macaulay
Table 3. Failure criterion and material property degradation scheme [29].
Failure type Failure criterion Property degradation
Fiber tensile failure r11XT
� �2þ s12S12
� �2
� 1E11 = 0.07E11
Fiber compressive failure r11XC
� �2 � 1 E11 = 0.14E11
Matrix tensile failure r22YT
� �2þ s12S12
� �2
� 1E22 = 0.2E22, G12 = 0.2G12, G23 = 0.2G23
Matrix compressive failure r22YC
YC
2S23
� �2
�1
� þ r22
2S23
� �2
þ s12S12
� �2
� 1E22 = 0.4E22, G12 = 0.4G12, G23 = 0.4G23
Figure 7. The bi-linear traction-separation law for cohesive
elements.
Sådhanå (2021) 46:9 Page 7 of 19 9
bracket hi implies that a compressive normal stress does not
contribute to the debonding initiation.
The propagation of the debonding is determined by a
power law which is based on the strain energy release rate:
Gn
GCn
� �þ Gs
GCs
� �þ Gt
GCt
� �¼ 1
The interface cohesive energy is presented as G and the
critical strain energy release rate of the interface is pre-
sented as GC. Subscript n, s and t refer to the normal and
two shear directions respectively.
As fracture values used for skin-stiffener interface are
remarkably influenced by the technique applied in inte-
grating the skin and stiffener, they are always relatively
small comparing to the results tested from laminates.
Referred from [19], the cohesive properties used in this
paper are chosen in consideration of the co-curing bonding
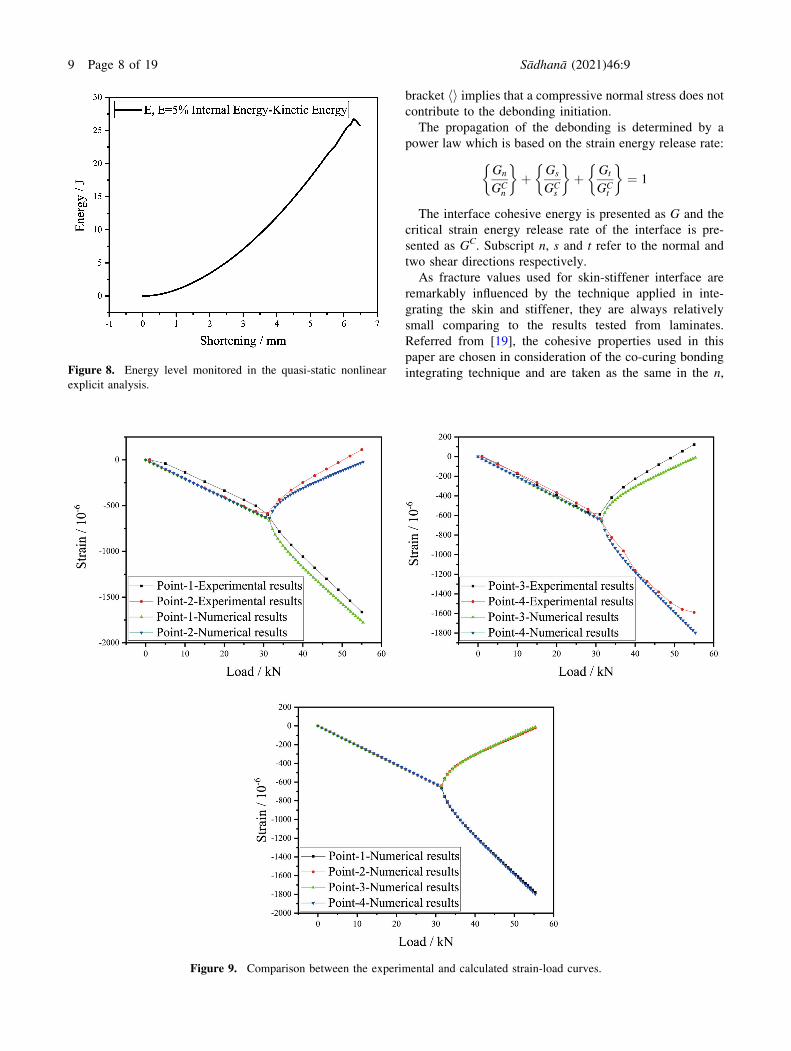
integrating technique and are taken as the same in the n,Figure 8. Energy level monitored in the quasi-static nonlinear
explicit analysis.
Figure 9. Comparison between the experimental and calculated strain-load curves.
9 Page 8 of 19 Sådhanå (2021) 46:9
s and t directions. The properties are listed in table 1 and
are validated in the subsequent analysis.
4.3 Model validation
With the above FE model, a linear buckling analysis was
first carried out. The critical buckling load was calculated
from the eigenvalue, and the corresponding buckling
deformation mode was also obtained.
Considering the deformation of the specimen is relatively
small at the initiation of the structural buckling, the method
of linear buckling analysis is suitable in predicting the
structural critical buckling load and buckling deformation
mode. The numerical results give a confirmation on this
point. In the linear buckling analysis, the calculated critical
buckling load is 32.7 kN. The first buckling mode obtained
from the linear buckling analysis is shown and compared
with the experimental buckling deformation mode in fig-
ure 5(a). The critical buckling load from the linear buckling
analysis has a 5.5% deviation compared to the experimental
result of No. 2 specimen and the calculated buckling mode
corresponds well with the experimental buckling defor-
mation mode which is reflected by the strain results.
In the subsequent nonlinear analysis, to avoid the con-
vergence problem in modeling the progressive skin-stiff-
ener debonding, the explicit analysis method was used. The
first buckling mode obtained from the linear analysis was
imported into the nonlinear quasi-static explicit analysis as
the initial imperfection of the structure. To ensure the
quasi-static state of the explicit solution, the kinetic energy
was monitored and kept less than 5% of the internal energy
of the system, as is shown in figure 8.
The structural deformation response and failure mode
were simulated. The results in figure 4 indicate a good
agreement between the numerical and experimental load-
shortening curves. Furthermore, the calculated strain results
of Point 1, 2, 3 and 4 are compared to the experimental
results in order to validate the FE model in detail, as is
shown in figure 9. A good agreement of the strain results
has been obtained, indicating the capability of the FE model
in predicting the structural buckling and post-buckling
behavior.
In figure 6(b), scalar stiffness degradation (SDEG) of the
skin-stiffener interface elements is presented in describing
the interface damage and deformation result (U, Magni-
tude) is presented in describing the skin-stiffener debond-
ing. Furthermore, predefined field variables (FV) are used
in describing the intra-laminar damage, with FV 2 repre-
sents the fiber compressive damage and FV 4 represents the
matrix compressive damage. The simulated failure behav-
iors of skin-stiffener debonding and intra-laminar damage
in the skin and the stiffener shown in figure 6(b) basically
correspond to the experimental results in figure 6(a). The
numerical collapse load of 157.8 kN has a -1.9% deviation
comparing to the experimental collapse load of 160.9 kN
from specimen No. 2. The detailed failure process of the
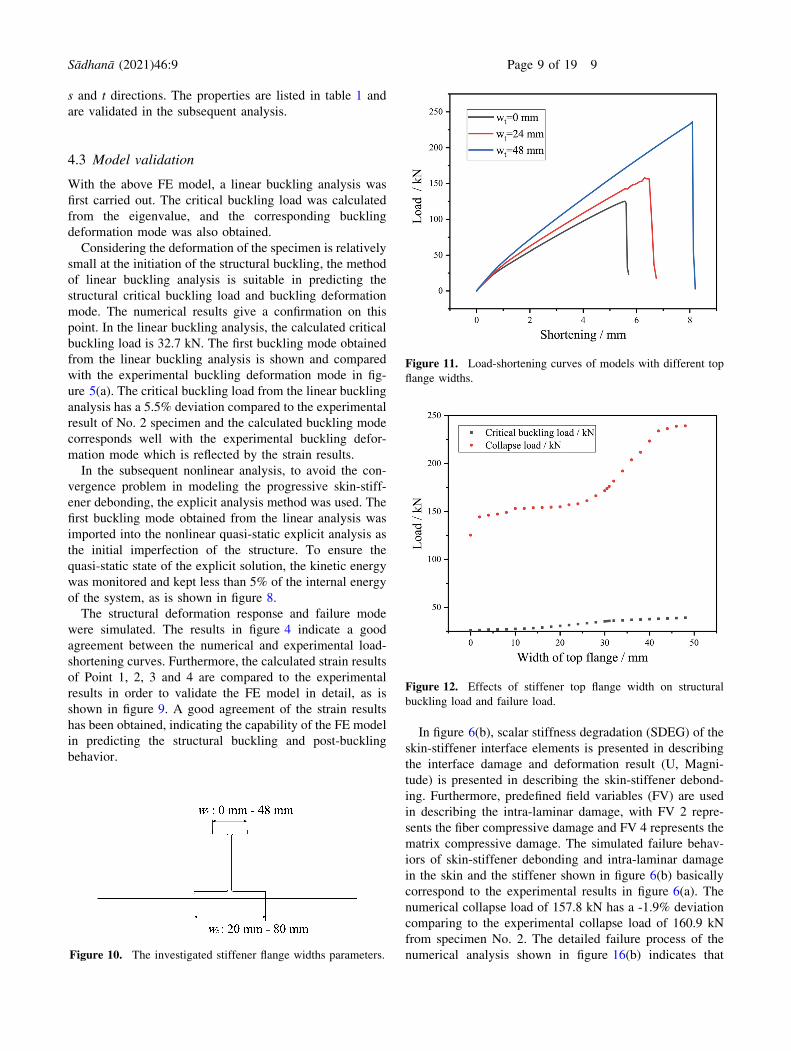
numerical analysis shown in figure 16(b) indicates thatFigure 10. The investigated stiffener flange widths parameters.
Figure 11. Load-shortening curves of models with different top
flange widths.
Figure 12. Effects of stiffener top flange width on structural
buckling load and failure load.
Sådhanå (2021) 46:9 Page 9 of 19 9
slight intra-laminar damage is first detected on the skin and
stiffener. Skin-stiffener debonding initiates and propagates
subsequently, leading to the final collapse of the composite
stiffened panel.
With the above results, the FE model is well validated in
the aspects of strain-load curves, load-shortening curves,
critical buckling load, buckling deformation mode, collapse
load and failure mode of the composite stiffened panels.
Therefore, the FE model has the capacity in predicting the
post-buckling response of the composite I-stiffened panels
under axial compression load.
5. Parametric analyses
In order to study the influences of the stiffener flange
widths on the structural stability and post-buckling
response, a parametric investigation based on the FE model
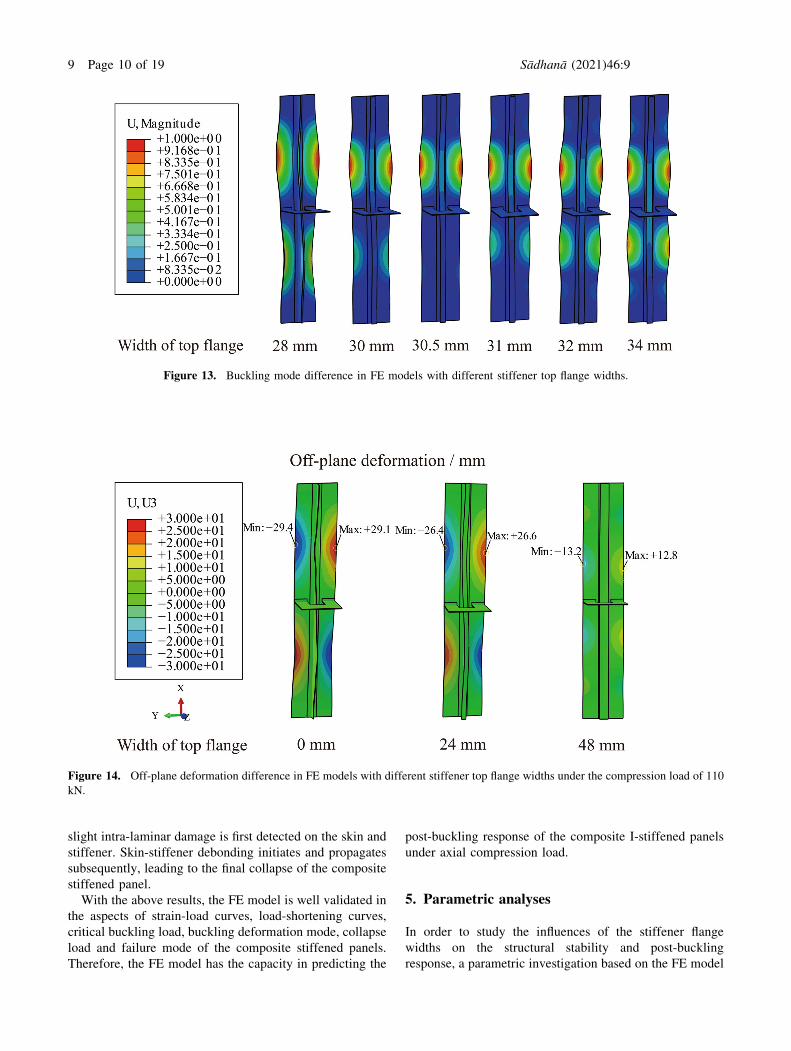
Figure 13. Buckling mode difference in FE models with different stiffener top flange widths.
Figure 14. Off-plane deformation difference in FE models with different stiffener top flange widths under the compression load of 110
kN.
9 Page 10 of 19 Sådhanå (2021) 46:9
described in section 4.1 was conducted. In the investiga-
tion, the buckling mode and critical buckling load were
calculated through linear buckling analysis in consideration
of both accuracy and efficiency. The post-buckling process
was simulated through explicit nonlinear analysis. The
investigated parameters included the width of the stiffener
top flange wt and the width of the stiffener bottom flange
wb, as shown in figure 10. The values of wt and wb are
24 mm and 50 mm in the specimens respectively, which
are chosen as the medians in the parametric analysis. For
the parameter of wt, as the minimum value is limited to
0 mm, models with wt from 0 mm to 48 mm have been
analyzed. Considering the interference limit of the lateral
rib support, the maximum value of wb is 80 mm. With the
median of 50 mm, the investigated value range of wb is
20 mm–80 mm. Weighing the calculation cost and the
sample size, the sampling interval of the flange widths is
determined as 2 mm.
5.1 Effects of top flange width
In the parametric analyses, results from FE models with wt
from 0 mm to 48 mm have been obtained. The load-
shortening curves of models with the minimum wt of 0 mm,
the wt median of 24 mm and the maximum wt of 48 mm are
compared in figure 11. The positions of the inflection points
on the curves indicate that the buckling initiation of the
composite panels is postponed with the increase of wt, and
the critical buckling loads have been increased. The dif-
ference of the curves’ slopes and peak points indicate that
the compressive stiffness of the panels together with the
carrying capacity have been enhanced with the increase of
wt. The top flange width has effect on the structural damage
process, which is reflected by the load-shortening response.
In the post-buckling process of the FE model with the wt
value of 24 mm, intra-laminar damages initiate at the top
and bottom end regions of the composite stiffened panel
within a limited scale, causing the load-shortening curve
slightly fluctuates before the structural final collapse.
The variation of the structural critical buckling load and
collapse load with the rise of wt is illustrated in figure 12. It
is indicated that the structural stability and carrying
capacity have been enhanced with the increase of the top
flange width. It is obvious that as the cross section area
increases with the rise of wt, the corresponding decrease of
compressive stress level under the same compression load
will delay the damage initiation and enhance the carrying
capacity. In the following analyses, the effects of wt on the
structural buckling deformation mode, the structural tor-
sional stiffness and the skin-stiffener interface stress state
have been investigated in revealing the mechanism of the
above influences of wt.
In figure 13, the first buckling modes of panels with typ-
ical different wt values from linear buckling analyses are
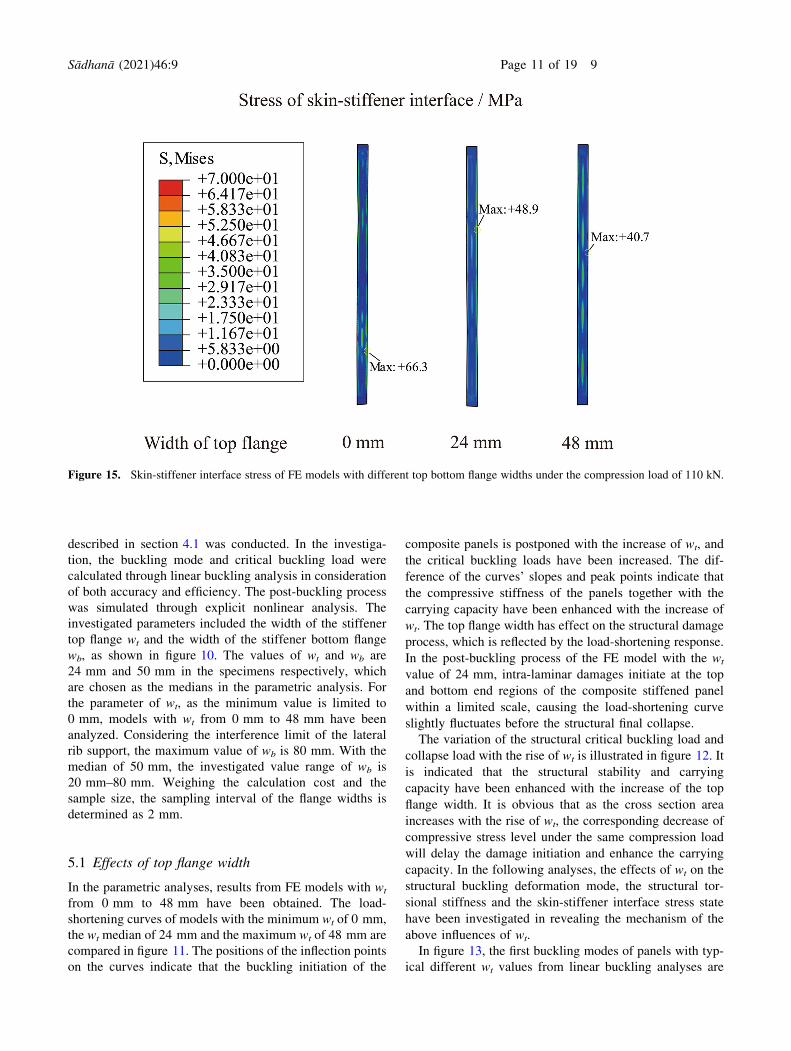
Figure 15. Skin-stiffener interface stress of FE models with different top bottom flange widths under the compression load of 110 kN.
Sådhanå (2021) 46:9 Page 11 of 19 9
listed and compared. As the wt increases from 30 mm to
32 mm, there is an obvious buckling mode transition of
the panels. Changes of the locations, number and states
of the buckling waves are detected on the skin. With
further investigations, an approximate intermediate
buckling mode is detected when wt equals to 30.5 mm.
As the first buckling mode is taken as the initial
imperfection imported in the post-buckling analysis, the
choice of wt further influences the post-buckling response
of the composite panel with its effects on the structural
buckling deformation mode.
The increase of wt also has effects on the structural
stiffness. Results in figure 11 indicate that the compressive
stiffness of the composite stiffened panel is enhanced with
the rise of wt. Furthermore, the structural torsional stiffness
is also influenced by wt. In figure 14, off-plane deformation
results of models with different wt values corresponding to
figure 11 in the post-buckling process under the same
compression load of 110 kN are listed and compared. The
load of 110 kN is taken as a typical compression load in the
composite stiffened panels’ post-buckling process. With the
increase of the panels’ torsional stiffness, off-plane
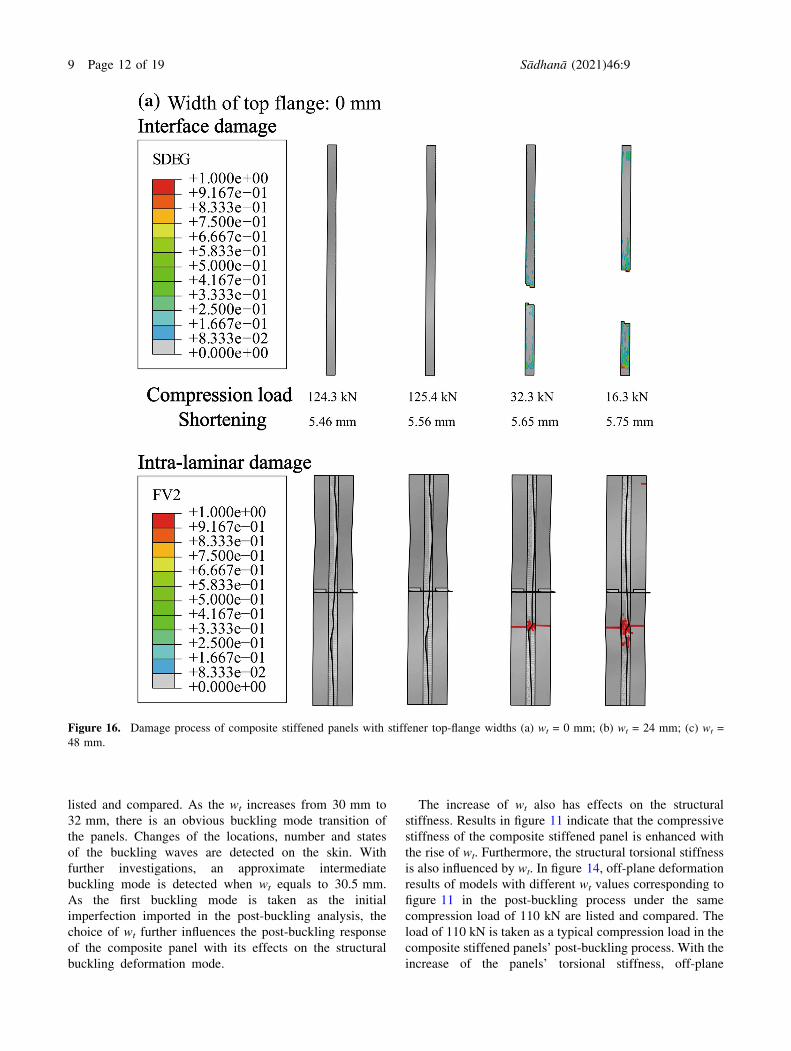
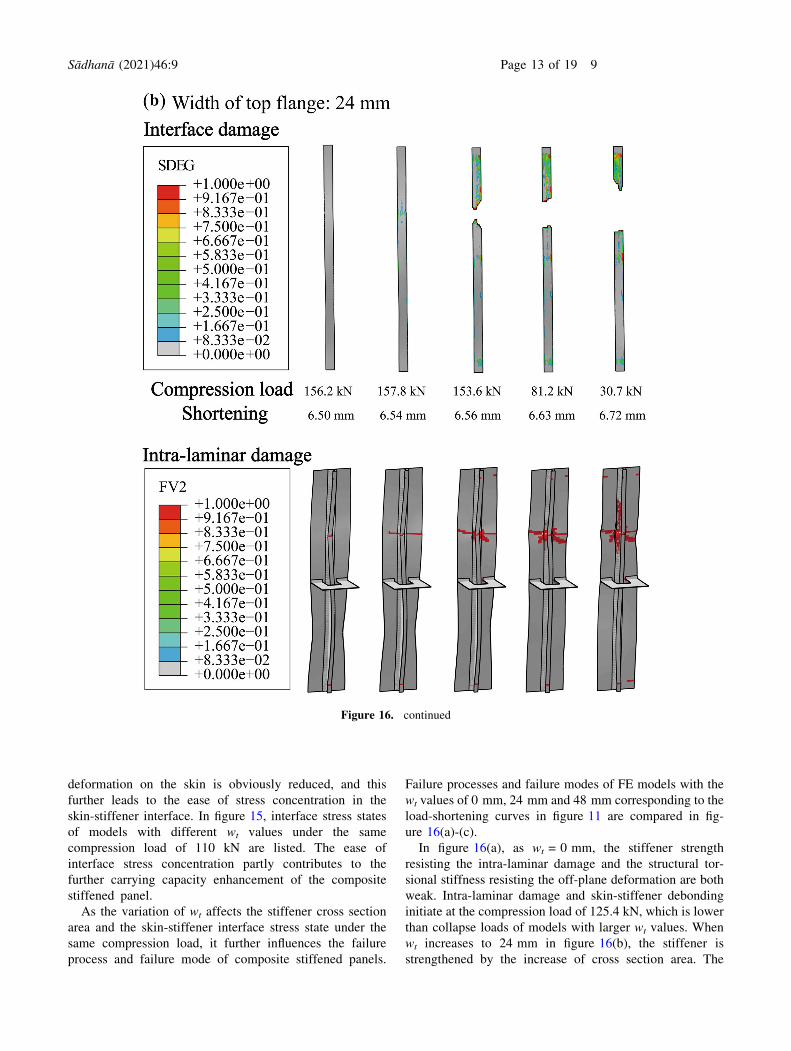
Figure 16. Damage process of composite stiffened panels with stiffener top-flange widths (a) wt = 0 mm; (b) wt = 24 mm; (c) wt =
48 mm.
9 Page 12 of 19 Sådhanå (2021) 46:9
deformation on the skin is obviously reduced, and this
further leads to the ease of stress concentration in the
skin-stiffener interface. In figure 15, interface stress states
of models with different wt values under the same
compression load of 110 kN are listed. The ease of
interface stress concentration partly contributes to the
further carrying capacity enhancement of the composite
stiffened panel.
As the variation of wt affects the stiffener cross section
area and the skin-stiffener interface stress state under the
same compression load, it further influences the failure
process and failure mode of composite stiffened panels.
Failure processes and failure modes of FE models with the
wt values of 0 mm, 24 mm and 48 mm corresponding to the
load-shortening curves in figure 11 are compared in fig-
ure 16(a)-(c).
In figure 16(a), as wt = 0 mm, the stiffener strength
resisting the intra-laminar damage and the structural tor-
sional stiffness resisting the off-plane deformation are both
weak. Intra-laminar damage and skin-stiffener debonding
initiate at the compression load of 125.4 kN, which is lower
than collapse loads of models with larger wt values. When
wt increases to 24 mm in figure 16(b), the stiffener is
strengthened by the increase of cross section area. The
Figure 16. continued
Sådhanå (2021) 46:9 Page 13 of 19 9
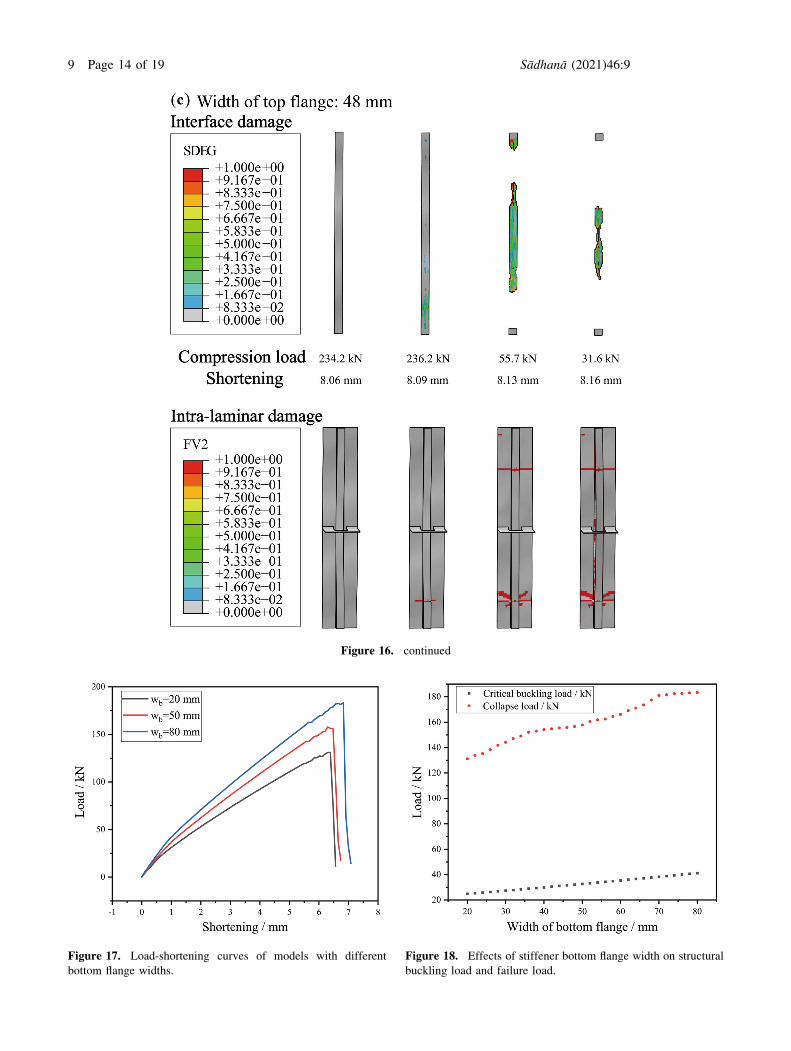
Figure 16. continued
Figure 17. Load-shortening curves of models with different
bottom flange widths.
Figure 18. Effects of stiffener bottom flange width on structural
buckling load and failure load.
9 Page 14 of 19 Sådhanå (2021) 46:9
structural torsional stiffness is enhanced by the ease of skin-
stiffener interface stress state. The skin-stiffener debonding
is postponed after the initiation of intra-laminar damage,
and the structural collapse load is increased. For the FE
model with the wt value of 48 mm, the post-buckling car-
rying capacity is further enhanced and the failure position
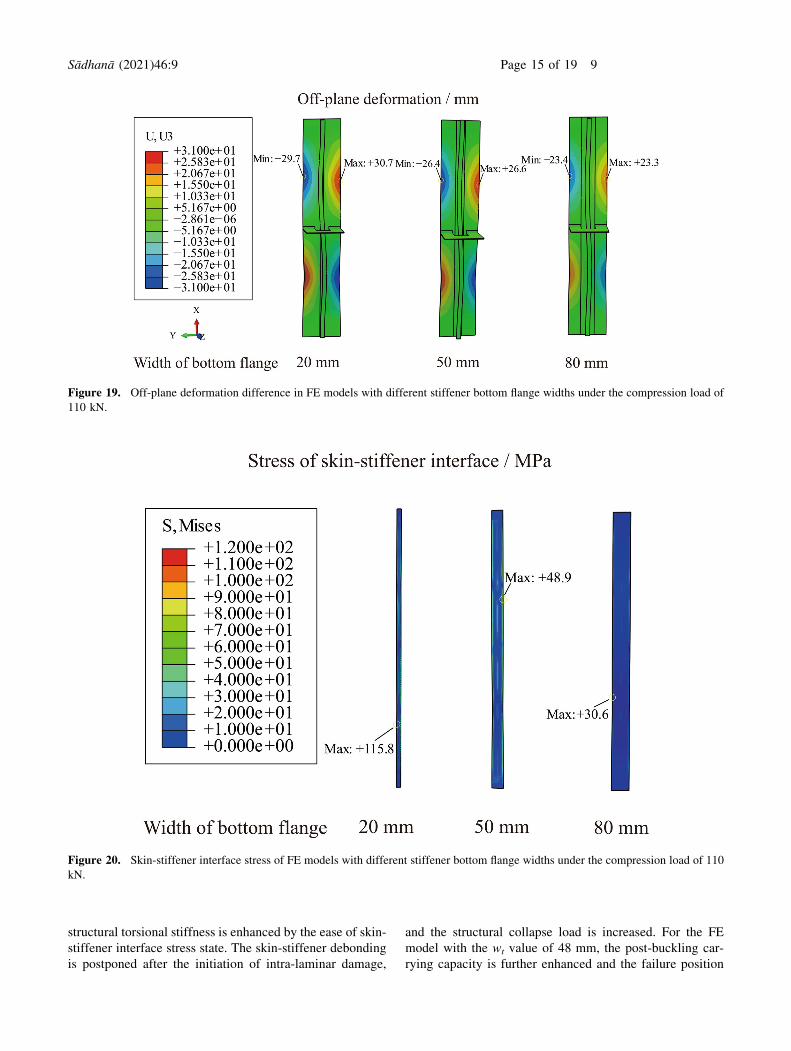
Figure 19. Off-plane deformation difference in FE models with different stiffener bottom flange widths under the compression load of
110 kN.
Figure 20. Skin-stiffener interface stress of FE models with different stiffener bottom flange widths under the compression load of 110
kN.
Sådhanå (2021) 46:9 Page 15 of 19 9
has changed due to the variation of buckling mode, as
shown in figure 16(c).
5.2 Effects of bottom flange width
Series of models with the wb values from 20 mm to 80 mm
have been established in investigating the bottom flange
width effects on the panels’ buckling and post-buckling
behavior. The load-shortening curves of models with the
minimum wb of 20 mm, the wb median of 50 mm and the
maximum wb of 80 mm are compared in figure 17. From
the numerical results, intra-laminar damages initiate at the
top and bottom end regions of the models within a limited
scale, causing the load-shortening curve slightly fluctuates
before the final collapse. The results indicate that by
increasing the bottom flange width, the critical buckling
load together with the collapse load and the structural
compressive stiffness have been raised.
The effects of bottom flange width on the critical buck-
ling load and collapse load of composite stiffened panels
are shown in figure 18. The results indicate that the buck-
ling load varies linearly with the increase of wb. Comparing
to the effects of wt on the structural collapse load shown in
figure 12, enhancing the collapse load by varying the bot-
tom flange width is less efficient.
According to the FE results, the value of wb mainly
affects the critical buckling load and has no effects on the
buckling mode. With the variation of wb, the torsional
stiffness of the composite stiffened panels is changed.
Under the same compression load of 110 kN in the post-
buckling process, off-plane deformation results of models
with different wb values are shown in figure 19. Comparing
to the results in figure 14, the effects of wb on the panels’
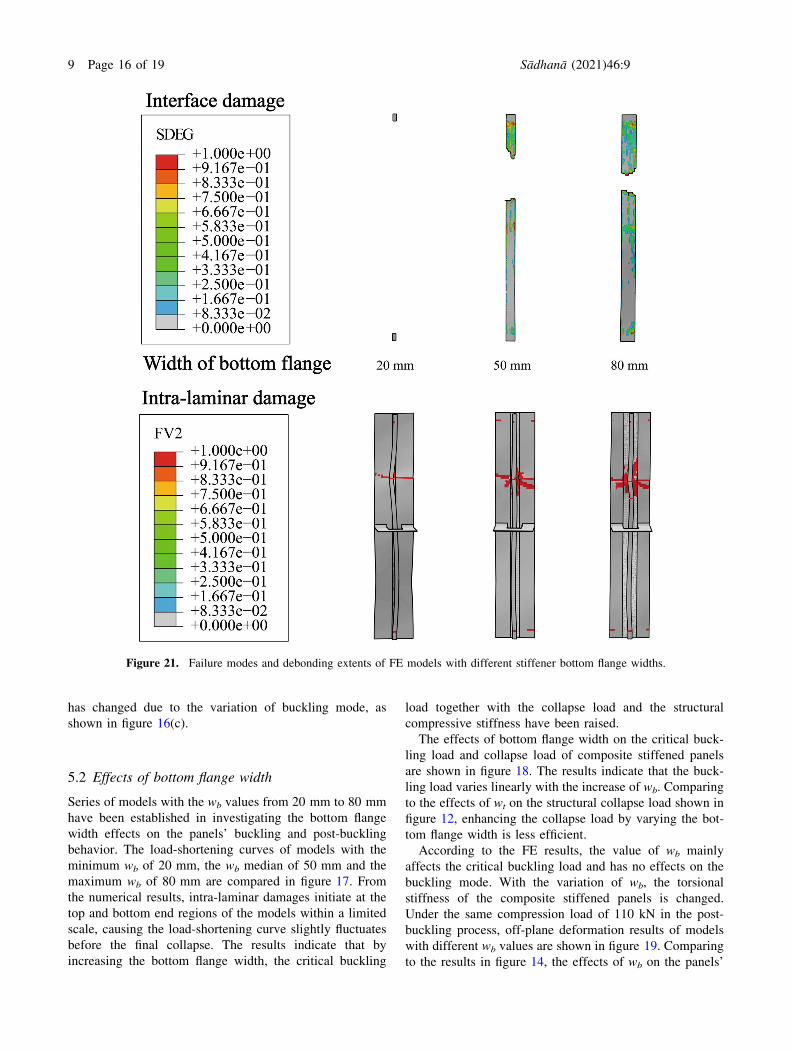
Figure 21. Failure modes and debonding extents of FE models with different stiffener bottom flange widths.
9 Page 16 of 19 Sådhanå (2021) 46:9
torsional stiffness is not as obvious as wt. But as wb in
addition changes skin-stiffener bonding area, it still has
effects on the skin-stiffener interface stress state. In fig-
ure 20, stress states of the skin-stiffener interface from
models with different wb values under the compression load
of 110 kN are compared.
The results indicate that by increasing wb, the skin-
stiffener interface stress is obviously reduced. The failure
modes and final extents of skin-stiffener debonding of
models with different wb values are shown in figure 21. As
the skin-stiffener bonding area is increased, skin-stiffener
interface damage initiates at higher compression load and
skin-stiffener debonding is harder to propagate. Degrees of
intra-laminar damage in the skin and stiffener of composite
stiffened panels with lager values of wb are more serious
due to the higher collapse loads.
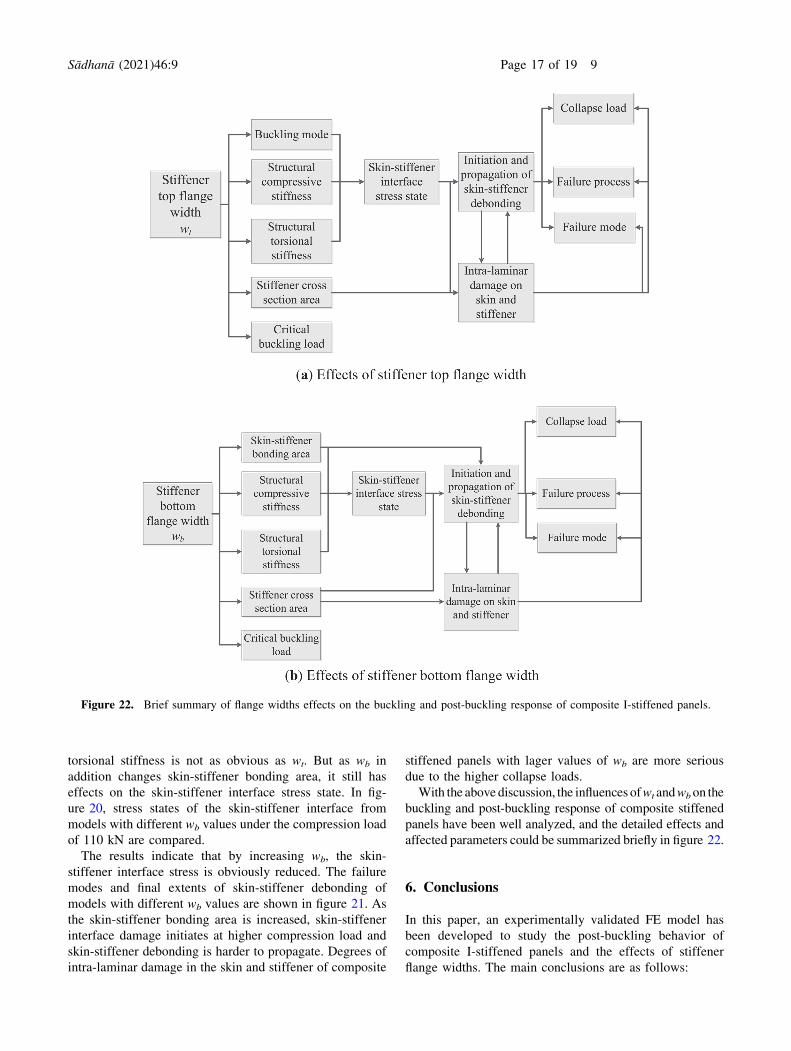
With the above discussion, the influences ofwt andwbon the
buckling and post-buckling response of composite stiffened
panels have been well analyzed, and the detailed effects and
affected parameters could be summarized briefly in figure 22.
6. Conclusions
In this paper, an experimentally validated FE model has
been developed to study the post-buckling behavior of
composite I-stiffened panels and the effects of stiffener
flange widths. The main conclusions are as follows:
Figure 22. Brief summary of flange widths effects on the buckling and post-buckling response of composite I-stiffened panels.
Sådhanå (2021) 46:9 Page 17 of 19 9
(1) A linear bearing stage exists before the initiation of the
panels’ buckling behavior, and linear buckling analysis
method is suitable in predicting the critical buckling
load and buckling mode with the advantages in
accuracy and efficiency.
(2) The explicit analysis used in this work with the first
buckling mode imported as the initial geometric
imperfection is applicable in predicting the post-buck-
ling response of the composite stiffened panels, since
the results are validated by experimental results in the
aspects of load-shortening curves, strain-load curves,
buckling instability and failure modes.
(3) The failure mode of the composite stiffened panels
includes correlated failure behaviors of skin-stiffener
debonding and intra-laminar damage in the skin and
stiffener. The buckling instability, post-buckling carry-
ing capacity and failure mode of the investigated
composite stiffened panels are sensitive to the param-
eters of stiffener top flange width wt and stiffener
bottom flange width wb.
(4) The parameter of wt affects the buckling mode and
critical buckling load of the composite stiffened panels,
and obviously influences the structural carrying capac-
ity and failure process with its effects on the stiffener
cross section area, structural compressive stiffness and
structural torsional stiffness.
(5) The parameter of wb linearly affects the structural
critical buckling load and has no effects on the buckling
mode within the investigated value range in this work.
With the effects on the bonding area and structural
torsional stiffness, the variation of wb obviously affects
the skin-stiffener interface stress state and further
influences the structural collapse load, failure process
and degree of intra-laminar damage in the structural
final collapse.
(6) In order to enhance the mechanical performance of the
composite stiffened panels in the aspects of buckling
stability and post-buckling carrying capacity, it is more
efficient to adjust the parameter of wt under the same
weight cost.
Acknowledgements
The first author would like to thank Dr. Yue Liu for helpful
discussions on the topics of this paper.
References
[1] Sastry Y B S, Budarapu P R, Madhavi N and Krishna Y 2015
Buckling analysis of thin wall stiffened composite panels.
Comp. Mater. Sci. 96: 459-471[2] Wang X M, Cao W, Deng C H, Wang P Y and Yue Z F 2015
Experimental and numerical analysis for the post-buckling
behavior of stiffened composite panels with impact damage.
Compos. Struct. 133: 840-846[3] Zhu S, Yan J, Chen Z, Tong M and Wang Y 2015 Effect of
stiffener stiffness on the buckling and post-buckling behavior
of stiffened composite panels- experimental investigation.
Compos. Struct. 120: 334-345[4] Kumar D and Singh S B 2010 Post-buckling strengths of
composite laminate with various shaped cutouts under in-
plane shear. Compos. Struct. 92: 2966-2978[5] Lei Z K, Bai R X, Qiu W and Zhang L 2012 Optical
evaluation of the buckling behavior of stiffened composite
laminates. Compos. Part A-Appl. Sci. 43: 1850-1859[6] Perret A, Mitou S, Fazzini M and Brault R 2012 Global
behavior of a composite stiffened panel in buckling. Part 2
experimental investigation. Compos. Struct. 94: 376-385[7] Huang L, Sheikh A H, Ng CT and Griffith M C 2015 An
efficient finite element model for buckling analysis of grid
stiffened laminated composite plates. Compos. Struct. 122:41-50
[8] Degenhardt R, Kling A, Rohwer K, Orifici A C and Thomson
R S 2008 Design and analysis of stiffened composite panels
including post-buckling and collapse. Compos. Struct. 86:919-929
[9] Sun W, Guan Z, Li Z, Ouyang T and Jiang Y 2018 Modeling
and simulating of the compressive behavior of T-stiffened
composite panels subjected to stiffener impact. Compos.Struct. 186: 221-232
[10] Romano F, Caprio F D, Auriemma B and Mercurio U 2015
Numerical investigation on the failure phenomenon of
stiffened composite panels in post-buckling regime with
discrete damages. Eng. Fail. Anal. 56: 116-130[11] Fuhrer T 2017 Stiffness degradation of composite skin fields
due to strength and buckling onset. Thin Wall Struct. 119:522-530
[12] Mo Y M, Ge D Y and Zhou J F 2015 Experiment and
analysis of hat-stringer stiffened composite curved panels
under axial compression. Compos. Struct. 123: 150-160[13] Su Y, Guan Z, Wang X, Li Z, Guo J and Huang Y 2019
Buckling and post-buckling behavior of titanium alloy
stiffened panels under shear load. Chinese J. Aeronaut. 32:619-626
[14] Liu X, Han K, Bai R, Lei Z and Wang H 2014 Buckling
measurement and numerical analysis of M-type ribs stiffened
composite panel. Thin Wall Struct. 85: 117-124[15] Abramovich H, Govich D and Grunwald A 2015 Buckling
prediction of panels using the vibration correlation tech-
nique. Prog. Aerosp. Sci. 78: 62-73[16] Kolanu N R, Raju G and Ramji M 2018 Experimental and
numerical studies on the buckling and post-buckling behav-
ior of single blade-stiffened CFRP panels. Compos. Struct.196: 135-154.
[17] Bai R, Bao S, Lei Z, Liu C, Chen Y, Liu D and Yan C 2018
Experimental study on compressive behavior of I-stiffened
CFRP panel using fringe projection profilomtry. Ocean Eng.160: 382-388
[18] Liu D, Bai R, Wang R, Lei Z and Yan C 2019 Experimental
study on compressive buckling behavior of J-stiffened
composite panels. Opt. Laser Eng. 120: 31-39[19] Bisagin C and Vescovini R 2009 Analytical formulation for
local buckling and post-buckling analysis of stiffened
laminated panels. Thin Wall Struct. 47: 318-334
9 Page 18 of 19 Sådhanå (2021) 46:9
[20] Mittelstedt C and Schroder K U 2010 Local post-buckling of
hat-stringer-stiffened composite laminated plates under
transverse compression. Compos. Struct. 92: 2830-2844[21] Vescovini R and Bisagni C 2013 Two-step procedure for fast
post-buckling analysis of composite stiffened panels. Com-pos. Struct. 128: 38-47
[22] Ye Y, Zhu W, Jiang J, Xu Q and Ke Y 2019 Computational
modeling of post-buckling behavior of composite T-stiffened
panels with different bonding methods. Compos. Part B-Eng.166: 247-256
[23] Sun W, Guan Z, Ouyang T, Tan R and Zhong X 2018 Effect
of stiffener damage caused by low velocity impact on
compressive buckling and failure modes of T-stiffened
composite panels. Compos Struct. 184: 198-210[24] Masood S N, Vishakh R, Viswamurthy S R, Gaddikeri K M
and Sridhar I 2018 Influence of stiffener configuration on
post-buckled response of composite panels with impact
damages. Compos. Struct. 194: 433-444
[25] Wang B, Du K, Hao P, Zhou C, Tian K, Xu S, Ma Y and
Zhang X 2016 Numerically and experimentally predicted
knockdown factors for stiffened shells under axial compres-
sion. Thin Wall Struct. 109: 13-24[26] Greenhalggh E, Meeks C, Clarkr A and Thatcher J 2003 The
effect of defects on the performance of post-buckled CFRP
stringer-stiffened panels. Compos. Part A-Appl. Sci. 34: 623-633[27] Mittelstedt C 2009 Explicit local buckling analysis of stiffened
composite plates accounting for periodic boundary conditions
and stiffener-plate interaction. Compos. Struct. 91: 249-265.[28] Hashin Z 1980 Failure criteria for unidirectional fiber
composites. J .Appl. Mech. 47: 329-334[29] Labeas G, Belesis S and Stamatelos D 2008 Interaction of
damage failure and post-buckling behavior of composite
plates with cut-outs by progressive damage modeling.
Compos. Part B-Eng. 39: 304-315[30] Simulia D S 2014 ABAQUS 6.14 user’s manual. Providence,
RI: Dassault Systems
Sådhanå (2021) 46:9 Page 19 of 19 9


![Generative Structural Design and Optimization of Modern ... · Stiffener [mm] 20 30 10 Bonded Section, Web, Crown Stiffener Spacing [mm] 100 300 100 Panel Buckling Uniaxial, Biaxial,](https://img.pdfslide.us/doc/110x75/6008b6086be1183e31013a37/generative-structural-design-and-optimization-of-modern-stiffener-mm-20-30.jpg)


![Impact and Postbuckling Analyses - imechanicaPostbuckling Analyses Geometric Imperfections for Postbuckling Analyses • Using buckling modes for imperfections]..](https://img.pdfslide.us/doc/110x75/5e279cdbcab01659037bd7a7/impact-and-postbuckling-analyses-imechanica-postbuckling-analyses-geometric-imperfections.jpg)