Embed Size (px)
Citation preview
N A S A T E C H N I C A L NOTE
EFFECTS OF SPECIFIC SPEED O N THE EXPERIMENTAL PERFORMANCE
.. .
OF A RADIAL-INFLOW TURBINE
by Mil ton G. Kofi&ey und WiZZium J. Nusbuam
Lewis Research Center
N A T I O N A L A E R O N A U T I C S AND S P A C E A D M I N I S T R A T I O N W A S H I N G T O N , D. C. FEBRUARY 1971
\, i ++
https://ntrs.nasa.gov/search.jsp?R=19710007879 2018-05-17T16:51:29+00:00Z
TECH LIBRARY KAFB, NY
NASA TN D-6182 I I 4. Title and Subtit le I 5. Report Date
EFFECTS OF SPECIFIC SPEED ON THE EXPERIMENTAL February 1971
PERFORMANCE OF A RADIAL-INFLOW TURBINE 6. Performing Organization Code
7. Author(s) -~ ~
8. Performing Organization Report No.
Milton G. Kofskey and William J. Nusbaum E-5928 ~~ . 10. Work Unit No.
9. Performing Organization Name and Address 120-27 Lewis Research Center
Cleveland, Ohio 44135 National Aeronautics and Space Administration
11. Contract or Grant No.
National Aeronautics and Space Administration Washington D. C. 20546
~ ~ ~ 13. Type o f Report and Period Covered
12. Sponsoring Agency Name and Address ~~
Technical Note 14. Sponsoring Agency Code
~~~ ~ - ~~
15. Supplementary Notes
16. Abstract
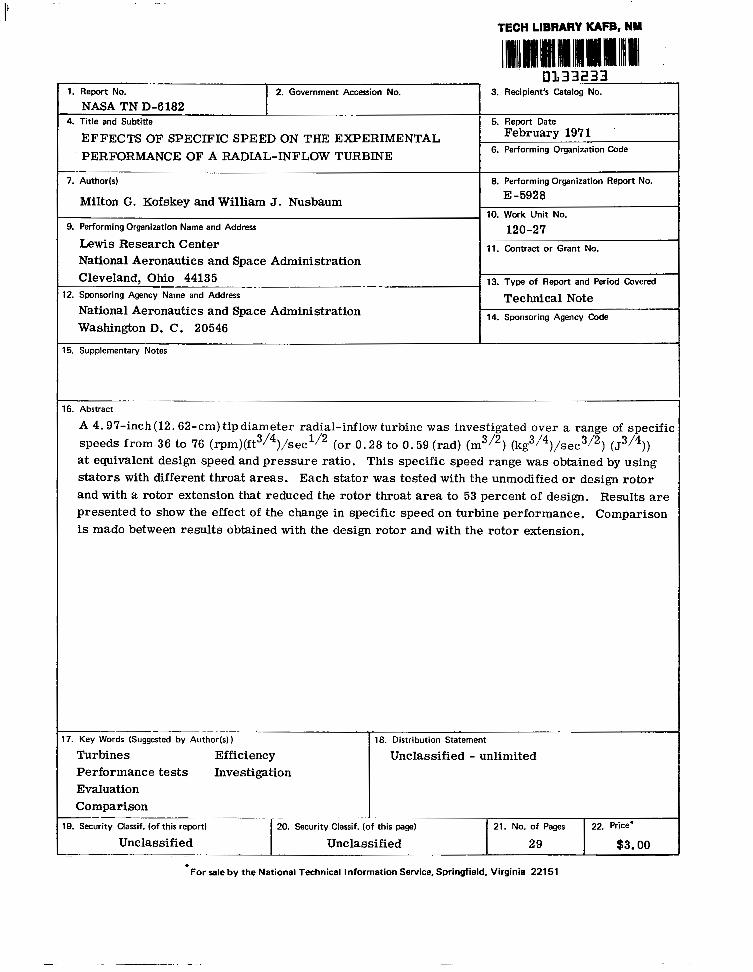
A 4.97-inch(12.62-cm) tipdiameter radial-inflow turbine was investigated over a range of specific speeds from 36 to 76 ( ~ - p m ) ( f t ~ / ~ ) / s e c ~ / ~ ( o r 0.28 to 0.59 (rad) (m3/2) (kg3/4)/sec3/2) (J3/4)) at equivalent design speed and pressure ratio. This specific speed range was obtained by using stators with different throat areas. Each stator was tested with the unmodified o r design rotor and with a rotor extension that reduced the rotor throat area to 53 percent of design. Results are presented to show the effect of the change in specific speed on turbine performance. Comparison is made between results obtained with the design rotor and with the rotor extension.
_ _ _ ~ - _ _ ""
7. Key Words (Suggested by Authoris))
Turbines Efficiency Unclassified - unlimited Performance tests Investigation Evaluation Comparison
19. Security Classif. (of th is report) I - ~~~~~
20. Security Classif. (o f this page) 21. No. of Pages 22. Price'
Unclassified Unclassified 29 $3.00 - ~ ~~
~-
F o r sale by t he Na t iona l Techn ica l I n fo rma t ion Se rv i ce , Sp r ing f i e ld , V i rg in ia 22151
EFFECTS O F SPECIFIC SPEED ON THE EXPEFUM’ENTAL PERFORMANCE
O F A RADIAL-INFLOW TURBINE
by Milton G. Kofskey and William J. Nusbaum
Lewis Research Center
SUMMARY
An experimental cold air investigation was made to determine the effect of specific speed on performance of a4.97-inch(12.62-cm)tip diameter radial-inflow turbine. The range of specific speeds investigated, 36 to 76 (rpm) (ft3/4)/sec1/2 (or 0.28 to 0.59 (rad) (m3I2) Qg3/3/(sec3’2) (J3//4) at equivalent design speed and pressure ratio, was ob- tained by changing volume flow using stators with different throat areas. These stators were operated with the design rotor and with a rotor extension that reduced rotor throat a r e a to 53 percent of design.
Results indicated that a maximum total efficiency of 0.93 could be obtained in the specific speed range of 71 (0.55) for operation with the design rotor. A maximum static efficiency value of 0.89 was obtained at a specific speed value of 66 (0.51). Oper- ation of the turbine with the rotor extension indicated a one point drop in maximum total efficiency to a value of 0.92 at a specific speed of 56 (0.43). The maximum static effi- ciency increased from 0.89 to 0.91 with the addition of the rotor extension.
An analysis was made to determine the magnitude of the various losses for each configuration at design speed and pressure ratio. Scroll-stator losses were the pre- dominant loss for operation with the design rotor. Rotor losses were the predominant loss for operation with the rotor extension.
The results indicated that, i f high efficiency is desired at specific speeds consider- ably lower than design, the design stator-rotor throat area ratio should be maintained with the decrease in stator throat area.
INTRODUCTION
One of the overall objectives of the Brayton space power program at NASA Lewis is the attainment of a mechanical design for the major components (turbine-alternator-
compressor) that could operate efficiently over a wide range of power levels. Power levels lower than design could be obtained by decreasing the pressure level in the sys- tem, but this would increase the pressure loss in the heat exchangers. If volume flow, at a constant pressure level, could be reduced by minor changes in the compressor and turbine without seriously degrading performance, then the heat exchanger performance would remain essentially constant.
One such way of reducing volume flow in the turbine, for reduced power level, is to reduce stator throat area. This causes the turbine to operate at reduced levels of spe- cific speed. Specific speed relates the operating variables of turbine rotative speed, outlet volume flow, and pressure ratio to turbine geometry and aerodynamic perform- ance.
Accordingly, investigations have been made to determine the specific speed- efficiency correlation for small radial inflow turbines through stator area variations. Reference 1 shows one such correlation for a 4.59-inch (11.66-cm) tip diameter radial inflow turbine. The design specific speed for this turbine was 95.6 (rpm) (ft 3/ 4 / s e c 1 /2 (or 0.74 (rad) (rn3/2) (kg3/9/(sec3I2) (J3/4. The specific speed units will not be used hereinafter.) This turbine was investigated over a range of specific speeds from 59 to 122 (0.45 to 0.94) by using four stators with different throat areas. The same rotor was used for each stator configuration. Results of this investigation showed that the maxi- mum efficiency was obtained in the specific speed range of 80 to 90 (0.62 to 0.70).
The 4.97-inch (12.62-cm) radial turbine of reference 2 was designed for a specific speed of 76 (0.59). This specific speed value is considerably lower than the 95.6 (0.74) of the turbine of reference 1. Hence the 4.97-inch (12.62-cm) radial turbine was con- sidered to be an excellent unit for extending the specific speed-efficiency correlation to much lower specific speed values.
Therefore, three additional stators having throat areas of 66, 42, and 20 percent of design were fabricated. The reduction in area was accomplished by changing the stator blade setting angle. An extension of the rotor exducer was also fabricated. When the extension was attached to the rotor, the rotor throat area was 53 percent of design. Use of this extension would give a better stator-rotor throat area match at the lower specific speed range. Each stator configuration was tested over a range of turbine pressure ratios at equivalent design speed with and without the rotor extension attached. Mass flow and hence Reynolds number was held constant at equivalent design speed and pres- sure ratio.
This report presents the performance of the 4.97-inch (12.62-cm) turbine for each configuration tested and shows the specific speed effect on turbine efficiency. Results are presented in terms of equivalent weight flow and efficiency at equivalent design speed over a range of pressure ratios. Internal f low characterist ics are presented in terms of static pressure variation through the turbine, radial variation of exit flow angle, and
2
I n
loss distribution at the rotor outlet.
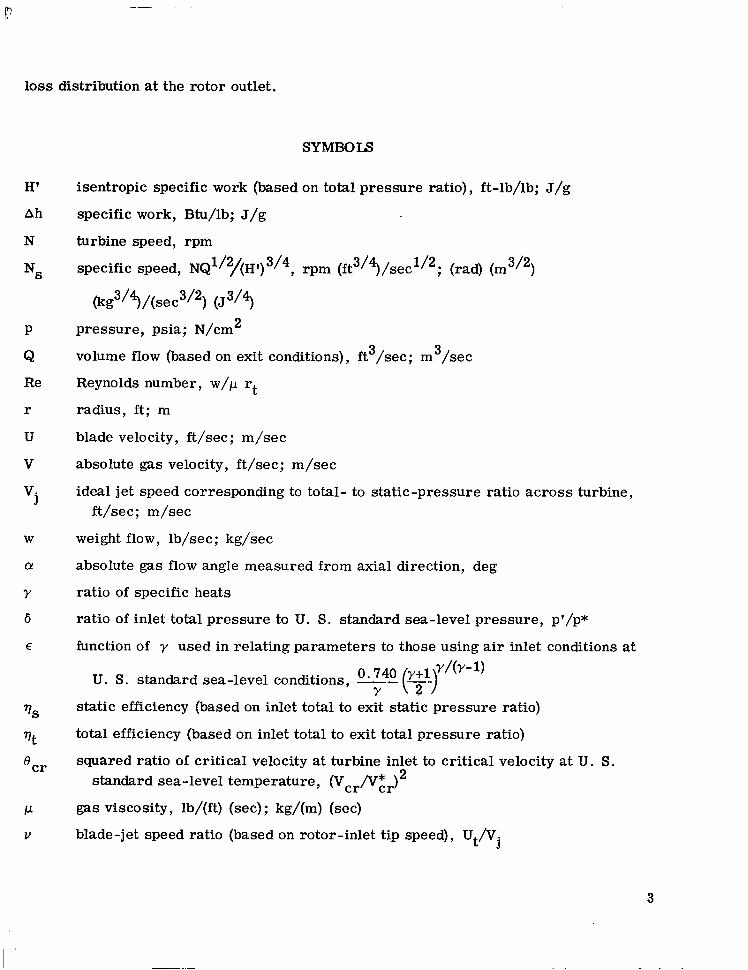
SYMBOLS
H'
Ah
N
NS
P
Q Re
r
U
V
W
CY
Y
6
E
?5
9 'cr
I-L
V
isentropic specific work (based on total pressure ratio), ft-lb/lb; J/g
specific work, Btu/lb; J/g
turbine speed, rpm
specific speed, NQ1/2/(Hr)3/4, rpm (ft3/3/sec1/2; (rad) (m 3/2)
(kg3/$/(sec3j2) (J3/4 pressure, psia; N/cm
volume flow (based on exit conditions), f t /sec; m /sec
Reynolds number, w/p rt
radius, f t ; m
blade velocity, ft/sec; m/sec
absolute gas velocity, ft/sec; m/sec
ideal jet speed corresponding to total- to static-pressure ratio across turbine,
2
3 3
ft/sec; m/sec
weight flow, lb/sec; kg/sec
absolute gas flow angle measured from axial direction, deg
ratio of specific heats
ratio of inlet total pressure to U. S. standard sea-level pressure, p'/p*
function of y used in relating parameters to those using air inlet conditions at
U. S. standard sea-level conditions, -- -- 0 740 y+l '/('-') Y ( 2 )
static efficiency (based on inlet total to exit static pressure ratio)
total efficiency (based on inlet total to exit total pressure ratio)
squared ratio of critical velocity at turbine inlet to critical velocity at U. S. standard sea-level temperature, (Vcr/V&) 2
gas viscosity, lb/(ft) (sec); kg/(m) (sec)
blade-jet speed ratio (based on rotor-inlet tip speed), U /V t j
3
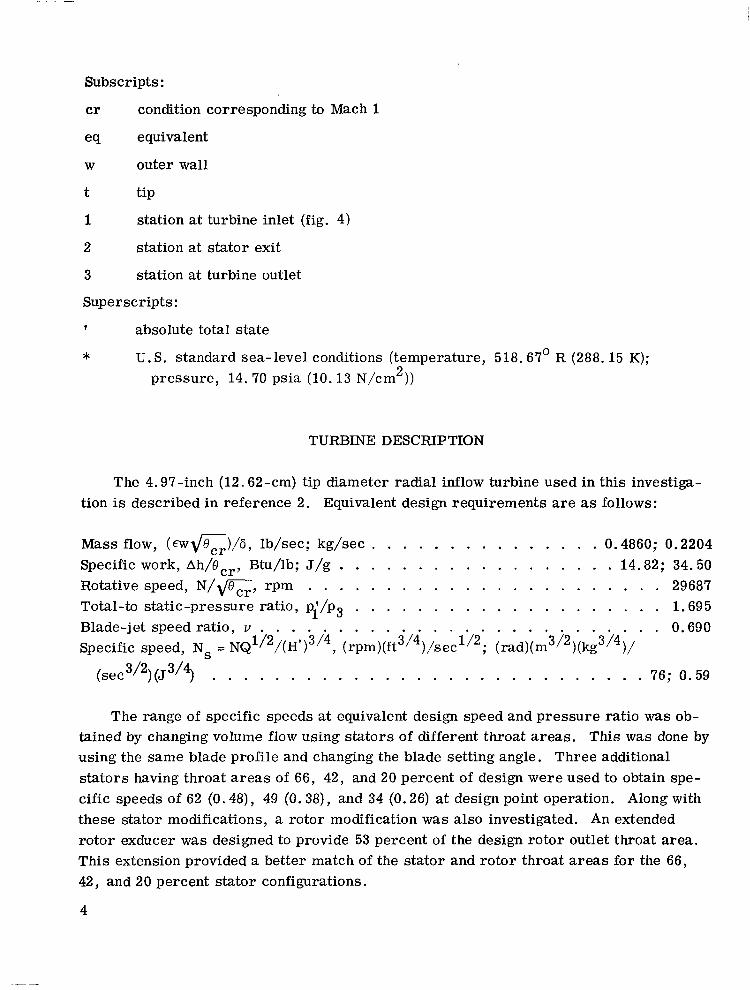
Subscripts :
cr condition corresponding to Mach 1
eq equivalent
W outer wall
t tip
1 station at turbine inlet (fig. 4)
2 station at stator exit
3 station at turbine outlet
Superscripts:
? absolute total state
* U.S . standard sea-level conditions (temperature, 518.67' R (288.15 K);
pressure, 14.70 psia (10.13 N/cm )) 2
TURBINE DESCRIPTION
The 4.97-inch (12.62-cm) tip diameter radial inflow turbine used in this investiga- tion is described in reference 2 . Equivalent design requirements are as follows:
Mass flow, ( a v K ) / 6 , lb/sec; kg/sec . . . . . . . . . . . . . . . 0.4860; 0.2204 Specific work, Ah/OCr, Btu/lb; J /g . . . . . . . . . . . . . . . . . . 14.82; 34.50 Rotative speed, N / C , rpm . . . . . . . . . . . . . . . . . . . . . . . 29687 Total-to static-pressure ratio, pi/p3 . . . . . . . . . . . . . . . . . . . . 1.695
-
Blade-jet speed ratio, v . . . . . . . . . . . . . . . . . . . . . . . 0.690 Specific speed, Ns = NQ1l2/(H i i 4 , ( r ~ m ) ( f t ~ / ~ ) / s e c l / ~ ; ( r a ~ l ) ( r n ~ / ~ ) ( k g ~ ? ~ ) /
(sec3l2)(J3/$ . . . . . . . . . . . . . . . . . . . . . . . . . . . . 76; 0.59
The range of specific speeds at equivalent design speed and pressure ratio was ob- tained by changing volume flow using stators of different throat areas. This was done by using the same blade profile and changing the blade setting angle. Three additional s ta tors having throat areas of 66, 42, and 20 percent of design were used to obtain spe- cific speeds of 62 (0.48), 49 (0.38), and 34 (0.26) at design point operation. Along with these stator modifications, a rotor modification was also investigated. An extended rotor exducer was designed to provide 53 percent of the design rotor outlet throat area. This extension provided a better match of the stator and rotor throat areas for the 66, 42, and 20 percent stator configurations.
4
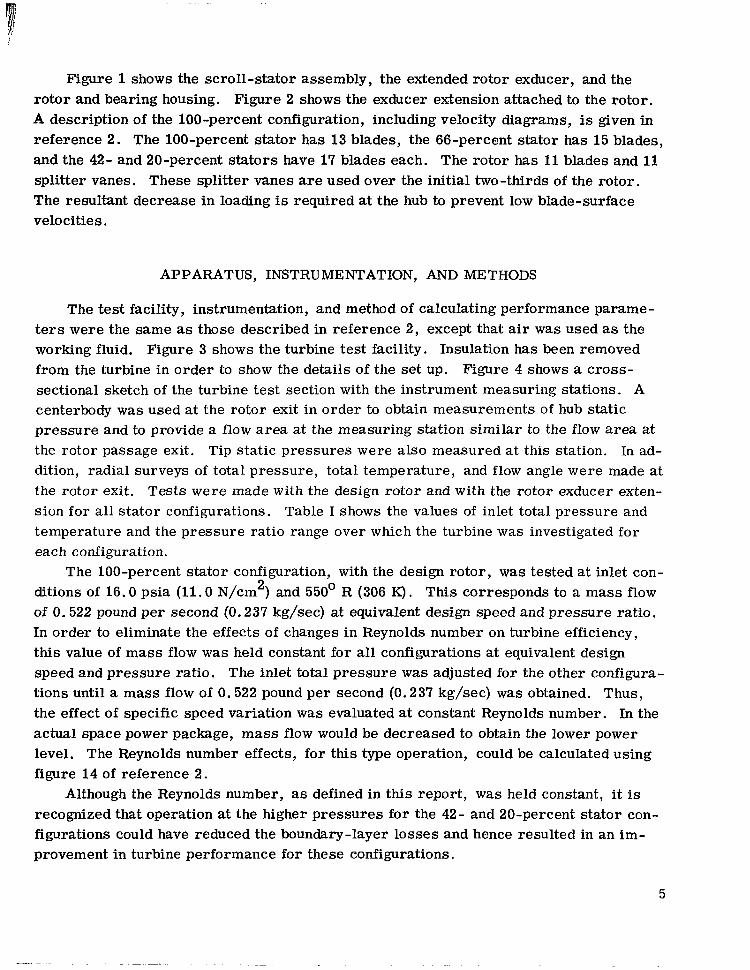
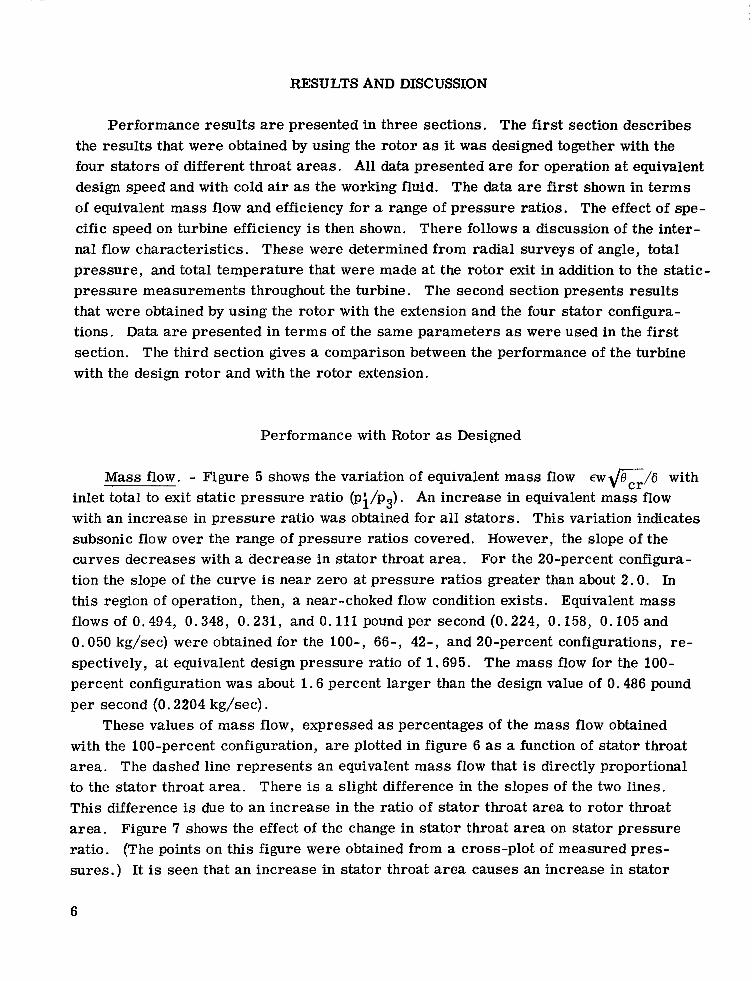
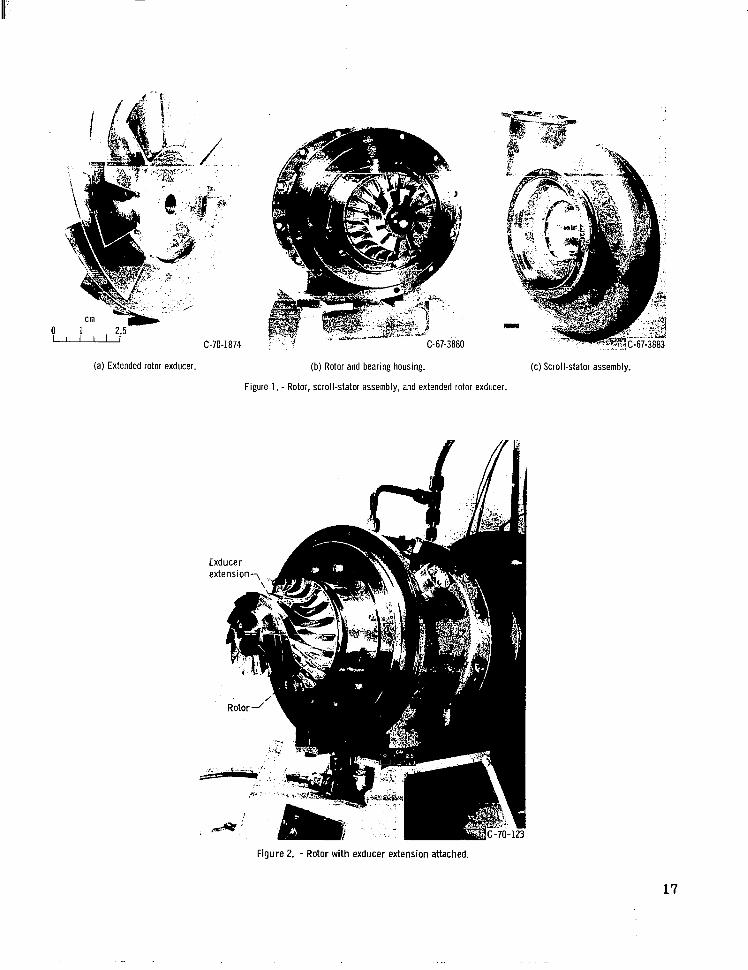
Figure 1 shows the scroll-stator assembly, the extended rotor exducer, and the rotor and bearing housing. Figure 2 shows the exducer extension attached to the rotor. A description of the 100-percent configuration, including velocity diagrams, is given in reference 2 . The 100-percent stator has 13 blades, the 66-percent stator has 15 blades, and the 42- and 20-percent stators have 17 blades each. The rotor has 11 blades and 11 splitter vanes. These splitter vanes are used over the initial two-thirds of the rotor. The resultant decrease in loading is required at the hub to prevent low blade-surface velocities.
APPARATUS, INSTRUMENTATION, AND METHODS
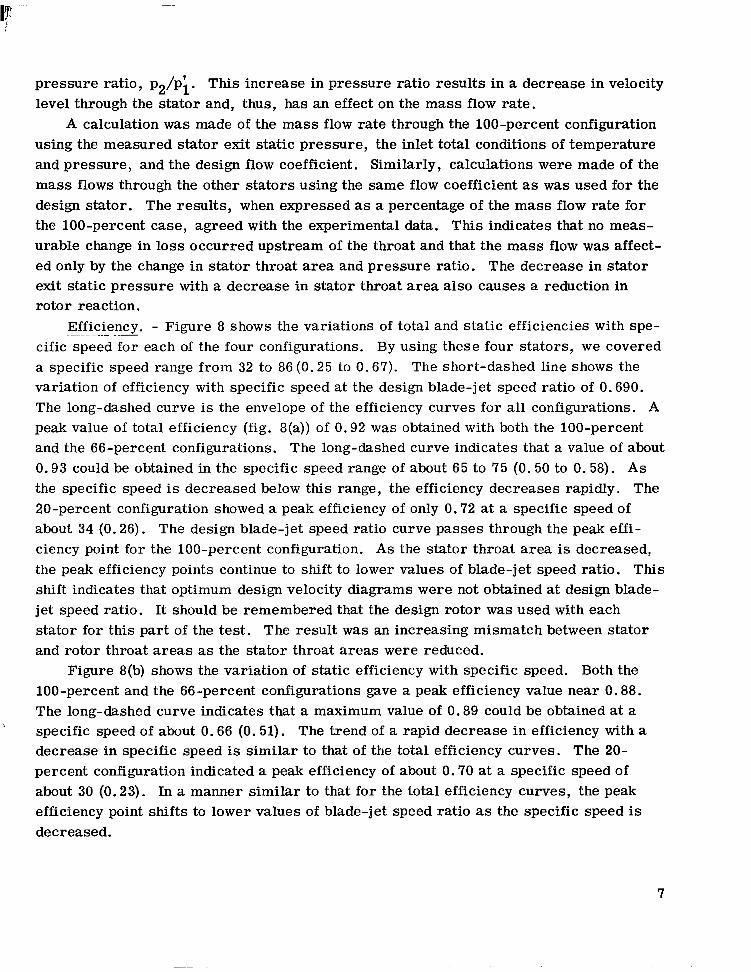
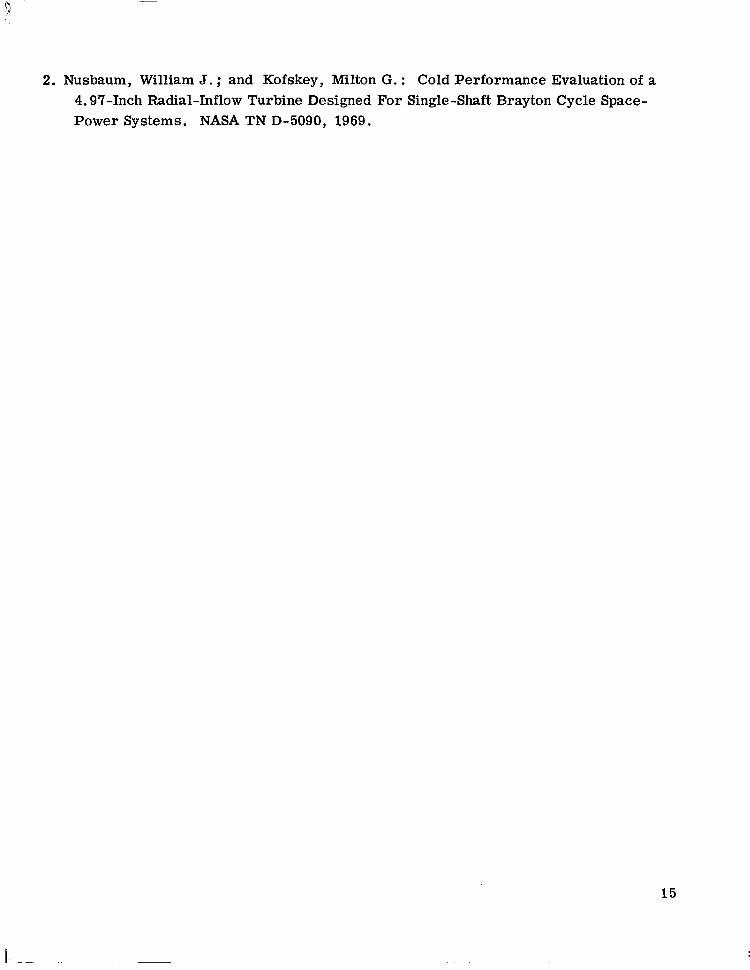
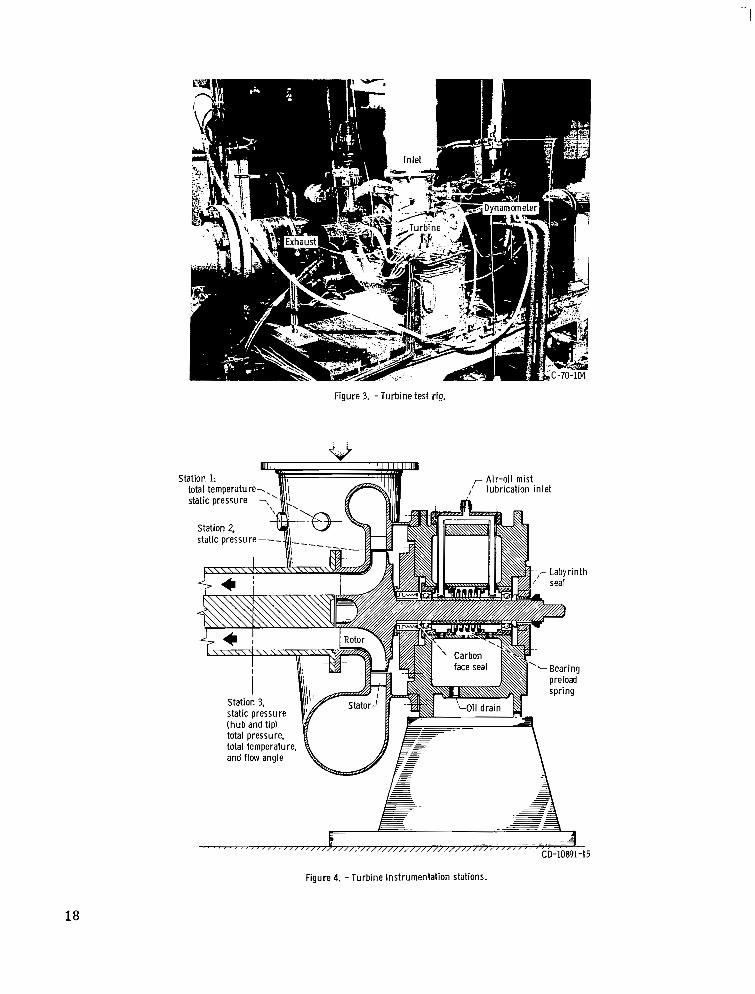
The test facility, instrumentation, and method of calculating performance parame- ters were the same as those described in reference 2, except that air was used as the working fluid. Figure 3 shows the turbine test facility. Insulation has been removed from the turbine in order to show the details of the set up. Figure 4 shows a cross- sectional sketch of the turbine test section with the instrument measuring stations. A centerbody was used at the rotor exit in order to obtain measurements of hub static pressure and to provide a flow area at the measuring station similar to the flow area at the rotor passage exit. Tip static pressures were also measured at this station. In ad- dition, radial surveys of total pressure, total temperature, and flow angle were made at the rotor exit. Tests were made with the design rotor and with the rotor exducer exten- sion for all stator configurations. Table I shows the values of inlet total pressure and temperature and the pressure ratio range over which the turbine was investigated for each configuration.
ditions of 16.0 psia (11.0 N/cm ) and 550' R (306 K) . This corresponds to a mass flow of 0.522 pound per second (0.237 kg/sec) at equivalent design speed and pressure ratio. In order to eliminate the effects of changes in Reynolds number on turbine efficiency, this value of mass flow was held constant for all configurations at equivalent design speed and pressure ratio. The inlet total pressure was adjusted for the other configura- tions until a mass flow of 0.522 pound pe r second (0.237 kg/sec) was obtained. Thus, the effect of specific speed variation was evaluated at constant Reynolds number. In the actual space power package, mass flow would be decreased to obtain the lower power level. The Reynolds number effects, for this type operation, could be calculated using figure 14 of reference 2.
The 100-percent stator configuration, with the design rotor, was tested at inlet con- 2
Although the Reynolds number, as defined in this report, was held constant, it is recognized that operation at the higher pressures for the 42- and 20-percent stator con- figurations could have reduced the boundary-layer losses and hence resulted in an im- provement in turbine performance for these configurations.
5
RESULTS AND DISCUSSION
Performance results are presented in three sections. The first section describes the results that were obtained by using the rotor as it was designed together with the four stators of different throat areas. All data presented are for operation at equivalent design speed and with cold air as the working fluid. The data are first shown in terms of equivalent mass flow and efficiency for a range of pressure ratios. The effect of spe- cific speed on turbine efficiency is then shown. There follows a discussion of the inter- nal flow characteristics. These were determined from radial surveys of angle, total pressure, and total temperature that were made at the rotor exit in addition to the static- pressure measurements throughout the turbine. The second section presents results that were obtained by using the rotor with the extension and the four stator configura- tions. Data are presented in terms of the same parameters as were used in the first section. The third section gives a comparison between the performance of the turbine with the design rotor and with the rotor extension.
Performance with Rotor as Designed
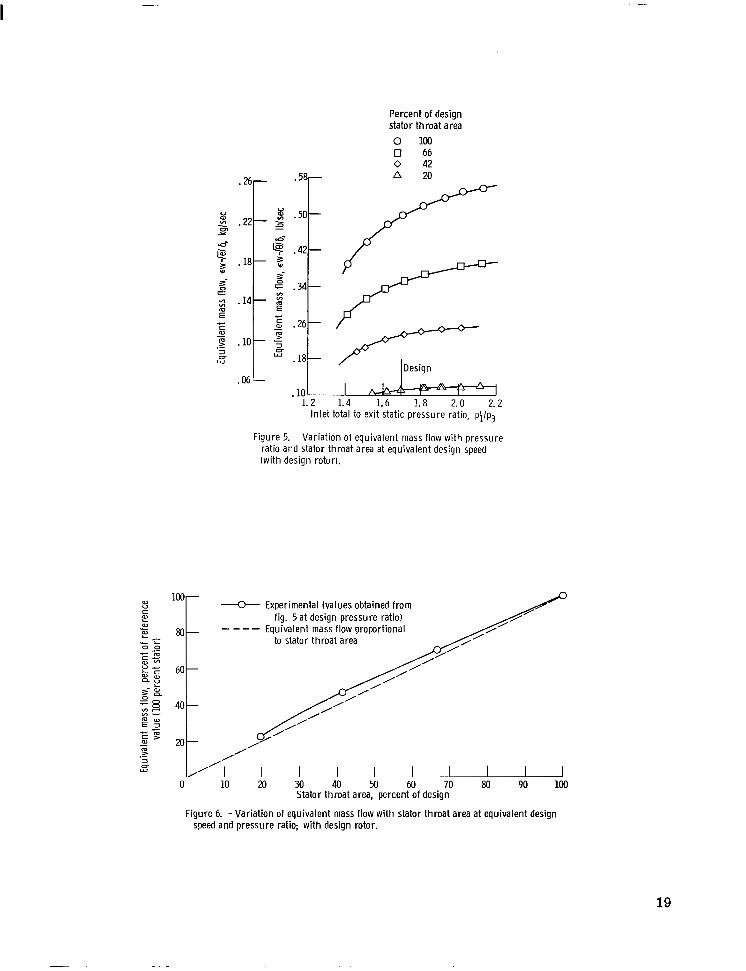
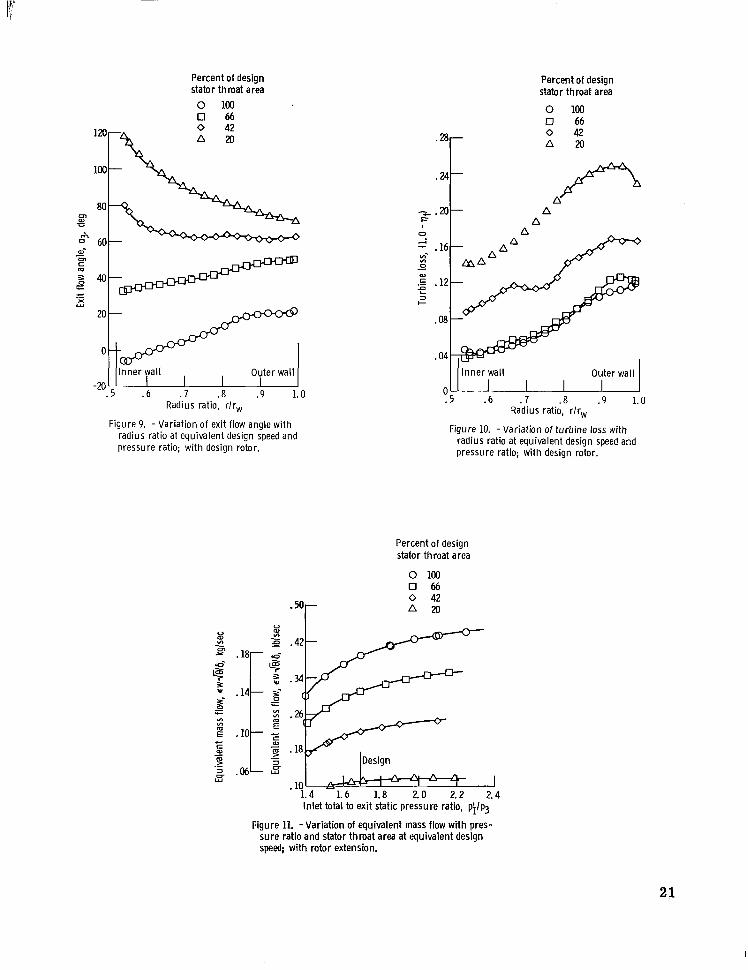
Mass flow. - Figure 5 shows the variation of equivalent mass flow av&-/6 with inlet total to exit static pressure ratio (pi/p3). An increase in equivalent mass flow with an increase in pressure ratio was obtained for all stators. This variation indicates subsonic flow over the range of pressure ratios covered. However, the slope of the curves decreases with a decrease in stator throat area. For the 20-percent configura- tion the slope of the curve is near zero at pressure ra t ios greater than about 2.0. In this region of operation, then, a near-choked flow condition exists. Equivalent mass flows of 0.494, 0.348, 0.231, and 0.111 pound per second (0.224, 0.158, 0.105 and 0.050 kg/sec) were obtained for the loo-, 66-, 42-, and 20-percent configurations, re- spectively, at equivalent design pressure ratio of 1.695. The mass flow for the 100- percent configuration was about 1.6 percent larger than the design value of 0.486 pound per second (0.2204 kg/sec) .
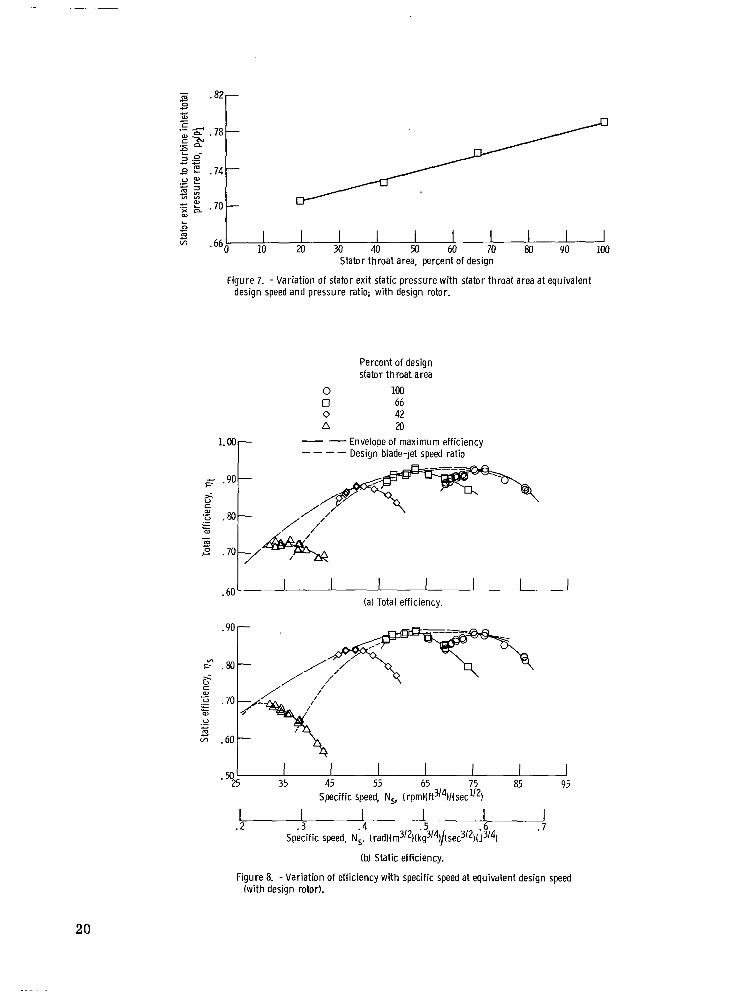
These values of mass flow, expressed as percentages of the mass flow obtained with the 100-percent configuration, are plotted in figure 6 as a function of stator throat area. The dashed line represents an equivalent mass flow that is directly proportional to the stator throat area. There is a slight difference in the slopes of the two lines. This difference is due to an increase in the ratio of stator throat area to rotor throat area. Figure 7 shows the effect of the change in stator throat area on stator pressure ratio. (The points on this figure were obtained from a cross-plot of measured pres- sures . ) It is seen that an increase in stator throat area causes an increase in stator
6
pressure ratio, p2/pi. This increase in pressure ratio results in a decrease in velocity level through the stator and, thus, has an effect on the mass flow rate .
A calculation was made of the mass flow rate through the 100-percent configuration using the measured stator exit static pressure, the inlet total conditions of temperature and pressure, and the design flow coefficient. Similarly, calculations were made of the mass flows through the other stators using the same flow coefficient as was used for the design stator. The results, when expressed as a percentage of the mass flow rate for the 100-percent case, agreed with the experimental data. This indicates that no meas- urable change in loss occurred upstream of the throat and that the mass flow was affect- ed only by the change in stator throat area and pressure ratio. The decrease in stator exit static pressure with a decrease in stator throat area also causes a reduction in rotor reaction.
Efficiency. - Figure 8 shows the variations of total and static efficiencies with spe- cific speed for each of the four configurations. By using these four stators, we covered a specific speed range from 32 to 86 (0.25 to 0.67). The short-dashed line shows the variation of efficiency with specific speed at the design blade-jet speed ratio of 0.690. The long-dashed curve is the envelope of the efficiency curves for all configurations. A peak value of total efficiency (fig. 8(a)) of 0.92 was obtained with both the 100-percent and the 66-percent configurations. The long-dashed curve indicates that a value of about 0.93 could be obtained in the specific speed range of about 65 to 75 (0.50 to 0.58). As the specific speed is decreased below this range, the efficiency decreases rapidly. The 20-percent configuration showed a peak efficiency of only 0.72 at a specific speed of about 34 (0.26). The design blade-jet speed ratio curve passes through the peak effi- ciency point for the 100-percent configuration. As the stator throat area is decreased, the peak efficiency points continue to shift to lower values of blade-jet speed ratio. This shift indicates that optimum design velocity diagrams were not obtained at design blade- jet speed ratio. It should be remembered that the design rotor was used with each stator for this part of the test. The result was an increasing mismatch between stator and rotor throat areas as the stator throat areas were reduced.
Figure 8(b) shows the variation of static efficiency with specific speed. Both the 100-percent and the 66-percent configurations gave a peak efficiency value near 0.88. The long-dashed curve indicates that a maximum value of 0.89 could be obtained at a specific speed of about 0.66 (0.51). The trend of a rapid decrease in efficiency with a decrease in specific speed is similar to that of the total efficiency curves. The 20- percent configuration indicated a peak efficiency of about 0.70 at a specific speed of about 30 (0.23). In a manner similar to that for the total efficiency curves, the peak efficiency point shifts to lower values of blade-jet speed ratio as the specific speed is decreased.
7
The design blade-jet speed ratio curve in figure 8(a) indicates that a maximum value of total efficiency of 0.92 could be obtained while operating at design blade-jet speed ratio and within the specific speed range of 65 to 75 (0.50 to 0.58). This value of effi- ciency is within one point of the peak efficiency values represented by the long-dashed curve over the same range of specific speeds. It is, thus, indicated that near optimum velocity diagrams could be obtained by operation at design blade-jet speed ratio over this specific speed range. Figure 8(b) (short-dashed line) indicates a maximum static efficiency of 0.88 for operation at the same values of blade-jet speed ratio and specific speed.
Internal flow characteristics. - The results of a radial survey of exit flow angle taken at equivalent design speed and pressure ratio are shown in figure 9. It can be noted that, as stator throat area was reduced, the exit flow angle changed to increasing amounts of underturning (as denoted by increasing positive angles) over the entire pas- sage height. This trend in exit flow angle with stator configuration is to be expected since the rotor exit relative velocity decreases with decreasing stator throat area. It will be noted that, for the 20-percent stator configuration, exit flow angles greater than 90' from axial were obtained from the hub to a radius ratio of 0.70. This would suggest flow separation with back flow in this region near the hub. Examination of design rotor blade surface velocities (ref. 2) shows that low pressure surface velocities of 35 feet per second (10.7 m/sec) were obtained at or near the hub region with the design area stator. Increased blade loading of the rotor blade near the leading edge for this blade (20 percent stator configuration) could result in velocities near or at zero. This could result in flow separation.
Figure 10 shows the variation of loss with radius ratio. Turbine loss is defined here as 1 .0 minus the local total efficiency. Local total efficiency was calculated in the following manner: For each data point, a value of ideal work was calculated from the total temperature and total pressure at the turbine inlet and the total pressure as indi- cated by the probe equipment at the turbine outlet. In the calculation of actual work for each radial position, a momentum method was used. First, the exit momentum and mass flow rate were calculated for each of the area increments at the turbine outlet, using the total and static pressures, the total temperature, and the angle. Then, a mass-averaged value of exit momentum was obtained and used with brake specific work to calculate a value of inlet momentum. This inlet momentum was assumed to be con- stant for all radial positions at the turbine exit. Finally, the actual work was calculated for each radial position from the inlet momentum and the local value of the exit momen- tum. Combining this value with the previously calculated ideal work gave the local total efficiency value for each radial position.
The loss variation shown in figure 10 for the 20-percent stator configuration does not have a faired line for the radius ratio range of 0.52 to 0.79 because inlet tangential
8
momentum could not be computed with any degree of accuracy since exit flow angles greater than 90' were obtained in this region. The figure shows comparable losses for the 100- and the 66-percent stator configurations. This was expected since the turbine efficiency was about the same at equivalent design speed and pressure ratio. Consider- ably higher losses were obtained for the 42- and 20-percent stator configurations over the entire passage height. As in all configurations, maximum losses were noted at the tip region.
Performance with Rotor Extension
Mass flow. - Figure 11 shows the variation of equivalent mass flow a v G / 6 with inlet total to exit static pressure ratio @i/pQ). The shapes of the curves obtained with the rotor extension are s imilar to those obtained with the design rotor (fig. 5). There is a difference, however, in the level of the curves for the two cases. The rotor throat area was reduced to 53 percent of the design value with the addition of the rotor extension. There was, therefore, a reduction in equivalent mass flow for the three lar- ger stators. There was no change for the stator with the 20-percent throat area since it was operating near the choked condition (as shown by the slope of the curve in fig. 5).
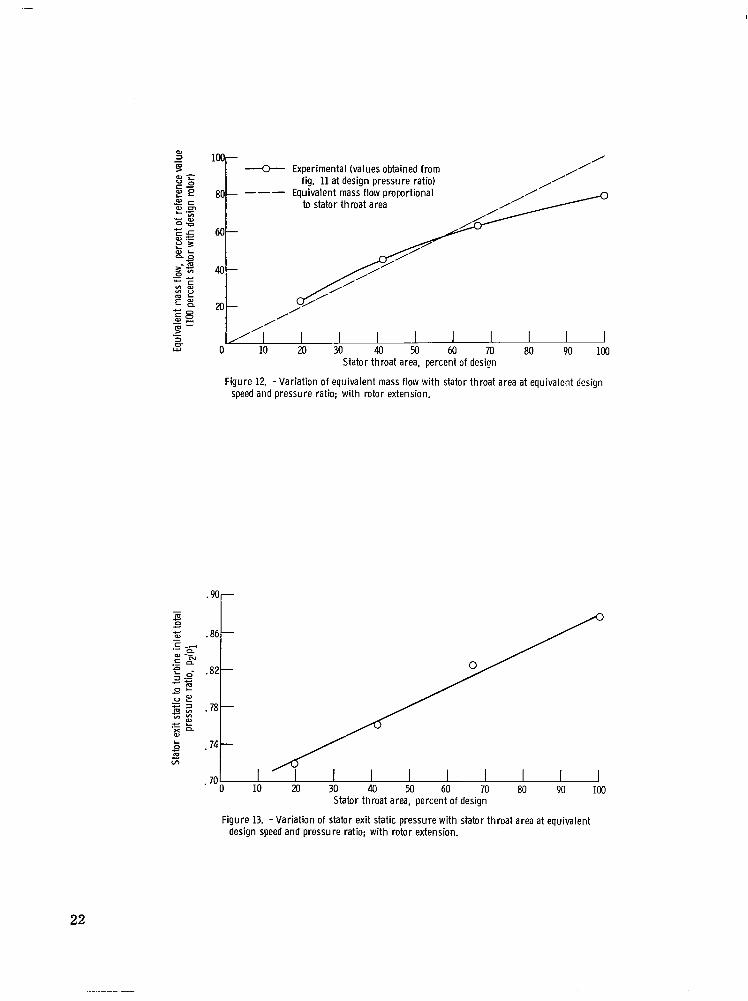
Figure 12 presents the variation of equivalent mass flow with stator throat area for operation at equivalent design speed and pressure ratio. Mass flow is expressed as a percent of that obtained with the 100-percent stator throat area and with the design rotor. The dashed line represents an equivalent mass flow that is directly proportional to the stator throat area, and the solid line represents constant design velocities through the turbine. The figure shows that the experimental curve intersects the dashed curve at a stator throat area value of about 57 percent of design. This indicates that design velocities as well as design rotor reaction would be obtained in this region. It will be noted that the difference in slope of the two lines is even greater than it was for opera- tion with the design rotor. However, the difference is attributed to the same cause, namely, the change in stator pressure ratio. The variation of stator pressure ratio with a change in stator throat area is shown in figure 13 for operation with the rotor ex- tension. (The points in this figure were obtained from a cross-plot of experimental data curves.) The rate of increase of stator pressure ratio with an increase in stator throat area is even greater than for the design rotor. There was, thus, a significant decrease in velocity level through the stator with a marked effect on mass flow rate.
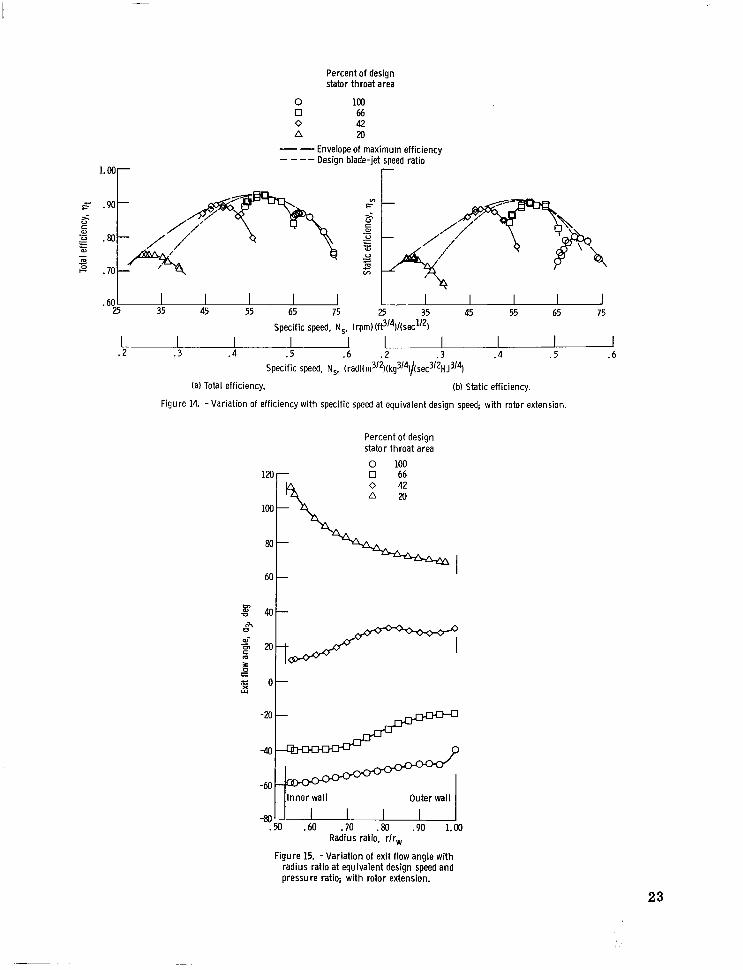
Efficiency. - Figure 14 shows the variations of total and static efficiencies with specific speed for each of the four stator configurations. The short-dashed line repre- sents operation at the design blade-jet speed ratio of 0.690. The long-dashed curve is the envelope of the efficiency curves for all configurations. A peak value of total
9
efficiency (fig. 14(a)) of 0.92 was obtained with the 66-percent stator configuration at a specific speed of about 58.0 (0.45). The long-dashed curve shows that the maximum value of total efficiency of about 0.92 falls within the specific speed range of about 53 to 59 (0.41 to 0.46). Variation from this range results in a rapid decrease in efficiency. The dashed line shows that peak efficiency was obtained near design blade-jet speed ratio for all except the 20-percent configuration. (The short-dashed line coincides with the envelope at values of specific speed greater than 56 (0.43). ) A peak value of static efficiency of 0.90 (fig. 14(b)) was obtained with the 66-percent stator at a specific speed of about 58 (0.45). The long-dashed curve shows that the maximum value of static effi- ciency of 0.91 falls within the same specific speed range of 53 to 59 (0.41 to 0.46).
Internal flow characteristics. - The results of the radial survey of exit flow angle taken at equivalent design speed and pressure ratio are shown in figure 15. The figure shows that as stator throat area was reduced, the exit flow angle changed from predom- inantly overturning (as denoted by negative angles) to underturning over the entire pas- sage height. This trend in exit flow angle with stator configuration is to be expected because the rotor exit relative velocity decreases with decreasing stator throat area and flow. It will be noted that for the 20-percent stator configuration, exit flow angles greater than 90' were obtained from the hub to a radius ratio of 0.630. As mentioned previously, this could result from flow separation with backflow in the region near the hub.
The variation of exit flow angle and exit total and static pressure with radius ratio indicated that there was a nonuniform work distribution from hub to outer wall for all configurations.
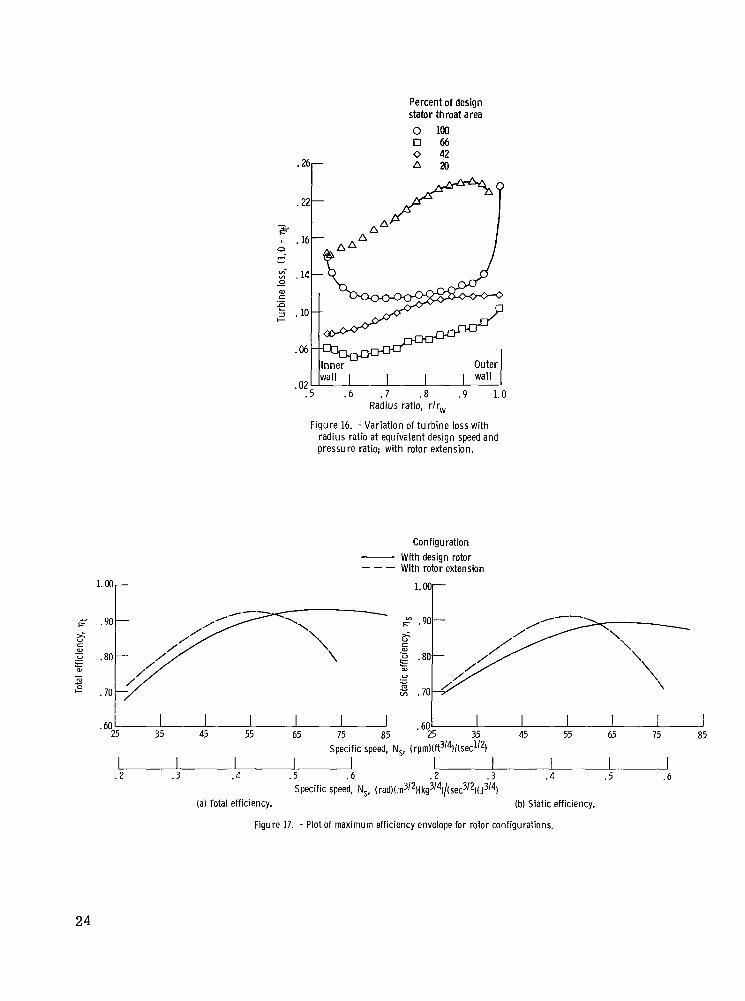
Local values of total efficiency were calculated on the basis of the change in tangen- tial momentum through the rotor and the radial distribution of total pressure at the rotor exit. These results are plotted in figure 16 in terms of turbine loss (1.0 - qt) as a func- tion of radius ratio. The loss data were not faired for the radius ratio range of 0.52 to 0.72 for the 20-percent configuration because of the possible flow separation and back- flow in this region. The figure shows the largest radial variation in loss at the hub and tip regions and the 100- and 20-percent stator throat area configurations. The figure also shows that, for the 66- and 42-percent stator throat area configurations, the losses were lower near the hub region and increased with increasing radius ratio.
Comparison of Efficiency for Two Rotor Configurations
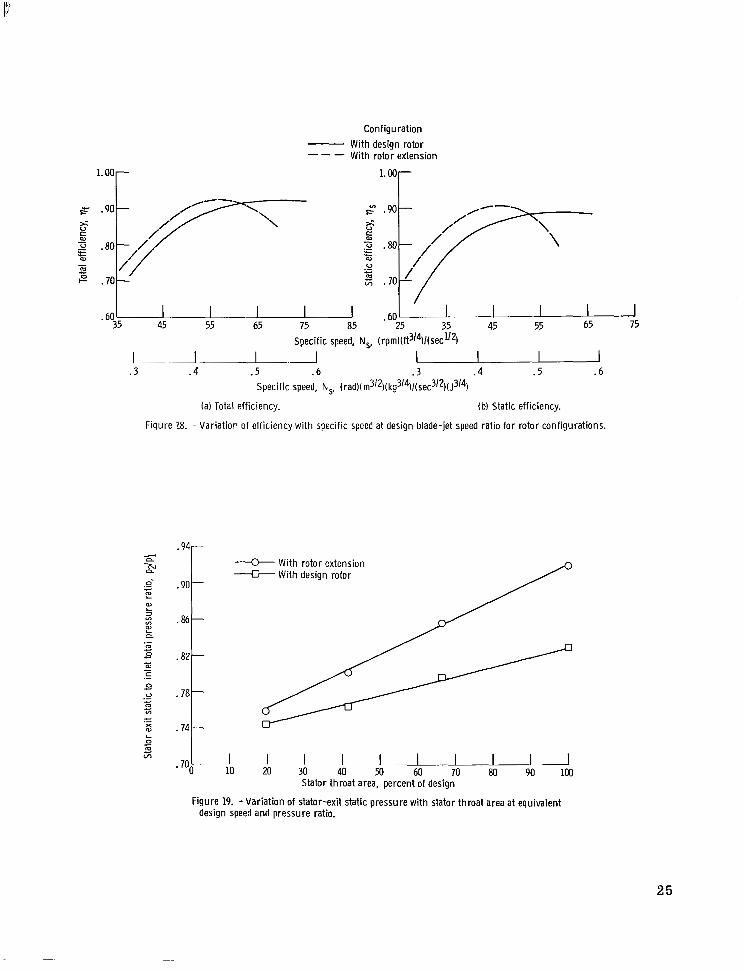
A comparison of the performance of the turbine with and without the rotor extension is best shown by replotting some of the curves already presented. The efficiency en- velope curves of figures 8(a) and 14(a) are shown in figure 17(a). A maximum total
10
efficiency of 0.93 is indicated for operation at a specific speed of 71 (0.55) with the de- sign rotor. Operation of the turbine with the rotor extension resulted in a one-point drop in maximum total efficiency to a value of 0.92 at a specific speed of about 56 (0.43). The drop in efficiency is due to increased viscous losses in the rotor. These increased losses-are attributed mainly to the larger blade surface area.
Figure 17(b) shows the comparison between maximum static efficiencies for opera- tion with the design rotor and with the rotor extension. These curves are the envelope curves of figures 8(b) and 14(b). The figure shows again that the addition of a rotor ex- tension caused a shift of the maximum efficiency point to a lower value of specific speed. The maximum static efficiencies were 0.91 and 0.89 for operation with and without the design rotor. The maximum static efficiency was obtained at a specific speed of 66 (0.51) for operation with the design rotor and at a specific speed of 55 (0.43) for opera- tion with the rotor extension. Use of the rotor extension resulted in an increase in max- imum static efficiency by about two points even though there was a drop of about one point in total efficiency. The increase in maximum static efficiency results from a low- er exit kinetic energy level with the addition of the rotor extension.
Figure 18 presents efficiency curves for operation at design blade-jet speed ratio with and without the rotor extension. The curves of figure 18(a) were obtained by re - plotting the design blade-jet speed ratio curves of figures 8(a) and 14(a). These curves show a maximum total efficiency of 0.92 for both configurations. However, the rotor extension caused a shift of the maximum efficiency point from a specific speed value of about 71 (0.55) to a value of about 56 (0.43). This shift corresponds to that for the max- imum efficiency curves (fig. 17(a)). Figure 18(b) presents the design blade-jet speed ratio curves of figures 8(b) and 14(b). The rotor extension increased the maximum static efficiency from 0.88 to 0.90 (fig. 18(b)). Comparison with the total efficiency value of 0.92 (fig. 18(a)) shows that only two points in efficiency were lost in turbine exit kinetic energy. For ease of comparison, table I1 1-ists the efficiency and specific speed values for operation with the design rotor and with the rotor exducer extension.
These results indicate that radial-inflow turbines can operate efficiently over a range of power levels by changing stator throat area and operating at constant inlet con- ditions. The results also indicate that, i f high efficiency is desired at specific speeds considerably lower than design, design stator-rotor throat area ratio should be main- tained with the decrease in stator throat area.
Figure 19 shows the comparison of stator-exit static pressure with percent stator throat area for both rotor configurations. The curves in the figure were taken from figures 7 and 13, and the data were obtained at equivalent design speed and pressure ratio. Rotor reaction is larger over the entire stator throat area range for the case with the rotor extension. This is to be expected because the smaller rotor throat area would require a lower flow rate (at a given turbine inlet pressure) to obtain equivalent
11
design speed and pressure ratio. The lower flow rate is reflected in the higher stator- exit static pressure for the data obtained with the rotor extension. The figure shows that a 53-percent stator area configuration and the rotor with exducer extension would be required to give the same rotor reaction as that obtained with the 100-percent stator configuration and the design rotor. This is to be expected since the rotor throat area with the extension was 53 percent of design rotor throat area.
Loss Analysis
An analysis was made to determine the magnitude of the various losses for each configuration. The method described in reference 1 involved the determination of ve- locity diagrams for each configuration from measured turbine work, mass flow, inlet pressure and temperature conditions, speed, and stator throat area and results of the rotor exit surveys of total pressure and flow angle. Design loss distribution between the stator and rotor was used to proportion the measured overall turbine loss for the 100-percent configuration. Stator losses for the other configurations were then assumed to vary in proportion to the average of the inlet and outlet kinetic energy levels as de- termined from the velocity diagrams. Included in the stator losses are the trailing- edge blockage losses, which increases as the stator throat area was decreased, and the scroll loss.
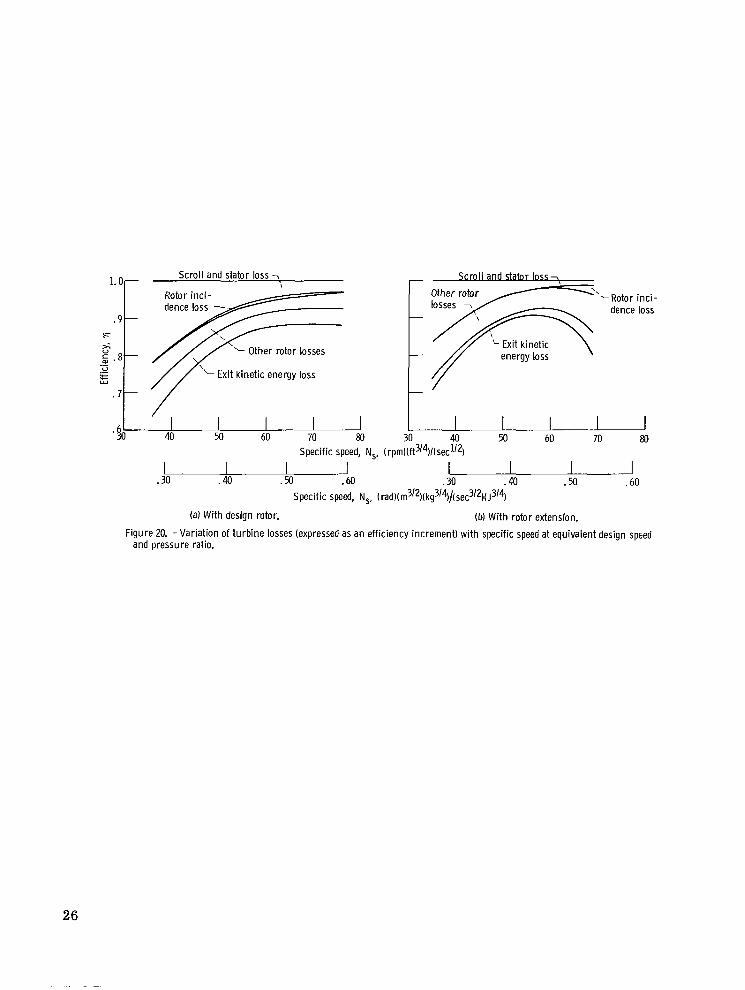
Rotor incidence losses were determined through adjustment of the actual incidence angle, which resulted in an effective relative whirl velocity different from the velocity diagram value. The adjustment depends on the blade speed, the number of blades, the rotor diameter, and the volume flow at the rotor inlet. The calculated optimum inci- dence angle o r optimum whirl value (relative to blade speed) is analogous to the use of the slip factor for centrifugal impellers. The remaining losses were attributed to the rotor. Figure 20 shows the results of these calculations for the cases with design rotor and with the rotor exducer extension. The various losses, expressed in terms of effi- ciency, a r e shown as a function of specific speed. The magnitude of the exit kinetic- energy loss is shown by the difference between total and static efficiency values obtained at design blade-jet speed ratio for each stator configuration.
Figure 20(a) shows the variation of turbine losses with specific speed for tests with the design rotor. The figure shows that the scroll-stator losses increase with decreas- ing specific speed. The increase in losses results from the increase in stator velocity as well as from increased trailing-edge blockage as specific speed o r stator throat area was decreased. Rotor losses decrease with decreasing specific speed. This results from the decreased velocity level through the rotor as specific speed was decreased. Rotor incidence loss was essentially constant over most of the range of specific speeds covered in the investigation.
12
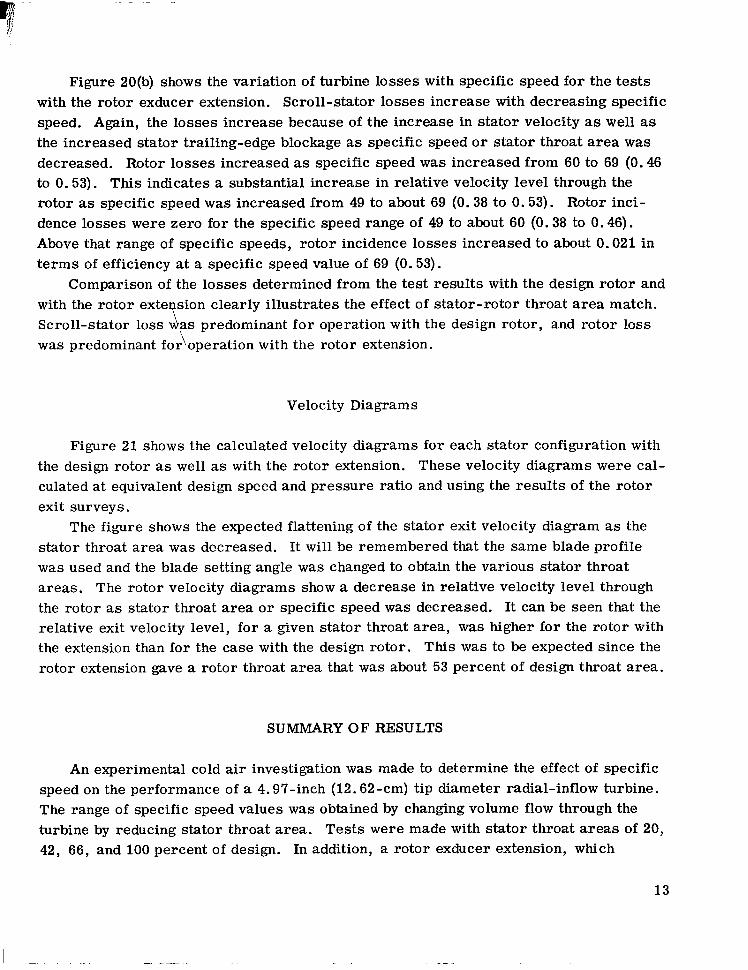
Figure 20(b) shows the variation of turbine losses with specific speed for the tests with the rotor exducer extension. Scroll-stator losses increase with decreasing specific speed. Again, the losses increase because of the increase in stator velocity as well as the increased stator trailing-edge blockage as specific speed or stator throat area was decreased. Rotor losses increased as specific speed was increased from 60 to 69 (0.46 to 0.53). This indicates a substantial increase in relative velocity level through the rotor as specific speed was increased from 49 to about 69 (0.38 to 0.53). Rotor inci- dence losses were zero for the specific speed range of 49 to about 60 (0.38 to 0.46). Above that range of specific speeds, rotor incidence losses increased to about 0.021 in t e rms of efficiency at a specific speed value of 69 (0.53).
Comparison of the losses determined from the test results with the design rotor and with the rotor exte sion clearly illustrates the effect of stator-rotor throat area match. Scroll-stator loss 1 as predominant for operation with the design rotor, and rotor loss was predominant for 1 operation with the rotor extension.
Velocity Diagrams
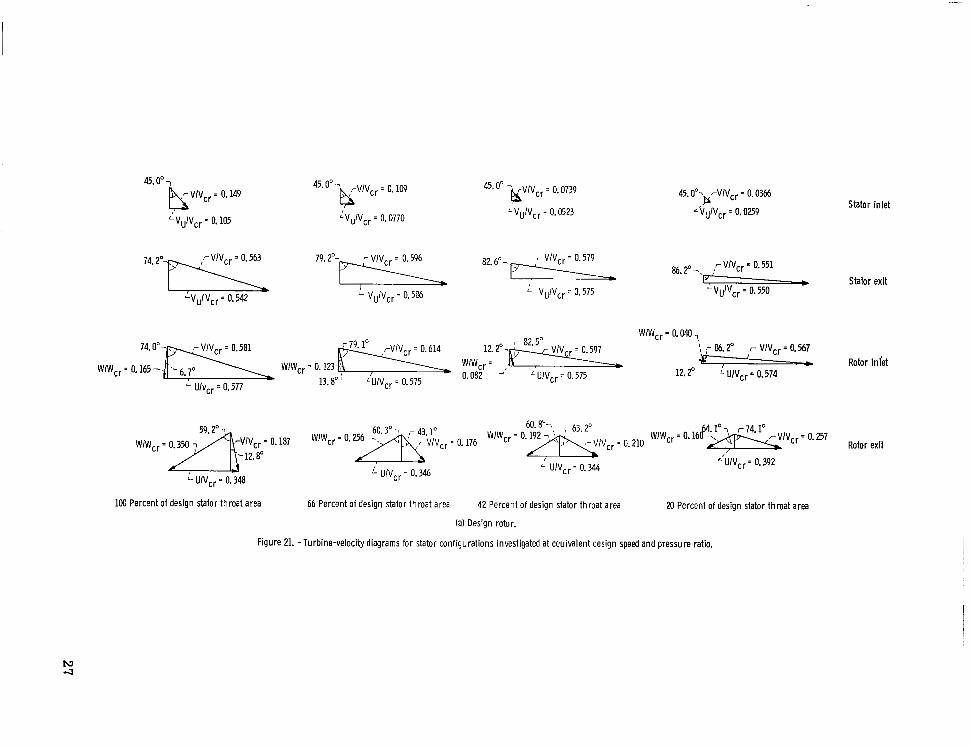
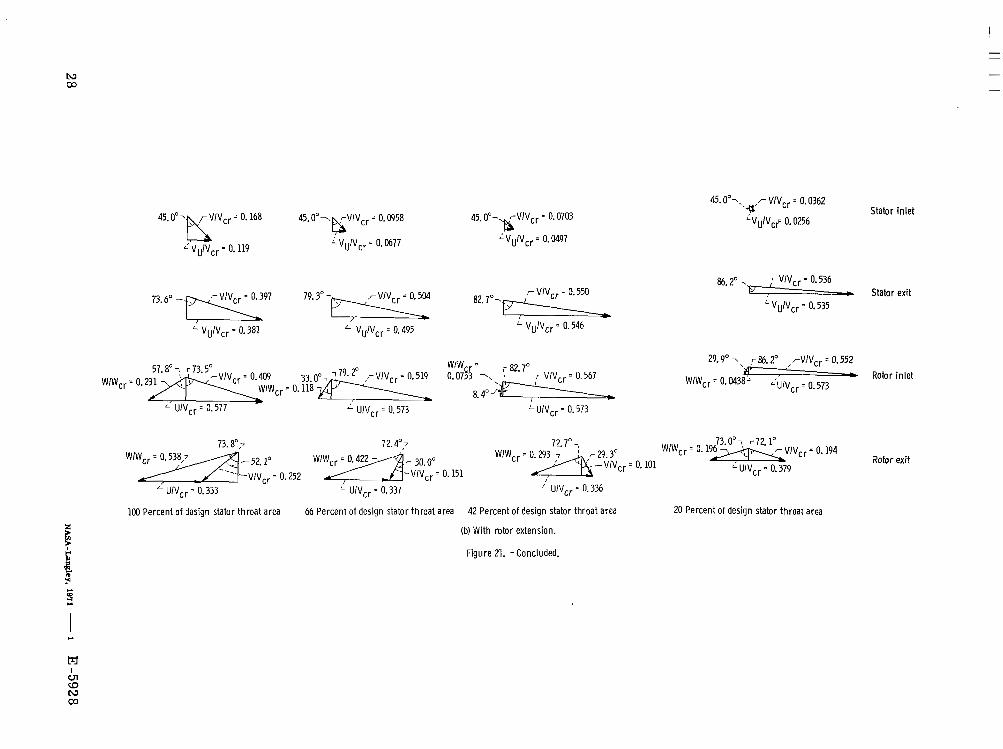
Figure 21 shows the calculated velocity diagrams for each stator configuration with the design rotor as well as with the rotor extension. These velocity diagrams were cal- culated at equivalent design speed and pressure ratio and using the results of the rotor exit surveys.
The figure shows the expected flattening of the stator exit velocity diagram as the stator throat area was decreased. It will be remembered that the same blade profile was used and the blade setting angle was changed to obtain the various stator throat areas. The rotor velocity diagrams show a decrease in relative velocity level through the rotor as stator throat area or specific speed was decreased. It can be seen that the relative exit velocity level, for a given stator throat area, was higher for the rotor with the extension than for the case with the design rotor. This was to be expected since the rotor extension gave a rotor throat area that was about 53 percent of design throat area.
SUMMARY O F RESULTS
An experimental cold air investigation was made to determine the effect of specific speed on the performance of a 4.97-inch (12.62-cm) tip diameter radial-inflow turbine. The range of specific speed values was obtained by changing volume flow through the turbine by reducing stator throat area. Tests were made with stator throat areas of 20, 42, 66, and 100 percent of design. In addition, a rotor exducer extension, which
13
reduced rotor throat area to 53 percent of design, was also used with the stator config- urations. Reynolds number, at equivalent design speed and pressure ratio, was main- tained at a constant value by adjusting the turbine inlet pressure. Results are presented for operation with all combinations of stator and rotor throat areas at equivalent design speed and over a range of pressure ratios. These results can be summarized as fol- lows :
1. A maximum total efficiency of 0.93 was obtained at a specific speed of 71 (0.55) for operation with design rotor. Operation of the turbine with the rotor extension re- sulted in a one point drop in maximum total efficiency to a value of 0.92 at a specific speed of 56 (0.43). The maximum static efficiencies were 0.91 and 0.89 for operation with the design rotor and with the rotor extension. The maximum static efficiency was obtained at a specific speed of 66 (0.51) for operation with the design rotor and at a spe- cific speed of 55 (0.43) for operation with the rotor extension.
2. Operation at design blade-jet speed ratio resulted in a maximum total efficiency of 0.92 for the tests with and without the rotor extension. Use of the rotor extension resulted in a shift in peak total efficiency from a specific speed value of 71 (0.55) to a value of about 56 (0.43). The maximum static efficiencies were 0.90 and 0.88 for oper- ation with and without the rotor extension. At these values of efficiency, the specific speed values were 56 (0.43) and 69 (0.54) for operation with and without the rotor extension.
3. An analysis was made of stator and rotor losses over the range of specific speeds investigated and at equivalent design speed and pressure ratio. Scroll-stator losses were predominant for operation with the design rotor, and rotor losses were predomi- nant for operation with the rotor extension.
4. The results indicated that, if high efficiency is desired at specific speeds con- siderably lower than design, the design stator-throat area ratio should be maintained and the stator throat area decreased.
Lewis Research Center, National Aeronautics and Space Administration,
Cleveland, Ohio, October 14, 1970, 120-27.
REFERENCES
1. Kofskey, Milton G. ; and Wasserbauer, Charles A. : Experimental Performance Evaluation of a Radial-Inflow Turbine Over A Range of Specific Speeds. NASA TN D-3742, 1966.
14
2. Nusbaum, William J . ; and Kofskey, Milton G. : Cold Performance Evaluation of a 4.97-Inch Radial-Inflow Turbine Designed For Single-Shaft Brayton Cycle Space- Power Systems. NASA TN D-5090, 1969.
15
TABLE I. - EXPERIMENTAL OPERATING CONDITIONS
7 7 Rotor configuration Stator configuration percent of design
throat area
Inlet total p r e s s u r e temperature range,
P;/P3 -
K ~
307 306 306 306
OR - 552 551 551 550
N/cm2
11.0 15.6 21.9 40.3
ps ia
16.0 22.7 31.8 58.4
- ~ ~ _ _ _
1.41 to 2.13 1.41 to 2.12 1.46 to 2.01 1.55 to 2.12
Design rotor (design throat area)
100 66 42 20
With exducer extension (53 percent of design throat area)
100 66 42 20
19.9 25.2 35.7 60.3
-
549 548 549 549
-
13.7 17.4 24.6 41.6
1.41 to 2.16 1.41 to 2.10 1.53 to 2.19
TABLE II. - PERFORMANCE VALUES OBTAINED WITH
FOURSTATORTHROATAREAS
Performance parameters T Configuration
With ro tor 2xtension
0.92
56; 0.43
..
With rotor LS designed
0.93
71; 0 .55
-
Maximum total efficiency, 14 Specific speed at maximum total efficiency, N,,
rpm (ft3/?/sec1/’: ( r a d ) ( n ~ ~ / ~ ) ( k g ~ ’ ? / ( s e c ~ / ~ ) ( J ~ / ?
Maximum static efficiency, vs Specific speed at maximum static efficiency, Ns,
rpm (ft3/$/sec1/2; (rad)(m3/2)(kg3/$/(sec3/2)(J3/$
0.91
55; 0.43
0.89
66; 0 .51
Maximum total efficiency at design blade-jet speed ratio, vt Specific speed at maximum total efficiency, N,,
rpm (ft3/$/sec1/2; (rad)(m3/2)(kg3/$/(sec3’2)(J3/$
0.92
56; 0.43
0.92
71; 0.55
0.88
69; 0 .54
Maximum static efficiency at design blade-jet speed ratio, 11, 0.90
56; 0.43 Specific speed at maximum static efficiency, N,,
rpm (ft3/$/sec1/2; (rad)(m3/2)(kg3/$/(sec3/2)(J3/$
16
0 L C-70-1874
(a) Extended rotor exducer. (b) Rotor and bearing housing. (c) Scroll-stator assembly.
Figure 1. - Rotor, scroll-stator assembly, and extended rotor exducer.
Figure 2. - Rotor with exducer extension attached.
17
I ""
I
Figure 3. - Turbine test rig.
Figure 4. -Turbine instrumentation stat ions.
18
.26
e
c c c
w 3
.18
.06
Percent of design stator throat area 0 100 0 66 0 42 A 20
.10 1- 1. 2 1.4 1.6 1. 8 2.0 2. 2
In let total to exit stat ic pressure rat io, pj lp3
Figure 5. -Va r ia t i on of equivalent mass f low with pressure rat io and stator throat area at equivalent design speed (with design rotor).
+ Experimental (values obtained from fig. 5 at design pressure rat io) 80t "" Equivalent mass flow proportional to stator throat area
100 + Experimental (values obtained from fig. 5 at design pressure rat io)
to stator throat area 80 "" Equivalent mass flow proportional
60 /
40
20
L 0 10 20 30 40 50 60 70 80 90 100
Stator throat area, percent of design
- 0 10 20 30 40 50 60 70 80 90 100
Stator throat area, percent of design
Figure 6. - Variat ion of equivalent mass f low wi th stator throat area at equivalent design speed and pressure rat io; with design rotor.
19
c
c
L 0 m 4 lb A 3b d 5b 60 ;o A 9: 1;
Stator throat area, percent of design
F igure 7. - Variation of stator exit stat ic pressure with stator throat area at equivalent design speed and pressure rat io; with design rotor.
Percent of design stator throat area
0 100 0 66 0 42 n 20 - - Envelope of maximum efficiency "" Design blade-jet speed rat io
(a) Total efficiency.
. 5 0 I 25 35 45 55 65 15 85 95
Specific speed, N,, ( r p ~ n ) ( f t ~ / ~ ) / ( s e c ~ / ~ )
I . 2 . 3 . 4 6 . 7
Specific speed, N,, (rad)lm3/2)(k953/4)/(rec312)(;314)
(b) Static efficiency.
Figure 8. -Variat ion of eff iciency with specif ic speed at equivalent design speed (wi th design rotor).
20
Percent of design stator throat area 0 loo 0 6 6 0 42 a m lar%
w
I nne r wa l l
-20.5 .6 . 7 .8 .9 1.0 Radius rat io, r /rw
-20.5 .6 . 7 .8 .9 1.0 Radius rat io, r /rw
Figure 9. - V a r i a t i o n of exit f low angle with radius rat io at equivalent design speed a n d pressure rat io; with design rotor.
Percent of design stator throat area
0 loo 0 66 0 42 a m
I
I llnnerY1l I Outer wal l
0 - " ~~
. 5 . 6 . 7 . 8 .9 1.0 Radius ratio, r/rw
radius rat io at equivalent design speed and pressure rat io; with design rotor.
Figure 10. - Var iat ion of t u r b i n e loss w i t h
Percent of design stator throat area
0 100 066 0 42 a m
.10 1.4 1.6 1.8 2.0 2.2 2.4 Inlet total to exit stat ic pressure rat io, pj/pj
Figure 11. -Var ia t ion o f equ iva len t mass f low w i th p res- sure ra t io and s ta tor throat area a t equiva lent des ign speed; with rotor extension.
21
Experimental (values obtained from / fig. 11 at design pressure rat io)
Equivalent mass flow proportional to stator throat area
/
/ //
/ / j 0 10 20 30 40 50 60 70 80 90 100
Stator throat area, percent of design
F igu re 12. -Var ia t ion o f equiva lent mass f low wi th s ta tor throat area a t equiva lent des ign speed and pressure rat io; with rotor extension.
. 90r
Stator throat area, percent o f design
Figure 13. -Var iat ion of stator exi t stat ic pressure wi th stator throat area at equivalent design speed and pressure rat io; with rotor extension.
22
Percent of design stator throat area
0 100 0 66
A 0 42
20 " Envelope of maximum efficiency "" Design blade-jet speed ratio
25 35 45 55 65 75 25 35 45 55 65 75
Specific speed, N,. (rpm)lft314)/lsec1/2)
L" L L . 2 .3 .4 .5 .6 . 2 .3 . 4 .5 .6
Specific speed, N,, (rad)(m3i2)(kg3'4)/(sec3/2)lJ3/4)
(a) Total efficiency. (b) Static efficiency.
Figure 14. -Var iat ion of efficiency with specific speed at equivalent design speed; with rotor extension.
Percent of design stator throat area 0 100
1" r" 0 66
Ot
Inner wall Outer wall
-83 .M .60 .70 .80 .90 1.00
Radius ratio, r/rw
Figure 15. -Variation of exit f low angle with radius ratio at equivalent design speed and pressure ratio: with rotor extension.
23
Percent of design stator throat area
wal l I . 5 . 6 . 7 . 8 .9 1.0
Radius ratio, rlrw
F igu re 16. - V a r i a t i o n of t u r b i n e loss wi th radius rat io at equivalent design speed and pressure rat io; with rotor exiension.
Configuration With design rotor With rotor extension “_
.60 I 25 35 45 55 65 75 85 25 35 45 55 65 75 a5
.bo1
Specific speed, N,, (rpm)(f13/4)/(sec112)
L . 2 . 3 . 4 . 5 .6 . 2 . 3 . 4 . 5 .6
Specific speed, Ns, (rad)(m3i2)(kg3’4)/(sec3i2)(J3’4) (a) Total efficiency. (b) Static efficiency.
Figure 17. - Plot of maximum efficiency envelope for rotor configurations.
24
Conf igurat ion With design rotor With rotor extension “_
1.00 1. M)-
1
.70 5 . 7 0 -
.60 .60 J 35 45 55 65 75 a5 25 35 45 55 65 75
Specific speed, N,, (rprn)(ft3/4)/(sec1’2)
L l L - .3 . 4 . 5 . 6 .3 . 4 . 5 . 6
Specific speed, N,, (rad)(m3121(kg314)/(sec312)(J314)
(a) Total efficiency. (b) Static efficiency.
Figure 18. - Variat ion of eff iciency with specif ic speed at design blade-jet speed rat io for rotor configurations.
a3
L n
s ._ c m V
c Y)
c x a,
.82
.78
.74 I
L 0 m 5;
. 7 0 - . 0 I I 10 M I 30 I 40 1- ~ 50 I 60 70 80 90 100
Stator throat area, percent of design
Figure 19. - V a r i a t i o n of stator-exit stat ic pressure with stator throat area at equivalent design speed and pressure ratio.
25
1.0- Scrol l and stator loss
Other ro tor “Rotor inc i - dence loss
.9- F s u .- 5 . a - = Exit kinetic energy loss .- u Y
. 7 - -
* 40 u
40 50 60 70 80 30 40 M 60 70 80 Specific speed, N,, (rpm)(ft3/4)/(sec1/2) - u
.30 .40 .M .60 .30 .40 .M .60
Specific speed, N,, (rad)(m3’2)(kg3’4)/(sec312)(J314)
(a) With design rotor. (bl With rotor extension.
Figure 20. - V a r i a t i o n of turbine losses (expressed as an ef f ic iency increment) wi th speci f ic speed at equivalent design spsed and pressure ratio.
26
45. oo 7 a r VIV,, = 0.149
LVuIVcr c 0.105
"VuIVcr = 0.542
4 5 . 0 ' 7 ~ V / V c r = 0.109
:Vu/Vcr = 0.0770
79.2'- r VIV,, = 0.596
b VuIVcr = 0.5%
45.0" 7 g V I V c r = 0.0739
'VvIV,, = 0.0523
82.6" -
VUIV,, = 0.575
79. lo ,-VIVcr = 0.614
13.8"' 'UIV,, = 0.575 0.082 ' UIV,, = 0.575 Uhcr = 0.577
45. O"-B-VIVcr = 0.0366
L b ~ I V c r = 0.0259
86.2"-. ; r VIV,, = 0.551
VuIV,, = 0.550 - WIW,, = 0.040,
', r &. 2" r VIVcr = 0.567 # I
12.2' ' U/Vcr = 0.574 -c
60.3" 1 43.1" ' 63' *" 6 0 . 8 " ~ = 0.187 wIwCr =
' n V / V c r
= 0.176 WIW,, = 0. 192 ecr = 0.210 WIW,, = 0 . 1 6 p s r V / V c r = 0.257
UIV,, = 0.346 UIV,, = 0.344 UIV,, = 0.392 UIV,, = 0.348
Stator inlet
Stator exit
Rotor infet
Rotor exit
100 Percent of design stator throat area 66 Percent of design stator throat area 42 Percent of design stator throat area 20 Percent of design stator throat area
(a) Design rotor.
Figure 21. - Turbine-velocity diagrams for stator configurations investigated at equivalent design speed and pressure ratio.
45. O o - ~ V I V c r = 0.168 45.0"-.$sVIVcr = 0.0958
L' VuIVcr - 0.119 ;vu/vcr = 0.0677
73.6" -= 79'30--
r VIV,, = 0.504
Vu/Vcr 0.381 Vu/Vcr = 0.495
57. 1, r 13.5" WIW,, = 0 . 2 3 3 "IIV,, = 0.409 33.0" , -I 79. '" r VIV,, = 0.519
WIW,, = 0.118 1
UIV,, = 0.577 - UIV,, = 0.573
45.O0-,gVIVCr = 0.0703
'VuIV,, = 0.0497
82.7"-
VuIV,, 0.546
45.0"-, r VIV,, = 0.0362 y '
'VUIV,~ 0.0256 Stator inlet
8 6 . 2 0 ~ r VIV,, = 0.536 I - Stator exit ' VUIV,, = 0.535
29.9' 7, r 86.2' , rVIV,, = 0.552 R
WIW,, = 0.0438; LzbIvcr = o.573 Rotor in'et
UNcr = 0.573
73.8";. 7 2.4",7 72.7" 73.0'7 772.1" WIW,, = 0.538,7
d - V / V c r = 0.252
- 52. lo - 30.0" wIwcr = O . 1 9 ~ I V c r = 0.194
-VIVcr = 0.101 Rotor exit -V IVcr = 0.151 UIV,, = 0.379
UIV,, = 0.333 UIV,, = 0.337 UIV,, = 0.336
100 Percent of design stator throat area 66 Percent of design stator throat area 42 Percent of design stator throat area 20 Percent of design stator throat area
(b) With rotor extension.
Figure 21. -Concluded.
c
M I