Embed Size (px)
Citation preview

Effects of pretreatments of Napier Grass with deionized water, sulfuric acid and sodium hydroxide on pyrolysis oil characteristics
MOHAMMED, Isah Yakub, ABAKR, Yousif, KABIR, Feroz <http://orcid.org/0000-0002-3121-9086> and YUSUF, Suzana
Available from Sheffield Hallam University Research Archive (SHURA) at:
http://shura.shu.ac.uk/12456/
This document is the author deposited version. You are advised to consult the publisher's version if you wish to cite from it.
Published version
MOHAMMED, Isah Yakub, ABAKR, Yousif, KABIR, Feroz and YUSUF, Suzana (2017). Effects of pretreatments of Napier Grass with deionized water, sulfuric acid and sodium hydroxide on pyrolysis oil characteristics. Waste and Biomass Valorization, 8 (3), 755-773.
Copyright and re-use policy
See http://shura.shu.ac.uk/information.html
Sheffield Hallam University Research Archivehttp://shura.shu.ac.uk
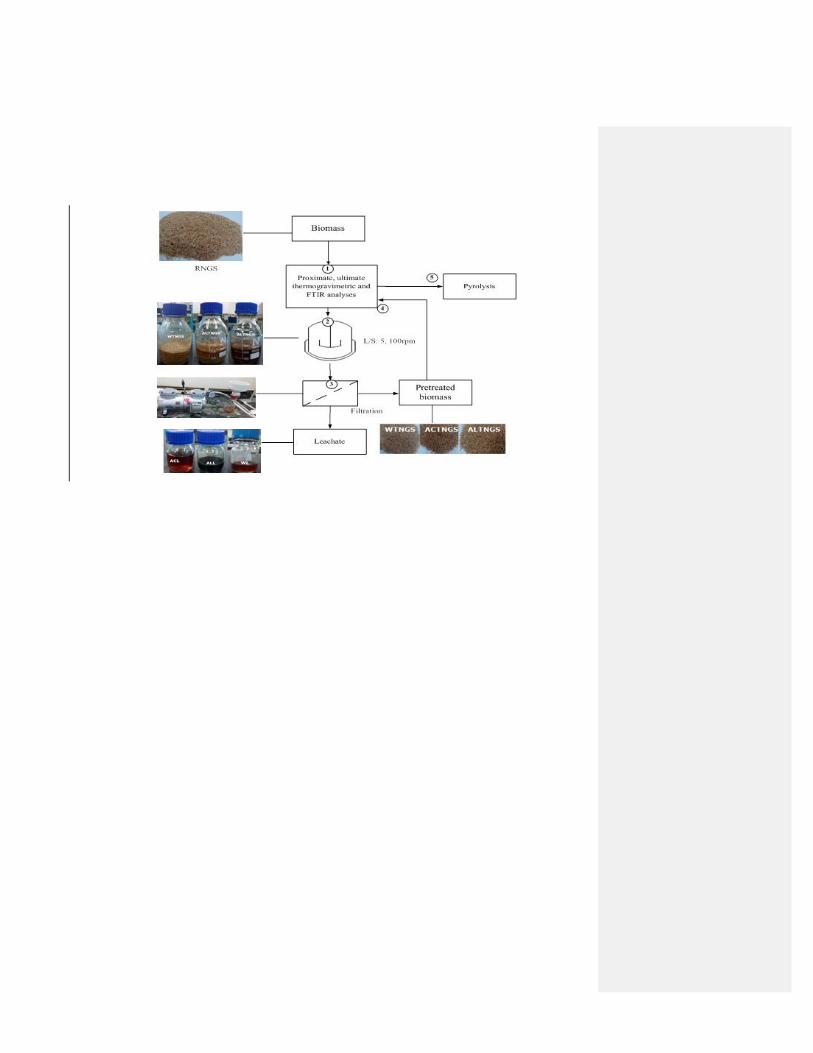

Raw biomass
Proximate, ultimate thermogravimetric and
FTIR analyses Pyrolysis
Leachate
Pretreated biomass
1
2
4
3
5
Filtration
Liquid/solid ratio: 5Agitation speed:
100 rpm
Field Code Changed

Figure 1: Pretreatment process flow diagram. (RNGS) raw NGS, (WTNGS) water treated NGS,
(ACTNGS) acid treated NGS, (ALTNGS) alkaline treated NGS, (WL) water leachate,
(ACL) acid leachate and (ALL) alkaline leachate.
Figure 2. Pyrolysis system with a fixed bed reactor
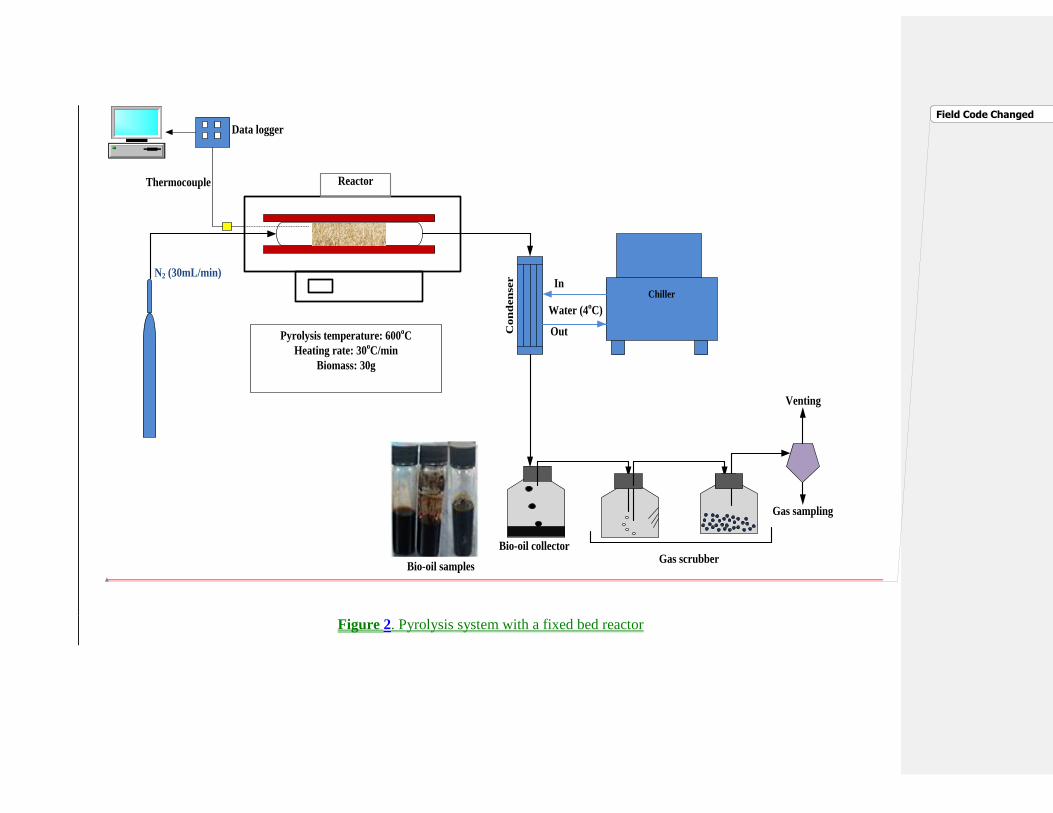
Reactor
N2 (30mL/min)
Thermocouple
Data logger
Chiller
Con
den
ser
Out
In
Water (4oC)
Bio-oil collectorGas scrubber
Bio-oil samples
Venting
Gas sampling
Pyrolysis temperature: 600oC
Heating rate: 30oC/min
Biomass: 30g
Figure 2. Pyrolysis system with a fixed bed reactor
Field Code Changed

Figure 3. Mass and energy yield of pretreated samples. (YM) mass yield and (YE) energy yield
40
50
60
70
80
90
100
0.0 0.5 1.0 1.5 2.0 2.5 3.0
Mass
, E
ner
gy
Yie
ld (
%)
H2SO4, NaOH (%w/w); H2O (Ro)
Yield-M (H2SO4) Yield-E (H2SO4)
Yield-M(NaOH) Yield-E (NaOH)
Yield-M (H2O) Yield-E (H2O)

Figure 4. Effect of pretreatment solvents on ash removal and extractives from NGS.
0
20
40
60
80
0.3 0.8 1.3 1.8 2.3 2.8
Ash
rem
ov
al,
Extr
act
ives
(%
)
NaOH, H2SO4 (%w/w); H2O (Ro)
Ash (H2SO4) Ash (NaOH)
Ash(H2O) Extve (H2SO4)
Extve (NaOH) Extve ( H2O)
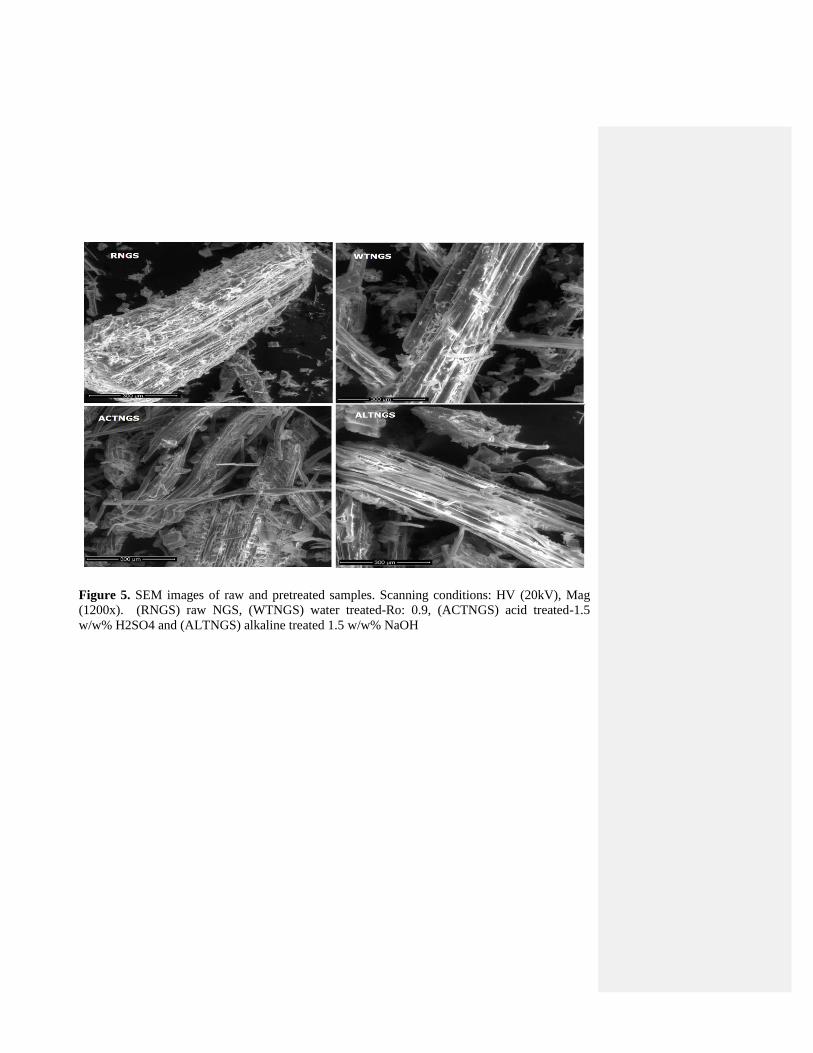
Figure 5. SEM images of raw and pretreated samples. Scanning conditions: HV (20kV), Mag
(1200x). (RNGS) raw NGS, (WTNGS) water treated-Ro: 0.9, (ACTNGS) acid treated-1.5
w/w% H2SO4 and (ALTNGS) alkaline treated 1.5 w/w% NaOH

Figure 6. Van Krevelen plot raw and pretreated samples
0.10
0.11
0.12
0.13
0.14
0.83 0.85 0.87 0.89 0.91
H/C
ato
mic
ra
tio
O/C atomic ratio
Raw Biomass H2O H2SO4 NaOH

Figure 7. Averaged FTIR spectra (auto-smoothed and auto-baseline corrected) of Napier grass
samples (RNGS, WTNG-0.9, ALTNGS-1.5% and ACTNGS-1.5%)
40080012001600200024002800320036004000
Tra
nsm
itta
nce
(A
.U)
Wave number (cm-1)
RNGS WTNGS ALTNGS ACTNGS
O-H
C-H
C=C -CH3-
O-H
C-O
, C
-C-O
C-H

Figure 8. DTG of RNGS, ACTNGS and ALTNGS on dry basis. (e) Extractives; (h)
Hemicellulose; (c) Cellulose; and (l) lignin decompositions. Condition: nitrogen
atmosphere (20 mL/min), heating rate (10 K/min).
0
3
6
9
12
373 523 673 823 973
DT
G (
%/K
)
Temperature (K)
RNGS
WTNGS
ALTNGS
ACTNGS
e
h
h
c
c c
c
l

Figure 9. Pyrolysis products distribution from the raw and pretreated Napier grass samples.
Biomass condition: bone dry, 0.2 to 2 mm particle size; heating rate: 30 °C/min,
nitrogen flow rate: 30 mL/min; pyrolysis temperature: 600oC
0
10
20
30
40
50
RNGS WTNGS ACTNGS ALTNGS
Py
roly
sis
pro
du
ct y
ield
(%
)
Biomass type
Bio-oil Bio-char Non-condensable

Figure 10. Averaged FTIR spectra (auto-smoothed and auto-baseline corrected) of bio-oil from
raw and pretreated samples
40080012001600200024002800320036004000
Tra
nsm
itta
nce
(A
.U)
Wave number (cm-1)
Bio-oil (RNGS) Bio-oil (WTNGS)
Bio-oil (ALTNGS) Bio-oil (ACTNGS)
O-H
C-H
C=
O
C-O
-C=
C-
C-H
C-O
C-H

Figure 11. GC-MS chromatogram of bio-oil samples from raw and pretreated Napier grass

Figure 11. GC-MS chromatogram of bio-oil samples Napier grass. (a) RNGS, (b) WTNGS, (c) ALTNGS, (d) ACTNGS
2 5 8 11 14 17 20 23
GC
MS
Sig
na
l (A
.U)
Retention time (min)
(a)
2 5 8 11 14 17 20 23
GC
MS
Sig
na
l (A
.U)
Retention time (min)
(b)
2 5 8 11 14 17 20 23
GC
MS
Sig
na
l (A
.U)
Retention time (min)
(c)
2 5 8 11 14 17 20 23G
CM
S S
ign
al
(A.U
) Retention time (min)
(d)
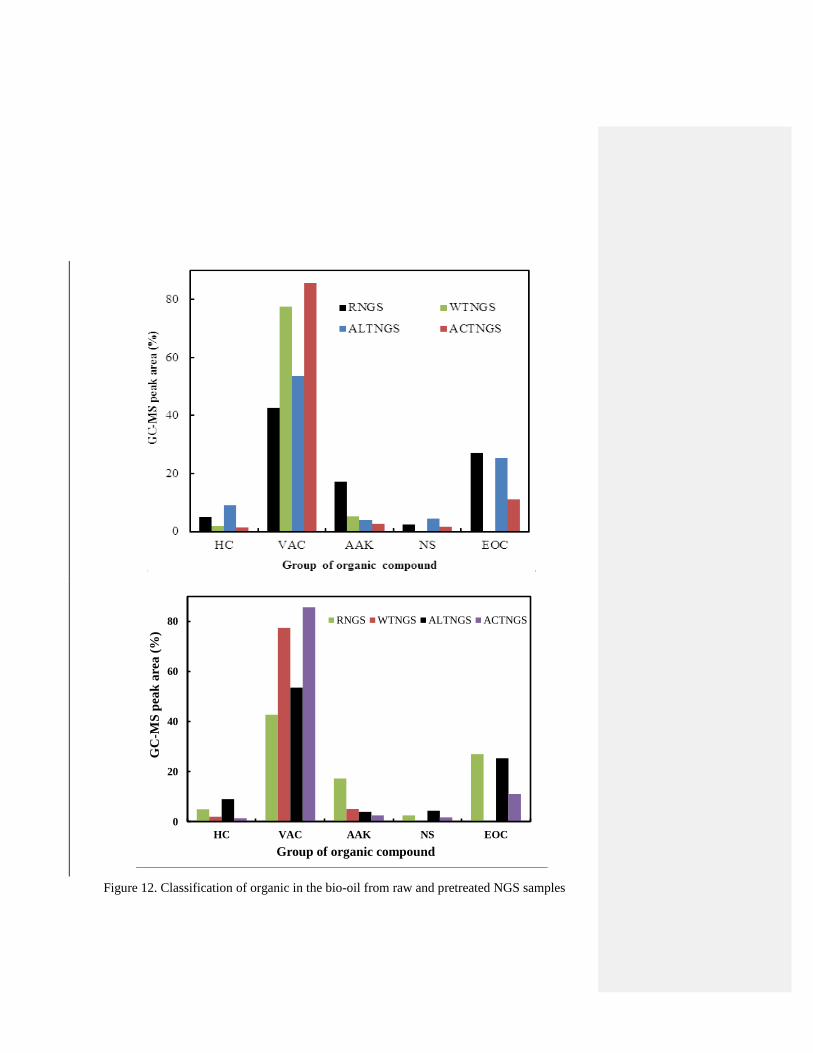
Figure 12. Classification of organic in the bio-oil from raw and pretreated NGS samples
0
20
40
60
80
HC VAC AAK NS EOC
GC
-MS
pea
k a
rea
(%
)
Group of organic compound
RNGS WTNGS ALTNGS ACTNGS


![Auto Tension Device[1]auto](https://img.pdfslide.us/doc/110x75/577cc3991a28aba71196828f/auto-tension-device1auto.jpg)