Embed Size (px)
Citation preview
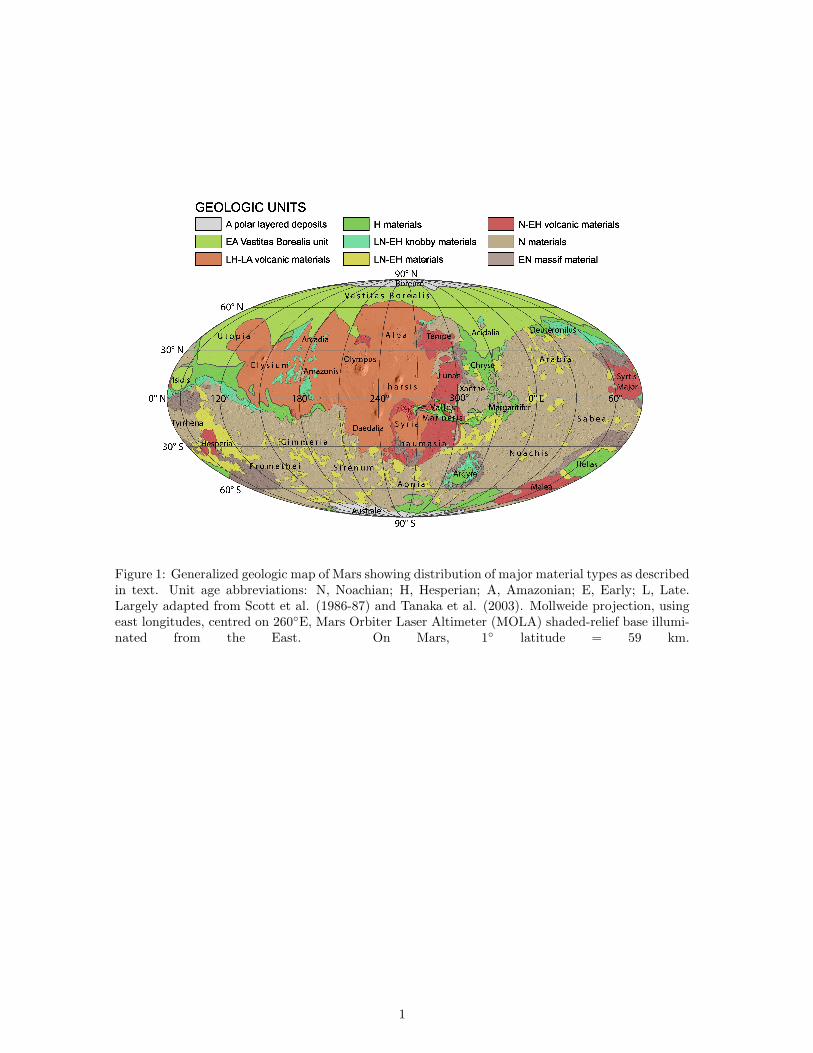
Figure 1: Generalized geologic map of Mars showing distribution of major material types as describedin text. Unit age abbreviations: N, Noachian; H, Hesperian; A, Amazonian; E, Early; L, Late.Largely adapted from Scott et al. (1986-87) and Tanaka et al. (2003). Mollweide projection, usingeast longitudes, centred on 260◦E, Mars Orbiter Laser Altimeter (MOLA) shaded-relief base illumi-nated from the East. On Mars, 1◦ latitude = 59 km.
1
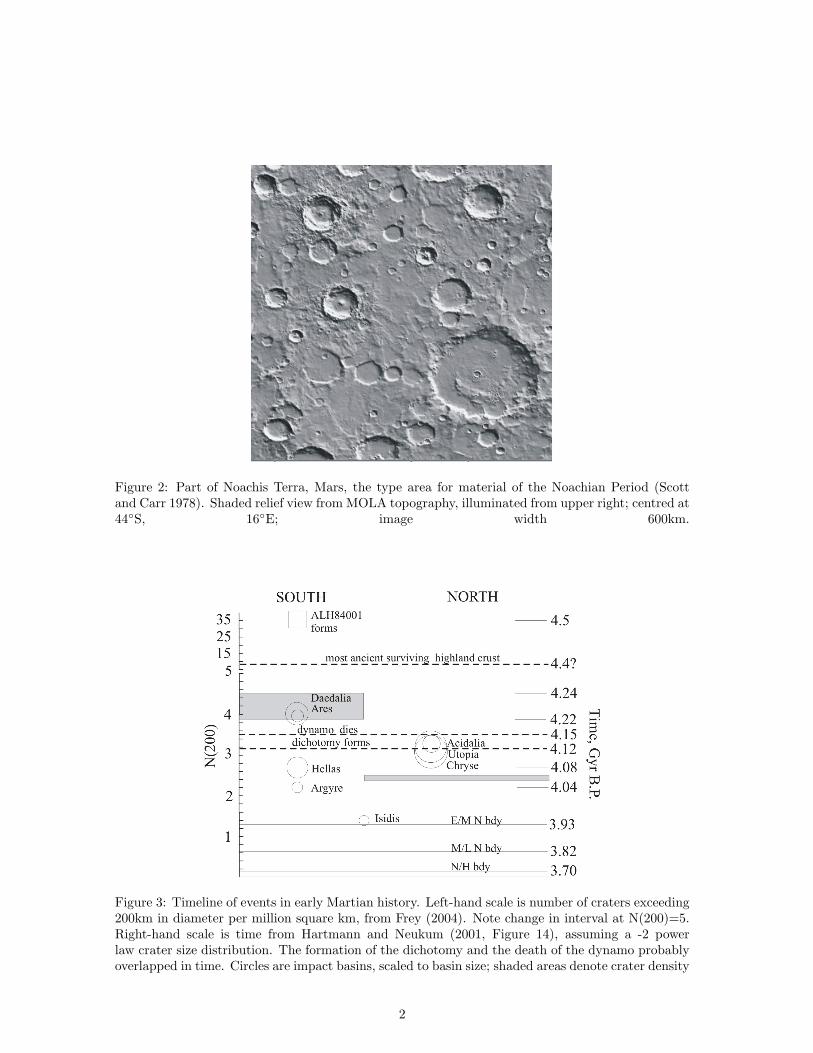
Figure 2: Part of Noachis Terra, Mars, the type area for material of the Noachian Period (Scottand Carr 1978). Shaded relief view from MOLA topography, illuminated from upper right; centred at44◦S, 16◦E; image width 600km.
Figure 3: Timeline of events in early Martian history. Left-hand scale is number of craters exceeding200km in diameter per million square km, from Frey (2004). Note change in interval at N(200)=5.Right-hand scale is time from Hartmann and Neukum (2001, Figure 14), assuming a -2 powerlaw crater size distribution. The formation of the dichotomy and the death of the dynamo probablyoverlapped in time. Circles are impact basins, scaled to basin size; shaded areas denote crater density
2
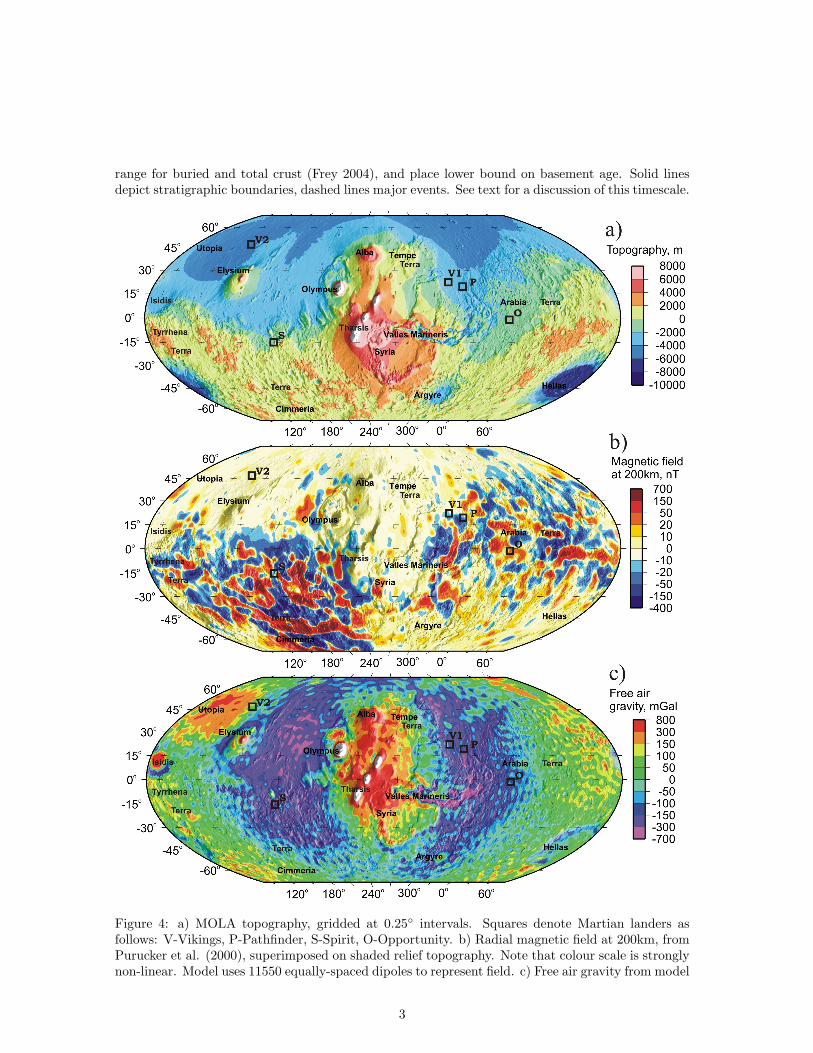
range for buried and total crust (Frey 2004), and place lower bound on basement age. Solid linesdepict stratigraphic boundaries, dashed lines major events. See text for a discussion of this timescale.
Figure 4: a) MOLA topography, gridded at 0.25◦ intervals. Squares denote Martian landers asfollows: V-Vikings, P-Pathfinder, S-Spirit, O-Opportunity. b) Radial magnetic field at 200km, fromPurucker et al. (2000), superimposed on shaded relief topography. Note that colour scale is stronglynon-linear. Model uses 11550 equally-spaced dipoles to represent field. c) Free air gravity from model
3
MGS75D (Yuan et al. 2001), evaluated to degree and order 75.
4
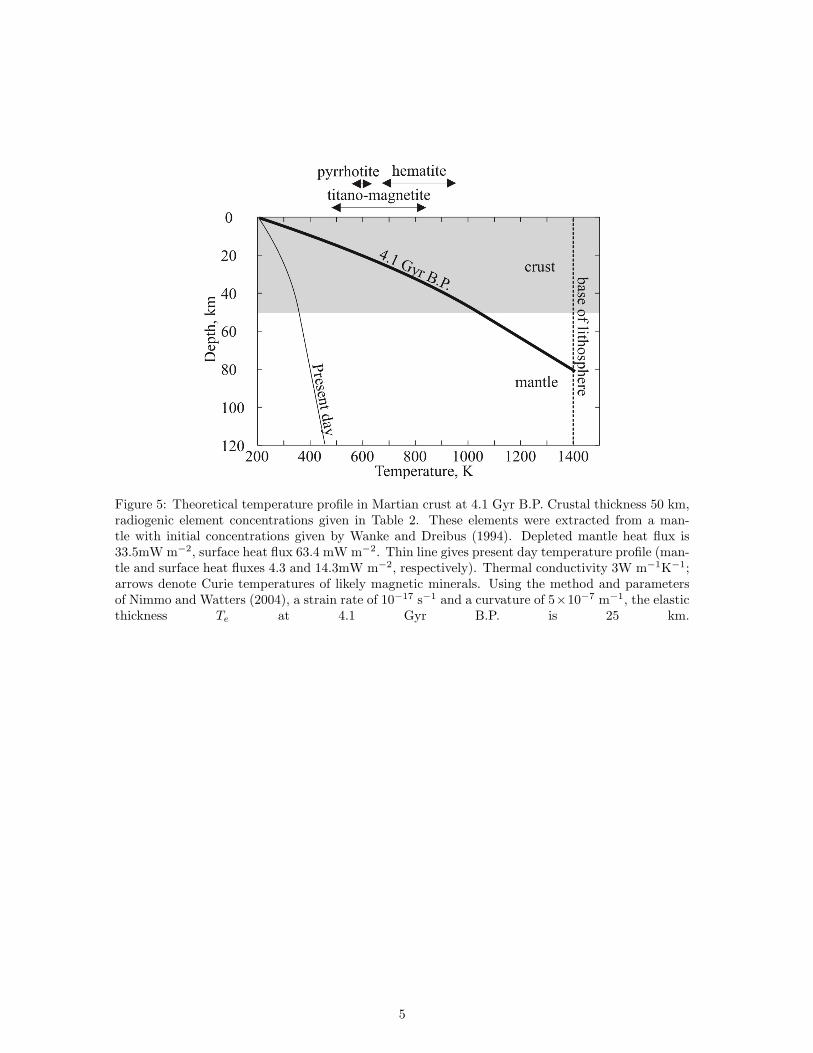
Figure 5: Theoretical temperature profile in Martian crust at 4.1 Gyr B.P. Crustal thickness 50 km,radiogenic element concentrations given in Table 2. These elements were extracted from a man-tle with initial concentrations given by Wanke and Dreibus (1994). Depleted mantle heat flux is33.5mW m−2, surface heat flux 63.4 mW m−2. Thin line gives present day temperature profile (man-tle and surface heat fluxes 4.3 and 14.3mW m−2, respectively). Thermal conductivity 3W m−1K−1;arrows denote Curie temperatures of likely magnetic minerals. Using the method and parametersof Nimmo and Watters (2004), a strain rate of 10−17 s−1 and a curvature of 5×10⁻⁷ m−1, the elasticthickness Te at 4.1 Gyr B.P. is 25 km.
5