Embed Size (px)
Citation preview

EFFECTS OF POLYVINYL CHLORIDE (PVC) PIPE ON THE SAMPLING OF ORGANIC CONTAMINANTS IN GROUNDWATER
BY
Laurie A. Boucher Old Dominion University
CE 4594: Soil and Groundwater Pollution
November 11, 1990
- .
.
Section
Introduction . . . . . . . . . . . .
Background . . . . . . . . . . . . .
Desorption from PVC Casing . . . . .
. .
. .
. *
Table of Contents
. .
. .
. .
. . .
. * .
. . .
Adsorption of Organic Compounds to PVC Well Casing
. .
. .
. .
. .
. .
. .
. .
. .
Paqe
. 1
. 1
.2
.3
? Adsorption Research .................... J
Conclusion ......................... 5
Bibliography ........................ 6
i
. ‘ . ‘ . . . , . . . ‘A.
Table
1
List of Tables
Title
Comparison of Well Materidl Adsorption
ii
Paqe
4
.‘.-P.*,..‘.*, . :
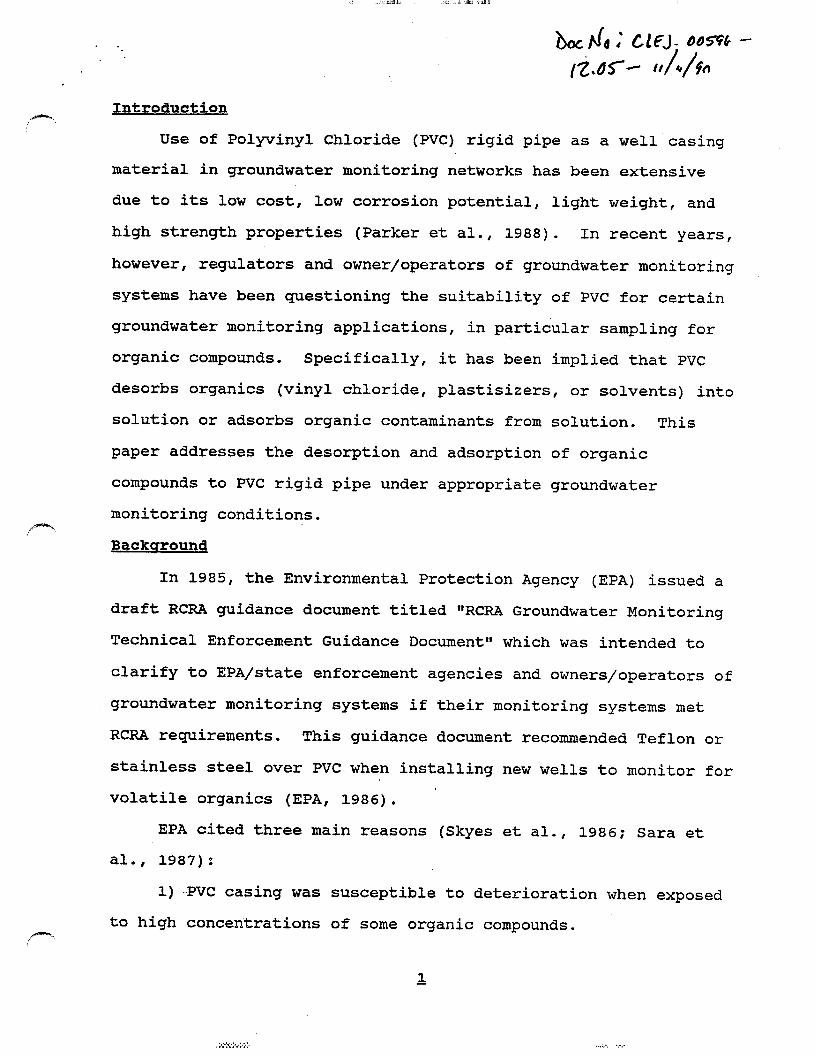
Introduction
Use of Polyvinyl Chloride (PVC) rigid pipe as a well casing
material in groundwater monitoring networks has been extensive
due to its low cost, low corrosion potential, light weight, and
high strength properties (Parker et al., 1988). In recent years,
however, regulators and owner/operators of groundwater monitoring
systems have been questioning the suitability of PVC for certain
groundwater monitoring applications, in particular sampling for
organic compounds. Specifically, it has been implied that PVC
desorbs organics (vinyl chloride, plastisizers, or solvents) into
solution or adsorbs organic contaminants from solution. This
paper addresses the desorption and adsorption of organic
compounds to PVC rigid pipe under appropriate groundwater
monitoring conditions.
Backaround
In 1985, the Environmental Protection Agency (EPA) issued a
draft RCRA guidance document titled "RCRA Groundwater Monitoring
Technical Enforcement Guidance Documentl' which was intended to
clarify to EPA/state enforcement agencies and owners/operators of
groundwater monitoring systems if their monitoring systems met
RCRA requirements. This guidance document recommended Teflon or
stainless steel over PVC when installing new wells to monitor for
volatile organics (EPA, 1986). '
EPA cited three main reasons (Skyes et al., 1986; Sara et
al., 1987):
1) --PVC casing was susceptible to deterioration when exposed
,f-==- to high concentrations of some organic compounds.
>>:...;*.,:.:.:. a..::. . . . . .
,- 2) Plastisizers and monomers in the PVC casing could desorb
into the surrounding aqueous compounds, thereby creating a false
positive reading or masking the presence of other pollutants.
3) Organic compounds present in the groundwater could adsorb
to the well casing. EPA considered this critical since removal
of contaminants from solution could result in a false negative
reading.
Teflon and stainless steel were not considered to present
the deterioration, desorption, or adsorption problems associated
with PVC exposed to organic compounds (Sara et al., 1987).
DesorPtion from PVC Casinq
The belief that rigid PVC casing desorbs constituents into
the groundwater may stem from misinterpretation of earlier
research (Dressman et al., 1978) conducted with PVC formulations
containing high concentrations of leachable residual vinyl
chloride monometer or on flexible PVC tubing containing high
amounts of leachable plasticizers (Sara et al., 1987; Nielsen,
1988). In addition, desorption of solvents such as
tetrahydrofuran, methylethyleketone, and cyclohexanone from the
solvent-cemented PVC joints into the surrounding groundwater also
implicated PVC (Sosebee et al., 1982; Barcelona et al., 1983;
Gibb et al., 1984; Sara et al., 1987).
The PVC material typically used in monitoring well casing is
tested and approved by the National Sanitation Foundation (NSF)
and is expected to be essentially clear of monomers and
plastisizers which could leach out and bias sample results
(Barcelona et al., 1983; Parker et al. 1986; Nielsen, 1988).
2
Research was conducted to compare the desorption effects of
rigid PVC as compared to Teflon. In the results, PVC was' found
to be a less active desorber than Teflon (Curran et al., 1983
quoted in Sara et al., 1987).
Adsorotion of Oraanic Comnounds to PVC Well Casinq
The adsorption issue may stem from the EPA's
misinterpretation of Barcelona's (1983) work (Sara et al., 1987).
Based on the material's compatibility with typical ground water
contaminants, Barcelona concluded the Teflon and stainless steel
were the materials of choice, since PVC had the potential to
deteriorate in a highly contaminated groundwater environment
(Barcelona et al., 1983). Sorption effects were not considered.
The EPA extended this conclusion to prefer use of Teflon or
stainless steel, regardless of the water quality being monitored
(Sara et al., 1987).
Adsorption Research
The research does not support the conclusion that PVC is an
unacceptable groundwater monitoring well casing material where
appropriate sampling protocols are adhered to.
Sykes conducted a study to determine differences in the
effect of PVC, Teflon,. and stainless steel on the adsorption of
six organic compounds. The experiment was designed to simulate
typical groundwater monitoring protocols in which the well casing
is exposed to contaminants for an indefinite length of time,
purged of stagnant water, then sampled within 2 to 24 hours of
purging.- Results indicated that no statistical difference exists
between adsorption of the organic compounds tested to PVC,

. .
Teflon, or stainless steel when exposed to concentrations
approximating 100 ppb (Sykes et al., 1986).
Sara et al. conducted a similar experiment. PVC was exposed ,
to organic-contaminated groundwater allowing a sufficient period
of time for any adsorption equilibrium to occur. The stagnant
solution was then removed and replaced with a fresh organic-
contaminated solution. Results indicated a net sorption rate of
zero.
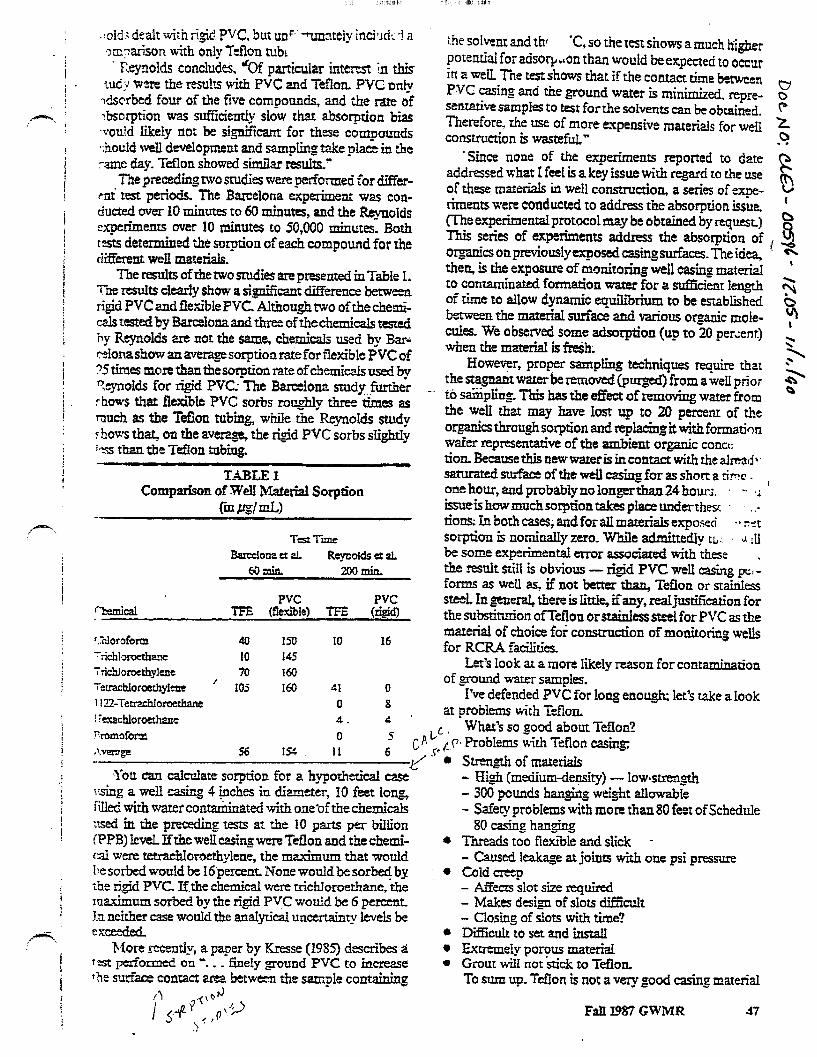
Research was conducted to compare the effect of casing
materials (PVC, Teflon tubing, and stainless steel) to the
adsorption of five organic compounds. Results are shown in
Table 1 (Reynolds et al., 1985 quoted in Sara et al., 1987). Note
that Teflon tubing and rigid PVC have, in general, comparable
adsorption affinities. ,r"">.
Table 1. Comparison of Well Material Adsorption
Adsorption (ug/L)
Chemical Teflon PVC (riaid)
Chloroform 10 16 Tetrachloroethylene 41 0 1,1,2,2-Tetrachloroethane 0 8 Hexachloroethane 4 4 Bromoform 0 5
Average 11 6
Barcelona conducted research into the effect of well casing
materials (Teflon, stainless steel, and PVC) on the variability
of results obtained from groundwater sampling for organic . .
compounds. Although results indicated some variations in
analytical results as a function of well casing material, these

. .
variations were not consistently higher or lower for any one
material tested. Well purging techniques proved the most'
sensitive process affecting variability of analysis results
(Barcelona et al., 1986).
Another study was conducted to determine the adsorption rate
of solvents to finely ground PVC particles. Grinding the PVC
increases the adsorption contact area was from what would be
expected in the surface area of an actual monitoring well.
Results showed that when the contact period was minimized,
accurate reading of solvents could be attained (Kresse, 1985
quoted in Sara et al., 1983).
Conclusion
Desorption of organic compounds from PVC rigid is not known
to occur with the use of NSF tested and approved rigid PVC pipe
joined by threaded flush joints versus solvent-cemented joints
(Sosebee et al., 1982; Gibb et al., 1984; Barcelona et al., 1986;
Nielson, 1988).
Adsorption of organic compounds to PVC well casing has not
been substantiated by the research data (Sara et al., 1987).
Studies, particularly Sykes et al., 1986 and Sara et al., 1987,
designed to simulate actual groundwater sampling protocol both
indicate that adsorption of organic compounds to PVC does not
interfere with obtaining representative groundwater samples when
proper well purging procedures are used.

Bibliography
Barcelona, M.J., Gibb, J.P., and R.A. Miller. 1983. A Guide to the Selection of Materials for Monitoring Well Construction and Ground-Water Sampling. Illinois State Water Survey
Barcelona, M.J. and J.A. Helfrich. 1986. Well Construction and Purging Effects on Ground-Water Samples. Environmental Science & Technology, v. 20, no. 11, pp. 1179-1184.
Curran, G.M. and M.D. Thomson. 1983. Leaching of Trace Organics into Water from Five Common Plastics. Ground Water Monitoring Review, v. 3, pp. 68.
Dressman, R.C. and E.F. McFarren. 1978, Determination of Vinyl Chloride Migration from Polyvinyl Chloride Pipe into Water. Journal of the American Water Works Association, Jan., pp. 29-30.
Gibb, J.P. and M.J. Barcelona. 1984. Sampling for Organic Contaminants in Groundwater. Journal of the American Water Works Association, May, pp. 48-51.
Kresse, F.C. 1985. Exploration of Groundwater Contamination. Bulletin of the Association of Engineering Geologists, v, 22, p. 275.
Nielsen, D.M. 1988. Much Ado About Nothing: Well Construction Materials Controversy.
The Monitoring Ground Water
Monitoring Review, v. 8, no. 1. pp. 4-5.
Parker, V.L. and T.F. Jenkins. 1986. Suitability of Polyvinyl Chloride Well Casings for Monitoring Munitions in Ground . . Water. Ground Water Monitoring Review, v. 6, no. 3, pp. 92- 98.
Reynolds, G.W. and R.W. Gillham. 1985. Adsorption of Halogenated Organic Compounds by Polymer Materials Commonly Used in Groundwater Monitors. The Second Annual Canadian/American Conference on Hydrogeology: Hazardous Wastes in Ground Water - A Soluble Dilemma. Banff, Alberta, Canada, June pp. 25-29.
Sara, M.N. and D. Shosky. 1987. Do Casing Materials Affect the Integrity of Ground Water Samples Obtained After the Well Is Purged?. Ground Water Monitoring Review, v. 8, no. 1. pp. 4-5.
Sosebee, J.B., Geiszler, P.C.f Winegardner, D.L. and C.R. Fisher. 1982, Contamination of Groundwater Samples with PVC Adhesives. and PVC Primer from Monitor Wells. Environmental Science t Engineering Publication, Jan.
continued
Sykes, A.L., McAllister, R.A., and J.B. Homolya. 1986. Sorption of Organics by Monitoring Well Construction Materials. Ground Water Monitoring Review, v. 6, no. 4. pp. 44-47.
U.S. Environmental Protection Agency. 1986. RCRA Ground Water Monitoring Technical Enforcement Guidance Document OSWER- 9950.1, pp. 78-79.
. . . .._

It’s about time we ended all of the senseless arguments over which casing mate& is “the bex”for-mund water monitoring welis and focused our attention on some of thf: more im~ortanr issues confronting ground water profession&‘involved in conducting monitoring pro- gems. Much hti been said over the passr few years, and nuc~ effort and money has been’ spenr in attempts to su&an&tt one position or another regarding them of the mri01.~ types of casing and screen im3.terial.s in mom- toring we’&: Virtually al1 of the arguments relate to monitoring wells insrahed for the purpose of compiying wir h RCRA ground water monitoring requirenenrs. Tne cxslyst for most of the heated discussions was theinitial &it (Au=- 1985) of the US. EPA’s RCRA Ground Wxer Monitoring TechnicaI Enforcement Guidance Document (TEGD). which made me absurd statement ihat “in constructing v&Is, the ownerjoperator should use Teflori. sztinless steel3 i6. or other proven chemicahy .z nd physicallv stable materials.” The subscquenr furor rexited in a&hr softening of the language in the fina (September 1986) version of tie TIZGD, but by then the damage had been done.
Bo*& versions of the TEGD, as many peopIe pre- ciic ted. were grossly misapphed by inexperienced federal an!i state regulatorv agency personnel _grasping desper- ateiy for guidance &at wouId provide ans.vers to ques- tiorls that were never posed to them in cogegc. Some Iesr;-than-learned regulatory personnel were, in fact, ztxmpting to use the guidance offered by the TEGD in lieu of informed professionaI judgment, and were ,at- ttmpring IO appIythe TEGD guidance. much of which is tm~ubsranriated, as a regularion of regulatory require- nent. The TEGD itseifsraces. “it is nor a regulation and should not be used as such,” but a much stronger, more prominent statement reIating KO th: use of the document ~2s needed. A sitilarly strong statemenr relating to the need for the use of informed professiona jud”merit ap- pIilrd by trained and esperienced agency personnel may bate helped us to avoid the current situation.
Fotrunareiy, in”a recent decision (KSWMA v. US. EP.A), the U.S. Court of /q~praIs for the District of Columbia Circuir made a stronger sr;rtement in ruiing thnt “the TEGD is not a regulation or requirmment, the TEGD has no binding Icgat force on (owner/operators)
and, in any future enforcement proaxdmg regarding a ground water monitoring Fern, the methods set fond in the TEGD are subject to chaifenge.” ‘Ibis may be the first step in correcting a siwarion that should have bczn anticipated and headed off by the EPA long ago.
Perhaps rhe most notorious misapplication of rhe TEGD to dare has heen the bIind insistence of many federal and state re@atory agency persontie that every UEII instalied for the purpose of monitoring ground water, whether for RCRA compIiance or not? be instaIled using fluoropolymer or 3 t6 stainkss steel casing and screen W%en asked for the basis of their decision, these foIks answer, “becaux the bIue book (the TEGD) says so.”
.Some states have already adopted or arc considering adopting this srance as reguIatios even though the avail- able scientific evidence suggests that this is nat a defensi- ble position And, if you consider the practicabii~iry of requiring the use, for example, of Ruoropolymer well casing and screen (to say nothing of the cost), it simply doesn’t make good see. Fhxoropolymers are by no means the panacea many people would fiie to believe.
. The pfain facr is, fluoropofymers aren’t v&l suited for use as wcII &ng materials; their physical properties simply do not lend themseIves welI to appIications in sertid borehoIes completed as weha Why not? Consider rhe foIIowing (I) the VQ low tensi.Ie strength and high weight per unit lengrb of fluoropol~mer materials (espe- CiaIIy compared to other plastics) results in asigni&xnt Iimitation on Insratlation depth and a high potential for f&n-e at cuing joints; (2) the materials’s Iow compressive strength, hi& weight perunir length and ductile behavior resuIt.s in the part.2 cIosing offluoropolymer we11 scnxn openi;:gs and a consequent reduction of well efficienq: (2) the cxtremt flexiiity and Iack of rigidity offIuoropo- Iymer weII using causes casing srrhgs to become bowed and non-plumb in the boreholc during installation; (4) because of the lack of compressive strength and the .coId-flowabfe nature of fIuotopoIymers, screens are only available in sIot;ed casing which C&I clog easily and make weII deveIopment difficult; (5) the non-stick nature of fiuoropolymen that makes them so desirabIe in other appiications resulu in the lack of formation of a compe- tent annular seal with nezt cement grout: and (6) recent research ar the University of Waterloo sug.gests that even

xg.;nic chemic& at rats md a~, ,nts %ter and higher Ihan other pIastics.
On the other hand;the research that is commonly cited as condemning PVC has its roots 5 work conducted some vears ago oil PVC tubing, which has high ievels Of plakizers added to it to enhance flexibili? or on ri$d PVC that cbntined high ievels of residual ~mnyI ehlonde monometer (RVCM). In the finr @tee. PVC casing is a hardened, rigid material whose formulation does not include niasticizes that could potentia!& kach 0% ad
- . ..-.. -.d - w. pling prorucol. ’ sc!ec:ion of a isi3orafor~ that can provide anat+. .sub in which one can have con5 dence. We must place t’ne casing mater& issue in its
bat cJt?:cL&l - OOsPG -AH- oh/, proper perspective. Unfortunately. a great deal more effort and money
w-iIl probably beexpended by the U.S. EPA and others in , an attempt 10 re:nlve the casing materials issue, but
ground water professionals al- the answc~. As in aI other situations m
on definition of rhe hydrogeo- logic system must be made, “it &pen&.“& &per& on :!
in the &end place, today’s for&.tlarions of PVCnsed in rigid pipe are CbntroIled by NSFStandard 14, and do not leach RVCM or vinyl chloride; More recent resezimh suggests that rigid, hardened Type 1 PVC penTorms better in laboratory sorption/leaching studies than fluoropoly- mer materials:
Those who have foIlowed the casing materials issue ;.ilOW that the ,p& bdk of research done to date It;?s been conducted under Iaboratoty conditions, where cas- ing materials were usually exposed to a solution over proionged periods of time (several days to severaI monrbs), dlowinp an extended period of time over which the materials couid exhibit sorption or leaching effects. While this may be comparable to a field sirnation in which ground water is exposed to well casing as it may be between sampring rounds, few studies have considered the fact that prior to sampI&, the well is usually evaeu- ared of stagnant water that would have been in contact with the casing between sampling rounds. Thus, the wzter that would have been tiected by sorption or leaching effects (ii they were present at au), will idea& have been removed and replaced with aquiferquali~ water. Because tbt sample is genera@ taken rmmediarely after the casing has been purged of stagnant water an& fu&er!. because the pump intake or baiier is usually piaced within or just above the screen to take 8 sampk, the water that is taken as a sample ~31 have had a minimum of time (seconds or fractions of asecond) with which to come in contact with ting materials. Is this long enough to produce the oft-mentioned sorption or leaching effects? Not very likely. Several researchers have pointed out that potential sampie bias effects due to sorptive interactions with w&l casing materials may be discounted or eliminated for this reason They further suggest that these effects are far more critical in sampIe transfer and storage procedures empioyed prior to sarnpte W&is.
Assuming th3t you accept this argument, isn’t It annarent that the focus of much of the effort in solving piiblems related to ground water monitoring has been on the wrong issue? Is casing mat.eriaIs even an issue? I would at,oe that it is dose to Iast on the list of issues that should be d&&with in the establishment of monitoring programs. Preceding it should be such important issua as proper location of we1i.s. estabiihment ofsite-specific weli design criteria (other than casing) that ail1 ensure acquisition of representative srrmplts (avoiding such ubiquitous problems as siltation and grout contamina- tion), development of a thorough undc,rstanding of site
uiqudser of site-specific and k$.&caI factors, indudin~ geologic environm:nt, natu.raI geochemica1 envircmzen r anticipated well depths, types and concenuationr -:I known or c?;pecred contaminants, well dril!lr _. :~.11:oci and type of we11 completion, among other facrors. This is a fact rhat is we&recogmzed by experienced practitioners of hydrogeoloz. Despite what some would have UC believe: there is no ‘best” well using material applicable over the wide range add variety of natural and ~~27. induced site-specif’ic conditions. Rather. it is iznpottan: that the site-specific conditions be properly cha.cacrer&Y surd evaluated so that casing material can be tailored ts meet the unique set of conditions that exks at each .;ir : Thus, where natural geoch:mical conditions indic? a high corrosion potential and where synrherk 01-y. contaznination of water is present at leveis high :I~ - to chemicahy degmde other plastic easing mater!.? ! measured in percent), fiuoropolymerc+&sscrtrn rr:;: risk may, in fact, be the best choice.-Where corrosl~ potential is lowand synthetic orggc contaminzkion o’ witer is at high Ieveb. stainless steel may be the bes ehoirr Fiberglass casing mat&ah ma? have application But in the vast majority of cases, where corrosion poteo rid%Itiw and wheresynthetic organic chemical contar’, ~imztioa Fnay Ek encoumered at levels that are not pig’ enough to produce chemical’ d$radation effect& PV’J casing wiLI probably s&&e, as ithas in tens of thousand ofwds ahcad? in use around the country. What it take to make these determinations, however: is a propetl. trained, we&informed profmional who can make soun professional jud_ments based on scienriiic evidence.
In xn> vicav, theeffort and money that wil1 bespent 01 the casing materials issue couid be better spent in proper1 developing more cridcdly needed guidance, in educatin rhoss peouIe who are new LO the profession, and in hirin
more qt.&&. es;:erienced, we&informed professional to staff regulatory agencies. I’m either optimistic or naiv enough to believe that we can purge the system of th people who cannot exercise professional jud-merit an who must therefore rely on~&concei\ied -tidance w&e b_v bureaucrats and ideahsrs r&et than -practitione; and realists. The time ~31 come when people who unde! stand the teeltnicat issues and who can garher the scirntifi evidence required to support professional judgrncnt wi sit on both sides of the table. but it will be a frustratin experience wSting for that time LU rurivc. Until then. suggest we focus our sttention on more serious issue than debzning which casing material is bLxt-

This is rbe last of four ‘Point-Counterpoint” &&&s planned to appear in this coium~~ These articles are based on digcussionsessions held ar the Sixth National Aquifer Restorarion and Ground Water Monitoring Conference. A brief article outlining each speaker-s opinion is offered firss followed by the transcript of the ckussion session during w?kh atiendees have a chance to ask the speakers questions on the subject
Q&lioAJ .!.* 6,. 1Mmtin N. suru
I’m going to tak today first abil.J.1 the regulations, thart about the iiterature of casing merials - iassant ~u:facc chepistry and rteent tests @onned to simulate T TIN water sampling and finally, I’ll rikxss problems
:i : h Teflon@.
bem%xtion In my opinion, ground water monitoring has become
the singe most important nqulacc~ y issue concerning wsce storage, treatment and dispo~ -I &cilities. The fed- ml government has enacted specific cods within the xE-,ourte Conserwion and Recovery Act (RCRA) to :ld+zss ground water mouitoring at reguiated faciiities-
lJ~epurposeandgvalofthegroundwa~t~monitoring I ‘1 qarn is to “determine a facility 3 imnact on the quality
of :gound water in tbeuppcrmvst aq&er underlying the i3ciJiq7.” To accomplish this goal, each facility must ‘ti Xd ~.gtound watet lllOnitOtiIl_P SystCIIi tb2t i5 capable of $elding pound water sampIes for analysis and mtrst co~L~t of: (I) monitoring wells (at tcasc one) ixmdkfl h~dratilicaliy q$-adient . . . ,“yZ) monitoring we& (at !mt three) installed hydrauLica& domgradiezz Thtir nu-nber, locations, and depths must eusure that they immdiately detect auy statistically si~gniknt tiounts of hazardous waste . . . V (40 CFR Palt 265). RCRA fu.rTher states, “AU rnoni~oring wells must be cased in a mmner that nzaintains the integrity of the moniroring
we!1 borehole. This casing must be screened or perforated SWI packed with gxzcvef dr sand, where nmary, to en.?bIe sampIe collection at depths where appropriate aqGfer flow zones exk-
Since little or no guidance was provided on appro- prixe use of .casing material at the time of the RCRA regtiatious were prrlmulm* most operators installed poiyinyl chloride (PVC) casing in both the original and sl.rb-equent monitorkg systems. This materialwas readily ~aUk fairly Inexpensive, and had a long history of use in water supply, ‘In the inttrvtning years, a number of qUrstions were raised couCernin,a exact& which casing ma-erial is appropriate for use in a monitoring we& and
some research was in&ted to provide guidance in this
-InitiaUy; n3.333y W&s were insraIled using glued joints. Not ,nndl the EPA started requiring extensive organic anikiyses was it dkcovemd that ghrecl joints p- ,A ‘- -q-
atninate a motiroring well’with such chernicais 2~: hydrofuran, methykhylketone, and cytlohexanota Such chemicak would normaIly be washed out of 2
~~oaalwater~~usedfordomesricpwposes, but for monitoring wells usefi only once per quarter, the organks would not likely be totally washed out for years. T!x: reputation of PVC was thus tainted as Some people, unaware of the actual cause, believed the organ& were desorbing from the PVC.
The second factor rhat raised some question was the availability of alternate co&g materials. Materials such as T&on and 316 sr&~~Iess steel were suggested because of their appzzl-ent %XtneS” ptiat5Iy with respect &o organis. T&on has Iong been thought to be a stable, LWizmivve, in~materiaLThisledtothesuggf&ontbat Teflon or 3 16 stainless steel would be pmferable to PVC, Barceiona et aL (1983) stated, ‘A preJim.inq ranking of commonly used mater!& (for well construction) was ‘performed on tie basis of chemical compatibility and mamktum’s recommendations. Compariiility was judged from the point of view of ~ote&al deterioration of each mate&L Yo second ordereffects such as adsorp don, absorption or leaching were considered.”
The pditninary ranking presented was: T&on, St&ess St& 316, st2irlless Sted 306, PVC I, Lo- Carbon Steel., Gal\&ed Steel and Carbon Steel.
Tlte intent of krcelona’s paper was, presumably, to show that under cert.&u circumstances, such as highly contaminated ,=und water; PVC might not stand up and that it would be prudent to consider Teflon or stain- Iess steeL HowevTr; his conch&on has beefy extended by ,rhe U.S. EPA to include all monitoring wells without zonsiderarivn of warcr quaky. This misii~erpretation of the facts forms &e background for the cunccar cons mmrsy~ The ccJntrovmy
The controversy surrounds the Auegust 2985 draft guidance document titled RCRA G~~T.u&v~u~ Morzi-
/@-. !
I cl m;: Technical E.Vorcerr.el Wdance Document Y;IEGD), ujkh wzs.intended .J heip EPA and state er$orcement off5ials decide whether spec.fic elements of an owner/operator’s ground water monitoring system sarisfy the RCRA requirements. The guidance document. sam that only Teflon or stair&s sn%! are acceprabie for u’jt as scan or czsiq in new well installarions; While the a,gency has backed off on requiring the rrse of these materials for she fuliy cased weIl to only th2t portkm
_. ’ located within the saturated tone, the guidance rezquin- ment raises serious questions as to its te&nicaI tidity.
There are three primaq’ reasons why the U.S. EP& t bas decided that PVC is unacceptable as casing material
‘1, in the saturated zone: 1. The U.S. EPA believes that PVC wizl ti5t’ be’&.&%
cientiy ~sistant to attack by concentrated or_eaaics. This befiefstems from repoits of PVCcasinginsMled at CERCLA sites collapsing after being softened by high conceatratioos of ogznics.
2. The U.S. EPA believes that PVC dcsorbsar emit3 contaminants to otherwise uncontaminated ,mund water. This misconception or@nates from confusion ~i~~@eprevio~~~Iydesc&edproblemwith@u~ joints and also from published workthat descrii the oiease by PVC of some compounds that are used as
tastim. The U.S. EPA believes that PVC adsorbs tihemic& fmn the waxer; thus deiaying the detection of contam- inatioz This belief is bzsed on the misinrerpteratiaa
-of the work of Barcelona The U.S. EPA believes that T&ion an :I stainless steel
do not &ii any of the preceding problems.
Dm&on * The first issue regardingPVC tied bytheguidelines
is t&red to its ability to stand np to high concentrations of cheticaI solvents. This, we believe+ is a moot point in this discwsion The issue is whether PVC is adenuate for ti indeteaionmonitoringwells at RCRAfaciIi&. Our experience with aimost 3000 monitoring we& ~ggests that interim status CaciJiries designed to RCRAspecifica- tions, i.e., double liners, leachate colle IR systems, etc., have yet to detect mi-gmtion of ordc constituents in high concentrations that would threaten the integrity of PVC cas?ig..Even in cases where contaminants hzve reached the parts per milliou leve1: no instance of PVC casing failure has occurred to the ‘txst of our Scnowkdge. Fmally, if levels of orzgania from a product spill, there are i3Rernate mateiials.
The second issue involves the reported desorption of I -- ~nt.a&mts to otherwise clean gcounc! water. The Use 4 % \‘!’ of iin& Nation& Sanition Foundation (NSQ tested
-Ii?. and approved PVC fornmlations can be expected to reduce the possiibiIi~ of desorption of either fesidu3.I monomer+‘%?lle~ stabilizers orp’ianicizcrs: Proper cl-- ingof the wdl c&g material and well indlation
,6 \ equipment will further reduce the pussib* of later dsorption of contamin~ts.
! 3 The exclusive rise of threaded flush joints &zvents
8ny residual ch~~fromsolvent-cemhtred joina from contamintig the ground water sam$e. Cunan and
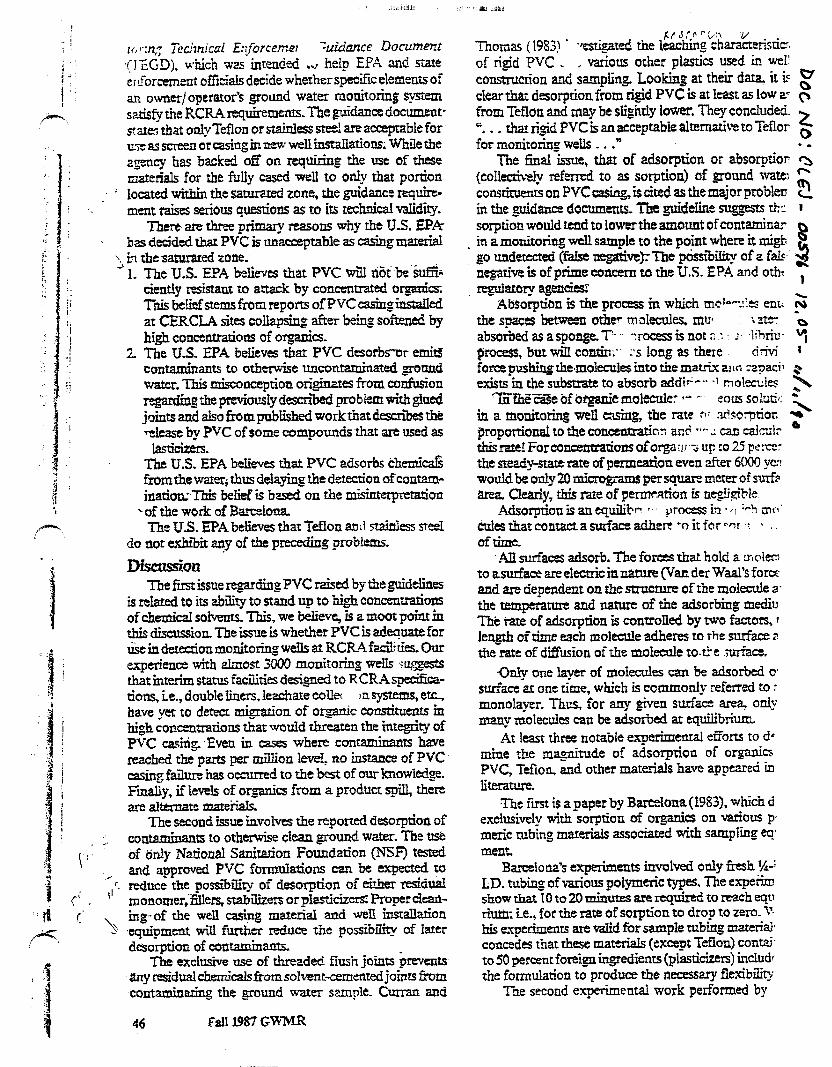
Tnomas (1983 )If J,~fiP>i\ ,t/
* mri2ated the leaching characterisri~5 of rigid PVC . , &ous other plastics used in weI! construction and sampling. Looking at their data. it k g clear thai desorption from rigid PVC is at least as low a~ e from Teflon and may be sIighhrly lower. They concIuded. u . . . that rigid PVC is an acceptable alternative to Teflon: 2 for monitoring welis . . .*
0
The final issue, that of adsorption or absorptior .< (collectively referred to as sorption) of ,mund watch & coostituenrs on PVC casiug, is cited as the major probleo L in the guidance documents. The guideline sng$srs ti: 1 sorption would rend ta lowerthe amount of contamioar in a monitoring well sample to the point where it migh 8 go undetected (f3sc neg&ve)Xhe p&&i&y of a f&, ~ 3 negatie is of prime concern to the U.S. EPA and 0th~ regulatory agenties:
,
Absorption is the process in which mc+::es em. the spaces between 0th~ molenrl~ mu*
$ ;zit= o
absorbed as a sponge.? ” ?rocess is not r. .: J' ~iihrb "1 $roces$, but wiii con&:*. :*s long as there ckivi 1 forcepushingthe~molecules into the mati uict za?aciI ~0 exists in the sd to absorb a&ii+--* -1 no!ecc!a
‘hiiE=e bf M-g&e mvi&3sIe: +- -. >
eons soltrtir: “\
-Au srtrfaces adsorb. The forces that hold a :noier.l to asurface are elect&? in nat~.~e (Van der Waai’s for= and are dependent on the structure of the mo&uJe a+ the t.mperam and nature of the adsorbing mediu Tk i%tte of adsorption is ControIled by twg factots, 1 length of time each molecule adheres to the snrfm 2 the rate of diffusion of the molecule to.t,le .zrface-
Otily one layer of moIec&s can be adsorbed 0 surface at one rime, which is commoniy referred to : monolayer. Thus, for any given surface area, a& many mokcuks can be adsorbed at equilibrium.
.4t least three notable experimenral &orts to d* mine the magnitude of adsorption of or_sani= PVC, Teflon. and other materials have appeared in literatures
The rim is a paper by Barcelona{ 1983), which d esccfusiveiv with sorption of 0xganirZS on variorrs p metic tub&g materials associated with safnp~iag w-Q’ menf
Barcelona’s experiments involved only Fitch ‘/a-; LD. tubing of tzious polymeric types. The expeti show &at 10 to 20 mimtes are required to mch eo-17 r&ix Le., for the rate of sorption to drop to zero. Y. his experiments are valid for sample r.~biig material, concedes that rhese materials (except Tefion) conti. to 50 percent fore@ ingredients (plasti&.er~) include the formulation tc~ produce the necessary flexibi&;
The second experimental work performed by
dd .t dealt with rigid. PVC, bus unf. xmely incixi~ *! n .xc;xuison w<th only Teflon WbL ’ kpolds concludes. 40f particular intercc in this
tud;t were the results with PVC and Te5oa PVC only qdscrbed four of the five compounds, and the rare of ybsorption was sufficiently slow that absorption bias .vou?d iikely QOK be significant for these compounds .:houId well development and sampling take place in the raQtf! day. Tkflon showed s-imiku resllhs.”
The precediig two studies were +perfomred for differ- cni test periods. The Barcelona expe+ent was COR- ducted over 10 minutes to 60 minutes, and the ReynoIds experiments over 10 minutes to 50,000 minutes. Both tzsts determined -&e sorption of each compound for the difkent WCS mate&la
The results of the two studies are presented in Table I. The results dearly Show a si=nifinnt diffffertce betwcm rigid PVC and 5exibIe PVC Although two of the cheti- cdstestedby Ba~ceIanaandthreeofthechemic& tested by Reynolds are not the same, chemicals used by Bar; &onashow an average sorption rate far fiexibtt PVC of ?5 times more than the sorption rate of cbernic& used by ?eynolds for rigid PVC; The Bax~iona study flier dtows that 5exible PVC sorbs rot@ly three &mes as mch as the T&on tubing, while the ReynoIds study d~ows that, on the avetztg- the rigid PVC sorbs sIightIy hs than the T&on tubing,
Test-l-ii BaxceIoLtz et 4. Reynohis et d
6oroh 2oomin.
PVC PVC TFEi (fk&Ie) TEZ (rigid) Qtxaicid
Therdore, a+ IJX of mare expensive materials for wea construction t wi3stefu.I.”
% . .
‘Since none of the experiments reported to date g addressed what I feei is a key issue widt regard 10 the use of these ttam&Is in well const~~ctian, a series of expe-
n\
riments were conducted to address the absorption issue. r(’
(The experimental protocol may be obtained by request) c1 This series of expe%i.menrs address the absorption of I ~ @ o~csanprrviousiyexposedcasingsurfaces.Tneidea, y therS is the exposure of monitoring weII casing materiaI to conraminated formatian water for a su5iciem length of rime to allow dynamic quiliirium to be established
(4
between the material surface and various organic moie- s c&s- We observed some adsorption (up to 20 perGent.) when the material is fYe&:
-.
HowmTr, proper sampliug techniques require that .P thestagnantwat.erberemctved@uagcd)fromaweUprior Q a t6 sa&piin$ This has the &ect of removing water from the well that may have lost up to 20 percent of the organicstbroughsorptionand repk&n~itwithformad~n wafer *prcsentative of the ambient organic corm: tion.BecausethisQewwaterisincoQ~Witfitheal~d~’
saturated suxfacc of the well casing for as short a ri~!c . one hour, and probably no longer than 24 houtx -. G ’ issueishowmuchsorpriontakespIaEe~mderthesi. . ..- tions; In bath cases; and for alI materials exposed -6 nrt sorption is nominaUy zero- While admittedly EL: - J. :U be same experimental error associazed with these . the redt still is obvious - rigid PVC welI casing pi - forms as well as, if not better rhan, Tenon or staintess std. In =mer2& there is lit&l% if any, real justification for the substitution of Teflon or Stainless steel for PVC as the marti of choice for consauction of monitoring WeUs for RCRA facilities.
Let’s look ;ZL a more likely nzason for contamination of ground water samples.
I’ve defended PVC for long enough: let’s take a look at problems with Teflon.
?-OMOfOi?Al 0 6’ . What’s so good about Teflon?
,lvvenge !% I54 II c h f”&~ ProbIems wirh Teflon casing; I/ l SWgth of materials
,lbu can caIcuIate sorption for a h~yparherica case sing 2 well sasing 4 k&es in diameter, 10 feet Ion&
a High (medium&&ty) - Iaw~stfen_&
Xled with water con&ated with one’of the chemicals - 300 poudds hanging weight allowable -
the rigid PVC. Ifthe chemicat wee trichforoerhanc, the maximum sorbed by the rigid PVC would be 6 percent
med in the preceding tests at the IO parts per billion IPPB) IeveL IfYh e well casing were Teflon and the chemi- CA were te&achlaroethylene, the maxbnum that would be sorbed would be i6’percent None would be sorb@ by
- Affects slot size required - Makes design of slots difEicuIt
Safety probIems with more than 80 feet of Schedule 80 casiq hanging
l Threads KOO ff exible and stick - - Caused teakage at joints with one psi pressure
l Cold creep
In neither case would the anaIYr;cal uucertaint~ levels be CXfGtZdd
More r+zently? a paper by Kresse (1985) describes & Pstpf2.l3~edan’... finely mund PVC to increase The surface cmxact ata between the sample containing
.
- Closing of siots with time? * Dicut~ to set and install 0 Exutmely porous material l Crour will not *&tick to XfI on.
To sum up. T&ion is not a very good casing material
FaD I987 GWMR 57
:he solvent and thf ‘C, SO the 1st shows a much higher potential for adsor+on than would beexpected to oaur in a ML The ~CS show that if the COU~~CC time betwen PVC casing and the ground water is minimized. repre- SeQrarive samples to test far the solvents can be obtained.
B (’

a-it2 wc, a.5 scientists and en_& 9, should nor end up ii+ Cum. G.M *nd ND. Thomson- 19S2- Leaching Louis .Apzke, tfie 19th cent jwks geolo_eis; after the Tract: 0% s igo Warer from five Common Pb: 1906 San Francisco ea~hquzke - with our head in rhe tics. Ground Water Monitoring Review. v. 3, pp. 6 pavement. Kressc. F.C. l985. Exploratioa of Groundwarer Cc
In closing, let’s put Teflon and stainiess stee1 back tamination, Btiletin of the Association of Engineeril CT! where they belong - in our frying paas. Geologists, v. 22, pp- 275. 8
Reynolds, G.W. and R.W. Gihhan~. 1985. Absorption ‘2, References Haiogenared Organic Compounds 3~ PoQmer MS Q Barcelona, MJ, J.P- Gibb and R.A. Mikr. 1983. A riah Cornmoniy Used in Groundwater Monitors. T ’ l
Guide to the Selection of Materials for Monitoring Second -&mtlal Canadian/American Conference f ‘;t WeU Consuuetion and Groundwater Sarnpbng. Illi- Hydrogeology: Hazardous Wastes in Ground Way fi, nois State Water Survey. -A Soluble Dilemma, Banff, Aiberra, Canada, Jv 5
Barcelona, ML, J.A Helfrich and E.E Gantke. 1984. Sampling Tubing PVC Pipe. Submitted to Journal of ~zkid & American Water Works Association, November 29. AWPL .j
opinion 11 .’
by Lkm Shusb
Thtquestionposed tothespeakerstbiseveningis~do ~.gm~~reallyaflectrhe~t~~~gro~water samples obtained after the well has been purged?*
~e~isaLiecle)>itofcoa~~~yonihissubj~alot 0fpeopIe feel stron& about casing mate&&. There are many types of c&g avaiIable on the market to&y. To name a few, webe gotsmtinless steer, carbon resins, PVC and fiberglass.
I’d Iike to &scnss my opin;ons c0nceming the fstctors that influence the leaching or absorbing Of cone onthesedifferentcasingmaterials.ThenI~easemy~y into the purging issues -use theyYe sepatare, yet they’re the same.
Somerimes~osethin~;bbeabasicch~~~- ity to a par&&r contvninaat For exampie, perhaps mtain cbeaiid chsses such as hydrocarbons, tfyough hydrogen bonding, crsuid absorb into PVC. The reverse is a&o true siwe after samration occurs we cati have relate of those same conta.&ants back into the envir0nmeuL
We dso know that under certain conditions wae lwhg czm be a problem with some casing mate&L You cerc2inly can-t purge three casing vohmles out of your well if your well doesn’t exi% Weie nm into this problematalotoffacilitiesthatrreatwoodproducts.use a Iot of creosote, PCP, things oftbat nalxrt, One day the 24nch piece of pipe is sticking out of the ground, the next day it’s gone
We also know that geologic conditions affect the integi~ of a particailix well &g matetiaL We know that high and low pR environmentr somedmes raise havoc with casing mat- such as sr&less steel, but thea so does e&e chemistry ia certti ground wate% With high TDs, say 150,000 parts per millio~~ web had a real issue of what tupes of wells to install.
The pomt I’m trying to get at here is that we should be
looking at selecting casing material for patticuim sir tions. What are the waste materials that we’re dea’ ~~?WhatistheabilityofthatpsvticulvEasingmat:. to work weU*in the environment that its going tc exposed to? If it doesn’t have long life for its inten purpose, why put it in? Why go out and put in ano: well ia five or six years because the one yo* have, ~tted away? Whichgets usinto the question ofhow i adequate pur&g of the weLi make a difference in sarnpk that's obtained.
My experience ia taking ground water samples comparing our data with that that’s being s&ctec fa&tiesismoreofcentbannotwedon’thaveanadeq~ weU purge.
Righr now 1 have several appLications where afar using PVC is starting to see some contaminant $x.hdateS. It so happens that the same facility has v smams that contain phtbaiates and we’re seeing 10 7 pam per bilEon in these wells. The company claim PVC casing leaching this r&ate&l out
These are questions that are posed to me, regulator.
Thepoinrthatfm~ghereisthatintbis~~r the phthalates may be cir may not be coming fmr PVC casing. I aIs0 know alittle bit of b&or-y about particular sites and I know that the purging that’s done ar those sites have been highly variable Over :
Sometimes as much as seven casing volumes been pumped out of a par&c&r we& other tiox casing volutn~ Phthalates show up at different cc tmioas, at different times. Is i 1 ri plume, or is it the c material that3 leaching?
I’m not trying to put ode type of casing mater% the other, but I do have a strong opinion that we s! always be looking at the most compatible casing m: for a particular situarion-
There3 another thing that causes some iaterc confirsion at these particular locations. We*re only I ingoutthesewellsonce#erythnemonths,onan”l’ sampling bask
Is fhc well purge ade&atewith that kind ofr& time? With higher yield wells, the residence time prc isn’t sing to be that long, even when we don’t go 0’

;;q:: the we!1 exyt GIL =* the- and four-moilin icardS. In iowtr yieid srtux.ions, thr _ the rrr;idence time
ccdd be .a lot longer. -What VX& seeing there is longer t.xposure of the wafer to the casing material. so there is a _en~etopporrunityforwh~s~~r~~ rhecasingmaterial to corn: out.
Now the real question becomes, can i go out and take out my one casing volume before the well dries up ant! is ihat going to be adqua= LO rot&y firtsh the weiI of contaminants that could be in there due to the casing mmrid, regardIess of what kind it is?
Quite frankly, the answer in my mind at this point is I don’t know, Dataseems to sub- that there is 2 chance that a lot of that mater&I will StiII be in the well.
Another interesting point that I’d hke to make is to take a iook at the webs that are our at your site. Do they look dirty?
I Iook at a &ety of different wells and how they’re constmcred. A lot of times welI casing appears dirty from leached matee that’s been sIopped on tne sides or maybe absorbed into the casing material.
How is that casing material going to react? Over time, is it gomg to start r&r&ng thost: contaminants? You could have chzmed up the aquifer and you’re monitoring
what your casing is releasing over time, Or youire insi- gat:d a COITK~~~ tioa program for 20 year5 longer than you need be~.~e you are monitoring those same conuuninanui over time-
The lasr thing I’ii discuss is structural integrity. What I’m trying to push here is finding appropriare wing material for the conditions. What is the waste material t&t we’re dealing with? What are rhe~onstituenrs? What
ae he constituents and life expectancy of the casing material?
Nothing is morefrustzaringthan to go out and take a water 1eveI ‘measurement and have the weU faU over
‘because everWfG.g has rotted underneath it, Nobody believes me, L.tt it happens.
Based on the data that’s come across my desk from a mriety of different t4pa of facilities, these &ciiities beheve that part of their contatnination probiems are from the easing rmerid rfiar they use
My adyice is, let’s use some type of inert material and let’s go for the highest quality ground water sample that we can ge& so that we don’t have to argue about whether or not the contaminant is coming from the casing mate& orthe site.
‘Discusn’on .
From the Floor I’ve got a question for both par&- I’ve been heating a lot iateiy about the magic of fibergg and epoxies- pave you rud. across anythir~_e, either for or 2gzinst rhea?
S~~JXC When the systems are so sensitive, 1 would heskate to use anyrhing that doesn’t have a long history of use.
Sh&yz Iwouldsaythatndyne~t-~of~gmaterial or any casing mat&I thti hasn’t gone through both field testing and real lab evaluation shouid be looked at with sptxuiarion u&J adequate testing is provide& This dots not reflecr the opinion of the agew, but is a personal opinioa
From the Floor: I have a question for both The reason for pur-ging a weil is to get fresh formation warer in therefore taking a molecule some distance from the casing md bringing it up to the surfze. We% assum- ing &at we’re not getting any conrzc~ How do you address the issue?
Shosky: Well, ihe real issue is what’s an adequate purge? One of the bes+ documents that I’ve found on this subject is one produced by the tie&an Petroleum hrimte, which discusses theories about well purging and recommends r.har uncierczrtain conditions. if the we11 is designed properiy, purging should be kept to a minimum. They’re considering the well as a dynamic system where there is flow continu+Ily through the Wdi
_.
If you operate tmder the assumption that certaLa easing materials w2.i tibsorb or adsorb codtamiLLants then release them over time, my concern would be &at the purging was done adequately-
Hpw much purgiap is enough if there is con@-
t
nant dmfs being released in the well,, and does that fit i in with rhe rest of the sampling scheme that you have for a ptitiarfacisi~
I’m not in the habit of OK’ig excessive purge VoIumes out of a we& like 70,80 casing volumes.
If anything is being reIe2sed into the we& it’s my fpeg that probabIy within two to three casing voiumes, you’d be removing mosr. but possr’bly not all of the con&ants from the welL
Smc Well, I’m probably not going to be able to add much to rhat other than 1 personally believe that all monitoring weUs or piezorneters should be tested for the ab&yto yield water- I thinkthat’s veiy important. It’s one&.x people miss a loot It doesn’t do much good to say thar you have to puII three casing volumes of water om of a hole that has an overah uansmissivi~y of _ I merer monitoring point in asituation where you are going to get at least enough yield to be able to get an adequate sample. That means more tiran one casing volume.
From t&e Float: I’d like to ask if in-spite of a17 the evidence and the fact that there are few people whL ctre credrble scientists who side strongly for the use of Teflon 100 percent of the time, what flexibiry exists on the part of EPA?
Shosky: There’s a couple options we have as Rguiarors. One, throw the book on the tabk and say you1 fohow this or you’ll be in trouble. NormaLly what we do is sit down and we look at the site conditions arid the type of casing material that best fits those conditions.
Now this is my personal style, but if somebody come3 in to me with an argument on cost only, I[ don’t listen to ir I’m being honw with you, I don’t. The thing that matters to me the most is that the best casing m;rtetid is installed that will yield the best
.

quidit~ s;~-z~ple q:cn if pizri~~~~~ .7Lk-..r--. If tt happens to bc Tefir bzi that’s what I ask to
be instailed- If ir happens oe stainies~ SUZ& then that‘s what I ask to be insti!ed. On a few of the sites that I’ve looked at, because of certain conditions that exist at that panicular facility, we*ve allowed PVC. Educated regelitot and educated fzw pemon or consultant should come in and negotiate which casing material can be used. based on site-sp&ic data
From t&e Floor IVhat kind of cost differentia.I are we talking? I imagine them is significant cost in the begin: ning. but overrhe~drecourseof aj~_vearmonitormg pFcgranL is rhat siigcaall?
Shosky: The cost dif%enxti& for the c&t& mater% donearcn’t thatmutfiwhencomp~dwi~theen~ cm of. instaU& a welL
Most of us know that the real cost in i.n%&ng a weU is the time that the guy spends out there p&g the well in. 7le cost of the casing is insi@ficant when you’re talking about paying somebody SO or 70 bucks an hour plus driSler’s time-
Sara; The whde eontext of my talk was not that PVC is less expensive, which it tight happen to be. The most -important thing is that experience with PVC proves it is generally acceptable for RCIU. No matter what the cusSth~plpento~WC~OK,~mtbisiSSue~’t just EPA.
From the Floor: Mar& in your pymation you showed data reia&tg to up to 200 mrrlirtts, then Iater you talked about you should only put monitoring wells where wells wii~yieId water. What ifthere’s not a place on the site where the well will yield water at 80 feet? This is contiuuous, very thin saud Iemes over a thin shale. Is there such a thing as au exemption from ground water monitciriag?
Saw ~s~everreallyever~ted~~youkndw,at least you m& the offers, just to be a nice 5-Y,
Moderator Gravest What material do you recommend for use for dedicated b8.ilers that _you*r goa to reuse in sampling we& that hae extensive volatile orgnnics in their concent&ons, let’s say betweeu 50 and 5OOO?
Sara: What 1 would normally probably do is not use bailers but use dedicated bladder pumps- Witha bailer of any mat&al, you stiu end up with-a situation where you aa de&g with material properties, and mateziaI properties arc based on adsorprion, daorption properties.
If you haye stagnant warer well that is going to be difficult to sample. no matter what kind of bailer you
ShG:J Eke to use those clear T&on bailers over the !staidess steel because I still like to look at and smell the water when it comes out of tie well
Saran Looking for TCE you mist not want to use TefIou You might w3nr to use PVC.
From the FIoot: I have a question for Martiu On what do you ‘base yourstatement that T&on willdeteriorate with rime?
Sara: Sust open up the Merck Manual and turn to t&e page where it talks about T&on, and read it for yourseK
50 Fall 2987 GWMR
.-- - . . _.._ _
alluded to where Teflon wouta it: UGLL~~ LLLY.. . .- !tspeay i 1 have product spill,
Shosicc; It is one thing to deal with the pmbbnls J exuemeiy contaminated sites when you’re talkir: about the lower Ievels and the company is teiiing yc that it’s coming from their PVC well oasin$ but tlv+ is a real good possibility that could be coming fro! z their site. Those are the kind of decisions that we fa( o as regulators every day- . .
Sam Acmally I agee with Dou If you have to take t! g appro& that @.I order to defend your site that you‘ q got to blame your wells for orgauics results, 1 tb.i. 7 you deserve to put in T&Ion wells.

Samples taken for analyzing the quatity of ground-a&r can be altered by certain materials used in the construction of monitoring wells and even by the containers used to collect samples. Similar problems can occur with samples taken from a distribution system. Further research is needed to refine analytical procedures so that actual in situ data pertaining to orgaqic compounds in groundwater can be obtained.
The base flow of perennial streams can be attributed to groundwater. Groundwater is also the source of half of US drinking water supplies.’ Yet groundwater has received only token scientificattcntionin termsof itsquality and protection. Almost no attention has been given to proper sampling procedures to determine accurately the quality of groundwater.
The passage of the Safe Drinking Water Act (PL 93-523) in 1974 finally recognized groundwater as a major source of drinking water and established standards of groundwater quality pro- tection. Later, the Toxic Substances Control Act (PL 94-469) and the Resource Conservation and Recovery Act (PL 94. 480) further r&ognized the significance of groundwater resources and the im- portance of their protection against the increasing threats posed by human activities.
Since the beginning of the industrial age, a variety of new chemicals have been introduced into the environment by man’s indiscriminate use and waste
48 MANAGEMENT AND OPERATIONS
disposal practices. Since World War II, the explosive development of the syn- theticchemical industry has added thou- sands of chemicals to the environment. Chemical Abstracts announced in March I972 that it had registered two million unique chemicals since January 1965.2 These chemicals enter both surface’ watet and groundwater-not only through waste disposal but also as a result of normal use.
The presence of many trace organics in groundwater, even at very low con- centrations, may create short-term or long-term health hazards3Theinclusion of approximately 113organiccompounds on the US Environmental Protection Agency (USEPA) priority pollutant list indicates the significance accorded these chemicals by US health officials.
The identification of organ&, par- ticularly in drinkingwater supplies, has always been a difficult problem, although in recent years significant progress has been made in the development of analyt- ical separation and identification tech- niques. Considerable attention has also
been given to proper procedures for 1 preserving samples to ensure that co10 i lected samples undergo minimal them ’ ical change between collection and analy sis. However, almost no effort has been made to determine what procedures could ensure collection of groundwater samples that are representative of the quality of the resource in its natural environment. This article address-2 some of the problems associated with sampling public water supply weIls and constructing groundwater monitor@ wells. Principles affecting organic compod~
Scalf et all correctly noted that a positive sample fr0m.a monitoring wef! may prove the presence of a contamman! in groundwater, provided the inte!#? of the well and Ihe sampling procedure are intact. However, a negative samPI*’ does not necessarily prove the absent’ of contamination in the aquifer. ni dicussion points out some factors tha’ tend to bias analytical results and ma! compromise the credibility of both PO” tive and negative sample results.
The relatively unstable natureof mani chemical, physical, and microbial CoF stituents in groundwatercontribute” the complexity of securing represent’ tive groundwater samples. Because tt
JOURNAL A:’

c:rysi,cal, chemical, and Piological as- pdsof the subsurface eflylronment are tO closely interrelated, It IS difficult to ifiat with one without the others being affgted. In devising groundwater sam- ,,!ingpt-otocols, the effects of collection, preservation, and handling procedures ,,,, each of these aspects must be consid- fld to ensure sample integrity. (See yr’estrick, page 52.)
The act of sampling may cause changes b water temperature and pressure that inay, in turn. affect the water quality. Groundwater is usually well insulated and, therefore, normally experiences a nnrrow range of temperatures. When withdrawn from the subsurface, it may &ergo temperature changes of IS-25% and rapid changes in pressure. Degas- $ng, aeration, and temperature varia- boos can cause significant changes in the solubility of volatile compounds and r]r,er the chemical speciation of many ai;solved chemical constituents. Pres- &e and temperature effects 6n the carbonate system may shift the pH or redok potentials and affect thechemistry of iron, manganese, sulfur, oxygen, and other mineral equilibria. Gibb et ai’d indicated how the selection of sampling apparatus alone may drastically affect the pH and chemical speciation of the pfl- and redox-sensitive elements.
Temperature and pressure also affect microbial growth. In order to assess the in situ activity of subsurface microor- ganisms, sampling methods must be selected that will not disturb theground- water or contaminate it with foreign organisms.’
In addition to altering water chemistry and subsurface microbiology, sampling can influence the integrity of ground- water samples by contamination or loss b means of contact with materials in the sample delivery system. Certain materials in contact with the sample can cause organic chemicals to be sorbed from the water samples or leached from the materials into the samples. For example. MiIler* studied three types of well casing exposed under static condi- tions to two metal poltutants and six volatile organic pollutants. He reported thatpolyvinylchloride(PVC)pipecaused lasmonitoringinterferencewithvolatile organics than polyethylene or polypro- pylene under the conditions of the experiment. Junk et 819 determined th,at organic contaminations ranging from% to5000 1(6/L by weight were observed in organic-free water that had flowed through tubes of polyethylene. polypro- pylene, black la’tex, six different formu- lations of PVC; and a plastic garden hose. Among the contaminants leached from PVC were o-cresol, naphthalene, butyloctylfumarate, and butylchloroace- tale. Curran and Tomson’* measured the leachate concentrations found in organic-free water !hat had been cir-
culated through five different types of plastic tubing (polypropylene, polyeth- ylene, PTFE, vinyl chloride and vinyl acetate copolymer, and PVC, with and without solvent-cemented joints). Their results indicated low levels of leaching from all of the tubing tested except PTFE. Numerous contaminants were leached from solvent-cemented PVC and vinyl chloride and vinyl acetate co- polymer.
Pettyjohn et al” and Barcelona et al’* compared the merits of preferred well construction materials in relation to the cost of construction and the quality of resulting data. The materials in order of preference are: glass, PTFE, stainless steel, polypropylene, other plastics and metal, and rubber. Each monitoring situation must be assessed to determine appropriate materials for well construc- tion in order to reduce bias in analytical results. Thisconsideration is particular- ly significant for hydrologists and con- sultants who must justify additional costs involved in using more expensive, inert materials.
The materials used in wells and pumps can alsoaff&ct water quality from public water supply wells. Well casing and pump materials are normally chosen on the basis of strength and durability, whereas little or no attention is given to the possible impact the materials may have on the quality of water delivered to the surface. Similar problemsexist with regard to distribution systems for public water supplies. Studies by Schreibe+ showed that contrary to the expected results of increasing trihalomethane (THM) concentrations throughout dis- tribution systems, the highest concen- trations of THMs often were found at the treatment plants. Studiesconducted by the PVC pipe industry and the USEPA” for five public water supply systems using PVC pipe detected no vinyl chloride in water conveyed through the pipe. Dressman and McFarren’S found vinyl chloride monomer in con- centrations of 0.03-1.4 pg/L, in distribu- tion systems ranging in age from new to nine years old.
Studies conducted by Boettner et aI’6 demonstrated that low levels of akyl tin species may be leach@ from both PVC and chl@inated PVC (CPVC).pipes ,by
surface, and many factors can affect ti degree and type of leaching from the: Pipes. Sampling public water supplies for organic contamination
Public water supply wells (raw wate Lmdfimsheddrinkingwaterareroutine sampled in response to regulatory r quirements. Sampling taps are locatt at the well heads and at various point throughout distribution systems for 0’ taining samples from which to analy; theinorganicand bacterial constituent of the water. Water is allowed to fkr through the taps into prepared samp’ containers, which encourages aeration ~.ssn~sand loss of volatile organ;
The raw ‘water samples collected 7 the well head are not representative ( the finished water delivered to the car sumer through the distribution systerr Water delivered to the distribution sy: tern is often maintained under positi\ pressure throughout the treatment prc cedure and in the distribution main: Not only arevolatileorganics retained i. the water delivered to the consumer, bt7 they also may be transformed throuy,. reaction with oxidants or disinfectan! such as ozone, chloride, and chlorin dioxide.
system. To ensure that the expense o ?oqd$ingsuch a program is warrant& ._
Because of possible chemical tram formation within the distribution syt tern, there is nosubstitute for a careful1 conceived and comprehensive prograr for sampling raw water at the well hea, and finished water at various point throughout the distribution system. A- attempt to develop a mass balance r organic compounds delivered to and 01. tained from the distribution syster would be desirable; however, the frc quently used indicator of organic cot- tent, dissolved organic carbon (DOC), i not recommended. Most methodologir for determining DOC do not includ volatile constituents and rarely indicaf more than 10 percent of the DOC actuall. identified. Such inadequate sampling c distribution systems may give a falc sense of security. A carefully planne sampling program to test all portions e thedistribution system should be under taken if any contaminants are suspecte. in the raw or finished water within th’ -
-and cyclohexanone) used in sealing
water. Volatile organic solvents (e.&+
cements>ontinued- to leach into water
methyl isobutyl ketone, tetrahydrofuran,
from PVC and CPVC &ej&nXf~~-ti&~~ than 14 days. The quantities leached ranged from 10 ccg/L td 10 mg/L. during the 15 days of sampl’ing. Factors in- fluencing the leaching brocess included pH, temperature, ioni composition of the water, exposed s
i
rface area, and surface porosity of th pipe material. Water-soiu ble polymer dditives orreae tion products may mig$te to the pipe’s
spekial care must be taken to ,collec san(ples that will not bias analytic results through the loss of volatilf organics.
Water samples collected from publif water supply wells represent the intr grated or average quality of water con tained within the aquifer. Radial flow o water toward the well integrates wate: from different sources along the hori zontal plane. Similarly, water from the entiresaturated thickness of theaquife:
MAY 1984
II _ __ _ _ . ..- . . . . _.- _.
ji CXBi & lij. BARCELONA 41‘
.
being pumped is drawn into the well. Therefore, the effect of a comparatively small plumeof contaminated water cap turcd by the pumping well may go undetected in the sampling of relatively large water supply wells.
Toprovidemoredetailed water quality information,monitoring wells, designed to determine “point water quality data” horizontally and vertically, aredesirable. Data obtained from properly located, constructed, and sampled monitoring vre!ls are essential to a realistic picture of water quality within the aquifer.
I%*! constructien of groundwater rpr~iity monitoring wells
Scalf et al said:* “The success of a groundwater quality monitoring pro- gram depends on numerous factors; however, the location, design, and con- struction of the monitoring wells is usually the most costly and nonrepeat- .lble factor.” It is extremely important that the siting and construction of monitoring wells be properly done.
The number and locations of monitor- ing wells depend on the geologic and hyrlrologic.conditions at each site. The horizontal location of monitoring wells in relation to a pollutant source deter- mines whether contaminated water can be intercepted. Further, the vertical location of the well screen also affects the quality of water collected from the well. The development of a successful monitoring well program depends on the skills of the hydrogeologst and thedriller who design and install the wells. Flex-
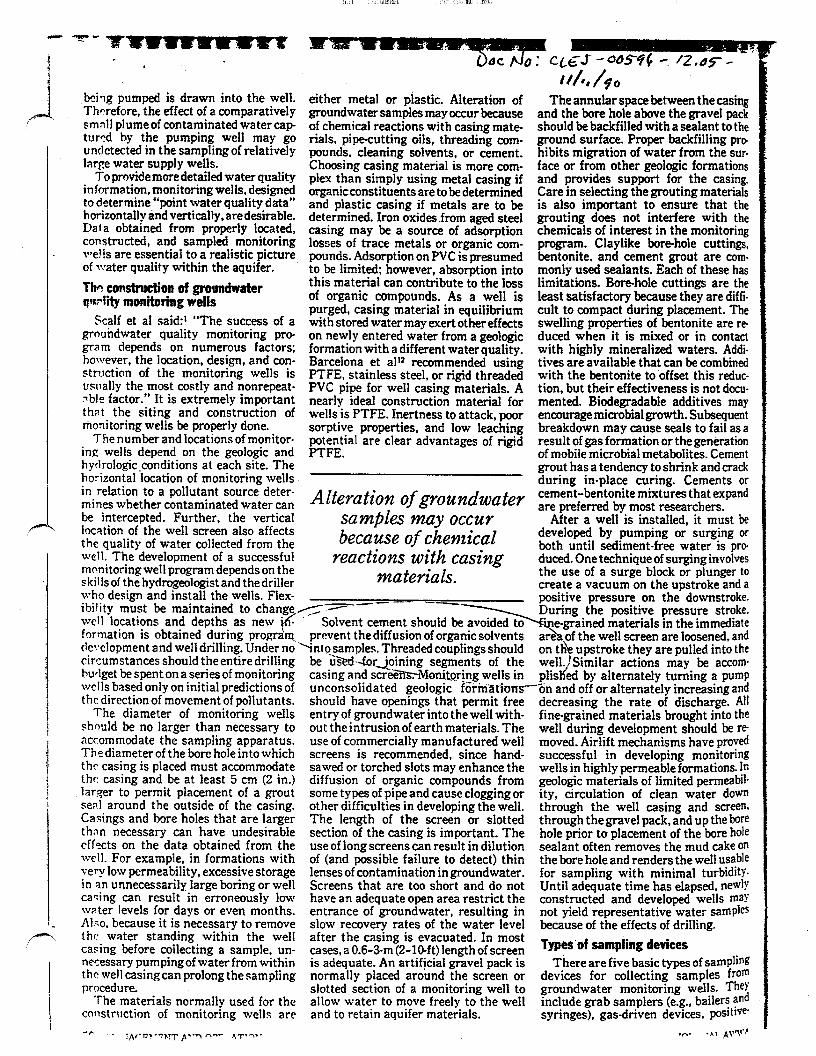
either metal or &tic. Alteration of groundwater samples may occur because of chemical reactions with casing mate- rials, pipe-cutting oils, threading com- pounds, cleaning soivents, or cement. Choosing casing material is more com- plex than simply using metal casing if organicconstituents are to be determined and plastic casing if metals are to be determined. Iron oxides .from aged steel casing may be a source of adsorption losses of trace metals or organic com- pounds. Adsorption on PVC is presumed to be limited; however, absorption into this material can contribute to the loss of organic compounds. As a well is purged, casing material in equilibrium with stored water may exert other effects on newly entered water from a geologic formation with a different water quality. Barcelona et al’* recommended using PTFE. stainless steel, or rigid threaded PVC pipe for well casing materials. A nearly ideal construction material for wells is PTFE. Inertness to attack, poor sorptive properties, and low leaching potential are clear advantages of rigid PTFE.
Alteration of groundwater samples may occur because of chemical
reactions with casing materials.
ibility must be maintained to change_< - -- ------I
The annular space between the casing and the bore hole above the gravel pack should be backfilled with a sealant to the ground surface. Proper backfilling pm hibits migration of water from the sur- face or from other geologic formations and provides support for the casing. Care in selecting the grouting materials is also important to ensure that the grouting does not interfere with the chemicals of interest in the monitoring program. Claylike bore-hole cuttings, bentonite, and cement grout are com- monly used sealants. Each of these has limitations. Bore-hole cuttings are the least satisfactory because they are diffi- cult to compact during placement. The swelling properties of bentonite are re duced when it is mixed or in contact with highly mineralized waters. Addi- tives are available that can be combined with the bentonite to’offset this reduc- tion, but their effectiveness is not docu- mented. Biodegradable additives may encourage microbial growth. Subsequent breakdown may cause seals to fail as a result of gas formation or the generation of mobile microbial metabolites. Cement grout has a tendency to shrink and crack during in-place curing. Cements or cement-bentonite mixtures that expand are preferred by most researchers.
After a well is installed, it must be developed by pumping or surging or both until sediment-free water is pro duced. One technique of surging involves the use of a surge block or plunger to create a vacuum on the upstroke and a positive pressure on the downstroke. During the positive pressure stroke.
well locations and depths as new i6- formation is obtained during program.,
Solvent cement should be avoided 6-Y e-grained materials in the immediate prevent thediffusion of organic solvents ?I are of the well screen are loosened, and
rlc!clopment and well drilling. Under no ‘intosamples. Threaded couplings should circumstances should theentiredrilling burlget bespenton a seriesof monitoring
be uSed-forjoining segments of the on tl& upstroke they are pulled into the
casing and sc6ebMonitoring wells in well. ‘Similar actions may be accom- phs ed by alternately turning a pump 4
wells based only on initial predictions of unconsolidated geologic‘ f6ihi~tiun~~n and off or alternately increasing and decreasing the rate of discharge. All the direction of movementof pollutants.
The diameter of monitoring wells should be no larger than necessary to accommodate the sampling apparatus. Thediameter of the bore holeintowhich thr casing is placed must accommodate the casing and be at least 5 cm (2 in.) larger to permit placement of a grout seal around the outside of the casing. Casings and bore holes that are larger thnn necessary can have undesirable effects on the data obtained from the well. For example, in formations with very low permeability, excessive storage in an unnecessarily large boring or well cacing can result in erroneously low water levels for days or even months. Alto. because it is necessary to remove the water standing within the well casing before collecting a sample, un- necessary pumpingof water from within the well casing can prolong thesampling procedure.
should have openings chat permit free entryof groundwaterinto thewellwith- out the intrusion of earth materials. The use of commercially manufactured well screens is recommended, since hand- sawed or torched slots may enhance the diffusion of organic compounds from some types of pipe and cause clogging or other difficulties in developing the well. The length of the screen or slotted section of the casing is important. The use of long screens can result in dilution of (and possible failure to detect) thin lenses of contamination in groundwater. Screens that are too short and do not have an adequate open area restrict the entrance of groundwater, resulting in slow recovery rates of the water level after the casing is evacuated. In most cases, a 0.6-3-m (2-IO-ft) length of screen is adequate. An artificial. gravel pack is normally placed around the screen or slotted section of a monitoring well to allow water to move freely to the well and to retain aquifer materials.
The materials normally used for the construction of monitoring wells are
fine-grained materials brought into the well during development should be re- moved. Airlift mechanisms have proved successful in developing monitoring wells in highly permeable formations. In geologic materials of limited permeabil- ity, circulation of clean water down through the well casing and screen. through thegravel pack, and up the bore hole prior to placement of the bore hole sealant often removes the mud cake on the bore hole and renders the well usable for sampling with minimal turbidity Until adequate time has elapsed, newly constructed and developed wells may not yield representative water samples because of the effects of drilling. Types’of samphg devices
There are five basic types of sampling devices for collecting samples from groundwater monitoring wells. They include grab samplers (e.g., bailers and syringes), gas-driven devices, positive

disp!acement submersible pumps, suc- :ion pumps, and airlift devices. Studies trvGibbet aFindicated that bailers and ,&tive-displacement bladder pumps ,+]d samples for inorganic analysis that ?re most representative of the water :-,ntained in an aquifer. The airlift devices tested by Gibb stripped dissolved ,-&on dioxide from the water, thereby YncreasingthepHanda]teringthechem- .<aicomposition before the water reached the surface. Barcelona et ail7 showed that bladder (no-gas contact) pumps are :uperior for most organic sampling ap @cations. Significant bias and poor pre- cision may be expected in sampling for nqanics with gas-driven mechanical- fiispiacement systems and suction mech- anisms. HolR recently reported on the 10% of volatile compounds as a result of cljction sampling mechanisms.
rxemmendations for organic c+mpling of groundwater
Prior to the initiation of a sampling program for organic compounds, the ~4s of the sampling or monitoring F%jst mUSt be clearly understood. The rrateiials used for well construction, the p:rmps, and thesamplingdevices should t- compatible with the goals of the nmpling program and consistent with (hedesired limits of accuracy and preci- Sian for detecting the chemical constit- ncnts of interest. In many cases, the Icoel of detail demanded by scientific or research studies is greater than that required for routine monitoring pur- yses. A clear understanding of the hydrogeology and suspected chemical contaminants is also essential to a srrccessful sampling program. The pos- sihlealteration of thechemistry of water .c?mples caused by an inappropriate sampling mechanism or by contact with the well casing or sampledelivery tubing shwld be considered. Pumping rates and times must he sufficient to purge thn well of stagnant water without in- dating excessive migration of water tward the well. For the sampling of public water supplv distribution sys- tems, it is essential to know which materials are used in the system.
‘The success of a sampling or monitor- inrprogram depends on careful planning pri9r to theinitiation of actual sampling. ln many instances, the cost of analysis incurred over a monitoiing period of j-10 years is large compared with the costsof constructionof monitoringwells. Analysisof thecostsinvolved in properly constructingandde<elopingmonitoring WUS and purchasing pumps should be undertaken to ensure that costs are not kreascd unnecessarily by adherence to false economies in the initial phases of
undergoes before it enters the distribu- tion system, and the kinds of piping contained in thedistribution system.All of these factors may alter the chemical quality of the water prior to use by the consumer. The selection of the points within the distribution system where samples are to be taken should be made by a hydraulic engineer who is familiar with the flow paths and by a chemist who is familiar with the types of chem- ical reactions that may be expected to occur. Proper planning and judicious selection of sampling points throughout the system can result in considerable cost savings in terms of eliminating unneeded samples. An understandingof the chemistry within the system will alsoensure that the monitoring program adequately protects the health of the consumers.
Snmmary Too little is known about the chemical
changes that occur in groundwater samples during the collection process. Because of the potentially dangerous or toxicnatureof manyorganiccompounds found in groundwater throughout the United States and in Europe, this typeof research can no longer be avoided. The analytical data collected to date on organic compounds in groundwater are not actually representative of in situ conditions. Only in cases of gross con- tamination, where theconcentrations of organic compounds areso large that bias from the sampling procedure is un- noticed, can it be determined with certainty that contamination has oc- curred. When organic compounds occur only at trace levels, inappropriate sam- pling procedures or mechanisms may prevent their detection by subsequent chemical analysis. The crucial task of groundwater protection can be accom- plished only by recognizing the impor- tance of proper sampling and by accel- erating research to address these critical problems. References
1. SXALF. M.R. ET AL. Manual of Ground- Water Sampling Procedures. USEPA Rept. R.S. Kerr Envir. Res. Lab.. Ada, Okla. (1981).
2. MIDDLETON, F.M. Organics in Water Supply-The Problem. Proc. 15th Water Qual. Conf.. Univ. of III., Champaign (Feb. 1973).
3. SEANOR, A.M. & BRANNAKA, L.K. Influence of Sampling Techniques on Organic Water Quality Analyses. Bull. Dames & Moore Enars., Syracuse. N.Y. (19811.
4. GIBB. J.P.~SCH~LLER, R.M.; & CR&TN. R.A. Procedures for the Collection of Representative Water Quality Data From Monitoring WC’,-
:p~. r. III. Statk-Water Survey, ign (1981).
careful consideration must be given Champ%
!olhe pumping mechanisms in the well. 5. %HULLEl
[hr. type of treatment that the water R.A.Recc ~‘ _ ._-_--. for Monitoring Wells. Ground Wa1
P. R.M.: GIBB. J-P.; & GRIFFIN. >mmended SamDlinnProcedures
‘er
I YAV ‘9R4
Monitoring Rev., 1:1:42 (1981). 6. Gr~6, J.P. Collection of Representative
Water Quality Data From Monitoring Wells. USEPARept. EPA-600/%81-002a. Munic. Envir. Res. Lab., Cincinnati, Ohio (1981).
7. DUNLAP, W,kAL. SampIing for Organic Chemicals and Microorganisms in the Subsurface. USEPA Rept. EPA-600/2- 77-176. R.S. Kerr Envir. Res. Lab., Ada, Okla. (Aug. 1977).
8. MILLER, G.D. Uptake and Release of Lead, Chromium and Trace Level Organ& Exposed toSyntheticWeli-Casings. Draft Rept., Univ. of Okla., Norman (1982).
9. J~~~.G.A.~~~~.Contaminati~lofWater by Synthetic Polymer Tubes. En+. SC& & Tecinol., 8:13:1100(1974).
10. CURRAN, CM. & TOMSON, M-B. Leaching of Trace Organ& Into Water From Five Common Plastics. Personal communica- tion. Rice University, Houston, Texas (1982).
Il. PETTYJOHN. W.A. ET AL. Sampling Groundwater for Organic Contaminants. Ground Water, 192:lSO (1981).
12. BARCELONA. MJ.; GIBB. J.P.; & MILLER. R.A. A Guide to the Selection of Materials for Monitoring Well Construction and Ground-Water Sampling. Rept. 327. Illi- nois State Water Survey, Champaign (1983).
13. SXREIBER, J.S. The Occurrence of Tri- halomethanes in Public Water Supply Systems of New York State. jou~. AWWA, 73:3:X% (Mar. 1981).
14. Uni-Bell Plastic Pipe Assn. Vinyl Chlo- ride; The Control of Residual Vinyl Chlo- rideMonomer in PVC Water Pipe. Dallas. Texas (1981).
15. DRESSMAN. RX. & MCFARREN. E.F.Deter- mination of Vinyl Chloride Migration From Polyvinyl ChloridePipelnto Water. jour. A WWA, 70&29 (Ian. 1978).
16. E!OETTNER. E.A. ET AL. Organ& and Or- ganotin Compounds Leached From PVC and CPVC Pipe. USEPA Rept. EPA-BOO/ l-81-062. Health Res. Lab., Ofce. Res. & Devel.. Cincinnati. Ohio (1981).
17. BARCELONA, M J.: HELFRICH,J.A.; & GIBB, J.P. Sampling Anaiytical Concerns in Volatile Organic Contaminant Studies. ProC. 2nd Intl. Conf. on Ground-Water Quality Res., Tulsa, Okla. (1984).
18. Ho, J-S.-Y. Effect of Sampling Variables on Recovery of Volatile Organics in Water, Jour. AWWA, 75:11:583 (Nov. 1983).
0 About the authors : James P. Gibb is head
vey, P.O. Box 5050.
of the groundwater section and Michael J. Barcelona is head ojtheaquatic &em&. try section of the flii-
: nois Stfxte Waler Sut-
Station A, Champaign, IL 61820. Gibb serveson theASCE committeeon organics in groundwater, is chairman of the Iilinois Groundwater Association, and is director of the technoZogV division of the National Water Well Association. Both authors have published articles in Ground Water as wefl as other technical journals.
J.P. GlBB & MJ. BARCEr.oNA 51
In Au_eusr of 1985, the Environments Prorecdon A~ertcy released a drufz guidance document titied ‘F.CRA Groundwater Monitoring Technical Enforce- zomt Guidance Mann&” which was intended to help ETA and state enforcement of&i& decide whether spe- cific elements of an owner/ operator’s ground watermon- itxin~system sarisfy the RCRP, nx&ements. The guid- ame ddcumenr states that polytenafluoroethylene or
: J T---pe 3 16 stainless sd arc the materi& of choir3 as so-em or o&ng in new weU &talI&ons where voIat3e
. o-ganics are de parameters of inctren Smu no guidance was provided on appropriate use of c&ug mater& at the tine the RCR4 quhtzions were promu&&, most ooerators ins&&.&PVC casing in both the or&i& and s~~bs~uenrlrioltiroriags_vsnmsbecausetlis~~aIhad ken used for years in the water web industry, is readily %iInble, and is f&y inexpensiviz ~ .
The ER4 has cited 2 number of reams why PVC is rot r?h acceptile mater24 for ti contcauticm. These ,ixLude: ‘c
.’ .* ; hotentialfoarsine:attackandiaEisuebvexDosure
i? hi$ cdncenu-ations ohzm2in orgauic corGpo&s * -D~orption of phzsticizers and additives from the
-4I cash to otherwise tmcontaminamd grouud water ‘false posi&e?)
n ?SorpdOn of organic compounds into the Wen Gas- %g exposed to comaminattd ground water (false nega- %e).
Sorption was cited ~8 the major prcbIem in the ,ti- ~hmc documtrir, since the possibihry of a false negative is of priuze conceru to the EPA and other re@mory q.?ptiK.
In Au-go% of 1985, waste Mauqemenr Jnc. (Jarke 198G) conducted apreliinaxy rezxarch pro,-designed as a practical and realisric evaiuation of the ppteutid for sorption to o&r for PVC and other mater& of cOu- stmction expeued in monitotig wells- This snady was designed to address the potential for SOrption cf p*- viou& exposed c&ng &faces. Prvpef I?ZvniZo~ing +4l sanpling protocols require that the sL*anL waler fin equilibrium with thecasing) be pumped from awell n’i .* to sampiine Toe ref&rge of formation water WOL:
then be representative of the ambient organic concentra- tionandwo~d~iarenmctwithtfiesaturaredsurfaceof the well casing for a period of benvezn one and 24 ~OLL’S before sampling. Therefore, aseries of experiments were conducted to invesngate the potential of exposed casing m2tcrkds to fimher sorption by techarge of the well. lZe&s of those experiments demonstrsed &az for all mm exposed for both tie one and24 hour cases, the net SOrptiOIl was nominauyzel77~Th~rrsulrs, however, were only p- because the study was limited ‘co a small number of exposzrre samples, making a stat3icaI interpretation of the dam impossible
The major uxknical tpxstion &g from WMI’s preIiminayTtseatcLhprogramw~~errseofmettrvroIu a means of d.GsoIvh3.g sorbate of interest into wafer for
matexial expow sruciieS. Since the final leeI of metha- noIinwaterwassi~oantIygreaterthan &esorbates,it 3s possiiIe that the exposed mate&I snrf..ces became sarcr~wi~amono-la~~ofm~o~prw~~gany sorption of other oq@cs. bdi2Ul’S !jtUdiK were designed to address thecxiti* oftheWMIwo& Consequently, methanol was not used as a v&ick for introducing sor- bates to the water ma& J&h component was spiked directly into pure water. Also, each *;cperixnent uus dope in rripiicase with full. quaiiq assurance 2nd conuoi procedures folIowed tIlrou@lout,
, T&mid Approach ’
Well .%fateia.l Coupons Au materials were obtained from Btiard-K&nan Drill Co- (Stone Mountain Georgia)- The PVC was tiTnioc Mcniror Pipe,” %.ncf; (S 1 mm) I.D. b,v2%-inch (60~2) O.D. The stainless sted was “Arum Welded 2-&h Type 316,” Z&Inch (56mm? LD. by 2%.nch (6Chnm) O.D. The po1yteuanuaroetby- lent (Vii& PTFE) was t&i&h (5&n) I.D. by Z+iucb (6Omm) O.D. AI1 coupons were cur to alength of53nm which produced a surface area of 1OOcm~ oer coupor! Each couoon wes then cut once len_mh%se to alfobl placernen; into a 237 I& jar. The tube edges were no* considered to be a factor in this study.
Exposure Jars The exposure jars WV - “Qucrpa Cleat with TRXincd”’ screw caps 22 i ~1, ca~ci:: (acruaI 260 mL wirh no head space). These jus tveri

S~?K :.ned from Fiiher Scientific. c2ta.b =E-3O-Xl. AU
iav 7 :p liners wzre covered with foii tl nin2t: possibie j3~ her’ ~ffecrs. 1 ’
. %fvm~ts: EcIlsohm.s were purchased as chromarog- mby grade and were used without fti:r purifitioa A ;t%xk spiking solution containing methylene chloride (bleCI2). I2-dichloroedzute (1+2-DCE). tCms-1,2-d;- chlvroethylene(DCEE),toIuene andchlorobenzeneata concztration of IO ppm each was prep-reed in cIkiUed/ deio r&.4 water. A second spiking soiuuon was prepaRd ccmaining 0.5 ppm uichIoroethyiene (TCEE) in ciis- tiIled/deior&ed water. This separate spike was prepared b-use of TCEFs much Iower solubiiiry in warer (1.1 ppm} ban the other compounck
T&r: DistZkd/deio&ed carbon filtered water was z?sod.
PWX!dU.E! l’reparation of Glass Jars The ghs jars and lids
wcr each cleaned with soap and water foilowed by ! i Trilled/ deionized water rinse. Each jar and lid was then i: id at 100 c:.
Solution Stability Studies: Prior to the’ ma&al expsure studies, the IO ppm and 05 ppm sp&ng soiu- Tom were evaluated for stability and th: suitability of the test protocd design. Six 260 ml.. jars with foil-lined caps wtr tiIled (without head space) with aliquors of th: spil ing solutions and pure water to yield approximzteIy 100 p?b of each componenr An additional six jars were fi!led with pure watet and represented water blanks for the xudp. Afrer 2 one-hour period, an aiiquor from each j zr -.vas transferred to a Voide Organic ArtaIysis (VO A) vial ~oIyte.trafIuoroetbyIen~ed cap) and stored in a rrfiip2tOr at 5 C for a sevenday period. At the end of the seveu days, the oriV@! stock-spiking solution w& rrttrJ zo prepare a iO0 ppb component soI~don mixture
whic& was then aiiquoted to 1 VOA vials for snalysk Additional VOA aliquots were tien from the or@aI 26@ mL jars and used for analysis. On day nine, aII VOA vid sanplzs were again analyzed and corn?& to freshly pxnared spiked water. Originally, tJx!se exposures were tv 11:: at two levels, 10 ppb and 100 ppb. but due to the unacceptable >tiance ofcompound recoveries from the spiked water at 10 ppb, only the 100 ppb lqvel was used for *the exposures-
VeLI Material Coupctn Exposure Studies: Wdmau- tia! coupons were piacec? in fo&overed glass jars and filled TALL spikd water svIution so that no head SOD remained The water solutions were spiked at levels to >icld component concensations between 90 and 150 ppb. The jars were stored at 5 C in 2 refrigtmor for
qcvcn days and @iwed drrilv. After theswenday condi- “oning period. an #quor was pipettzd inL0 a 40 mL VO 1 vial with zero head space for anal~6~. A second aiiquor was aiso piperted inro 2 40 m.L ial and nor:d at 5 C as a prcscrved s3rnplc. The rem&&g soiution in tfie jar =as discardeh The jars. with the original coupons. we:c then refikd witi cr~ic+pi.ked water of rhe sam: concentration as in the seven-day condirioning period. Afr?r a contact time of one hour. aliquors were a9in
2, w: Igt
taken for ana&sis and -esertarion. The jars were reftiled u&h orticspiked .er igak for 2 comact time of24 hours. after which 2 third &pot was taken for analysis. Control samples, consisting of spiked warer with no well matial coupons were carried Lf~ough the entire proce dmz. BIa& sam_Oes. consisting of purt, uzzspked water and no coupons -carried through as welL
Sample Analysis The anaIy&aLprocedure followed was EPA Method
602 (EPA 19841, which uses gas chromatography wit& flamtionizationd~ohTheproceduteincarporares3 purge ad trap teckique to CoLLceLltcae the vokik orgzinics from water samples. The &&sun& used was 2
Vtian3700, and thedatasystemwasaVariaa~~402 Thecolumnwas 13mx2mm,zsabksss~~packedwhh 1 percent SF-1000 on Carbopack I3 6O/SO mesh. The temperature of the oven was titiaUy at 45 C for ttzrte mixnnes, then programmed to 200 Cat IS C per minute- The nkrogen carrier gas was set a 30 LLL per minute through the cvinmn 2nd 40 m.L per minute through the Tekmar LCS-I Purge and Trap. Each sample tiyzed wasuansfcr&dt.oaS ~~Lgastightsyriugeequippedwith a sample valve Tea microliters of a tbree-couiionent internal standard mix (15 rtg/&) was added to ezh sample th.rou+ the ~T&Z to produce a concentration of30 ppb. The threeintexnal standards were bromochlo- rvmerh~ l~~Z-hromopropane and 1,4+iicblor0- butane.
One exposure level for each compound was studied These ranged be~een 87 and LSO ppb. The concentra- tions varied because the same mass of each coxnpouud was used to przpar5 the stock-spiking soluzion of each compound. The density- tixnused to rxkukte exact COII~WOtlS.
The foLIowing is a& of each compound studied and the~~~~onl~preparedin~eexposurem~~
methylene chloride 133 ppb l&3icidoroerh3e 126 trans-I&di&lomethyiene 12s uichloroerhyiene 147 toiume . 87 chlorobenze 110
Calibration and QuaTity Control The calibration procedure used for the volatile
organid anaIysis x2s the external standard technique, wirh imernal standards added to each sta&ard and sam- ple for quaky conuoI of the analysis. A c&brativn curve was constructed by preparing three concentracibn levels ofeach compound at approximately IO ppb, 50 ppb and 100 ppb levels. A s_trstem blank of punwater was used zs 2 zero point on the curve. A stock solution was prepared from the pure materials in chromatography grade metha- nol by accurxely measuring microliter portions into a known voIu.me. The concent12tion of each component was then calculated based on its density (mg/pL)- ‘fhe

. .,ih,,,~>-YI.U., ” -.r_v*r~urru~‘rr~--ruu~- “J UC-
t!,~n of the stock inro pure water. -e three-point CuNe vxs prcparcd tititiy 21 the b=s 2% of the nab;rity s-udy and again’at the &!$m&g of the exposure study- Li.mz2.r re_gssiOn equzions were caln;lated for each mrve, then plotted for visual agreement With Iinearity ~ubscquently, only the 100 ppb srzndard wzs wed ro inure that he c.aIiiraCon curve wzs within the EPA ~rotocoI of <Xl percent CV @emat coef55ent of varia- tkm). The linear regression plots are shown in F&Ire 1. 17 additia three intem2Istandards were used to verily ~.~counoLEach5mtsamplersd~datdnxeived 10 pL of tke three-component mix (15 flg/mL), which v-as equivaIent to 30 a/L (ppb), immediidy before 2m&sis. Figure 2 is aplot of the ityernal standards w&h the caldated percent Cvs. This datz shows that through- out the study the percent CVs were 5 percent, which, azordingto EPA M&cd 6QZ<lO percent is zs+ablr. Themeancon~~tionofaattreblanksnnalczeddrain,6 rhe exposure study shows that methylene chloride was 13 ppb; 1,2-DCE was 3 ppb; DCEEandTCEE we;re2ppb: zqd toluene and &Iorobenzene we& 1 ppb.
J-!esuIts and Dkcussion Psuki of Stab* Study _ The objective of the srabiky smdy was to emhate
ekh compouud for recovery varizbili~ exduding we& c~zsing material sorption effects. balyss of dttplimte siunpies detcrmincd precision: and analyses at dzy one, day seven and day nine determined de potential stop e %a~. Ardysis of water blantcS also determined back- Sxund con tamhation due to the _gkss jas, Ibzx~ and s-.o~~Theslab~~study~oes-~lished2~~n~
frJr cvsiuating analytical pre&ion and qua&- control of
a Q 20 -.-- . . ..I” .**.....a “.Y --.- s%hb-LT\L------- . . . . s .
2 0. . .) f
0 6 10 ts 20 26 3c
Injatioo Ntlmber .
Parts Per BiHion 200
150
100 ......-.-.-_._-___-______
50
..I.....*.... . . . . . . . . . . . . . .._--_------------------*-----.
~----..--------.i..............,.*.........
Y
MeCi2 1,2-DCE. DCEE TEE TOI WI76 a-bsnz
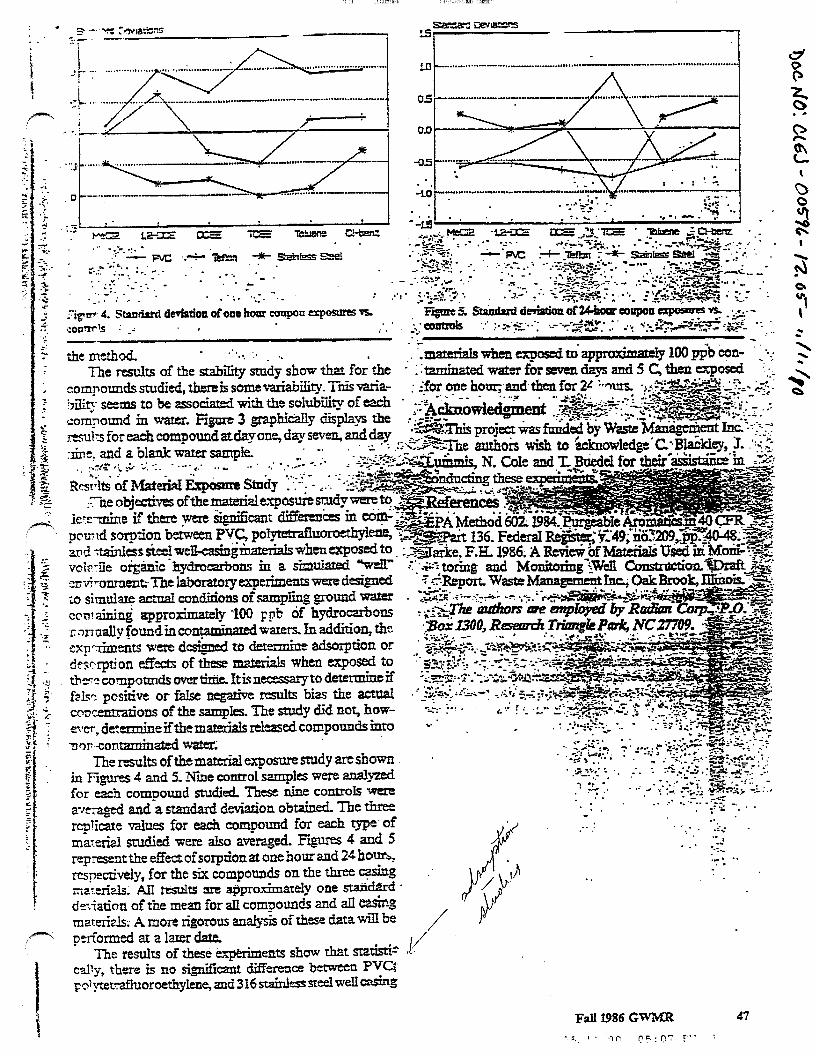
The~ultsoftbemateriaIexposnre~d~~ShO~. in Fiiguffs 4 and 5, Nine control szmpk Wete nn-dJ’Ed for each compound studied. These nine controls were awapd and a standard deviation obtained. The three rcdicate values for & compound for each me’ of mk-ia~ stxlied were a?so avenged. Fv 4 ami 5 represent the e&t of sorption at one how and 24 horn, mpeaively, for the six compounds on the three c@% nzrerkh km tt5uh.s ritt afiproxim2tely one sG5Bck-d * de-+xG-~n of the mean for ail comuound~ and aJl &ng RGXX~AS~ A mart rigorous ana&& of t&e data wiJI be pcrfomed at a laxer date.
Fall 2986 GWbfi? -. P., 1 ’ “l-l _, nE:Q’: F’. :

I . --. .- .-.z
. ;
The Use of PVC Casing and Screen in ; . -’ f+e Presence of Gasolines on the
. I
.
_ .
,
by G. u! Schmidt
piaced in contact with any -~olinrs. Aftm the setions of PVC screen were in the ~euolins for 65 months, they were removed an& along wirh the control sample. wert photographed under a scanning electron microscoy= (Amray Model KHIOB) to observe uly sv’e!‘ing or aker~- tion The resuits are shown in Figre ! . 3::x7-3~‘n ! @premium gasoline), photograph 2 (unI:--.!:! ::: -.I:,:,;. photo-mph3 @a&d regular), and photo, . I . . I zxoi sample not in any gasoline).
sThephoro$xphs (saqlcs I, tand 3) clewiy show nrj chan_~inslots~ofanlvofthePVC~~rtl;inc...-3z With ~gsohs compared to the control (s2p!z fl .m the fragnentS on the “cut face” of each of the .c-- ;I- show no aiterittion irom io~~~ymn cxposurc ic . . x gas&es. From this study, the cone&on I$ pie?: ~7 Schedule 40, rigi& T-Te I PVC casing and scan ca;! IT wed witch conftdence when moniroting for the OCZ:--YZ of gasolines on the ground w;!ter ! +!Y ‘. . . Tr Th3rcau AC * The question is ri,t* vtix vs)~ ,. . what you s=.” The EP.\ ad star< ‘~!;r. ‘1 ;:! should reco,nizzsuch confirmation d. 9n . ’ unsubstantiated concfxsions suc;l 5 n- . ...-, 7 . . the L’C* of FVC casing and scr<x ::l :I-.. _., . . -pr;:. . *
References Sykes, .4.L, KA McAlZss:t-.?nd 7.f ‘1’ ~r.;..z 1”’ ).
Sorption 0i Organic:: by ;~Ion‘,o:‘n$ \L:;, C .:~c tion Mlla!t:.rals. Gr0irr.d W\‘rtzr h11 nitunn- c 6 no. 4 pp. 4-C. ..a y .ixvkoomtn;.~’ Protection Agency. 19. : ’ ?r̂ ‘* :trd ~~?I:..r Z.lonito&lg TechniCsi Ei>- :a ixnr c- \I’21 -cl- Jl ‘.titzIL OSWER-9950.1 : :.‘. -4. -c
Biograk’ :’ rfch Gene .i. 31: inidZ is dkenor or G~QWTJ IC;l!:r .
Mahagem~nt in he Envhwnrngrz& A rtQi.-s ml SC c., Depurtment qi;f- .A ‘“-0 Corp. {P.@ Rex T.‘?, .E 1c . OK MU;!.
lowest rankings are for some L ..zoic acid, aniline, and ‘phenol derivatives; of course, if some other criteria were used, the ranking might have been somehow different, but probably not too mu&. For example, the rankiig obtained by using Freitag and co-worker’s chlorobenzene data and the ranking using Ribo and Kaiser’s data are very similar. When a new chemical is developed and its properties are known, it oan be easily ranked and compared with other known chemicals or any arbitrary standards. The avail- ability of the program in microcomputer form make the routine applicability easy.
21,126-f&2; 22,8&06-2; 23,92-524 B, 13029-08-8; 25,348&-&i-7; 26, 16606-02-3; 27, 62796-65-o; 28, 39485-83-l; 29, 71-43-z; 36, 108-90-7; 31, 106-46-7; 32, 120-82-l; 33, 608-93-5; 34, 1%7-i-l; 1,2-dichlorobenzene. 95-50-C l;bdichlorobenzene, 541-73-l; 1,2.3-trichlorohenzene, 87-61-6,1,3,5-trichlorobenxene, 108-'?tJ-3; l,2,3,4-tetrachlorobenzene, 634-66-2; 1,2,3,5-tetrachlorobel.~~I~e. 634-96-2; 1.2,4,5-tetrachlorobeuxene, 95-94-3.
Literature Cited (11 Freitap, D.; Lay, J. P.; Korte, F. In QSAR in Environmental
Toxicology; Kaiser, K. L. E., Ed.; D. Reideh Dordrecht, 1984; pp 111-136. Kaiser, K. L. E.; Dixon, D. G.; Hodson, P. V. In QS&? in Environmental Toxicology Kaiser, K. L. E., Ed.; D. Reidek Dordrecht and Boston, 1984; pp 169-206. KL24 W.; Geyer, K; Freitag, D.; Rohleder, H. C!hemos,dwe 1984, 13,203-211. Serat, W. F.; Budinger, F. & Mueller, P. K. J. Bact~rio~. 1965,90,832-833. Preparate, F. P.; Yeh, R. T. Introduction to Dkrete Structures; Addison-Wesley: Reading, MA, 1973. Warfield, J. N. IEEE Trans. Syst. Man Cybernetics IWC, SMC-3, 121-132. Keeley, R L.; FIaif%, I% Decisions with Multiple Object&s: Preferences and Value Trudeoffs; Wiley: New Yori; i;nd
A final comment: the development of a suitable index for environmental risk has been widely discussed in the literature (3,4,12). An index is a suitable scalar function of the vector distance components with the best chemicals having the lowest index. Since an index is asoalar quan- tity, problems concerned with the noncomparability of chemicals cannot arise since the chemicaIs can always be ranked and represented as a chain in a Hasse diagram. Unfortunately, the choice of a partklar index affects the results (7).
A simple example can clarify the previous arguments: Let C’ and C” be the vector distance components of a chemical C and let F = C’+ 2C”be the chosen index. The chemical C2 previously considered has the components C; = 2 and C”e = 3; thus, F2 = 2 + 2 x 3 = 8. Analogously, for the chemical C3, C’e = 3 C”e = 2, and Fe = 3 + 2 x 2 = ‘7. As F3 < F2, the chemical C3 would be considered safer than C2. Conversely, if the index were G = 2C’ + C!“, then Ge < G3 and C2 would have to be considered safer than C$. The conclusions are opposite to each other. They depend only on the index chosen. As a consequence, every time the deftition of an index cannot be firmly grounded on a theoretical basii, the results can he completely biased, and the index becomes hii toward a subjective meaning.
Registry No. 1,10&8&3; 2,106-&X-1; 3,1817-47-6,4,611-063; f&82-63-& 6,6585-o; 7.5&765; 8,~3Od$S, 62-53-3; IO, 106-47-8; 11.25265763; 12,92-67-z 13,634-93-5; 14,91-94-l; 15,X%-95-2; 16,10839-4; 17,X&31-9; 18,1OO-O2-?; 19,67-66-5; 20,126-39-2;
(2)
(3)
(4)
(5)
6)
(7)
(8)
(9)
(10)
(11)
(12)
Toronto, 1976; pp l-400. -’ Reggiani, M. G.; Marchetti, F. E. IEEE Trans. Syst. Man Cybernetics 1975. SMC-5.322-330. I&wary, F. Graph -Theory; ‘Addison-Wesley, Reading. MA, 1969. Ribo, J. M.; Kaiser, K. L. E. Chemosphere 198:,, 12, 1421-1442. Ribo, J. M. ‘Chlorinated Aromatic Compounds: Micro- Test Results and Structure Toxicity Relationships“; IJrt- published Report 84-3,1984, Environment Canada, NGonak Water Research Institute Publication, Burlington; pp l-6:. Koch, R In QSAR in Environmental Toxicology; Kaiser, K. L. E., Ed.; D. Reideb Dordrecht and Boston, 19b4; pp 207-222.
Received for review December 3, 1984. Revised manu:.cript received February 20,1986. Accepted June 6,1986.
\ I : Well Construction and Purging Effects on Ground-Water Samples -!’
Michael J. Barcelona* and John A. Helfrich k.
Water Survey Diviiion. IUinOis Department of Energy and Natural Resources, Champaign, Illinois 61820-7407
I Multiple well installations of selected casing materials [i.e., poIy(tetrafluoroethylene) (PTFE), 304 stainless steel (SS), and poly(viny1 chloride) (PVC)) were constructed and sampled to determine if well purging and construction procedures would signifcantly bias chemical constituent determinations in ground water. Water quality results from six monthly sampling dates indicate that proper purging of stagnant water from monitoring wells and iso- lation of cement seals are essential for the collection of representative chemical data. Significant differences in purged samples taken from PTFE& SS, or PVC wells were observed for total organic carbon and volatile h&carbons, which may be linked to the materials’ interaction with ground water. The well casing interferences were not predictably high or low for any of the materials.
Introduction
The effects of well construction procedures and sampling protocols on the reliability of ground-water chemistry in- vestigations have been the subject of a number of research efforts in the past BO years. The published literature has
dealt mainly with the potential error introduced by water sampling or analysis (I-3) and by the selection of mat&ale that are appropriate for specific monitoring applications (4,5). A recent publication details procedures by which ground-water sampling protocols may be developed to control systematic sources of sample collection (61. These errors include artifacts of well siting or construction, well purging, and sample retrieval from the well. In general, sample collection errors cannot be accounted for by tra- ditional laboratory quality control measures. Also, iargt sampling errors coupled with analytical errors of siniilai severity can result in the collection of grossly biased data.
Recent work has shown that potential sampling bia:, due to both sampling mechanisms and flexible tubing matcri;rls is of the same order of magnitude (i.e., *5-20% 1 as ana- lytical errors for volatile organic compounds (7,8). ‘l’hvse results support the need for very careful consideratiun of volatilization, sorption, and desorption effects in thz be- lection of sampling pumps or tubing for ground-watt.. investigations.
The effects of drilling fluids, grouts, or well casing ir:- teractions with the geologic formation or ground water are
0013-936X/66/0920-1 179$0150/O 0 1986 American Chemical Society Environ. Sci. Technot., Vol. 20. No. 11. 1986 1179
t.:..:. . . . . . . . .
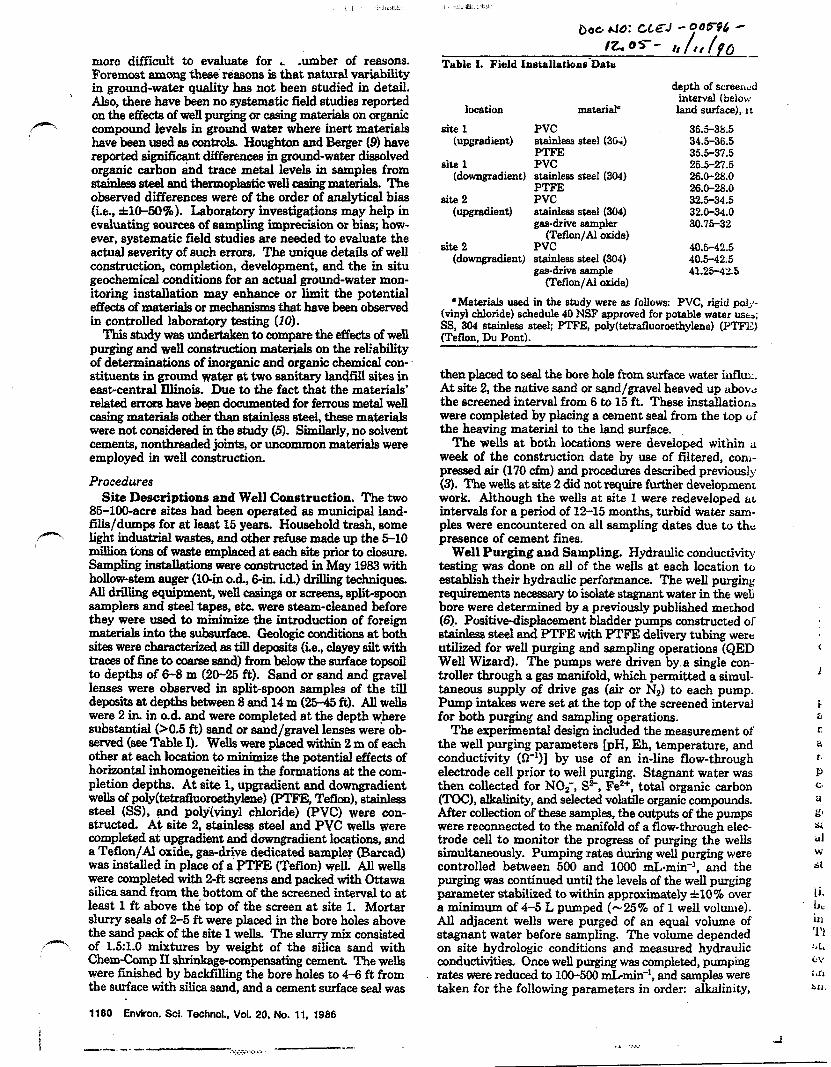
mom difficult to evaluate for L .umber of reasons. Foremost among these’reasons is that natural variability in ground-water quality has not been studied in detail. Also, there have been no systematic field studies reported on the effects of well purging or casing materials on organic compound levels in ground water where inert materials have been used as controls. Houghton and Berger (9) have reported signifi~t differences in ground-water dissolved organic carbon and trace metal levels in samples from fatabka steel and thermoplastic well casing materials. The observed differences were of the order of analytical bias (i.e., flO-50%). Laboratory investigations may help in evaluating 50~1~55 of sampling imprecision or bias, how- ever, systematic field studies are needed to evaluate the actual severity of such errors. The unique details of well construction, completion, development, and the in situ geochemical conditions for an actual ground-water mon- itoring installation may enhance or limit the potential effects of materials or mechanisms that have been observed in controlled laboratory testing (10).
This study was undertaken to compare the effects of well purging and well construction materials on the reliability of determinations of inorganic and organic chemical con- stituents in ground water at two sanitary landfii sites in east-central Illinois. Due to the fact that the materials’ related errors have heen documented for ferrous metal well casing materials other than stainless steel, these materials were not considered in the study (5). Similarly, no solvent cemente, nonthreaded jomte, or uncommon materials were employed in well construction.
Procedures Site Descriptions and Well Construction. The two
8%lOO-acre sites had been operated as municipal land- fills/dumps for at least 15 years. Household trash, some light industrial wastes, and other refuse made up the 5-10 million i&s of waste emplaced at each site prior to closure. Sampling imtallations were constructed in May 1983 with hollow-stem auger (l&in o.d., 6-m i.d.) drilling techniques. AU drilling equipment, well casings or screens, split-spoon samplers and steel tapes, etc. were steam-cleaned before they were used to minimize the introduction of foreign materisls intO the s&surface. Geologic conditions at both sites were chamcterized as till deposits (i.e., clayey silt with traces of fine to coarse sand) from helow the surface topsoil to depths of 6-8 m (20-25 ft). Sand or sand and gravel lenses were observed in split-spoon samples of the till deposits at depths between 8 and 14 m (2&45 ft). All wells were 2 in. in o.d and were completed at the depth w-here substantial (>0.5 ft) sand or sand/gravel lenses were ob- served (see Table I). Wells were placed within 2 m of each Other at each location to minimize the potential effects of horizontal inhomogeneities in the formations at the com- pletion depths. At site 1, upgradient and downgradient wells of poly( (PTFE, T&on), stainless steel (SS), and poly(viny1 chloride) (PVC) were con- structed. At site 2, stai13l~ steel and PVC wells were completed at upgradient and downgradient locations, and a Teflon/Al oxide, gas-drive dedicated sampler (Barcad) was installed in place of a PTFE (Teflon) well. All wells were completed with 2-ft screens and packed with Ottawa silica sand from the bottom of the screened interval to at least 1 ft above the top of the screen at site 1. Mortar slurry seals of 2-5 ft were placed in the bore holes above the sand pack of the site 1 wells. The slurry mix con&.& of 1.5:X-O mixtures by weight of the silica sand with Chem-Comp II shrinkag~mpensating cement The webs were fmished by backfilling the bore holes to 4-6 ft from the surface with silica sand, and a cement surface seal was
1180 Environ. Sci. Technd., Vol. 20. No. 11, 1986
- . - - . w.. - - - - . . ‘ . : . ‘ . y . : . : . : . . . ‘ .
Table I. Field Inetallations~Dat~
loccttion
site 1 (upbradient)
site 1 (downgradient)
site2 (upgradient)
site2 (downgradient)
material”
PVC pitai~ss steel (36;)
PVC atairllees steal (3o.Q PTFE PVC stainless steel (304) gas-drive sampler
(Teflon/Al oxide) PVC stainless steel (304) gas-drive sample
(Teflon/Al oxide)
depth of screenGd interval (below
land surface), II
36.5-38.5 34.5-36.5 35.5-37.5 25.5-27.5 26-O-26.0 26.0-28.0 325-34.5 32.0-34.0 30.7x%
40.5-42.5 40.5-42.5 41.2W.5
“Met.erids used in the study were as follows: PVC, rigid PO?;*- (vinyl chloride) schedule 40 NSF approved for potable water use>; SS, 304 stainless steel; PTFE, poly(tetrafluoroetbylene) (PTFE) (Teflon, Du Pant).
then placed to seal the bore hole from surface water influx. At site 2, the nutive sand or sand/gravel heaved up ubov,: the screened interval from 6 to 15 ft. These instsllatiom were completed by placing a cement seal from the top of the heaving material to the land surface.
The wells at both locations were developed within a week of the construction date by use of filtered, com- pressed air (170 cfm) and procedures described previously (3). The wells at site 2 did not require further developmern work. Although the wells at site 1 were redeveloped a~
intervals for a period of 12-15 months, turbid water sam- ples were encountered on all sampling dates due to the presence of cement fines.
Well Purging and Sampling. Hydraulic conductivity testing was done on all of the wells at each location to establish their hydraulic performance. The well purging requirements necessary to isolate stagnant water in the well bore were determined by a previously published method (6). Positive-displacement bladder pumps constructed of stainless steel and PTFE with PTFE delivery tubing were utilized for well purging and sampling operations (QED Well Wizard). The pumps were driven by.a single con- troller through a gas manifold, which permitted a simul- taneous supply of drive gas (air or Ns) to each pump. Pump intakes were set at the top of the screened interval for both purging and sampling operations.
The experimental design included the measurement of the well purging parameters [pH, Eh, temperature, and conductivity (Q-r)] by use of an in-line flow-through electrode cell prior to well purging. Stagnant water was then collected for NO,-, S%, Fe*+, total organic carbon O’OC), alkalhity, and selected volatile organic compounds. After collection of these samples, the outputs of the pumps were reconnected to the manifold of a flow-through elec- trode cell to monitor the progress of purging the wells simultaneously. Pumping rates during well purging were controlled between 500 and 1000 n&rnirF, and the purging was continued until the levels of the well purging parameter stabilized to within approximately f10 % over a minimum of 4-5 L pumped (-25% of 1 well volume). All adjacent wells were purged of an equal volume of stagnant water before sampling. The volume depended on site hydrologic conditions and measured hydraulic conductivities. Once well purging was completed, pumping rates were reduced to 100-500 r&m&‘, and samples were taken for the following parameters in order: alkalinity,
,* . . .._.

Table II. Well-Purging Effects hound-water Quality
difference change stagnallt pill Jed t+, -) (factor of)
Dissolved Ferrous Iron, mg.L-‘, Site 2 (S/6/85) upgradient
PVC 0.03 0,; 0.15 +5 ss 0.020 0.:2 0.23 +12
downgradient PVC 0.04 4.57 4.53 +113 ss 1.23 4.37 3.14 +2.6
Dissolved Sulfide, meL-‘, Site 1 (7/9/35) upgradient
PVC 0.043 0.242 0.194 +4 ss 0.010s 0.012 0.002 il.2 PTFE 0.031 0.172 0.141 +4.5
downgradient PVC 0.308 0.047 0.261 -0.35
ZFE 0.024 0.166 0.384 0.230 0.064 0.360 +15 +0.39
OMethod detection limit = 0.02 meL” [accuracy 90% (-10% bias), precision j&5% rad]. *Method detection kit = 0.010 rnc L-l [accuracy 80% (-20% hii), precieion f20% rsd].
TOC, volatile organic compounds, dissolved inorganic constituents, and acid and base/neutral organic com- pounds. Pressure filtration of samples for dissolved con- stituent determinations was performed in the field. TOC and volatile organic compound samples were collected in 40-mL glass vials, sealed without head space by PTFE- lined septum caps.
Analytical Methodologies and Quality Control. Organic and inorganic chemical constituents were deter- mined by USEPA-recommended methods (I I, 12). Total organic carbon (TOC) determinations were performed by a methodology described previously (13). Field determi- nations of alkalinity were performed by potentiometric titration, and the results were analyzed by Gran end-point analysis procedures. On each sampling date, a series of field standards and blanks were used to account for transport and storage errors, which supplemented the daily amlyticd procedure control standards for both laboratory and field methods. Replicate samples were analyzed at intervals during analytical sessions to establish the pre- cision and accuracy of the water chemistry data. . . Results and Discussion
Well Purging.’ Stagnant water samples analyzed for pH, alkali@, reduced inorganic constituents IS*-, Fe(D)], and organic constituents showed higher temporal (i.e., month to month) variability than did the samples obtained after proper well purging. In most cases, well purging resulted in the stabilimtion of the gross dilution chemistry parameters (i.e., pH, Eh, Q-l, alkalinity) although the concentrations shifted in varying degrees. For example, at site 2, alkalinity levels in stagnant water samples were generally 45% lower than those measured in water samples after purging. The average magnitude of the alkslinity differences between samples from SS or PVC wells was not significantly different over the course of the study.
In general, the levels of reduced chemical constituents [i.e., F&(11), S2-] shown in Table II would be expected to be lower in the-stagnant water in monitoring wells than in ground water obtained from the formation after purging. The actual concentration differences observed between stagnant and purged samples reflected this trend. How- ever, the magnitude of the differences was quite variable and may have been influenced by well casing materials and small-scale heterogeneities in water quality, even in wells
that were finished in the same formation less ihal. i;-ft apart. In downgradient wells at both sites, the sta;; , Lut water from the SS well frequently (i-e., four of six sam,&ng dates) showed higher levels of ferrous iron and lower 1;~ & of dissolved sulfide than those from the adjacent PVC or PTFE wells. This would be consistent with leachilip of iron from the stainless steel and precipitation of sulfide by the excess iron during stagnant periods. Obviously, PVC and PTFE would not be expected to leach iron ill titi fashion. Example results for ferrous iron given in Table II show stagnant water values from PVC and SS wells that were significantly different at least at the reducing downgradient location. Upon purging, however, ferrous iron values in samples from both upgradient and ddun- gradient locations increased substantially, and the for- mation water values from both sets of PVC and SS wells were equal within experimental error. It would seem from these observations that either PVC or SS well casing would be appropriate for ferrous iron determinations if purging is complete. Typical results for dissolved sulfide, all ex ample of which is shown in the lower portion of Table 11, reflect somewhat random changes on purging. Those: changes do not consistently correspond to potential well casing effects or the introduction of more reducing fur- mation water. Rather, it seems that variabiity well above the detection limit and analytical precision can result from natural heterogeneities in water chemistry for borne chemical constituents. These average chemical diierchces in reduced species between stagnant water samples alld those obtain:; j after purging were frequently a factor of 5 greater that: &he errors involved in either the samlJing or analytical 1 :ocedures. Also, purging-related variations in TOC were observed to increase or decrease by *50% in all wells over the range of 1.20-30.0 mg of C-L-l. No consistent trends in TOC as a function of purging e.,Lld be associated with the different casing materials. Purging a particular well at either site frequently resulted in gkal.er differences in water quality than was observed bet\:etin upgradient and downgradient ground locations. Impr+er well purging can obviously cause gross bias in ground-water monitoring results that far exceeds that due to mate&L’s effects or sampling mechanisms.
Cement Grout Contamination. Despite the fact that all the drilling and well completion operations were held constant, the wells at site 1 exhibited significant water quality differences in both stagnant and formation water samples that could not be attributed to well purging or casing materials. For example, upgradient and downpra- dient wells at site 1, with the exception of the downgra- dient PVC well, exhibited pH values in excess of 12 pH units, and the alkalinity was primarily associated with hydroxyl ion. The downgradient PVC well yielded [or- mation samples with pH values between 7 and 8 pH urrits (mostly bicarbonate alkalinity), and the stagnant water values ranged from 8 to 12 pH units.
Anecdotal references to monitoring well contamination by cement grouts have been reported (14). The USU:~: symptom that has been observed is very high solution pl: (i.e., 10-12 pH units), even after exhaustive well develop- ment. In this study a totel of 12 sampling installations was constructed, and the bore holes were sealed above the screen and gravel pack, as well as at the surface wiLh a sand/shrinkage-compensating cement mixture. The grout seals were introduced as thick slurries into standing w;ltir in the bore hole after the well had been constructed.
At site 1, either native geochemical conditions or Jif- ferential settling of the cement mixture prevented the grout seals from setting up properly. The wells at this site
Environ. Sci. Technol., Vol. 20. No. 11, 1986 1 ibl

Table aI1. Compariuon 02 Ground-Wa.. _ Quality and Grout/Water Mixture An&&al Results
major species pH, pH units ulkalinity (OH-), miUiequiv~L” SUlf8t42 cslcium potassium sodium uilk&t! conductivity, &
other species magnesium eluminum chloride iron (total) manganeee (total)
contaminakd ground water grout-contaminated (field site 1, water upgradienty (UoratoW
12.7 >13 31.6 167
35.9 1076 190 1069 8.21 578 26.6 , 5.84 ifi 1975 11500
0.05 0.02 do.10 0.17 X1.0 0.09 ii:: 0.02 x0.02
20 -
alhless othrwise speciGe& unita are mcL-‘.
consistently showed high pH, alkalinity (>90% hydroxyl or caustic), Q-l, and CaZ+ with the exception of the downgradient PVC well, which showed only slightly ele- vated levels of caustic alkalinity. The apparent cement contamination problem persisted more than 18 months after construction, despite at least 10 redevelopment at- tempts. The installations at site 2 did not show any evi- dence of cement contamination, although several eariy pH measurements of formation water exceeded the long-term mean of -7.4 pH units.
The cause of this persistent contamination was inves- tigated by careful analysis of a number of cement/ sand/water mixtures prepared in the laboratory from the same materials used in well construction. The data in Table III show the comparison of average solution chem- istry results from an upgradient well and the aqueous phase of grout/water mixtures prepared in the laboratory. Clearly, the major ionic species identified in the grout- contaminated ground water are represented in the labo- ratory grout/water mixture aqueous phase. The alkahnity, conductance, and the calcium values in the ground-water samples were all approximately one-fifth their respective levels in the laboratory sample. Attempts to calculate an ion balance on the basis of OH- as the major anion resulted in ion balances that seldom agreed to better than 40%. There was always an apparent excess negative charge in solution. The possibility of a polymeric or gel phase (e.g., polysilicates) that might interfere with the analytical data or confute the dissolved ion charge balance was examined by NaHCOs digestion of the aqueous samples prior to analysis (15). It was verified that no unusual forms of silica or common alkali or alkaline earth cations were present that might cause gross errors in the alkalinity titrations or wet-chemical analytical methods. Therefore, the grout-contamination problem remains an enigma, although it should be obvious that grouting materials can drastically effect the reliability of ground-water chemistry data for long periods after well construction.
The cement grouts should have been placed either after water had been removed from the well bore or by tremie pipe. Also, the sand pack could have been isolated from the cement grout by a bentonite seal
Well Casing Material Effects. Apart from the dif- ferences noted above (Tables II and III) in the stagnant water samples, no consistent effects on the inorganic chemical constituent data from the two sites were observed
1182 Environ. Sci. Technol., Vol. 20, No. 11. 1986
._. . . . . .
140 160 180 200 220 240 260 280
Bn . ’ -
E bsm2 ’ ’ ’ ’ ’ ’ ’ ’ ’ ’ ’ ’ ’ 20- 4 WC Dantnd :Q : 18 - * 5 GornGmd --0 Gwwd Goant.+ / .,; :, \
--&PVC USGIti -5 UDGrti ‘- t Bu.xd UpGrad
JULIAN DAY
Fi9ure 1. Total organic carbon (mg of C*C’) in ground water at site 1 and 2. The error bars indicate two standard deviations from the mean of triplicate determinations.
that might be attributed to well casing material exposure alone. Total Fe and Mn concentrations were not signifi- cantly different in samples from the SS wells as compared to those from the PVC or PTFE wells These observations contrast with the elevated metal levels reported by Houghton and Berger on results from a single sampling event (9). The divergent results from this study reflect the influence of actual site conditio* temporal variability, and well purging practices on the type and relative severity of sampling and well construction related errors.
At the downgradient locations, all of the installations showed the effects of apparent landfill leachate contam- ination (i.e., elevated Cl; Na+, K+, specific conductance, and TOC). The ohserved levels of TOC or specific organic compounds, however, did not provide evidence of major organic (i.e., volatiles, base-neutrals, and phenols) con- tamination of these locations.
The observed levels of the nonvolatile fraction of TOC (i.e., NVOC) in ground water from the upgradient and downgradient wells at site 1 after purging are plotted in Figure la as a function of time during the summer and fall of 1984. The upgradient samples from each type of well showed negligible differences from the mean TOC of - 3 mg of C-L-‘. The downgradient location, however, gen- erally showed higher levels of TOC in samples from the stainless steel and Teflon wells than did samples from the PVC well. On four of the six sampling dates, the positive differences were significant at the 0.05 confidence level.

SITE 1 Dot JO; C&J- oos$L - 12, 05 - Mh if6
SITE 2 5.5
0.28 f
2 0.24
: yj 0.20 a = 0.16
/
-
--Q -0
--.. -* .* =..
-.., -..* *..* *... . . PVC DownGrad PVC DownGrad SS Down&ad SS Down&ad
T P
. . %. 1 %.* *...
Teflon DownGrad Teflon Dow&ad %. -..,
‘a.. =., ‘-. -. __.-
P P
_--- _....-- _....-- 4 4
&-----%. --.
-4’xb.-~~ --““* w-s_
--P
-0 PVC DownGrad -0 PVC DownGrad --e. SS DownGrad --e. SS DownGrad -* Barcad Down&ad -* Barcad DownGrad
!
I I I I I I I + I I , 1 1 ,
4
, 7
0.28 - -..
*-._.a . . 0.24 - ‘--... . .-- /A- 4 ‘.*
f
. .
*. 2 : . . ~O.ZOm- :
4; ,;'
'. *.
,/'
s : z ..*'
R 0.16 - : ‘.
,,.’
5
0.12 -
:, 4 ,/-
-i
ml 220 240 280 260
0.50 -
0.46 -
0.42 -
0.38 -
064 -
0.30 -
.L
0.18 130 150 170 190 210 230 250 270 290
0.26 0.26 -
0.22 0.22 -
130 150 170 190 210 230 250 270 290
JULIAN DAY
Figure 2 Levels of l.ldkhkxoetbne (1lDCE) anti cls-1.2diihkwoethylene (CEDCY) @gL-‘1 in ground water at sites 1 and 2. The errcr bars k&ate two standard devfaUons from the mean of tripficate determinations. Detection limit = 0.08 and 0.10 p*L-‘, respectively.
The TOC results at site 2 showed a similar pattern; how- ever, the differences in samples from the individual well casing materials were not statistically significant when compared to the analytical and sampling errors. *At site 1, levels of l,l-dichloroethane (11DCE) and
cm-1,2dichlorcethylene (cl2DCy) after purging also were higher generally in the samples from the downgradient Teflon and skinless steel wells than in thcee from the PVC well (l?iie WC)). The error bars on the figure represent two standard deviations from the mean determined by analysis of replicate samples end standa& IntheBecases, the %ainless steel” results were significantly higher (at the 0.05 level.) than either the Teflon or the PVC data. These concentration levels are all quite low but in the range of quantitation of the purge and trap analytical methodology. Therefore, systematic differences in ob- served trace organic compound distributions may arise from the sorptive effects of polymeric web casing8 as compared to stainless steel. The samples’froni the dif- ferently cased wells at site I showed more net difference in purgeable organic compounds than any single web showed over the study period
Overa& the levels of l,ldicbloroethane at site 2 &gum 2b,d) were 10 times above the levels measured at site 1. In contrast with the other results, levels of purgeable or- gsnics in samples from the PVC well were consistently higher than those in samples from either the slainks et& well or the gas-drive sampler. It is unlikely that the paired wells actually intercepted ground water of different mi-
croconstituent quality, as they were finished only - 1 IX (4 ft) apart. Yet, the PVC and 8tainless steel results fo.. 1lDCE differ by a factor of 2 This is more than 10 tilue.* greater than the precision established for analytiol de- terminations of these compounds. This order of mhkri-. ah-related effect could result in systematic under- or M- erestimates of the extent of ground-water contamiition, under some conditions. Tbis type of error cannot be ac- counted for in statistical comparisons of data froul up- gradient and downgradient locations unless an %ert* artifact-free well casing material can be identified.
The observations noted for site 2 above are also sup- ported by the levels of total volatile halocarbons in the PVC and stainless steel wells before and after purging. With the exception of the September 25 sampling date, the stagnant levels of volatile halocarbons from the PVC well are nearly a factor of 2 or more greater than those from the stainless steel installation (see Table IV). On the average, the PVC well yielded samples with higher LUUII levels of volatile halocarbons than did the stainless s&e1 well. It may be that under these conditions the sorptive and leaching properties of PVC tend tc maintain a higher background level of organic compounds in ground water exposed to this material relative to stainless steel.
Con&sions The purging of stagnant water from monitoring w&s
is essential to the collection of reliable ground-water qudcy data. In this study, the variations in water chemistry on
Environ. Sci. Technd., Vol. 20, No. 11. 1986 11%
:: . .~..
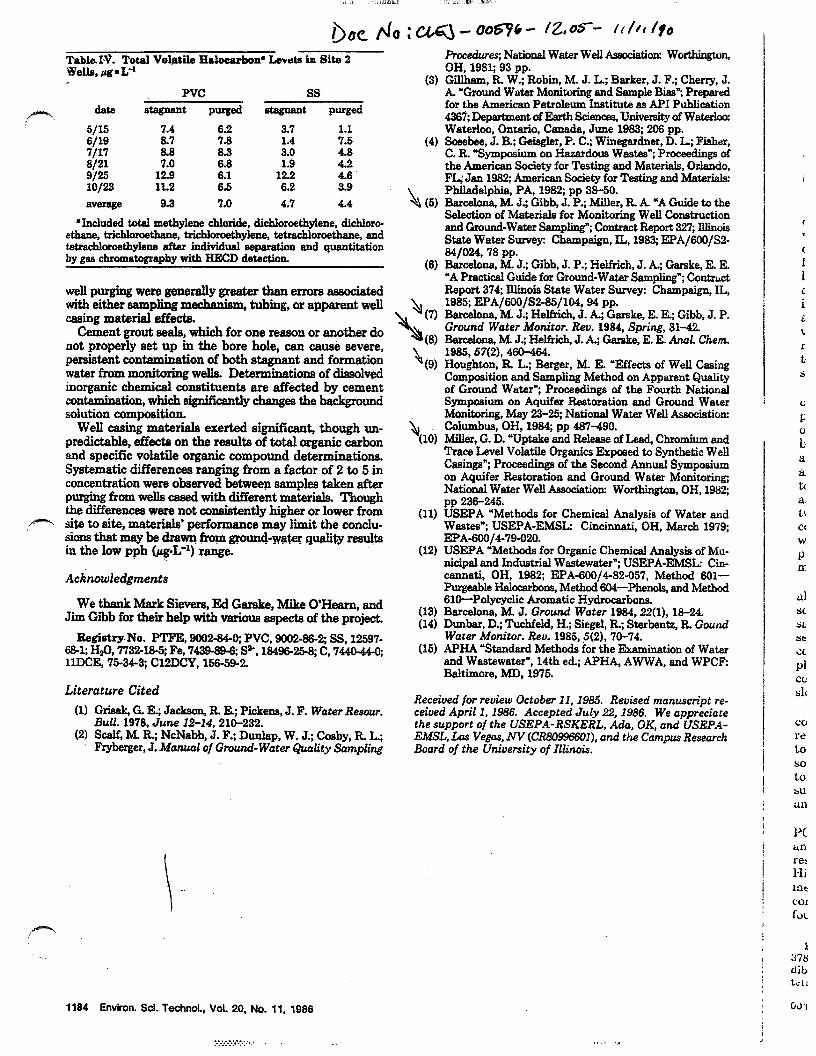
&ble. ET. Total Volfitile Hshcarbon~ Levals in Site 2 Wells, @g* L-1
PVC ss date stagnant Purged stegnant Purged
5115 7.4 6.2 3.7 1.1 6/19 a.7 7.8 1.4 7.5 7117 8.3 3.0 4.8 8/21 2 6.8 1.9 4.2 g/= 12.9 t:: 122 4.6 X0/23 11.2 6.2 3.9
average 9.3 7.0 4.7 4.4
“Included total methylene chloride, dichloroethylene, dichloro- ethane, trichloroethane, trichloroethylene, tetrachloroethane, end t.etcacbhoetbylene after individual separation and quentitation by gas chromatography with HBCD detection.
well purging were generally greater than errors associated with either sampling mecha&m, tubing, or apparent well casing material effects.
Cement grout seals, which for one reason or another do not properly set up in the bore hole, can cause severe, persistent contamination of both stagnant and formation water from monitoring wells. Determinations of dissolved inorganic chemical conatituenta are affected by cement contamination, which significantly changes the background solution composition.
Well casing materials exerted significaut, though un- predictable, effectc on the results of total organic carbon and specific volatile organic compound determinations. Systematic differences ranging from a factor of 2 to 5 in concentration were observed between samples taken after purging from wells ceaed with different materials. Though the differences were not consistently higher or lower from site to site, materials’ performance may limit the conclu- sions that may be drawn from grouncbwat.er quality mu&3 iu the low ppb &L-l) range.
Acdnowledgments
We thank Mark Sievera, Ed Garake, Mike O’Hearn, and Jim Gibb for their help with various aapecta of the project
Registry-No. PTFE, 9002-84-O; PVC, 9002-86-2; SS, 12597. 681; HsO, 7732-185; Fe, 7439-W S*, 1849625-8; C, 7440-44-Q llDCE, 75-34-3; CZ!DCY, 156-59-2
Literature Cited
(1) Grisak, G. E, Jackson, R Ez; Pickens, J. F. Water &sour. Bull. 1978, June 12-14, 210-232.
(2) Scslf, M. R; NcNabb, J. F.; Dunlap, W. J.; Cosby, R. L.; Fryberger, J. Man& of Ground- Water Quutity Sampling
1184 Environ. Sd. lkchnoi., Vol. 20, No. 11, 1986
“‘.:.-.~.:.‘..
Pmcedurtq National Water Well Association Worthington, OH, 1981; 93 pp.
(3) Gii, FL W.; Robin, M. J. L; Barker, J. F.; Cherry, J. A. “Ground Water Monitoring and Sample Bias”; Prepared for the American Petroleum Institute as API Publication 4367; Department of Earth Sciences, University of Waterloo: Waterloo, Ontario, Canada, June 1983; 266 pp.
(4) Sosehoe, J. B.; Geiiier, P. C.; Wmegardner, D. L; Fisher, C. IL symposium on Hazardous Wastes”; Proceedings of the American Society for Testing and Materials, Orlando, FL; Jan 1982; American Society for Testing and Materi&
h Philadelphia, PA, 1982; pp 38-50.
(5) Barcelona, M. J; Gibb, J. P.; Miller, R. A -A Guide to the Selection of Materials for Monitoring Well Construction and Ground-Water sampling”; Contract Report 321, Illinois State Water Survey: Champaign, IL, 1983; EPA/69O/SZ 84/024,78 pp.
(6) Barcelona, M. J.; Gibb, J. P.; Helfrich, J. A.; Garske, E. E. “A Practical Guide for Ground-Water Sampling”; Contmct Report 374; Blinois Stats Water Survey: Champaign, IL,
4l 1985; EPA/6OO/S2-85/104,94 pp.
\
(7) Barcelona, M. J.; Helfrich, J. k; Garske, E. EL; Gibb, J. P. Ground Water Monitor. Rev. 1934, Spring, 31-42.
(8) Barcelona, M. J.; Helfrich, J. k; Garske, E. E. Anal. Chem
h 1935,57(Z), -64.
(9) Houghton, R. L; Berger, M. E. ‘Effects of Well Casing Composition and Sampling Method on Apparent Quaiity of Ground Water”; Proceedings of the Fourth National Symposium on Aquifer Restoration and Ground Water Monitoring, May 23-25; National Water Well Ass&&ion:
& Columbus, OH, 19&4; pp 487-490. (10) Millsr, G. D. “Uptake and Release of Lead, Chromium and
Trace Level Volatile Organ& Exposed to Synthetic Well Casings”; Proceedings of the Second Annual Symposium on Aquifer Restoration and Ground Water Monitoring, National Water Well Associatiorx Worthinaton. OH. 1982: -.. . pp 236-245.
(11) USEPA ‘Methods for Chemical Analysis of Water and Wastee”: USEPA-EM& Cincinnati. OH. March 1979: EPA-600/479-020.
. . ~,
(12) USEPA ‘Methods for Organic Chemical Analysis of Mu- nicipal and Industriai Wastewater”; USEPA-EM& Cin- cannati, OH, 1982; EPA-609/4-82-057, Method 601- Purgeable Halocarhcms, Method 604-Phenols, and Method 616-Polycyclic Aromatic Hydrocarbons.
(13) Barcelona, M. J. Ground Water 1984,22(l), 18-24. (14) Dunbar, D.; Tuchfeld, H.; Siegel, R; Starbentz, R Gound
Water Monitor. Rev. 1985,5(2), 70-74. (15) APHA *Standard Methods for the Examiition of Water
end Wastewater”, 14th ed, APHA, AWWA, and WPCF: Baltimore, MD, 1975.
Received for review October 11,1985. Revised manuscript re- ceived April 1,1986. Accepted July 22,1986. We appreciate the support of the USEPA-RSKERL, Ada, OK, and USEPA- EMSL, Los Vegas, NV (CR809%60 I), and the Campus Research Board of the University of Illinois.
. . . . ..,

f
ooc r\l,: CLGJ- oom - /z,u5- 4/j+J
r??O Anal. C&em. 1985. 57, 460-464
Sampling Tubing Effects on Groundwater Samples 7 0
Fklmel J. Rarceloba,+ John A. Helfrich, and Edward E. Garske
Aquatic Chemistry Section, Illinois State Water Survey, Box 5050, Station A, Champaign, Illinois 61820
V9latPe organk Wmpoumk pose e challenge to groundw8ter e~mpff~pot~~theycanbekstasawatersamp)e dwses W-I* due to korptbn on tubtng or pump matertak L?boratery-sdpnon experhnents have been conducted wtth Pro ccmnm flsdle’tubtng mat&Is to determine thB impact o’ &j$tve-bta&~or&erofrotorm, trichloroethylene, Mchlor& r’hans, and tetrachloreethylene. Tubes made of Teftok, F*@*n@* pow, poly(vfnyl MeI, ad 8ifkom r-bber were I four&l to sorb the test compounds In short e~pertb(t6. wghltubhlgma’eriels-substcmtlal t-nounts of leachable organic matter In shnltar exposures. Ftblng mado of Teflon showed the least absorptton and l-aching problems and should be ihe tubing material of choice fw detatlod organic sampling purposes. Absorptlon hrto the r4ymer tnatrlx Is the ltkely mechanism for the errors.
The results of analysis of environmental water samples have sren far more attention in the literature than sampling pro- t.ocol considerations. For many types of samples;e.g., at- mospheric precipitation, effluents, and groundwater, the sampling steps which precede separation and a~alyticsl pro- cqdures are critical to the overall determination of the analytes or interest Field stand,arda and blanks can account for storage and analytical errors in the determination of organic com- pounds in groundwater. However, the effects of sampling mech.anisms (I), well casing, and sampling materials (2,3) on the integrity of thi samples must be evaluated independently.
Eval@ions of sampling materials’ related sources of bias pnd imprecision are complicated by the wide range of hy- drogeologic conditions encountmed in groundwater monitoring &uat.ions. The chemistry of the subsurface environment may 1:e dominated by considerable overpressures of CO* or Ns due to microbial or geochemical processes. Investigations at waste disposal sites frequently require the collection of aqueous solutions of organic solvents or highly mineralized acidic so- l*ltions which may vary considerably in time or between Pqmpling locations. It is difficult to adequately assess the magnitude and impact of aggressive groundwater/waste ad- r+trrres on the integrity of well casing, sampling pumps, or transfer tubing. In cases where severe deterioration may be rxpected, the use of appropriate materials is required.
The secondary effects of sample handling and material exposures are more difficult to evaluate. Matrix interferences !,f), volatilization losses (5,6), leaching (T-9), and sorptive (6, IO) sources or error have been addressed by a number of rosearch groups concerned with effective water sampling for organic compound -determinations. Sampling methods which do not involve exposure to flexible materials have a clear rdvantage in this regard (6). Interpretation of the results from these studies have been hampered by the diversity of ex- perimental procedures utilized and the lack of data available rlnder controlled conditions of material exposure which ap- proximate actual sampling conditions. It is clear from previous results that sampling operations can bias subsequent analytical (lcterminations of organic compounds at trace (ppb) levels. TTlany pl&ic materials in wide use in well casing nnd szimple fran~fer tubing have considerable affinity for low molecular
_. . -. _ weight org&ic &&&&n~ of interest h &o&d&a&r monitoring applications. Flexible, .polymeric materials, in particular, have been shown to sorb or leach a number of priority pollutant organic compounds. Indeed, several of these materials have been evaluated as prospective uadsorbenta~ for the preconcentration tid separation of organic compounds from aqueous solution (10, II).
Groundwater sampling for volatile organic compounds, on a routine basis, generally requires that the choice of an un- biased sampling mechanism (e.g., positive displacement bladder pump) and optimum tubing material selection should be made part of the sampling protocol. The tubing material is more critical than that used for well casing under most conditions. Well purging and normal sample flow rates (--1M) n&n&-‘) entail approximately ten times the nominal surface area contact per unit time for sampling tubing as compared to the well casing material. The present study was initiated to investigate five common flexl%le tubing materials under simulated sampling cohditions for the recovery of volatile halocarbons (chloroform, trichloroethylene, trichloroethane, and tetrachloroethylene) frequently identified in contaminated groundwater samples (22). The analytical procedures for these compounds are very well documented and are in routine use. In this way, analytical errors were kept under control while the effect of sampling tubing could be identified.
EXPERIMENTAL SECTION Apparatus. Sorption studies were performed in 75-100 cm
lengths of the tubing materials (I/, ln. i.d.). Tubing loops were joined by 4 mm i.d. glass T’s, which had been mod&d to accept the tubing diameter at each end. The third opening of each T was closed by a screw cap which served to hold a silicone rubber septum with a face made of Teflon for subsampling at specified intmv&d3 of exposures This arrangement allowed for the handling of samples and replicates without exposure to the atmosphere and volume to nominal surface area ratios of approximately 1.7 Lm-*.
The analytical method used for specific compound determi- nations was conventional purge and trap concentration (13) followed by gas chromatograpbic separation using a fused silica capillary column and a Hall electrolytic conductivity detedor. The analytical work was done on a Varian 37.40 GC, equipped with a Vista 402 data system. Dissolved organic carbon deter- minations for the poly(ethylene glycol) PEG studies were per- formed by the method described previously (14).
Materials and Reagents. Laboratory grade Silicone rubber, linear polyethylene, polypropylene, and poly(viny1 chloride)- Tygon tubing lengths were purchased from a local supplier. Tubing made of Teflon (TFE) was obtained directly from the manufacturer. The tubing segments were cut and rinsed with hot, soapy water, followed by exhaustive rinsing with double distilled water. The tubing was allowed to air-dry prior to COO- struction of the loops.
The organic solve&s used were ‘ACS reagent grade or JJiatilied : in Glass (Burdick and Jackson) and were used without further purificationi Standards were made up ln doubly distilled water or in 10” M NaHCO, solution. deoen&me on the needs of the experiment. DichloroGutane int&&l stan&rds were spiked into the samples prior to analysis and all samples, standards, and blanks were analyzed in triplicate.
Poly(ethylene glycol) (400 MW, Aldrich, Milwaukee, WI) Ws used to provide an organic background in two series of experiment to evaluate the effects of extraneous organic matter. PEG Was ;i.. chocrn hecause it is water soluble and it. UPC does lrnt interfere !

with the purge and trap analysis procedure (15). Procduris. Three se& of experiments were run in the
course of the study. Initial screening runs were made with chloroform as the test compound at 100 ppb &-L-l) in both distilled water and bicarbonate solutions of ionic strength varying from 0.901 M to 0.1 M. Fresh tubing loops were constructed of each material, cleaned, and rinsed with the appropriate test so- lution The loops were then filled to exclude any headspace, closed with the septum cap, and placed on a holding rack. At each exposure interval (5,10,20,40, and 80 min), a single tubii loop was emptied into a 15 mL glass vial with a Teflon-lined septum. Replicate samples were then taken by syringe for analysis. The sampled loops were rinsed and refilled with distilled water and then replaced on the holding rack for the same time interval to observe desorption effects. The temperature of the experiments was that maintained in the laboratory, 25 i 1 “C. Due to the short experimental expcewe psriods and the uqe of closed systems, the potential effects of other loss mechanisms (e.g., volatilization, reaction. etc.) were minii A mess balance was not attempted, since handiing blanks amounted to less than a 1% loss of sorbate in transfers and desorption was found to be incomplete for all the test compounds.
The second set of volatile halocarbon experiments was per- formed by using the four test compounds, each at 100 ppb in a mixture in both distilled water and diitilied water spiked with PEG to provide a 5 ppm-C background. PEG sorption and desorption were evahmted in separate experiments under the same conditions as the work described above. Freshly cleaned tubing loop5 were used for all experimental runs.
RESULTS AND DISCUSSION Chloroform Sorption Studies. The five tubing materials
were screened, employing timed sorption NTIS with -199 ppb CHCls distilled water solutions followed by desorption against distilled water alone. Average results of three sorption runs are shown in Figure 1. Initial solution concentrations were established for each of the exposure replicates at zero time. They have been blank corrected and initial concentrations were normal&d to 100 ppb for purposes of comparison. Error bars have been included for the TFE data, which were typical of t.he *9% relative standard deviation at f5% accuracy achieved in the course of all of these experiments. The results demonskate the rapid sorptive removal of CHCls by both PVC and silicone tubing to the extent that 80% depletion of the dkoihd concentration occurmd witbin 1 h PE PP, and TFE showed somewhat lower initial rates of sorption and the net amount removed from solution was less than half that of PVC or silicone rubber. Thus, the sorptive affinity of the materials for CHCls followed the order TFE < PP < PE < PVC < SIL.
Just as the bulk of the net sorptive removal occurred in the init.ial period (20 min) of exposure, 89-99% of the desorption of CHCls into distilled water took place almost immediately. The amount desorbed constituted less than 10% of the total CHCls sorbed. PVC and silicone tubing desorbed no more than 3% and 15% of the maximum amount sorbed (60 min), respectively. With these materi,els the bulk of tbe desorption (80-90% of maximum) occurred during the first 5 min of exposure to distilled water. PP and PE tubing desorbed somewhat more of the total CHCls sorbed (29-48% of max- imum) in 5 min than did PVC and silicone. TFE, which sorbed the least amount of CHCls of all the materials, desorbed 9-12% of the total within 10 min. It seems very likely that sorption of chloroform takes place by absorption into the pal-ymer matrix, rather than by a specific adsorptive surface mechanism. This hypothesis is supported by the results of previous CHC& sorption experiments reported by Cook and Hartz (IO), which were conducted in batch exposures over much longer time periods. They observed apparent ‘adsorption” of chloroform on PE and PVC tubing at surface coverages which far exceeded monolayer coverage. Indeed, the sorptive capacity of these tubing materials approached thnt of granular activated carbon, which had a nominal ex-
ANALYTICAL CH!3WJT?Y. VOL. 57, NO. 2, FEBRUARY 1985 l 461
PIgum 1. Concentration of NoroWn 60fbed. Thesorbedconcen- ira6ot-1 @pm”) of chlofoform from dl5tified water solutions is shorn esafuncUonoftbneinexpometoiJmtubingmteiiak Tefion.TFE (0): potypropylem. PP (0); polyethylene, PE (KY); ~~Winyl chlorkle), PVC (A), end silicone rubber, SIL (A).
posed surface area exceeding that of the polymeric materials by at least a factor of 1900.
Background Solution Cenqosition. The CHCls sorption experiments in tbii study were repeated over a range of ionic strengths (UY3 to 10-l M NaHCOs) and no significant dif- ferences from the previous absorption or desorption results were observed. Dissolved organic matter in natural waters has a marked effect on the sorptive behavior of trace organic compounds on metal oxides and sediments (16, 17). The direction and magnitude of the effects of background organic matter are difficult to predict Since the preceding sorption ins were performed under “clean” laboratory conditions, an attempt was made to investigate the effect of sorbing organic matter on the net absorptive and desorptive properties of the tubing materials This portion of the work included the study of the effect of adding PEG to the background solution, as well as the effect of the levels of organic carbon contributed to the solution by the leaching of the tubing materials.
Substantial amounts of organic matter leached from the cleaned virgin tubing materials and contributed to the background organic concentratious. The data in Table I show that, with the exception of TFE, all the tubing materials leached more organic carbon into the background solution within 30 min than was present as PEG. ,It,was, therefore, not possible to determine the extent to which PEG was sorbed by PVC, silicone, polyethylene, and polypropylene in these experiments. Although the conditions of leaching were not identical with those of Junk et al., 1974 (21, PVC tubing was found to leach the most organic matter as it had in their work Assuming that Teflon sorbed the least amount of PEG (-400 mm-r), it is reasonable to infer that at least 2 to 3 times the nominal surface coverage of the tubing available for CHCl, sorption (-250 bgm2) could be affected by background or- ganic matter.
The leaching of organic matter from the tubing materials
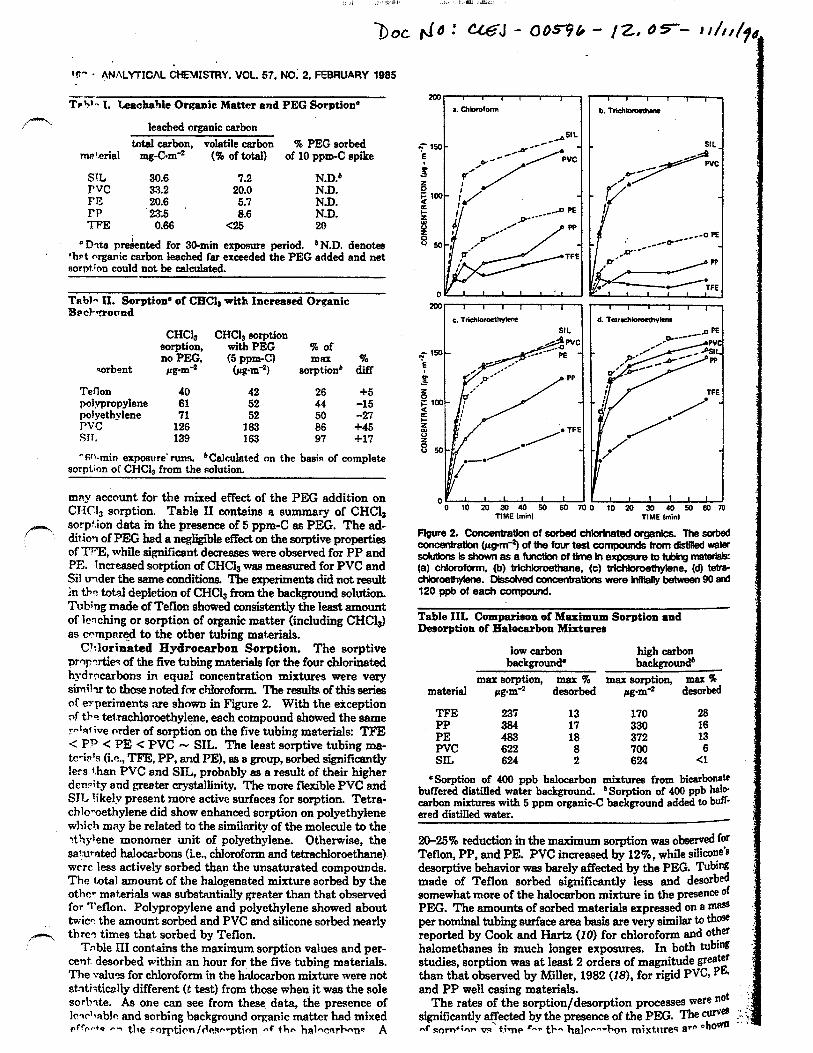
If7 * AN:\LYTIC/\L &EWSTRY. VOL. 57. NO: 2. FEBRUARY 1985
Tpv- I. Lea&ah1 e 0 ~#anic Matter and PEG Sorption0 f--. leached organic carbon
total carbon, volatile carhon % PEG sorbed mc’arial mg-Grn-* (% of total) of 10 ppm-C spike
S!L 30.6 7.2 b
PVC 33.2 20.0 ii-: FE 20.6 5.7 N:D:
KE ‘23.5 8.6 N.D.
0.66 <2S 20
a Wta pre&nted for 30-min exposure period. bN.D. denotes ’ ‘brt vganic c&on leeched far exceeded the PEG added and net
sornt.+on could not he calculated.
Tnbl- II. Sorptiona of CHCI, with Increased Organic Bswhrormd
CHCI, CHCla sorption sorption, with PEG % of no PEG,
sorbent pg-m” 6$Wg-’ 2 so$Znb &
Teflon 40 42 26 +5 polypropylene 61 52 44 -15 polyethylene 71 52 50 -27 PVC 126 183 86 c45 SIT, 139 163 97 Cl7
* W-min exposure runs. *Calculated an the basin of complete sorption of CHCls from the solution.
mny account for the mixed effect of the PEG addition on CJlC13 sorption. Table II contains a summary of CHCl,
F” sorption data in the presence of 5 ppm-C as PEG. The ad- ditioq of PEG had a negligible effect on the sorptive properties of Tf;7E, while signZcant decreases were observed for PP and PE. Increased sorption of CHCla was measured for PVC and Sil under the same conditions. The experiments did not result in tbs total depletion of CHC13 from the background solution. Tubing made of Teflon showed consistently the least amount of legching or sorption of organic matter (including CHC&) as cpmpnr@ to the other tubing materials.
CWorinated Hydrocarbon Sorption. The sorptive prqp ?rtim of the five tubing materials for the four chlorinated hydrocarbons in equal concentration mixtures were very shihr to the noted for chloroform. The results of this series of experiments l re shown in Figure 2. With the ejlception of t.bq tel.rachloroethylene, each compound showed the same r&five order of sorption on the five tubing materials: TFE <P”<PE<PVC - SIL. The least sorptive tubing ma- te-in’s (i.e., TFE, PP, and PE), as a group, sorbed significantly le?s ‘ban PVC and SIL, probnbly as a result of their higher denPity and greater crystallinity. The more flexible PVC and SJL likely present more active surfaces for sorption. Tetra- chloroethylene did show enhanced sorption on polyethylene which may be related to the similarity of the molecule to the ?t\ylene monomer unit of polyethylene. Otherwise, the saturated halocarbons (i.e., chloroform and tetrachloroethane) wrrc less actively sorbed than the unsaturated compounds. The t&al amount of the halogenated mixture sorbed by the other mat.&,& was substantinlly greater than that observed for T’eflon. Polypropylene and polyethylene showed about
6 tiico the amount sorbed and PVC and silicone sorbed nearly thrc? times that sorbed by Teflon.
Tnble III contains the maximum sorption values and per- cent. desorbed within an hour for the five tubing materials. The dues for chloroform in the halocarbon mixture were not stnti&aliy different (t test) from those when it was the sole sorb?te. As one can see from these data, the presence of lr+lnbblc and sorbing background ovanic matter had mixed dcr~+q ~7 the ?orptipn/de+avption nf thn halwywbnn@ A
0 10 20 30 40 80 70 TIME Iminl
0 10 20 Jo 40 80 80 70 TIME bninl
Table III. Comparieon of Maximum Sorption and k~rption of Halocarbon Mixtures
low carbon high carbon backgrounda hackgroundb
max sorption, max % max sorption, max% material pg-m-* desorbed pg-mm2 desorbed
TPE 237 13 170 28
FE 384 17 330 16 483 18 372 13
PVC 622 8 6 SIL 624 2 iti <l
‘Sorption of 400 ppb halocarbon mixturea from bicarbonaw buffered distilled water background. ‘Sorption of 400 ppb hale carbon mixtures with 5 ppm organic-c background added to bufi ered distilled water.
20+X% reduction in the maximum sorption was observed for Teflon, PP, and PE. PVC increased by l2%, while silicone’s desorptive behavior was barely affected by the PEG. Tubing made of Teflon sorbed significantly less and desorbd somewhat more of the halocarbon mixture in the presence Of PEG. The amounts of sorbed materials expressed on a m@ per nominal tubing surface area hasis are very similar to tb@ reported by Cook and Harts (IO) for chloroform and other halomethanes in much longer exposures. In both tubing studies, sorption was at least 2 orders of magnitude greater than that observed by Miller, 1982 (I@, for rigid PVC, PE* and PP well casing materials.
The rates of the sorption/desorption processes were not significantly affected by the presence of the PEG. The curve ::L t mfsnrn+:nn vsytiqp C-V tbn ha]pr--bon mixt,rlreq 8~" 'hoa "'

a. No addition SIL
p 10 2030405060 TIME (minf
700
F’guro 3. concentlatkms df tot&t scirkd ChlaNMted organks. The
cd organic matter; (b) with 5 ppmC, as poly(ethylene glycol).
‘1 . 5 in Figure 3. The presence of background organic matter
‘f raemod to accentuate the differences between the low sorption
J affinity materials (TFE, PP, and PE) relative to the more rorbent materials (PVC and SIL).
f As noted for chloroform, the initial rate of sorption was 3-5 z times more rapid in the first 5-10 min of exposure than that
I &served from 15 to 60 min. In the desorption runs, the bulk
1 of the previously sorbed material remained in the tubing
t lnaterial over comparable time periods (Table III). About r-15% of the sorbed material could be leached with either
j ciistilled water or bicarbonate solution. Desorption was ob- i qorved only in the initial 5-10 min of repeat exposures. i These data support the bypothesls that the sorption of j -hlorinated solvents by flexihle tubing materials occurs by
’ &sorption into the polymer matrix. The flexible materials therefore represent a virtual sink for the chlorinated solvent
: -orb&e which should be very carefuby considered in planning mundwater sampling protocols. Under equivalent conditions,
1 ‘he sorptive capacities of the corresponding rigid well casing materials are much below those of the tubing materials. The flexible tubing materials more rapidly sorb greater amounts cd the halogenated hydrctcarbona Desorption data for the rigid materials are not available to complete the comparison.
The recent work of Rice and Gold (1934) with poly- cropylene supports the general conclusions of this study. They observed impressive recoveries of polynuclear aromatic hy- drocarbons, aryl phtbalate esters, and dodecanol from 1 to lf@O ppb solutions on packed beds of polypropylene sorbent. It is not obvious whether these functional classes of com- pounds would be either adsorbed or absorbed by the flexible tubing m~~tcrials. However, in at least one case (pyrene) lower recoveries may be attributed to diffusion into the polymer. Sorption behavi0r.i~ confrolIed by both the chemical properties
; of the sorbote and the polymer matrix of the sorbent. The ; compounds used as sorbates in the present study are per- 1 i
sistrnt, mobile, and only moderately hydrophobic. They are
i similar tc many dissolved organic contaminants in ground-
? $ watrr. Thus, the results strongly suggest that flexible tubing choices mix& be very carefully made to ensure good sampling recovery and precision.
The magnitude of the impact of sorptive processes on $roondwat.cr sampling results is difficult to predict a priori.
ANALYTICAL CHEMISTRY. VOL. 57, NO. 2. FEBRUARY 1985 . 493
Table IV. Predicted Percent Sorptive LOSS of Chlorinated Hydrocarbons due to Tubing Exposures0
tubing % loss diameter, in. TFE PP PE PVC SIL
114
3/i $1
(:I 6) (:I :I (“5,. 112
&) (i.7) t:, 4 4
‘40 ppb mixture of chloroform, trichlotomethylene, tetrachlorc+ ethane, and tetrachlotoet.hylene calculated on the basis of initial sorption rat.439 on passage through 15 m of tubing at 100 mtmin-*. Percent loss values are tabulated for the original solution (with) and without oxanic carbon be&round.
Fromthestati~short~ laboratory resulta of this study, we have made some prehmmy estimates. Take, for example, a monitoring situation in which a -15 m length of flexible tubing is used to transport aampIes at -100 r~&min-~ from a well bore to the land surface. Using conservative initial sorption rates from this study, of approximately 10 jqqr-*. mi+, the percent sorptive loss of halocarbon mixtures in transport may be calculated. The calculated initial sorption rates ranged from 3 to 50 mm*min-l. Table IV contains the results of such a calculation for a 40 ppb solution of the compounds for three commonly used tubing diet&s. The calculated sotptive losses for r/i in. i.d. tubing are in the range of controlled analytical bias for trace organic analysis meth- odologies. The effective losses are clearly more dependent on the materials than on the tubing &meter. Lsrger internal diameters minimize the effect of sorptive bias. The impact of sorptive losses is concentration dependent. At the 4 ppb trace organic range, the percent losses range from 6 tc 150% for 1/J in. id. tubing. Therefore, it appears that gross errors in trace organic determinations can occur in the parts-per- billion concentration range due to tubing effects alone. Tbe ratea and extent of sorptive mmoval of the volatile halocarbon suggest that well purging and preexposure of the tubing material may not alleviate the overall impact of sorptive bias. Although the conditions used in this study are not directly comparable to those which may be encountered in field sam- pling, the potential for such problems clearly exists. A com- prehensive evaluation of sampling mechanisms, sample transport tubing, and storage precautions should be made a part of the planning of all groundwater sampling protocols Sampling performance may well exert control over the levels of various contaminants which may be regulated practically in these systems.
ACKNOWLEDGMENT The authors appreciate the technical support of. Greg
George, Mark Brooks, and Pamela Beavers. The comments of James Pankow and Gary Miller were most helpful in preparing the paper. The information and support of various tubing material manufacturers are also appreciated.
LITERATURE CITED ._ (1) Barcelona. Mcheid J.: He)hkh, John A: Quske. Edward E.; Ubb.
James P. &XI& Watw Monlt. Rev. %84. 4 (2). 32-41. (2) Junk. (Lega A; Swc. Harry J.: VI& Ray D.; Avery. Mlchd J. fnvl-
mn. sd. fednol. 1974.8. 1100-1109. (3) Barcebne. Mlclwd J.: Gibb. James P.: Mlbr, R&h A. -A Gukb to the
!3ekaon of Meterials for Monitoring well cansauctlonandGround- Water 3ampling”; EPA-SO91S2-94-024. March 1994. ISWS Contract. Report No. 327. Xllinob State Water Bwvey. Chnrnpbn, IL 78 PP.
(4) Sosebss. Jacksm B.: Gdszter, Pad C.: tMnegdm.DuEaleI;l=ls~ er.CwtisR.“Contamtna8onof&oundWaterSsfr@as~PoMd Chbride Adreshree and Pdyvinyl Rkner hum Mcdtor We”; 1983. Hazanlous and Industrtel Solld Waste Tasting: second Symposium Conwey. Ft. A., t3uWgo. W. P.. Ed%; ASTM: f’hbsde~. PA. 1983; ASTM 805. pi 38-60.
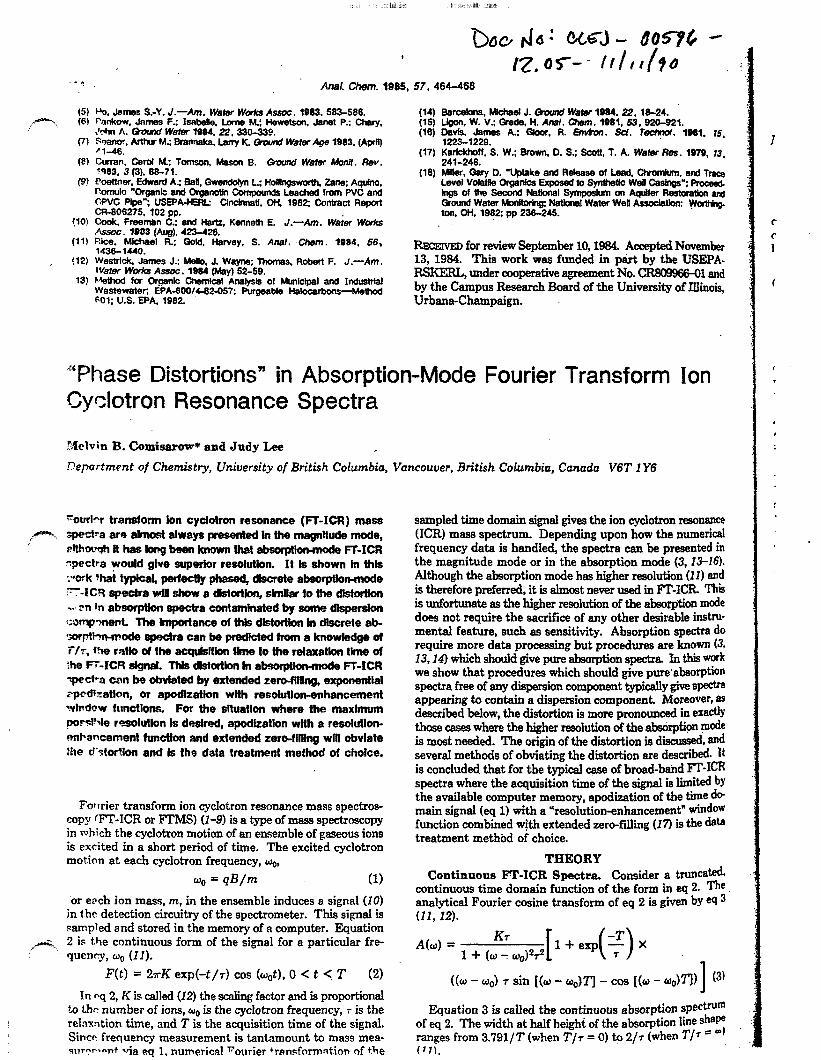
,
-? Anal. cbeln. 1995,
(5) Ho. Jertws S.-Y. J.-Am. Water Works Assoc. 1953. 553-586.
f-- (6) ~ankow. James F.: IsabeRe. Lcmm M.: Hewetson, Janet P.: Chary, .%h~.-w8iW~@8d.~,~o-33~.
(7) ~9ZJ~.kthWf'+EWWakf~.by K.&IX& %'8tM&W 1983.(&) fl1-46.
(6) Curran. Carol M.: Tcinson. Mason B. aovnd Wster Mm&. Rev. ‘983. 3 (3). 68-71.
(9) bettner, Edw7wd A.; 8alI. Gwmddyn L: HoRngswa(h. Zane: Aquino. bmulo “Organic and Orgam cwnpamds Leeched from PVC and WVC pipe”; USEPAXRL: ClnchnaU. OH. 1982: Contract Raport ‘X-806275, 102 pp.
(10) Cook. Freambn C.: snd Hartz, Kenneth E. J.-Am. Waier Waks Assoc. 1903 (Au&. 423-428.
(ii) Rice. Micheel R.: Qokl. Harvey. S. AM. Chem. 1984. 56, 1436- 1440.
, $12) WestrIck, James J.: Malb. J. Wayne: Thmms, Robart F. J.-Am. Mfter Work Assoc. 1934 (May) 52-59.
13) &&cd for Drpanlc Chennlcal Analysb of Municipal and lndustrtal Wastewater: EPA-600/4-92-057: Pugaabfa Halocarbons-MetJwd 601: U.S. EPA. 1982.
57.464-466
(14) Barcakma, Michael J. &umd Water 19S4.22. 18-24. (15) Ll9an. W. V.: Orada. H. Anal. Chem. 1981.53,920-921. (16) Davis. James A.: Gbor. A. Envbn. St%. Tec&wl. 1981. 15,
1223-1229. (17) Kakkhoff. S. W.: Brown. D. S.: Scott, 1. A. Water Res. 1979. 13,
241-248. (18) MM. Gary D. “Uptake and Rafeasa of Lead. Qwatnkm. and Tracs
LevelvolfdneorganlcsExposedto~fkwellcesings”:Rocesd kQSOflh9S3COfldNEltlOllBlSymposkanOllAQUlf~Restoretknaflfj fhund Water BhmMhgi Natbnal Water Well Aw0clauOn: Wor!mp ton, OH. 1982; pp 235.245.
REEIVED for review September 10,1984. Accepted November 13,1984. Thii work was funded in p&t by the USEPA- RSKERL, under cooperative agreement No. 01 and by the Campus Research Board of the University of Illinois, Urbana-Champaign.
“‘Phase Distortions” in Absorption-Mode Fourier Transform Ion Cyc=lotron Resonance Spectra
Melvin B. Comisarow+ and Judy Lee I
Pepurtmmt of Chemistry, University of British Columbia, Vancouver, British Columbia, Canada V6T 1 Y6
Tourlrr transform ion cyclotron resonance (FT-ICR) mass
,e. spectra ara almost always presented in the magdtude mode,
ebw#l it h&s brig bean known that abscfpH- Fr-ICR -pecka would give superior resdutlon. It ls shown In this :*ork ?hz$ typkal, perfeciiy phaseU, dlscrete absorptionmode F-ICR spectra Wn show 8 rbiorlkn, simliar to the dlstodon -..?n ln absorption spectra conlaminated by some dispersion :-ornp-x-uM. The bnportance of this dlstortlon b discrete ab- mrptl?nnode epecfra can be predicted from a knowfadge of T/T, *he ratlo of the aoqulsltlon time to the relaxation time of the m-ICR sIgnal. MS fNsiarHon In absorpt~ Ft-ICR yect-a can be obvkhd by extended rero-fNNn& exponentlal
cpcdkatlon, or apodlzatlon wlth resofution-enhancement windew frmotlons. For the dtuatlon where the maxlmum pocslhle resolution is dashed, apodhation wHh a resolutlon- en!-ancemenf fur&Ion and extended zero-fllfhg WIN obviate !he d’c,tortion and Is lhe data treatment method of choice.
Fotlrier transform ion cyclotron resonance mass spectros- copy WI?-ICR or FI‘MS) (1-9) is a type of mass spectroscopy in lvvhich the cyclotron motion of an ensemble of gaseous ions is excited in a short period of time. The excited cyclotron motion at each cyclotron frequency, wo,
“0 = qB/m (1)
br epch ion mass, m, in the ensemble induces a signal (IO) in the detection circuitry of the spectrometer. This signal is Fampled and stored in the memory of a computer. Equation 2 is the continuous form of the signal for a particular fre- quency, coo (11).
F(t) = 27rK exp(-t/T) cos (wet), 0 < t <, T (2)
In pq 2, K is called (12) the scaiing factor and is proportional to thp number of ions, o. is the cyclotron frequency, T is the relnxntion time, and T is the acquisition time of the signal. Since frequency measurement is tantamount to mass mea- Rvmr*on+ qria eq 1, numerical Fourier trnnsformrrtion of the
sampled time domain signal gives the ion cyclotron resonance (ICR) mass spectrum. Depending upon how the numerical frequency data is handled, the spectra can be presented in the magnitude mode or in the absorption mode (3, X3-16). Although the absorption mode has higher resolution (II) and is therefore preferred, it is almost never used in m-ICR This is unfortunate as the higher resol~on of the absorption mode does not require the sacrifice of any other desirable instru- mental feature, such as sensitivity. Absorption spectra do require more data processing but procedures are known (3, 13.14) which should give pure absorption spectra In this worir we show that procedures which should give pure’absorption spectra free of any dispersion component Qpically give spectra appearing to contain a dispersion component. Moreover, as described below, the distortion is more pronounced in eras%’ those cases where the higher resolution of the absorptipn mods is most needed. The origin of the distortion is did, and several methods of obviating the distortion are described. It is concluded that for the typical case of broad-btid FT-ICR spectra where the acquisition time of the signal is limited by the available computer memory, apodisation of the time do main signal (eq 1) with a ‘resolution-enhancement” window function combined w$h extended zero-filling (17) is the dab treatment methbd of choice.
THEORY Continuous JFl’-ICR Spectra. Consider a truncs~~
continuous time domain function of the form in eq 2. The analytical Fourier cosine transform of eq 2 is given by eq 3 (11, 12).
A(w) = 1
((0 - w0) 7 sin [(o - oo)T] 2 co9 [(o - uo)TJ) I (31
Equation 3 is called the continuous absorption spectrum of eq 2. The width at half height of the absorption line shsp ranges from 3.791/T (when T/r = 0) to 2/7 (when T/r S 4 (Ill.

“Gregor A. Ju&* parry J. Svec, Ray 0. Vick, and Michael J. Avery . ‘Ames Laboratoiy-US’AEC and Department of Chemistry, Iowa State University, Ames, Iowa 50010 ,.
m Organic contamination ranging from l-5009 parts per biiion (ppb) by weight was detected in the .water which had 5owed .&rough tubes of polyethylene, polypropylene, black latex, six different formulations of polyvinylchlo- ride, ancl a plastic garden hose. The contaminants in the effluentwater were isolated by sorption on macroreticular resin bt&s contained in a small glass column. The sorbed organic compounds were then eluted with diethylether, the eluate was concentrated by evaporation, and the or- ganic contaminants were separated and measured quanti- tatively by gas chromatography. Identifications of plasti- &em and other polymer additives were made by combi- nation gas chromatography-mass spectrometry. The de- scribed method is accurate and convenient for testing polymer tubes intended for use in situations which require flowing water or water solutions.
Data have recently appeared concerning the production (I, 2) and use (2) of certain plasticisem and other addi- tives used to formulate polymers with properties desirable for their use in medicine, transportation, home fumish- ings, construction, apparel manufacture, food packaging, beverage production, and milk processing. The total pro- duction of phthalic acid esters, which represent only one
*f=- of several classes of additives, has been over 1 billion lb per year during the period 1967 to 1973 (1, 2). This amount of synthetic material repetitively distributed ‘throughout the environment naturally causes some con- cern, especially in view of tbe many recent toxicity studies
- of additives (3-16). Phthalates have been found in plants (I7), fungus (18))
.air (1, l9), food (20, 22), milk (22. 23), soil (24-271, blood (3, 5, 2&32), lipoid solutions (3, 5, 29), oil (33), body tis- sue (34), and water (5, 9, 35-40). Thus, the ubiquity of phthalates as well as other additives is clearly established. Although some of these may be present in the environ- ment because of natural processes, there is little doubt that the major share of the current distribution is due to contamination from various polymers.
This report describes an accurate method for the deter- mination of the organic contamination of water by various polymer tubes. The method accommodates test conditions
‘similar to those encountered in the eventual use of the polymer tubes to transport water or aqueous solutions.
Expetimental XAD-2 Resin. This macroreticular resin was obtained
as 20-60 mesh beads from Rohm and Haas, 5000 Rich- mond St., Philadelphia, Pa. 19137. The resin was purified by sequential Soxhlet extractions with methanol, acetoni- trile and diethyl ether (41) prior to its use in the extraction
. columns described later. Solvents. All solvents were either spectrograde or ana-
lytical grade. whenever blank determinations suggested
r”l impurities detectable by flame ionization gas chromatog- raphy, these solvents were further purified by fractional distillation.
Test Water. The distilled water used in the contamina- tion tests was purified by passage through a column filter
1100 Environmental Science 8 Technology
containing 20 grams each of XAD-2 resin and activated CharCOal. Water treated in this manner contained 1~ than one part per hillion (ppb) by weight of detectable cr. ganic material. This purified test water is referred to 86 “pure” water in this report.
synthetic Polymer Tubes. All polymer tubes u& ia this study were purchased from commercial suppliers in 1973. These suppliers are not identified because.polyuer formulations are frequently changed and the results.of OUT tests suggest that all commercial polymer tubes c4mtami. nate the water passed through them. The tubes were ei- ther l/s in. or s/s in. i.d. and cut to 25-ft lengths for test purposes. Pretreatment consisted of flushing -25 liten of “pure” water through each tube immediately before each contamination test.
Instrumental. A single column, Varian 1200 gas chm matograph equipped with a linear temperature program- mer and a flame ionization detector (FID) was used to separate, detect, and quantify the contaminants isolated from the water samples. All extracts of the contaminants were chromatographed using 6 ft x l/s in. o.d. stainless steel columns packed with 80-109 mesh AW-DMCS treat- ed chromosorb W coated with 5% w/w OV-1 liquid phiise. Chrrier gas flow was 20 ml/min for all separations and each chromatogram was obtained by injecting 3.0 pl of the ether concentrate into an off-column injector at 25o’C. After an initial hold at 50°C for 1 min, the column ~86 programmed to 250°C at 15’C/min. The detector temper’ ature was 250%. The detector response was calibrated for quantification using an aliquot of a standard solution of indan, naphthalene, and acenaphthylene in ethyl ether.
A DU Pant model 21-490-l combination gas chromoro- graph-mass spectrometer (gc-ms) was used to obtoie mass spectral date from which many of the chromate graphically separated’ components were identified. ‘l’bc same chromatographic; conditions used with the V&s 1200 gas chromntograph were employed with the Vauu 1490 gas chromatograph interfaced to the Du Pont 214% mass spectrometer via an all-metal jet separator. The %P arator and connecting lines were held at 225% and the im source at 275%.
A Digital Equipment Corp. (DRC) PDP-E/46 wini- computer was, interfaced to the gc-ms to assist in d.;u logging, reduction, and manipulations for interpr@li& purposes. Updated MASH (mass spectrometer dam hLn- dlmg) software. as%rpplied by DRC was employed. md software allowed for calibration of the computer for werr( marking and acquisitionof approximately 250 mass sp* tra acquired at six second intervals for each gc-m w The mass ra’nge covered was from 26-609. Data maeiP”l* tions, such as generation of total ion mass chman:i grams, selected ion mass chromatograms, backgm subtraction, spectra averaging, and ion series table
were used at the discretion of the operator on an inter&‘* tive basis after data accumulation and transfer onlo mz netic tape by the minicomputer. These progrsmj *” used to aid in the interpretation of each mass slJcclrulo.
A . .-_ 8. ‘:
visual display on a cathode ray tube was used for Iml? L ” ai’ ccht ,e
’ 4, ’ J’JlQ I;lr ing line diagrams of each mass tabulation of the displayed spectrum typewriter was desired. In most cases, cations were suggested by a manual

psek b&x of Mass Spectra obt 2 from the British In- r&&ion solpwa, 845 Third Ave., New York, N.Y. 1agz. When uecessary, the DCRT/CIS Mess Spectral ph System, developed at the National Institutes of ~th (42) and now available through the General E&c- kc Mark III computer services (write to GE. Information 3&ces, 777 14th St., N.W., Washington, D.C., 20005), ssss also employed for identification purposes.
nbe Contamination Test Procedure Appaxatus and Quantification. A schematic diagram
of t,be sampling apparatus is shown in Figure 1. All con- dons, adaptors, and valves are standard fittings except &! upstream connection of the polymer tube to the &ed intake manifold and the downstream connection to & glass extraction column wh+h are both friction fit ccnn&iona.
The extraction columns are easily prepared by inserting 8 small sibmixed glass wool plug near the stopcock and +g a methanol slurry of clean IUD-2 resin into the &ss cohunn. Then a second glass wool plug is inserted &we the resin bed, and the column is capped to main- & the resin in a methanol-wetted condition.
To test a polymer tube for contamination, the cap is re- moved from the column and the methanol is displaced with five. 20-ml portions of “pure” water, The stopcock is &ed when. the last water wash level reaches the top of tks upper glass wool p&g. This procedure ensures com- plete displacement of the methanol and adequate water wetting bf the resin. A 25-i% length of the polymer tube to bs tested is then attached to one of the intake valves. The valve ia opened and -25 liters of “pure” water are al- lowed to flow freely through the tube. This action flushes
. .
D ,’
F Q
&rre 1. Sampling apparatus for contamination tests: (A) point ol attachment of the combination XAD-2 and charcoal filter for Wdfying the distilled water; The arrow indicates the direction of water flow: (B) valved inlet manifold for simultaneous testing of Wersl eolvmer tubes: (C) bolvmer under test: (0) glass ex- ksction column containing 2 grams of clean 40-60 mesh XAD-2 rel; (E) glass wool plugs: (F) effluent stopcock and metering
;‘%lce for measuring total water flow through the polymer tube ,., .:, - iy. : 5 ._’ .., . j,;. . . :
>,
the tube prior to test and removes air bubblrj wLcil can cause undesirable turbulence during the test r&. When the tubs is free of air bubbles, the water flow is .it- creased and the downstream end of the tube is attacki to the extraction column and the stopcock is opened im- mediately. Tbe intake valve is adjusted to achieve a IUJ of 60 ml/min through the tube and extraction colu~~tn. The simple expediency of checking the effluent water flow periodically with a graduated cyliider and a stopwatch ia sufficiently accurate for calculating the total volume fiow during a given test period. When the desired amourn of water has passed through the tube, the intake valve end effluent stopcock are closed, and the extraction c01um~1 is removed from the polymer tube.
The procedure for eluting and quantifying the orgltlic compounds sorbed on the resin has been described in de- tail by Junk et al. (41). Briefly this procedure is 9 foI- lows: open the stopcock to drain most of the remailing water from the extract& column; add 25 ml of ethyl ether ‘and allow 5-10 min for equilibration; open the slap- cock and collect the ether eluate in a 20 x LX-mm est tube; plunge the test tube into liquid Ns for -20 set’ to freeze out the 0.5-1.0 ml of residual water, decant the cold ether eluate into a modified Kudema-Danish ev&po- rator vessel; concentrate the ether solution to 0.5 r& dnd use a 3.0~~1 abquot of this concentrate for gas chrom4to-
graphic arialysis employing the conditions described in the instrumental section of this report.
The chromatogram peak areas are then measured and the amount of contamination due to each separated ctim- ponent is calculated using the equation,
(PJ x (St x (V*) M W,) x W,I
=---=ppbi liter
Pf = peak area of the ith chromatographic peak in cm’, S = detector response factor in pg/cm*, VI = volumt: of ether concentrate in pi, Vi = injected ahquot of ether colS- centrate in ~1, VW = volume of water passed through the polymer tube in liters, and ppbd = parts per billion by weight of the ith component in the w@er.
The total contamination equals ,.z, ppbl where: IL
equals the number of components detected. The repro- ducibility is generally *lO%. Blank determinations are made using the same volume of water and procedure, but deleting the polymer tubs and amnecting the extraction column directly to the intake valve.
Identifications. Since the gc-ms results are used Aely for identification purposes, the normal procedure is to concentrate the ether eluate further from 0.5 ml to -0.05 ml using a stream of Ns gas or free evaporation. This ad- ditional concentration facilitatea the gc-ms operation and although some loss& of the more volatile compontinncs occur, no difficulty is encountered in relating the p&is observed on the conventional FTD chromatogram to those observed on the goms total ion monitor (TIM) chrom&o- gram. Aliquots of 1.5 ~1 are injected for the gc-ms idcnti- fication experiments using the chromatographic-mass spectrometric conditions described in the ..‘instrumerlt;ti section.
Preliminary identifications were made from the conk- puter~manipulated mass spectral data. These were usually confirmed by matching both the gas chromatogrsphic rtf- tention times and the mass spectral fragmentation pat-
terns of the unknowns with those obtained for authe.ltic samples. When necessary, additional confirmatory cvi- dence for the identificatious was obtained using other in- strumental analyses of fraction-collected components.
.Y. Volume 6, Number 13. December 19’14 8 131
; .’ ‘2 :,

end6, vqies from a 1. I 1 ppb for polyethylene tuba to a high of 5000 ppb for Food-Beverage Grade PVC tutes.
To aid in the comparison of chromatograms, the chic. matographic conditioixs and the time scales ark identical in each figure. These comparisons reveal that a number of the contaminants have similar gc retention volumes. Also, from 5040% of the total contamination normally involves four to six contaminants.
.The complexity Of the chromatograms and the relatively
.': (jepara&&‘Q . twntdi@on. ,Tracings of the FID . <’ chro&~, ~‘a’ccimulated kin the Varian I.200 gc (see
Inatrnuienti.sectian) fdr ‘the various polymer tubes tested, ‘am shckn iri Figures 24. The reqonse is scaled for each , chromatog& to make possible a rapid visual comparison of the number and the intensity distribution of contami-
‘, nanta. The total contamiqation, listed in the figure leg-
/-
J ’ ’ * * * * * ’ L 20 I6 I2 8 4 0
NUTES- m 16 12 8 4
- Ml -MINUTES-
20 I6 I2 8 -MINUTES- ”
HOSPITAL I
2
,.,,,, j,j.. ~ ,,,, , ,f ,I
I J x.2 *E!
.,
- 20 16 12 8 4 o 20 ,I6 I2 8 4 0
!’ --MINUTES& -MINUTES L
F&we 2. Chromatograms from tests of polyvinyl chloride (PVC) tubes-25 ft X ‘h in. i.d.: general chemical grade (11 ppb): law,r$ grade (4 ppb); processed milk grade (6 ppb); food-beverage grade (5000 ppb); FDA-USDA approved grade (9 ppb); hosPitd-w I’ grade (6 ppb). Vinyl chvoride monomer, if present, is not detected because it is masked by the large solvent peak
.
1102 Environmental Science 8 Technology g . . .,., d
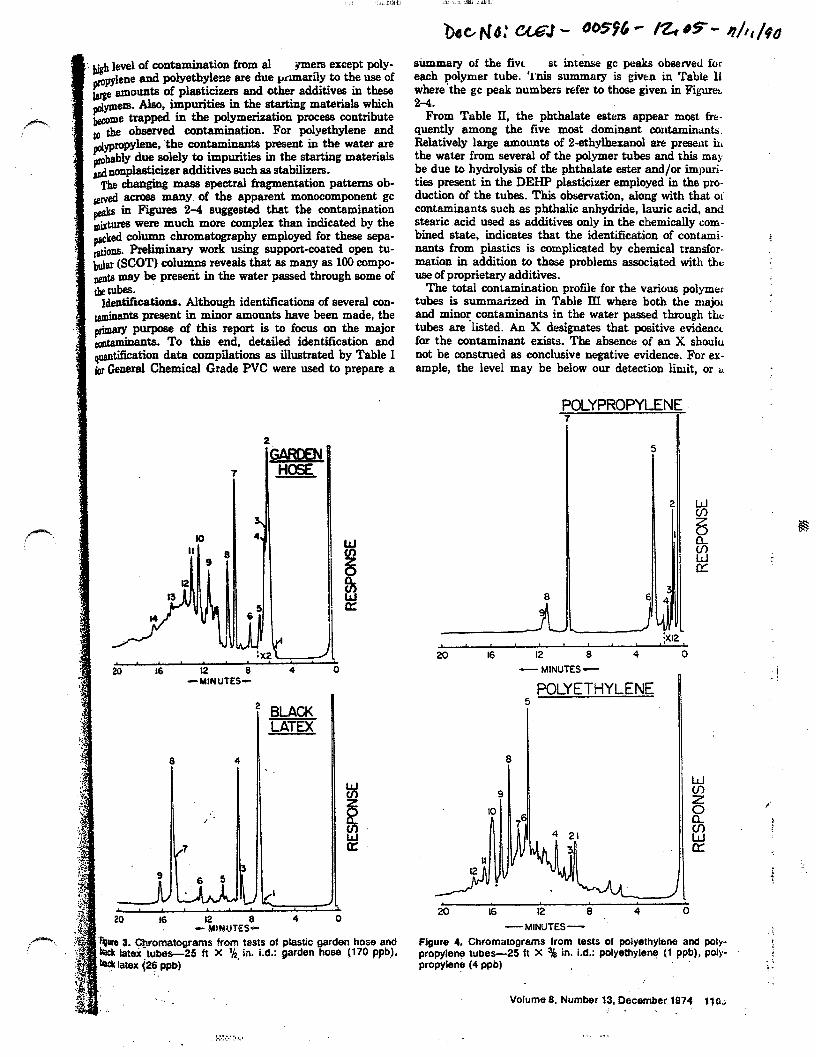
summary of the five st intenSe gc peaks observed for each polymer tube. ‘lais summary is given in Table Il where’the gc peak numbers refer to those given in Fib?lrel 2-4.
From Table II, the phthalate esters appear most fre- quently among the five most dominant contaminants. Relatively large amounts of 2-ethylbexanol are present in the water from several of the polymer tubes and this may be due to hydrolysis of the phthalate ester and/or impuri- ties present in the DEHP plasticizer employed in the pro- duction of the tubes. This observation, along with that oi contaminants such as phthalic anhydride, lauric acid, and stearic acid used as additives only in the chemically com- hmed state, indicates that the identification of contami- nants from plastics is complicated by chemical rransfor- mation in addition to those problems associated with the use of proprietary additives.
The total contamination profile for the various polymer tubes is summarized in Table III where both the majol and minor contaminants in the water pllssed through th tubes are listed. An X designates that positive evidence for the contaminant exists. Tbe absence of an X shoulu not be construed as conclusive negative evidence. For ex- ample, the level may be below our detection limit, or u
,+ level of contamination from al ymers except poly- opylene and polyethylene are due prunarily to the use of %e amounts of plasticizers and other additives in these ,lpers. Also, impurities in the starting materials which *me trapped in the polymerization process contribute , the observed contamination. For polyethylene and dypropylene, ‘the contaminanra present in the water are &ably due solely to impurities in the starting materials 4 uonplaaticixer additives such as stabilizers. The changing mass spectral fragmentation patterns ob- !& acroea many of the apparent monocomponent gc &s in Figures 2-4 suggested that the contamination ;at,ures were much more complex than indicated by the &ed column chromatography employed for these sepa- tieus. Preliminary work using support-coated open tu- &II (SCOT) columns reveals that as many as 100 compo &s may be present in the water passed through some of le tubes. Identifications. Although identifications of several con- x&anta preeent in minor amounts have been made, the rimary purpose of this report is to focus on the major xgamim~ta. To this end, detailed identification and eaatification data compilations as illustrated by Table I u General Chemical Grade PVC were used to prepare a
LYPROPYLEN
f
20 16 12 8 4 0
- MINUTES -
POLYETHYLENE 5
BLACK LATEX
4 8
. t
)L,
20 16 12 0 4 - MINUTES-
20 16 12 0 4
-MINUTES- qure 3. Chromatograms from tests of plastic garden hose and kck latei-tubes-26 ft X ‘/J. in. i.d.: garden hose (170 ppb,). +$ latex (26 ppb)
:
Figure 4. Chromatograms from tests of polyethylene and poly- propylene tubes-26 ft X 3h in. i.d.: polyethylenq (1 ppb), poly- propylene (4 ppb)
i , : 3.
.
Volume 8. Number 13. December 1974 110; ’ ‘.
. . .
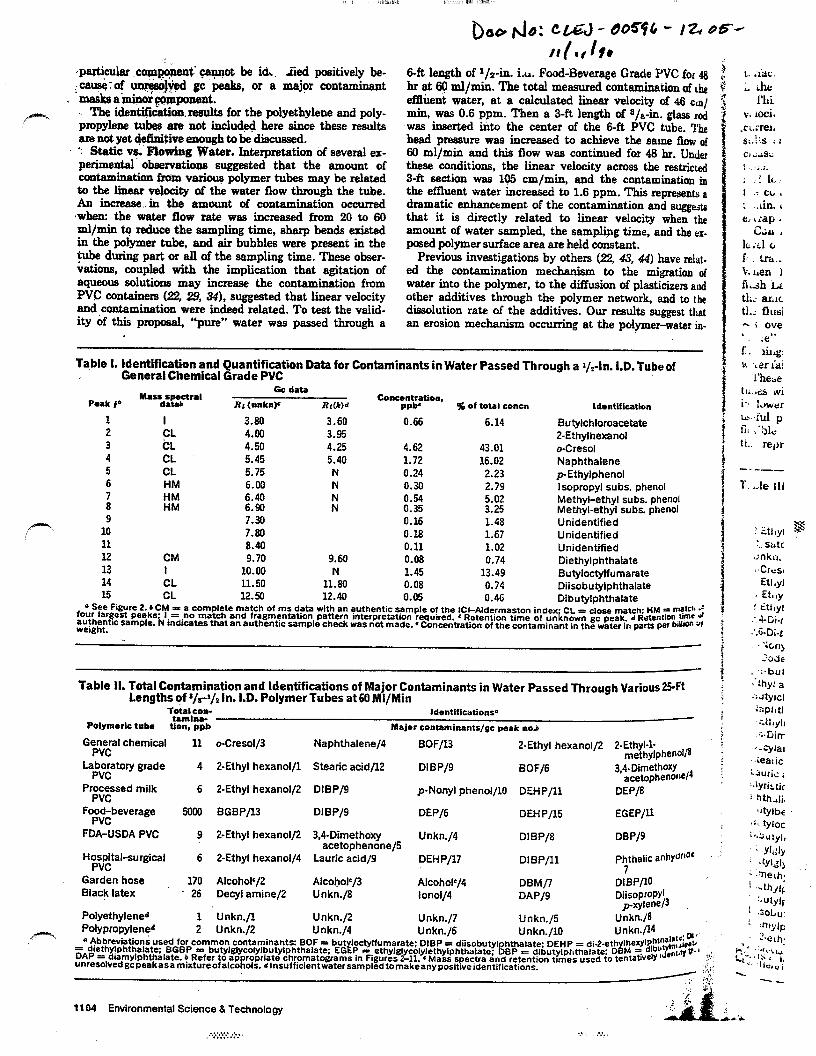
.~parti~cular .com&ie*t’ cannot be id<. Sed positively be-
)I( .f II. cau~; of unx&+l gC ‘&ks, or a major contaminnnt
64% length of 1 /s-in. i.u. Food-Beverage Grade PVC for 48
. ’ masks a-minor Wmponent. hr at 6Q ml/min. The total measured contamination of L&
r""*- The identi&tion.r8sulta for the polyethylene and poly-
eflhent water, at a calculated linear velocity of 46 cln/
&pyleoe tubes are not inclu+d here since these results min, was 0.6 ppm. Then a 34% length of s/&n. glass rod
are not yet d$ir&ive enough to be discussed. was inserted hito the center of the 6-ft PVC tube. The
‘: Static vs. Flowhg Water. Interpretation of several ex-
head pressure was increased to achieve tbe same fkow of
perimental observ8tions suggested that the amount of 60 ml/min and this flow was continued for 48 hr. Under
contamination frqm v8rioq3 polymer tubes may be related these conditions, the linear velocity across the restricted
to the linear velocity of the water flow through the tube. 3-ft section was 105 cm/min, and the contaminatiorr in
An increase..iu the Bmount of contamination occurred the eflluent water increased to 1.6 ppm. This represents s
*when: the water flow rate was incre8sed from 20 to 60 dramatic enhancement of the contamination and suggesti
ml/min to reduce the sampling time, sharp bends existed that it is directly related to linear velocity when the
in the polymer tube, aad air bubbles were present in the amount of water sampled, the samplbg time, and the Ed. posed polymer surface area are held constant.
tube during part or all of the sampling time. These obser- vations, coupled with the implication that agitation of
Previous investigations by others (22, 43, 44) have &t.
8qUeOUs solutions may increase the contamination from ed the contamination mechanism to the migration Al
PVC containers (22, 29, 34). suggested that linear velocity water into the polymer, to the diffusion of plasticizers ad
and contamination were indeed related. To test the vaiid- other additives through the polymer network, and to the
ity of tbis pmposal, “pure” water was passed through a dissolution rate of the additives. Our results suggest that an erosion mechanism occurring at the polymer-water in-
Table 1. Identification 8nd Quantific8tion Data for Contaminants in Water Passed Through a i/1-in. I.D. Tube of General Chemical Grade PVC
M8ud~yraI Gc data
Peak I’ R; (unkn)s R:(kP Concspnbbion, ‘ % of tow concn Idontlfication
1 ! 3.80 3.60 0.56 6.14 2
Butylchloroacetate CL 4.00 3.95
3 tiL 2-Ethyihexanol
4.50 4.25 4.62 43.01 0Cresol 4 CL 5.45 5.40 1.72 16.02 5
Naphthalene CL 6.75 N 0.24 2.23
6 HM p-Ethylphenol
6.00 N 0.30 2.79
i
Isopropyl subs. phenol
!I 6.40 6.90 r:
0.54 5.02 0.35 3.25
Methyl-ethyl subs. phenol
9 Methyl-ethyl subs. phenol
7.30 0.16 1.48 Unidentified 10 7.80 0.18 1.67 Unidentified 11 8.40 0.11 1.02 Unidentified 12 CM 9.70 9.60 0.08 0.74 13 I
Diethylphthalate 10.00 N 1.45 13.49
14 CL 11.50 Butyloctylfumarate
11.80 0.08 0.74 15 CL 12.50
Diisobutylphthalate 12.40 0.05 0.4G Dibutylphthalate
4 Bee Figure 2. b CM = a complete match of ms data with an authentic sample of the ICI-Aldermaston index* CL = close match’ HM y MtC’lJ fOuC largest peaks; I = .no match and fragmentation pattern interpretation required. c Retention time of unknown gc peak. d &tentlOn tlm* ut aufhentlc Sample. N indicates that an authentic sample check was not made. l concentration of the contaminant in the water in parts per billm Y wetaht.
. .
Table il. Total Contamination and Identifications of Major Contaminants in Water Passed Through Various25Ft Lengths qf ‘/s% In. I.D. Polymer Tubes at 60 MI/Min
T~atalalo~- ldontificstionse
Polymeric tube U-r vpb Major contaminants/gc peak nob
Gen;zl chemical 11 o-Cresol/3 Naphthalenef4 BOF/13 2-Ethyl hexanol/2 P-Ethyl-l- methylphe”Olfi
La;bo;tory grade 4 2-Ethyl hexanol/l Stearic acid/l2 DIBP/B BOFj6 3,4-DimethmY acetophenWei4
Pr;rcssed milk 6 2-Ethyl hexanol/2 DIBP/O p-Nonyl phenol/l0 DEHP/ll DEP/8
Fo;$ibeverage 5000 BGBP/l3 DIBP/B DEPj6 DEHP/lC EGEP/ll
FDA-USDA PVC 9 aEthyl hexanolp 3.4.Dimetho’v acetophenone/5
Unkn.l4 DIBP/8 DBP/9
Hospital-surgical PVC
6 ZEthyl hexanol/4 Laurie acid/9 DEHP/U DIBP/ll Pyhalic anWrioc
Garden hose 170 AlcohoP/2 Alco~ol=/3 Alcoholc/4 Black latex
DBM/7 DIBP/lo . 26 Decylamine/2 Unkn./8 lonol/4 DAP/9 DiisoprcPYl
1 Unkn./l p-xylene/3
Polyethylened Unkn.12 Unkn.17 Unkn./8
H-5 Polypropylened
UnknJ5 2 Unkn./2 Unkn.14 Unkn./C Unkn./lO .
Unkn./l4 ,~,, 3,’
= a AbbreViatiOnS used for common contaminants: BOF = but loctylfumarate’ DfBP =
diethylphthalate; BGBP = butylglycolylbutylphthalate~ EGEP = ethyl@ diisobutyl hthalate DEHP = d&2-eth
DAP = diamylphthalate. b Refer to ap unresolvedacpeakasamixtureofalco l-i
ropriate chromato&ams in Figures 2y c~lylethylphthalate- gBP = dibutylphthalate: D M 5 6
IhesY$~~~;~;;i&
-11. CMa~s spectra &d retention times used to tentatlvelY ,&-,~,IYP*~ :!;
01s. dlnsufficientwatersampled tomakeanypositiveidentifications. ;.f : ,
-.--_ 1‘. Je 111
i 3ltyi g$
I. stitc ;.‘nk,l. “CkSI
Et1 IYI ., Etr ,y 1 ithy
443-f .‘.tj.Di-t
‘icq lid,
. -:.bul <‘thy1 a :: Jtyicl :ijplltl ;:iJlyli
.+Girr
,,-Cylar .ieal ic
1.;lurie ;
‘JYriztic
"hth.,li. ‘Jtylbr
*a.. ty1oc '.f;dlY]‘
. .Yl& : .tyl& (’ Jtleth~ ! .-th/l(
wyl~ J .SOLu: ’ :n,y(F
&‘,,a
$., ;;tp& at
. --
1104 Environmental Science 8 Technology ,t A1 ‘A
,..\...i: :. . . . . , . . . . ‘.. ., .*.*.

dsce should be‘included as a p be contamingtion mechanism.
ble sign&ant factor
~bjs relationship between contamination and the linear b&y of the water flowing through the polymer tube is rn&y being more fully investigated. Preliminary re- b show that the contamination of the water will in- @ as the flow rate is increased for a given diameter be. Other factors being constant, larger diameter tubes d lower head pressures are recommended to minimixe c contamination. An additional conclusion is that con- &ation levels, based on static water tests, cannot be vapoiated to flowing water conditions. @hamhdS~n vs. Usage. The possible decrease in the & of contamination after a polymer tube has been used I transporting large quantities of water w+s investigated. hen 1000~liter volumes of “pure” water were used to & Laboratory and Hospital-Surgical Grade PVC tubes, e amount of contamination measured immediately after e flushing action was reduced by a significant factor of 3 over that measured when only 25-l&x volumes of we” water were employed for flushing. Subsequent &ings of the same tubes with as high as 3000 liters of wr tied to decrease SignScantly the contamination. These results show that although initial flushing of PVC bes with a large quantity of water has a salutary effect lowering contamination, extensive washing serves no
sful purpose. The amount of plasticizers in the highly lible PVC tubes is approximately 40% by weight and & represents an almost inexhaustible supply of contam-
h/J, hd ination. Should tE apply eventually become apprecru- bly depleted, the contamination will decrease, hut ttle tubing will also have lost its flexibility and strength a,ld will undoubtedly need to be replaced, thus causing a re- turn to the original high level of contamination.
For the relatively rigid polyethylene and polypropylerle tubes the source of the contamination may not be inrx- haustible, and these tubes may eventually become ntiu- contaminating. Long-range tests of these tubes and vari- ous cleaning procedures are currently in progress.
conclrrsiorls The method described here for testing the contamina-
tion of water by various polymer tubes is sensitive to amounts corresponding to < 1 ppb for most organic maLe- rials. Contamination tests are made, conveniently u&g flow conditions which duplicate or closely approximate the use of the polymer tube to transport water or otl.er aqueous solutions. These tests can be made in most &.a- lytical laboratories and the results used to aid in the SZ- lection of polymer tubes. Since the critical apparatus in the method is a very simple and portable extraction WI- umn, accurate on-site sampling of a production solution is possible by connecting an extraction column parallel u, a production stream until the desired volume is sample-d. The extraction column may then be transported readily to the laboratory where the remainder of the scheme is COJII- pleted at the convenience of the analyst.
The contamination tests reported here were made usirlg
rble Ill. List of Contaminants in Water and Polymer lubes Which Caused This Contamination Tubs abbreviation9
Contaminant
2.Ethylhexanol C, satd. alcohol Unkn. alcohols &esOl o-Ethylphenol PEthylphenol 2.Ethyl-&methylphenol 24-Di-t-butylb-meihylphenol 2&0i+butyl+methyfphenol p-Nonylphenol pdbdecylphenol p+Butylphenol Ethyl acetate Butylchloroacetate Naphthalene 2-Ethylhexanal 3,4-Dimethoxyacetophenone Decylamine Stearic acid Lauric acid Myristic acid Phthalic anhydride Butylbenzoate Butyloctylfumarate , ’ Bibutylmaleate ’ Bthylglycolylethylphthalate Butylglycolylbutylphthalate Bimethylphthalate Biethylphthalate Bibutylphthalate Dibobutylphthalate Damylphthalate D-2-ethylhexylphthalate
GC
X
X X X X
X
X
X X X
PM FB FU
X X X
X
X X X X X
X
X X X
X
X
X X
x x x
x x x x x
GH BL Comment
X Impurity or transformation* Probably octanol
X Not present in PVC Suspected stabilizer
Same Same Same Same Same Same Same
X Same
: . ; :. _ ‘* Volume 8. Number 13. December 1974 II A
Highly toxic Common impurity
Suspected stabilizer X
Transformation of Zn salt Same Same
Impurity or transformation X Known plasticizer
Suspected plasticizer X Same
Same Known plasticizer’
Same X Same
X Same Same
X Same
. . : . ; .>:.:.:.: .> . . . *‘.

&t&d w&r btpuae these contt. &ion resuha are considered to represent minimum vah&s. The presence of
_ &e&g, inorganic acids or bases, end lipoid materials in the water would all result. in either the same or an in-
-x, peased level of contamination. In the preseti& of large amounts of minerals and inorganic acids and bases, the -method has been shown (41) to be accurate for all neutral organics and therefore is not limited to distilled water teats. Whether the procedure is useful for beverage testing where lipoid materials are present has not yet been ascer- tained.
The compltity of the chromatograms for all the tests of polymer tubes reported here suggests that conclusions concerning toxicity based on the tests of single pure com- ponents must be tempered with the knowledge that plas- ticizers and other additives almost always occur as a com- plex mixture.
Several conclusions, based on the results reported here, suggest that risk/benefit ratios associated with the wide- spregd use of many polymers may not be nearly so favor- able’as suggested by sole consideration’ of the reported low level of contamination. First, the contamination profiles represent a very complex mixture of components, many of which are not identified and may be toxic. Second, some of the identified components are obviously toxic. for ex- ample butylchloroacetate. Third, the presence of myristic, stearic, and palmitic acids in wme polymer tests suggests that some toxic metals may also be present. Fourth, con- tamination level predictions based on static water tests of polymers are usually not valid.
When these conclusions are coupled with the observa- tions of other investigators, the case for resssessment of the risk/benefit ratio becomes even more convincing. Au- tian (3) discusses the documented increase in contamina- tion of PVC ‘contain&s when the contacting solution be-
/@-“. comes more lipid; several investigators have established the rapid biomagniflcation of many plasticizers and other additives (9, 15, 37, 39); while little is known about cumu- lative toxicity and the synergistic effect of mixtures (3), some investigators (3, !2, 35) have shown these to be ap- preciable; and finally, recent studies (26, 27) suggest that plasticizers may be readily t&sported as water-soluble complexes with natural humic materials.
Our cults and the summary outlined above suggest that the expressed concern of some scientists (3, 8, 32, 37, 39) is certainly valid. Unfortunately, definition of the true problem and the development of an adequate solution are severely complicated by the continuously changing and expanding list of allowable additives in the manufacture of polymer tubes and containers.
Acknowiedgnaent The authors thank Neil G. Johansen, Perkin Elmer
Corp., for providing high resolution SCOT column separa- tions of two mixtures. The facilities for this research were generously provided by the Ames Laboratory of the USAEC and Iowa State University Energy and Mineral Resources Research Institute, Ames, Iowa 50010.
Literature Cited
(1~7G~~)F. C., Colony, J. A., Erwiron. Health Perspec., 1 (3).
(2) Gmbam, P.R. ibid., (3) Autian, J., ibid.
I ,+J, p 3.
(4) calif Med., 112 (2);43 (1970). (5) B&e, 0. P., Gegesbidge. G. A., Narin, A. N., Shmmva.
T. A., J. Polym. Sci., 33,349 (1971). (6) GUS, W. L.. Haberman, S., J. Biomed. Mater. Res., 2,313
mw. (7) Haberman, S.. Guess, W. L.. Rowan, D. F.,’ Bowman, R a.,
Bower, R. K.. Sot. Piost. Eng. J., 34,62 (1968). (8) Mayer, F. L., Chem. Eng. News, 49 (45). 8 (1971). (9) Mayer, F. L., Stallin& D. L. Johnson, J. L.. “Phthalate &.
t.erS; h Erkxuaamental hataminant,” rep from Fib-Pe&$& Reeearcb Lab., Bur. Sport Fisheries and Wie, U. S. Dept. Interior, Columbia, MO.. 1971.
(10) Meyler, F. I;., Wiiebrand. A. F., Durrer, D., Circ. Res., 8.4 ~1~).
(11) Neerguad, J., Nielsen, B., Faurby,.B., Christensen, D. H., Nielsen, 0. F., Scotad. J. Ural. Nephrol., 5,141(1S71).
(12) Nematollaki. J.. Guess, W. L., Autisn. J., J. Pharm. Sri., 56,1446 (1967).
(13) Sbeffer, C. B., Ckrpenter. C. P.. Smyth, H. F., J. XI& RYg. Toxicol., 27,130 (1945).
(14) Stetson. J. B., Guess, W. L.. Anesthesiof., 33,635 (1970). (15) Marx, J. L.. Science, 178,46 (1972). (16) Shea, K. P., Enuiron.., 13 (8). 2 (1971). (17) h~ashi, S., Asakawa, Y., Isbida. T., Matsuura, T., ‘l’elm.
hedron L&t., 56,5061( 1967). (16) Sugiyama. N., Kashima, C., Yamamoto, M., Sugaya, T..
Mobi, R.. Bull. Chem. Sot. Japan, 39.1573 (1966). (19) Blumer, M.. Contam. Contr., 4.13 (1965). (20) ShibLo, S. I., Blumenthal, H.. Environ. Health Perspec.. I
(3), 131(1673). (2~)$m&l, M.. Tengler. H.. Debut. Lebensm.-Rum&h., 53,
(22) WildbGtt, G., En&on. Health PersFc., l(3), 29 (1973). (~~9~“s, J., Ard, J. S., J. Ass. Offic. Anal. Chem., 50, 616
(24) Cifhk, S. D., Soil Sci., 107.63 (1969). (25) Bauman, A. J., Cameron. R. E.. Kritchevsky, C., Rrmwr.
G.. Lipids, 2.85 (1967). (261 Ogner, G., Schnitzer, M.. Science, 170,317 (1970). (27) Matsuda, K., Schnitzer, M., Bull. Environ. Contam. TW
cot.. 6,200(1671). (28 Guess, W. L., Jacob, J.. Autian. J., Drug Intel., 1, 19
m67). (29) Jaeger, R. J., Rubin, R. J.. Science, 179,460 (1970). (30) Marcel, Y. L., Noel, S. P., Loncet, 5.35 (1970). (31) Rubin, R. J., ibid., 10.965 (1972). (32) Trimble. A. S.. Goldman, B. S., Yao, Y. K., Kovats. L. 6.
Bigelw W. G., Surgery, 59,857 ( 1966). (33) Phillips, H. F.. Berger. I. A., Geochim. Comochim. AU*
15.51(1956). (34) Jaeger, FL J., Rubii. R. J.. Environ. Health Perspec., 1 (3).
(3:; !%& D L Hogan, J. W., Johnson, .I. L., ibid., p 1% (36) Hites, g. A:. i’did., p 17. (37) Cortoran, E. F.. ibid., p 159. (38) Shapashnik, S., Kodner, M. S., Chap&n, V. I., BOAT*
G. M., Tr. Mold. Nauch.-ksled. Inst. Pi&h Prom., No. 10. 1;’ (1970).
(39) Metcslf, R. L., Booth, G. M., !&h&h, C. K., Hansen, D. J- Lu. P.Y, Enuiron. Health Perspec., II (4). 27 (1973).
(40) Pastorelli. L., Chiavari, G., Ann. Chim. (Rome), 51, lil
(4$%k G A Richard J J Grieser M D Witiak D..“.I. thk, J. ‘L.,‘Ar&ello, M.’ D:, iii&, R., ‘Svec, I% J., Frik .I. > * Calder, G. V., J. Chromatogr.. 99,745 (1974).
(42) Helier, S. R., Anal. Chem.. 44,19X(1972). (43) Wildbrett, G.. Evers, K.. Kiermeier, F., Fette, se@% *“*’
strichm., 71,330 (Em). (4-l) Quackenbos, H. M.,Znd. Eng. Chem., 46, (2). 1335 (1951).
Received for reuiew May 13, 1974. Accepted Septembrr 13. I?:’ Work Partially supported by the National Science Foundat’.. ’ @arat No. GP-33526X.
-1 a-k*3
f sp,-
---
. . : de .“” - ,.&n ft.. thti I cl Bizd. c!: rlsw3 --
1106 Environmental Science 8 Technology

by Louise V. Parker and Thomas F. Jenkins
Abstract. A number of samples of polyvinyl chloride (PVC1
well casings used for ground water monitoring that Wed in schedule, diameter or manufacturer were placed in contact with low concentrations of aqueous solutions ofTNT, RDX, HhlX and 2.4-DNT for 80 days. Analysis indicated that there was more loss of TNT and HhfX with the PVC casing than with the glass controls. but that the amount lost was. for the most part, equivalent among different types. A second experfment was performed to determine if these losses were due to sorption or ifbiodegradation was involved. Several different ground water conditions were simu- lated by varying salinity. initial pH and dissolved oxy- gen content The only case where there was an in- creased loss of any substance due to the presence of PVC casing was wfth the TNT solution under non- sterile conditions. The extent of loss was small. how- ever. considering the length of theequilibration period. This increased loss is thought to be associated with increased microbial degradation rather than so Uon. Several samples of PVC casing were also leach l&f with ground water for 80 days. No detectable interferences were found by reverxd-phase high performance liquid chromatography (HPLCI anaiysls. Therefore. it is con- cluded that PVC weIl casingssre’suitable for monltor- ing ground water for the presence of these munitions.
Introduction Polyvinyi chloride IPVC 1 is commonly used to f&xl-
cate casings for ground water monitoring wells be- causq of ifs s*ngt.ja. corrosion resistanrxz weathera- bility. wqight‘apd cost. However. It has not been determined whether this material ts acceptable for many ground uater monitoring applications. Several -hers have found evidence that some contami- nants may sorb to PVC. thereby lowerlng their concen- ~~tlons iLauTen=and Tosine 1976. Miller 1982. Ekr-
m; ad
celonaet al. 19851. Other substances have been shown 0t.
to leach from various types of PVC and these substan- da . ces could interfere with some methods of chemical
analysis (Jaeger and Ruben 1970. 1972: Junk er al. Et 1974: Christensen et al. 1976: Banzer 1977: Fayz er al. 1977: Dressman and McFarren 1978). Specifically. I hc T purpose of this study was to determine if PVC \rrl;
i!
F;ti *, r.i
casing wasacceptable for use in monicoringlowle\ r-I.\ . of the explosives 2.4.6-trinitrotoluene [TNTJ. hr::a. hydra- 1.3.5-trinitro- 1.95~triazine ( REX1 and ocfai 1~. i
” ’ ,i’! 1 -r>
dro- 1.3.5,7-tetranitro 1.3.5.7.tetrazocine (HMXl. and , i’U$$j !U
PA-dinitrotoluene (DNTl.which is found asacontam-’ inant in TNT manufacture.
LP
A number of substances have been found to lexil L \ iI)! &-omvarioustypesofPVC.Theseinclude:vinylchlorid~ 1 :% monomer WCMl. plasticizers (phrhalate esters). :.t~. bilizers. impuritiesand transformationproducrs [Jwi
1.i
ger and Ruben 1970: Junk et al. 1973. Christen%1 I t: rq h:
aL 1976. Banzer 1977. Fayz et al. 1977. Dressman sr)Li ::. hIcFarren 19781. However. for the rigid PVC that I’- :r used for well casing. National Sanitation Founda: i::: :; (NSFlstandardsaresetatamatimumlimit ofrt%c:::.. vinylch.loridemonomerconcentrationof 1Oppm i ‘15’ 1980). Also. the plasticizer content in rigid m’C prop.
! “I
ucts. such a~ pipe. is very low when compared \\‘I[:: ;;;
more flexible products such as tubing (Roff et al. 157. d-1
ASTM 1980. Barcelona et al. I9841. m
The literatureconrains evidence that some organic i;. tko
substances are strongly adsorbed by PVC. Lawrel~cr* A - I r?r
and Tosine (19761 found that PVC chips were qurtc :1(
efllcient at removingpolychlorinated b. >henyls (PC t!> ;; from water and waste sater. PCBs are hydropholl. .iO. organic chemicals with large octanol-water part!’ IQ:. Q coefficients (&,,.I in the 10J range [Veith et al. 1 :i* ’ x I$,W values havebeen fourid to correla,zt\?th part. ..:: ;:I ing of organic chemicals between aqueous soln: i: I:. irr
’ and the or&WC matter in soil and sediments lKar.~-~. hoffet al. i9791. Thesecoefficients might be usef::! :* predicting the partitioning that can occur ber\vc*?- z fl ‘E
aqueous solutions and a PVC surface as well. Valw- .: \ high as those for PCB indicate a very strong tendc:t.- :!
n summ&1086
.~>2,~.W,‘.L . . . . . . . . . .
il ‘:. ::. :! u/ :I .- :
..inirlon into an O~~UUC phac- dLhou@I SUT!LIC~ ..:-‘*m also piay an importanl D in determining
-I:, tirstribution. it is not surprismg. given rhe I&, for 4 !;s. that sianificant sorption on PVC was found.
**lore n~~$tly. Miller t19821 tested three types of l +I casing materials-including schedule 40 WC. . ta;rrhviene. and po&xopyiene-for the sorption of . .dtr:e-organic pollutants. The organics tested in- :.:cleti bromofonn. crichlorofluoromethane. trichloro-
-. ~.~.wx. 1.1.1.trichloroethane. 1.12~trlchloroethane 4:. 1 :-::rachloroethyiene. Concentrations were in the a -; oDb range evcept for trichloroethane where the - z&ntration was 14 ppb. After six weeks they found :;a~ PVC well casing material was superior to the .::ler two materials and did not sorb or leach five of
/ lita six organics tested. Tetrachloroethyiene. on the .tner hand. was substantially lost from solution in
i
xntact with PVC. AMiller ( 19821 attributes this loss to ’ csorption. but does not explain its anomalous behav-
..x compared to the other organic volatiles of similar ~ructure. such as trichloroethylene and trichloro- r!!~ane.Inadesorptionstudywellca~lngswereexposed : the contaminants for four weeks and then to fresh *.*-tter for four weeks. Only a small amount of tetra- .:lloroerhvlene was desorbed. The bulk of the original narerial lost was not recovered. Whether specific ddsorption accounts for the observed loss or some .)ther mechanism does, such as enhanced blodegra- Jation in the presence of PVC or penetration into the xlymer due to the planargeometryof tetxachloroethy- iene. is not clear.
Cun-an and Tomson (19831 tested five types of plastic for adsorption of trace levels (0.5 ppbl of naphthalene and p-dichlorobenzene. The plastics tested were: Teflo%, polyethyiene. polypropylene, :;gon tubing, and glued and non-glued PVC pipe. Twenty liters of solution were pumped through the : xbing at a rate of 30 mL/min-’ (for a contact time of :;pproximately 11 hours). They estimate that they recovered 80 to 100 percent of these organics from all or the plastics, with the exception of Tygon. They also tested the plastics forcontaminantleachingand found that Teflon showed the least amount of leaching. with rigid non-glued PVC a very close second. ‘Qgon agafn
. had t&z poorest performance. They believed the reason that non-glued. rigid PVC exhibited very little leaching
* was because of the low level of plasticizers used in its formulation.
Barcelonaet aI. ( 1985) found asubstantial increase 12,x1 in sorption of low molecular weight. halogenated hydrocarbons (chloroform. trichloroethylene. tri-
‘i chloroethane, teuachlomethylene) by flexible tubings made of PVC. polyethylene and polypropylene when
’ :. ’ 4
‘i
compared with the sorption found by Miller ( 1982) for rigid welI casings made of the same materials. They hypothesized that sorption of these chlorinated sol-
I vents is by absorption into the polymer matrix and . i that the flexible materials wquld present avirtual sink
for the chlorinated solvent %x-bates. Although they : found 80 to 90 percent of the desorption of chloroform ’ occurred almost immediately (wlthln ,the first five
minutes). the amount desorbed represented 3 percent . or less of the total chloroform sorbed. These results are i consistent with surface sorption followed by diffusion
into the polymer matrix. Once diffusion into the matrix 4 : occurs the substance would not be easily desorbed. i Recently, data were obtalned at thlslaboxatory on
! the filtration of waters containing low levels of explo-
1
.
.,‘,.,.,... ;,*.s. . . . . . . . . . .
The l& values for the substances used 1r1 Thor study are lower than any of rhe organlo teslrd ~JY,& : r: Miller (19821. Curran and Tomson 119831. and lz~o rence and Tosine t 19761 and ranged from 75.2 for D:kT to 1.38 for HMX. Based on previous work by t his labor. atory using PVC filter membranes and the 4, \aluc:r of these analytes. significant sorptive losses are not expected. However. absorption or specific binding. I such as that which may have occurred with tetra- chloroethylene. is possible. It isalso possible that sub- ,,.i r;
stances such as the metallic components ofstabiliztrs 6’ . that leach at low levels from PVC may caralqze the decomposition of these munitions.
Materials and Methods Threaded PVC well casing and screen. which w;fs
NSF-approved and met ASTM standards. was used in thisstudy.‘IXvomanufacturerswereselected.Threadtd pipe was selected to circumvent leaching problems r ‘&’
.
associated with solvent bonded joints. Boettner et al. ( 198 1) have documented that leaching of the solvents used to join PVC pipe can be significant.. However. tests performed with aqueous standards of four com- mon bonding solvents Itetrahydrofuran. cyclohexa- none. methylethylketone and methyllsobutylketone) indicated these substances did not interfere with the method of analysis used in this study (Jenkins et al. 19841.After the pieces of casings and screen were cut they were rinsed with well water and dried using a clean paper rowei to remove any shavings that may have been left after cutting.
Solutions used in these experiments were prepsu-ed by dissolving a combination of known amounts of TNT. RDX. HMX and DNT in fresh. local unfiltered ground water taken from a deep aquifer. This ground water was found to be very low in total organic carbon (0.7 mg/L) and showed no detectable interferences with the analytical procedure used in this report. All sample solutions were kept in glass beakers that were covered with glass to prevent evaporative loss. and were maintained in the dark at 10 C-an “average” ground water temperature In the United States.
The first experiment was performed todeterminc if therewasanydifferencein theadsorptivityofdiffercnC kinds of PVC casing or screen. Casings were selected that differed in diameter. schedule (or thickness), and manufacturer. Duplicate samples of 2-inch inside diameter schedule 40 and 80 msing. a-inch diameter schedule 40 slotted well screen (with a filter area of 2.1 in.*/lin. ft), 4-inch diarneterschedule80 casing, manu- factured by one company (Company Al and P-inch diameter schedule 40 casing from a second manufac- turer (Company Bl were tested. Four-inchlongsample sections of the P-inch diameter casing were placed in I.OOOmL glass beakers containing 750mL of sample solution and 4-inch long sample sections of the 4-inch diameter casing were placed in 2,OOOmL beakers con- taining 1.500mL of sample solution. This gave an equivalent surface-area-to-sample volume ratio for all
Summer 1986 93
. . : . . . . . Y

.‘i I ,. ..*.r.c- ..)A,? ..,n. ’ ..-. d . . . . ..‘-
beakers that conramcd test SC .ion but no c:isin$ ,semed as controls. The initial .centrations of the ana&-xes in the test sdiution were 624 pg/L TNT. 1977 &/L RD.X. 305ggi L HSlX and 6 11 erg/L DNT. Sampies
,f--- : were analyzed in duplicate on days 0. 14 and 80.
In the second experiment. &inch long sections of both brands of 2-inch diameter schedule 40 casing were compared with glass controls. which contained no well casing. to determine if any substances were leached into fresh ground water that could interfere with HPLC analyses for the four munitions. Duplicate
_ samples of each type of casing were tested in 1 .OOO mL beakers containing 750 mtof ground water. No muni- tions were added to the ground water. and the pH. dissolved o.qgen content. and salinity of the water were not changed. The soiutions were analyzed on days 0.14 and 80.
The final experiment was designed to test whether biodegradation or the presence of PVC pipe. or both. affected the stability of low concentrations of the four munitions under a \ariety of conditions that simu- lated natural ground water. The variables used 10 simulate different ground water conditions included pH. dissolved oxygen content. and salinity. Therefore, the effect of sterillry, presence of PVC, pH. dissolved ozrygen content. and salinity were tested using a com- plete 25 factorial design. Once again. 4-inch long sec- tions of 2-Inch diameter schedule 40 pipe (Company A) were placed in l.OOOmL glass beakers containing 750 mL of the sample solution. The concentrations of analytes used in this sample solution were very similar to the concentrations used in the first experiment. The initial concentrationswere 637pg/LofTNT. 208 1 pg/L of RDAX. 252 p@L of HMX and 544 pg/L of DNT. Glass control samples contained the same amount of
,- solution without any casing. Since autoclaving was found to destroy HMX and RDX in solution, HgCl, (40 m@L) was added to those portions of the solutions used to study the’effect of sterilitv (USGS 1977). The pH of the sample solution was adjusted to an initial ralueof eithersix or eight with dilute solutions ofHC1 or NaOH. In those samples where the salinity was modified. 175 mg/L MgCL, and 175 mg/L CaCI, were added,To lower the dissolved oxygen content. samples were purged with N2 gas for several minutes and were then placed in a glove box that was flushed several times with N* gas and purged with N, at a low rate for the duration of the experiment. The other [high dis- solved o.xygenl samples were incubated in the presence of air. Samples were analyzed on days 0 and 25. Only a
A..,:, L.AL~L.3Ld1 c..;1.
of the k+r,ge num’ ddi.lljl- rb dJ pcri’Gl-r !lrJ t . . -a.. 3c
-Jr sampies. For all the exp. .ncnts.aqueousconccntrarlcas 3;’
TNK RDX.HMXand D&Twerederermined by reverse d phase HPLC using a Perkin Eimer Series 3 High kr- formance Liquid Chromatognph (HPLCI equipped withaLC-65Tvariablewavelengthdetector. set ;lt 254 nmandan LC-8column (Jenkinset al. 19861.kx&xi- cal stock standards were prepared for TNT. RDS. Hh 1-Y and DNT by dissolving weighed quantities of Standard Analytical Reference Materials [obtained from the U.S. Ann)’ Toxic and Hazardous Materials Agency. Abcr- deen Proving Ground. MD 210101 for each substance inseparate 100mLvolumetric flaskswith HPLC grade methanol. Working standards were prepared by dilu- tion of these stockswith 5050 methanol/water (HP1.C grade methanol and water).
Theanalytical precision ofthis HPLC method is -2 percent forH&L,andRDXand f4perccnt forTNTand DNT in the concentration range studied here (Jenkins et al. 1986). Quantitative recovery of DNT and RD.X and a 5 percent loss of TNT and HZvLK were found when this method was tested in nine different laboratones U3auer et al. 1986).
Dissolved oxygen was determined using the mem- brane electrode method IAPl-L%-AWWA-WPCF 19801 IIn a Markson Selectro Mark Ana#zer with an Orion o2 electrode. The pH and conductiviity were detennincd on an Orion 811 pH meter and a resistivity bridge. respectively. according to standard merhods.
Results and Discussion in the first e-xperiment there was very little loss of
RDXHMXandDNTafter80days forallcasings tested. whereas there was a relatively large loss of TNT (TatIt: I). For TNT the mean concentration of the contrcll sampleswas pg/LI 18percent loss)while the rne:ln concentration for the samples with PVC ranged frcjm 464 PgiL (26 percent loss1 for the a-inch diameter schedule 40 pipe manufactured by B. 10 398 pg.‘L 126 percent) for the same trpe of casing manufactured by k Analysis of variance-indicated that there were SIP- nificant differences among treatments at the 95 ptr- cent confidence level. A least significant difference test indicated that all PVC casings. with the exception of thosewiththeschedule40casingmanufactured by& had significantly lower concentrations than the glabs control. None of the casing samples that were signil‘i- cantly lower than the glass control were significan LI! different from each other. Therefore. lariation XI amount of TNT lost between different rypes of casing
Table 1 Losses of Analytes Due to Exposure to Different Types of Casing and Well Screen
(Concentration in pug/L) TNTM8CUi RDX Mean HMXMWll
ample DNT Mean
Initial Final’ Initial FiIUtl’ Initial Final’ InitiaI Fincl’ Ghss control 624~25 511213 1977x22 2011+15 Company B 2-in. sch 40
305228 346&31 611~29 612~ 13‘ 464f 4 2062~ 5 335 f15 618 = 12
Company A 2-in. sch 40 398 2 27 2004 -c 20 309+ 9 612~12 Company A 2-m. sch 40 412244 2005 + 20 288 213 613 37
weli screen Company A 2-m. sch 80 &IlflO 2003 9 10 348f26 606~ 13 Company A 4-in. sch 80 427 = 20 2026 t 17 257 2 29 600 = 7
‘AfLer 80 da_vs incubation
94 Summer 1986
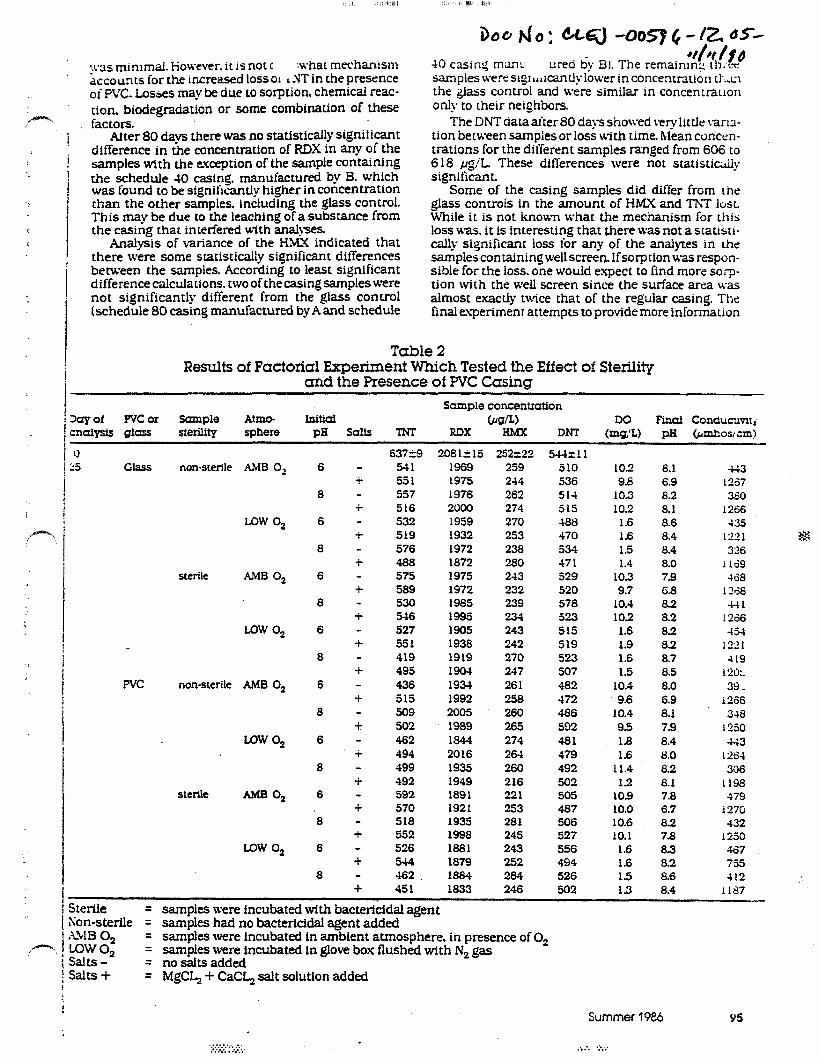
i i
. . i
‘:. j
t c I
I
x33 minlmai. However. it 1s not C :what mechanism &counts for the increased Loss 01 ‘ .UT in the presence of PVC. Los;jes may be due to sorption, chemical reac- tion, biodegradation or some combination of these factors. -
Atter 80 davs there was no statisticall)’ signiticant difference in the concentration of RDX in any of the samples with the evception of the sample containing the schedule 40 cas!ng. manufactured by B. which was found to be significantly higher in concentration than the ocher samples. including the glass control. This may be due LO the leaching of a substance from the casing that inrerfered with analyses.
Anal-ysis of variance of the HMX indicated that there were some statistically significant differences between the samples. According to least significant difference calcularions. two of the casing samples were not significantly different from the glass control (scheduie 80 casing manufactured by A and schedule
samples &err sq~x2ntjy lbwer in concenrrarion U:,ZI the glass control and were similar in concen:raLlon only to their neighbors.
TheDNTdataafter80 daysshowed rrrylittle\arla.- tion between sa.mpies or loss with time. Mean concen- tracions for the diiiercnt samples ranged from 606 co 618 pg/L. These differences were not statistitiy significant.
Some of the casing samples did differ from rhe glass conuob in the amount of HMX and TNT lost. While it is not knoum what the mechanism for this loss was. it is interesting that there was not a statisri- tally significant loss for any of the analyces in rhc samples containingwell screen. Ifsorptionwas respon- sible for the loss. one would expect to find more sorp- tion with the well screen sintz the surface area was almost exacdy twice that of the regular casing. The final esperimenr attempts to provide more information
Table 2 Results of Factorial Experiment Which Tested the Effect of Sterility
and the Presence of PVC Casing Sample concentration
kly of WC or Sample Atmo- Initial RDX bg’L)
DO Final Conciucuvn; :nalysis glass sterility sphere PH salts TNT HMX DNT OWL) pH bmhosicm)
0 5
208lil5 252222 5Hrll GISSS non-sterile tilB 0, 6 1969 259 510
+ 1975 244 536 8 1976 262 51-I
f 2000 274 515 Low 02 6 1959 270 -186
+ 1932 253 470 8 1972 238 534
+ 1872 280 471 sterile A.??B 0, 6 1975 243 529
+ 1972 232 520 8 1985 239 578
+ 1995 234 523 Low 0, 6 1905 243 515
+ . . 1938 242 519 8 1919 270 523
t 1904 247 so7 WC non-sterile AMB 0, 6 1934 261 482
+ 1992 258 472 8 2005 260 466
+ 1989 2.65 592 Low 0, 6 1844 274 481
+ 2016 264 479 8 1935 260 492
-I- 1949 216 502
steriie AMB 02 6 1891 221 505 + 1921 253 487
8 1935 281 506 + 1998 245 527
Low o2 6 1881 243 556 + 1879 252 494
8 1884 284 526 f 1833 246 502
lteriie = ;on-sterile =
samples were Incubated with bactericidal agent
I,ZIB 0, samples had no bactericidal agent added
= tow 0,
samples were Incubated in ambient atmosphere. in presence of 0, =
hits - samples were Incubated in glove box flushed with N2 gas
= no salts added kilts + = MgCL, + CaCL, salt solution added
63729 541 551 557 516 532 519 576 488 575 589 530 546 527 551 419 495 436 515 509 502 462 494 499 492 592 570 518 552 526 544 462 451
10.2 8.1 -!A3 9.8 6.9 1267
10.3 8.2 380 10.2 8.1 1266
1.6 8.6 435 1.6 6.4 1221 5% 1.5 6.4 326 1.4 8.0 1 Ii9
10.3 7.9 -id8 9.7 6.8 1368
10.4 8.2 Ul 10.2 8.2 1266
1.6 8.2 -1.5-t 1.9 8.2 1121 1.6 8.7 -l19 1.5 8.5 121):.
10.4 8.0 39. 9.6 6.9 1266
10.4 8.1 348 9.5 7.9 1250 1.8 8.4 -I-i3 1.6 8.0 126-I
11.4 8.2 306 1.2 8.1 1198
10.9 7.8 479 10.0 6.7 1276 10.6 8.!2 432 10.1 7.8 1230
1.6 8.3 467 1.6 8.2 755 1.5 8.6 412 1.3 8.4 1187
Summer 19U Y5
. . . . . . >>:.;,: :.:.:;.... .i :. ::.
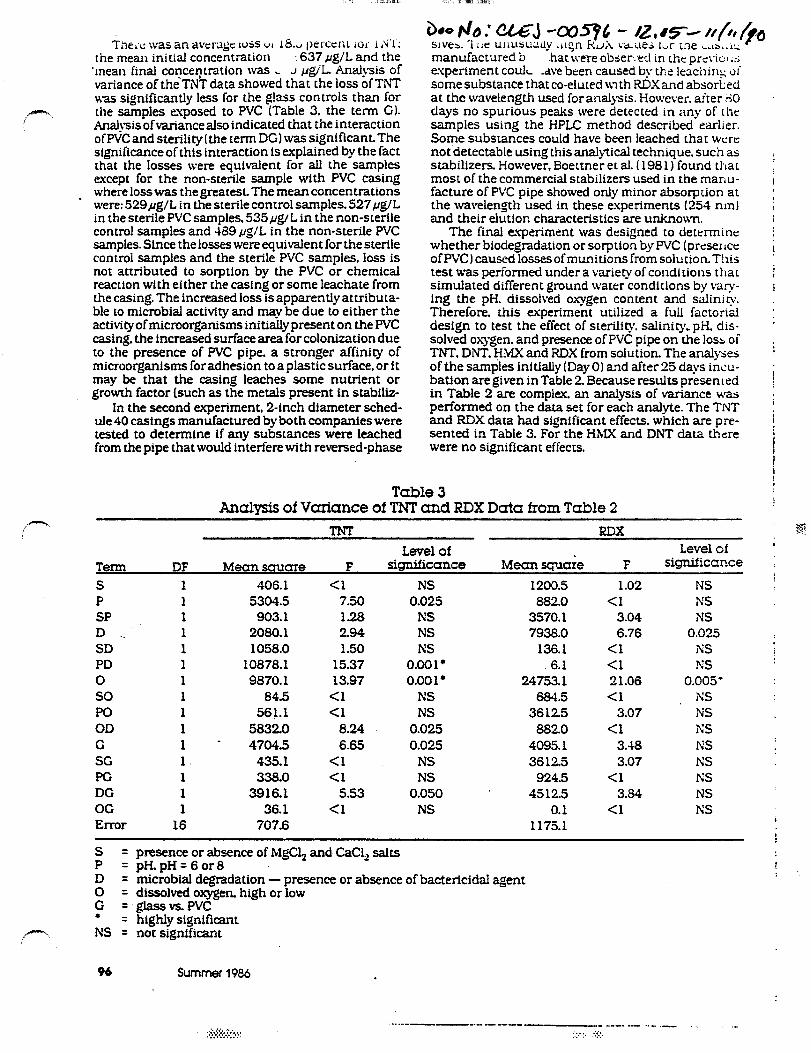
ihe,.c was an av~rqc wss ~4 l&L oercerlt 101‘ 1 ,%.I’: the mean initial concentration : 637 #g/L and the ‘mean final concentration was c 3 @A. Analysis of variance of th$TNi‘ data showed that the loss ofTNT u-as significantly less for the glass controls than for the samples exposed to PVC (Table 3. the term Cl. AtAysisofvariancealsoindicated that the interaction ofPVCand sterilityfthe term DC) wa?significant.The significance of this interaction is explained by the fact that the losses were equivalent for all the samples except for the non-sterile sample with PVC casing where loss was the greatest. The mean concentrations were: 529pg/L in the sterile control samples. 527/lg/L in the sterile PVC samples, 535pg!L in the non-sterile control samples and 489 r~g:L in the non-sterile PVC samples. Since the losses were equivalent for the sterile control samples and the sterile PVC samples, loss is not attributed to sorption by the PVC or chemical reaction with either the casing or some leachate from the casing. The increased loss isapparently attributa- ble to microbial activity and may be due to either the activity of microorganisms iniWy present on the PVC casing. the tncreased surface area for colonization due to the presence of PVC pipe, a stronger affinity of microorganisms for adhesion to a plastic surface, or it may be that the casing leaches some nutrient or growth factor (such as the metals present in stabiliz-
In the second experiment, 2-inch diameter sched- ule 40 casings manufactured by both companies were tested to determine if any substances were leached from the pipe that would interfere with reversed-phase
manufactured b experiment co&
.hat ivere obder:e:l in the previo I A:; .dve been caused by the leaching oi
somesubstance that co-eluted \ilth RDXand absorbed at the wavelength used foranalysis. However, after rj0 days no spurious peaks were detected in any of the samples using the HPLC method described earlier. Some substances could have been leached that were not detectable using this analytical technique. such as stabilizers. However, Boettner et al. (198 1) found that most of the commercial stabilizers used in the manu- facture of PVC pipe showed only minor absorption at the wavelength used in these esperiments (254 nm) and their elution characteristics are unknown.
The final experiment was designed to determine whether biodegradation or sorption by PVC (presence ofPVC)causedlossesofmunitionsfromsolution.This test was periormed under a variet?: of conditions that simulated different ground water conditions by va”;i~v- ing the pH. dissolved oxygen content and saiinig. Therefore, this experiment utilized a full factorial design to test the effect of sterility. saliniv-pH. dis- solved oA.gen. and presence of PVC pipe on the loss oi TNT. DNT. H.m and RDX from solution. The analyses of the samples initially (Day01 and after 25 days incu- bation are given in Table 2. Because results presented in Table 2 are complex. an analysis of variance was performed on the data set for each analyte. The TNT and RDX data had significant effects. which are pre- sented in Table 3. For the HMX and DNT data there were no significant effects.
Table 3 Analysis of Variance of TNT and RDX Data from Table 2
RDX
Term DF Mean sauare Level of Level of
F significance Mean squ&e F significance
S 1 406.1 P 1 5304.5 SP 1 903.1 D ._ 1 2080.1 SD 1 1058.0 PD 1 10878.1 0 1 9870.1 so 1 84.5 PO 1 56l.l OD 1 58320 G 1 . 4704.5 SC 1 435.1 PG 1 338.0 DC 1 3916.1 OG 1 36.1 Error 16 707.6
Cl 7.50 1.28 2.94 1.50
15.37 13.97
Cl <1
8.24 6.65
Cl Cl
5.53 <1
NS 0.025
NS NS NS
0.001+ 0.00 1 l
NS
NS
0.025 0.025
NS NS
0.050 NS
1200.5 882.0
3570.1 7938.0
136.1 6.1
24753.1 684.5
3612.5 882.0
4095.1 3612.5
924.5 45125
0.1 1 i75.1
1.02 NS <I NS
3.04 INS 6.76 0.025
<1 INS <I NS 21.06 0.005’ <I NS
3.07 NS <l EJ
3.&8 NS 3.07 NS
Cl NS 3.84 NS
<l NS
S = P
presence or absence of MgCl, and CaCl, salts = pH,pH=6or8
OD = microbial degradation - presence or absence of bactericidal agent
G = dissolved oxygen, high or low = glassvs.PvC . = highly significant
NS = not significant
96 Summer 1986 .
. em) chat increases the growth ,or rate ofbiodegra- ..iarion. . .
The anal&s of variance (Table 31 also indicated several other significant terms for TNT including pH (the term PI. oxygen content fthe term 01. the interac- lions of pH and sterility (the term PDI. and of the interaction of dissolved oxygen and sterility (the term ODl. However. while these effects are important in considering the long-term stability of an aqueous solution of TNT. they are not important to the discus- sion of the suitability of PVC pipe for monitoring TNT. A more complete discussion of theseeffects isgiven by Parker et al. f 19851.
There was a mean loss of 6.7 percent RDX over the Z-day study. The mean initial concentration was 208 1 I.rg/L and the mean final concentration was 1942 @g/L. Although the loss appears to be slightly less for the glass controls fX =. 1953 /rg/L or 6.1 percent less1 than for the sampleswith PVC casingf1 = 1930&/Lor 7.3 percent loss). this difference is not significant at the 95 percent confidence level (according to a paired t-test and analysis of vat-lance). The analysis of var- iance did indicate that the interaction of sterility and dissolved oxygen content significantly affects the con- centration of RDX Again. however. this effect is not relevant to the discussion of the suitability of PVC pipe.
There was no loss of HUY over the 25day incuba- tion. even under non-sterileconditions. and thus there were no statistically significant differences using either the paired t-test or analysis of variance. The mean initialconcentrationwas 252/lg/Land the mean finalconcentrationwas253~g/LAccordingtoMcCor- mick et al. f 198 Ll the rate of biotransformation of HIMX is slower than that for RDX and TNT, which may explain. in par& why there were not any losses observed. There were some differences between PVC samples and the control in the first experiment, but the expo- sure period was more than three times longer for that experiment,
The loss of DNT from day 0 (2 = 544 pg/Ll to day 25 l
K = 5 I 1 pg/Ll is relatively low-6 1 percent. The loss in the PVC samples was not significantly different from the gkss controls at the 95 percent confidence level using either a paired t-test or analysis of variance,
Summ~ and Conclusion& A long-term study (80 days1 was conducted under
non-sterile conditions to determine if the presence of different types of PVC well casing and screen affected the concentratfor! of low levels of TNT, RDX H&IX and DNT inaqueous soluUon. Results indicated that there isastatisticaIlysign!ficantlossof’I’NTa~d, toaiesser extent. I-fMx in the presence of PVC casing. For the most part. the losses of these munitions were equiva- lent regardless of manufacturer. schedule or diameter of pipe. WeIl screens showed similar trends In a short- term follow-up study (25 days1 to determine whether these losses were due to biodegradauon or sorp!tion. or both. there was a statistically significant loss of TNT but no loss of HMX This loss was not attributed to adaption but seems to be associated with Increased microbial degradauon In the presence of PVC. While this loss was statisticalIy significant the increased ioss relative to glass was only 6 percent after25 days. Since the purging of stagnant water from the well prior to sampling should ensure arelativelyshort con- tact time between the sample and the welI easing. the
. .;.:*:.:*;+.+‘. . . . . . . . . . . .; . . . . . 8.. .:,...;
degree of loss e. Atrd in these experiments &o&i not iimit the use of F’VC for this application.
Long-term leaching studies using local grml;Ci Narer with two different brands of PVC casing iridi- cated that nothing was leached at sufficient conwn- trations to interfere with reversed-phase HPLC and?-
. sis for low levels of TNT. RDX. HMX or DNT in ground water.
Therefore. the authors conclude that the USC fJf
PVC weil casings is acceptable for groundwater moni- toring for low levels of these munitions.
Acknowledgments This project was funded by the Ll.S.AmyToxic and
Hazardous Materials Agency KSATIiKvMl under reimbursable project number 82-D-8. We wish IO thank B.T. Foley for analytical assistance. Dr. J. Sanda and Dr. L. Eng forassistance in formulating the scope of this project Dr.C.L. Grant. M. Stutz and D.C. Legget:. for technical comments on this and the origmal manuscript. The contents of this report are not to be used for advertising or promotional purposes.
References American Public Health Association. American Public
WorksAssociation. Water Pollution Control Fedrra- tion. 1980. Standard Methods for the Examination of Water and Wastewater. 15th edition. American Public Health Association. Washington. D.C.
American Sociev for Testing and Materials. 1580. Annual Book of ASTM Standards. Part 34. Pla~ric Pipe and Building Products. American Sociev of Testing and Materials. Philadelphia
Banzer. J.D. 1977. The Migration of Vinyl Chloride Monomer from PVC Pipe Into Water. Proceedings of the Safety and Health with Plastics National Tech- nical Conference. Denver. Colorado. Society of P:a+ tic Engineering. pp. 30-34.
Barcelona M.J.. J.P. Gibb and RA Miller. 1984.A Guide to the Selection of Materials for Monitoring WeI1 Construction and Groundwater Sampling. U.S. En- vironmental Protection Agency Report Number EPA-600/2-84-024.
Barcelona. MJ.. JA Helfrlch and EA. Carske. 1585. Sampling Tubing Effects on Groundwater Samples. Anal. Chem.. v. 57, pp. 460-464.
Bauer. C.F.. CL Grant and T.F. Jenkins. 1986. Interia- boratory Evaluation of High Performance Llquid Chmmatographic Determination of Nitro-Organics in Munition Planr Wastewaters. Anal. Chem.. v. 58. pp. 176-182
Boettner. EA.. G.L Ball. 2. Hollingsworth and R Aquino. 1981. Organic and Organotin Compounds Leached from PVC and CPVC Piue. U.S. Environ- mental Protection Agency Repoh Number EPA- 600/l-81-062.
Broadman. B.W.. N. Lampner and J. Eng. 1982. Hydro- gen BondingofDinitrotoluene Isomers to Unesteri- fied Hydroxyl Groups in Nitrocellulose. J. Appl. Polymer Sci.. v. 27. pp. 362 l-3623.
Christensen. D, J. Neergaard, B. Nielsen. V. Faurbv and O.F. Nielsen. 1976. The Release of Plasticizers from PVC Tubing. Proceedings, International Con- gress on Pharmacology. v. 6. Pergamon Press. Ox- ford. England.
Cur-ran, C.M. and M.B. Tomson. 1983. Leaching of Trace Organics Into Water from Five Common Plw-
Summer 1986
;::jy :j::<:
97
,.C’. . _-__ C‘ ..Y.C. .A. 3
68-71. Dr.ssman. RC. and E.F. MCFEUT~ :978. Determina- . . tion of viny3 Chloride Migrauon from Polyvinyl
C)-rlor-idePlpe IntoWater.J.Am. Waterworks Assoc.. January. pp. 29-30.
Favz, S.. R Herbert andAM. Martin. 1977.The Release of Plasticizers from Polyvinyl Chloride Haemodialy- sis Tubing. J. Pharm. Pharmac.. v. 29, pp. 497-4 10.
Jaeger, RJ. and RJ. Rubin. 1970. Plasticizers from PlasticDevices: Extraction.MetabolismandAccum- ulation by Biological Systems. Science. V. 176. pp. 460-462.
Jaeger. R.J. and RJ. Rubin. 1972. Migration of a Phthalate Ester Plasticizer from Po@inyl Chloride Blood Bags Into Stored Human Blood and Its Local- iza tion in Human Tissues. New Eng. J. Med.. v. 287. pp. 1114-1118.
Jenkins. T.F.. C.F. Bauer. D.C. Leggett and CL. Grant. 1984. Reverse Phase HPLC Method for Analysis of TNT. RDX. H1M.X and 2,4-DNT in Munitions Waste- waters. USA Cold Regions Research and Engineer- ing Laboratory. Hanover. New Hampshire. CRREL Report 84-29.
Jenkins. T.F.. D.C. Leggett. C.L. Grant and C.F. Bauer. 1986. Reversed-Phase High Performance Liquid Chromatographic DeterminationofNitro-Organics in Munition Wastewater. Anal. Chem. v. 58. pp. 170-175.
Junk. GA. HJ. Svec. RD. Vick and M.J. Avery. 1974.
! Contamination of Water by Synthetic Polymer Tubes. Envlron. Scl. Technol.. v. 8. pp. 1100-l 106.
I Karickhoff. S.W.. D.S. Brown and TA. Scott. 1979.
i Sorption of Hydrophobic Pollutants on Natural Sediments. Water Res.. v. 13. pp. 241-248.
Lawrence, J. and H.M. Tosine. 1976. Adsorption of P Polychlorinated Biphenyls from Aqueous Solutions
and Sewage. Environ. Sci. Technol., v. 10. pp. 381- 383.
Leggett. D.C. (personal communication) U.S. Army Cold Regions Research and Engineering Laboratory, Hanover. New Hampshire.
McCormick. NJ.. J.H. Cornell and AM. Kaplan. 1981. Biodegradation of Htiydro-lB.S-trinitro- l&5- trizjzine. AppL Environ. MicrobioL v. 42, pp. 817- 823.
Miller. G.D. 1982 Uptake and Release of Lead. Chro- mium. and Trace Level Volatile Organics E..posed to Synthetic Well Casings. Proceedings of the Second National Syrnpostum on Aquifer Restoration and Ground Water Monitoring. May26-28,pp. 236-245.
National Sanitation Foundation. 1980. National Sani- tation Foundation Standard No. 14. For Plastic Pip- ing System Components and Related Materials. National Sanitation Foundation. Ann Arbor, Michigan.
Parker. L.V... T.F. Jenkins and B.T. Foley. 1985. Suita- biliry of Polyvinyl Chloride Pipe for Monitoring TNT, RDX HMX and DNT in Groundwater. U.S. Army Cold Regions Research and Engineering Labom- tory. Hanover, New Hampshire. CRREL Special Report 85-12.
Roff. WJ.. JR Scott and J. Pacitti. 1971. Handbook of Common Polymers. Fibres. Films. Plastics and Rub- bers. CRC Press, Chemical Rubber Co, Cleveland, Ohio.
U.S. Geological Survey. 1977. National Handbook of Recommended Methods for Water-Data Acquisi-
98 Summer 1986
QocI’pJd: C&Z!- .a05fG - /Z&W- 4 /~~/~ Survey. U.S. Dp --u-unent ~1 the lnrer:~r. Hr 2L~s.. Virginia
Veith,G.D.. N.M.Austin and R.T. Morris. 1979.A iiaplt.i Method for Estimating Log P for Organic Chemical.>. Water Res.. v. 13. pp. 33-47.
Biographical Sketches Louise V. Parker is a researchphysicalscientist
in theApptiedResearchBranch at theCo1dRegion.s Research and Engineering Laboratory (72 Lyme Rd. Hanover, NH 03755-l 290). She received her B.S. from the University ofNew Hampshire and her M.S. from the University of Massachusetts. Her research interests include environmental microbiology and chemistry.
Thomas F. Jenkins is a research chemist in the lWth Sciences Branch at the Cold Regions Re- search and Engineering Laboratory (72 Lyme Rd. Hanover. MY 03755-l 290). He received his B.S.from the University of Missouri at St Louis and his I&S. at the University of Colorado. His research interest is erwiromental analytical chemisq.