Embed Size (px)
Citation preview
This article was downloaded by: [North Dakota State University]On: 30 October 2014, At: 17:04Publisher: Taylor & FrancisInforma Ltd Registered in England and Wales Registered Number: 1072954 Registered office: MortimerHouse, 37-41 Mortimer Street, London W1T 3JH, UK
Desalination and Water TreatmentPublication details, including instructions for authors and subscription information:http://www.tandfonline.com/loi/tdwt20
Effects of orthophosphate corrosion inhibitor oncopper in blended water quality environmentsErica D. Stone a , Steven J. Duranceau a & James S. Taylor aa Department of Civil, Environmental, and Construction Engineering , University ofCentral Florida , P.O. Box 162450, Orlando , FL , 32816 , USA Phone: +1 407 823-1440Fax: +1 407 823-1440Published online: 03 Aug 2012.
To cite this article: Erica D. Stone , Steven J. Duranceau & James S. Taylor (2009) Effects of orthophosphate corrosioninhibitor on copper in blended water quality environments, Desalination and Water Treatment, 8:1-3, 154-162
To link to this article: http://dx.doi.org/10.5004/dwt.2009.588
PLEASE SCROLL DOWN FOR ARTICLE
Taylor & Francis makes every effort to ensure the accuracy of all the information (the “Content”) containedin the publications on our platform. However, Taylor & Francis, our agents, and our licensors make norepresentations or warranties whatsoever as to the accuracy, completeness, or suitability for any purpose ofthe Content. Any opinions and views expressed in this publication are the opinions and views of the authors,and are not the views of or endorsed by Taylor & Francis. The accuracy of the Content should not be reliedupon and should be independently verified with primary sources of information. Taylor and Francis shallnot be liable for any losses, actions, claims, proceedings, demands, costs, expenses, damages, and otherliabilities whatsoever or howsoever caused arising directly or indirectly in connection with, in relation to orarising out of the use of the Content.
This article may be used for research, teaching, and private study purposes. Any substantial or systematicreproduction, redistribution, reselling, loan, sub-licensing, systematic supply, or distribution in anyform to anyone is expressly forbidden. Terms & Conditions of access and use can be found at http://www.tandfonline.com/page/terms-and-conditions
Effects of orthophosphate corrosion inhibitor on copper in blended waterquality environments
Erica D. Stone, Steven J. Duranceau�, James S. Taylor
Department of Civil, Environmental, and Construction Engineering, University of Central Florida, P.O. Box 162450, Orlando,FL 32816, USATel. þ1 407 823-1440; Fax þ1 407 823-3315; email: [email protected]
Received 17 January 2009; accepted 11 June 2009
A B S T R A C T
This study evaluated the effects of orthophosphate (OP) inhibitor addition on copper corrosion oncoupons exposed to different blends of groundwater (GW), surface water (SW), and desalinatedseawater. The effectiveness of OP inhibitor addition on copper release was analyzed by statisticalcomparison between OP treated and untreated pilot distribution systems (PDSs). Four differentdoses of OP inhibitor, ranging from 0 (control) to 2 mg/L as P, were investigated and non-linear empirical models were developed to predict copper release from the water quality andOP doses. Surface characterization evaluations were conducted using X-ray photoelectron spectro-scopy (XPS) analyses for each copper coupon tested. A theoretical thermodynamic model wasdeveloped and used to validate the controlling solid phases determined by XPS. OP inhibitor addi-tion was found to reduce copper release for the OP dosages evaluated and the water blends eval-uated compared to pH adjustment alone. Empirical models showed increased total phosphorus,silica and pH reduced copper release while increased alkalinity and chloride contributed to copperrelease. Thermodynamic modeling suggested that Cu3(PO4)2�2H2O is the controlling solid thatforms on copper surfaces, regardless of blend, when OP inhibitor is added for corrosion control.
Keywords: Copper release; Orthophosphate corrosion inhibitor; Blended source water;Distribution system water quality
1. Introduction
With increasing water demands and more stringentdrinking water regulations, many utilities are turningto desalinated sources to supplement their surface andgroundwater (GW) supplies. Tampa Bay Water (TBW)and the University of Central Florida (UCF) studied theeffects of blending multiple alternative source waterson distribution system water quality [1]. This studyfurther evaluates the addition of orthophosphate (OP)
corrosion inhibitor to the blended source waters andthe effects on copper corrosion.
Copper levels in drinking water are regulatedthrough the lead and copper rule (LCR) and limitedto an action level of 1.3 mg/L at the 90th percentile ofhousehold kitchen taps sampled by voluntary partici-pant homeowners [2]. The source of copper in drinkingwater comes primarily from corrosion of copperplumbing and is influenced by water quality para-meters like pH, alkalinity, chloride, nitrate, sulfate,sodium, calcium, and magnesium [3]. Addition of OPsis believed to reduce copper release by formingCu3(PO4)2 or a similar scale on the surface of the pipe�Corresponding author
Desalination and Water Treatment 8 (2009) 154–162
www.deswater.com
1944-3994/1944-3986 # 2009 Desalination Publications. All rights reserved.
Dow
nloa
ded
by [
Nor
th D
akot
a St
ate
Uni
vers
ity]
at 1
7:04
30
Oct
ober
201
4
[4,5]. However, the benefits of using OP are thought tobe limited to cases of pH less than 8 [4,6,7] (Schock,Lytle, and Clement, 1995).
Zhang et al. [8] tested the corrosion of copperexposed to tap water with monochloramine disinfec-tant for a period of 30 days. They found at a pH of 8,the copper corrosion increased for 6 days and thenbecame steady for the remaining days. Increasing ionicstrength, dissolved inorganic carbon, and temperaturepromoted corrosion, resulting in thicker oxide films.
Pinto et al. [9] evaluated the addition of phosphatesas well as pH and alkalinity adjustment for corrosioncontrol of copper in low hardness, low alkalinitywaters. Addition of phosphate corrosion inhibitor wasshown to help reduce copper levels. Increasing alkali-nity was found to increase copper release. Phosphateaddition was recommended because it is effective atlow doses.
Indian Hills Water Works in Ohio used elevatedpH to treat high copper levels and zinc OP for treat-ment of lead, but still had copper problems. To treatboth, a study showed an increase in OP inhibitor to adose of 3 mg/L as PO4. This kept both the lead andcopper within the action level and use of the zinc OPwas discontinued [10].
A test of copper loops with stagnation and flowconditions similar to household plumbing systemsshowed phosphate inhibitors to reduce copper concen-trations. Stabilization of the copper surface layer bybuilding insoluble compounds of copper ions and phos-phates was shown to interfere in the reaction kinetics ofthe dissolution of the copper surface layer [11].
Dodrill and Edwards [7] conducted a survey ofabout 360 utilities to examine their strategies in control-ling lead and copper release, in response to the LCR of1991. For copper, the survey showed that at high pH,copper release is reduced with and without inhibitors.At pH less than 7.8, copper release was high at highalkalinity, but inhibitor use mitigated that release.However, at pH greater than 7.8, inhibitors had vari-able and adverse effects on copper corrosion by-product release.
Edwards et al. [12] compared the benefits of OP vspolyphosphate in controlling copper corrosion by-product release in aged copper pipes, at variable pHand alkalinity values. Polyphosphate appeared to per-form less favorably than OP at comparable concentra-tions of 1 mg/L as P. It was believed that OP reducedcopper solubility by forming a cupric phosphate scale.In the absence of any phosphate inhibitors, an inso-luble malachite scale formed over a period of years.Polyphosphate, however, increased copper releasein comparison to OP because it complexed copper,increasing soluble copper release.
When inhibitors are not considered, copper releasecan be controlled best by raising pH [13]. It wasdemonstrated that bicarbonates adversely affectedcopper release, and that a pH increase (7.0–8.0) showedsignificant reduction in copper release. CO2 strippingwas the recommended method for raising the pH with-out raising alkalinity.
This study evaluated the effects of OP inhibitoraddition to blended treated surface, ground, and sea-water sources of varying percentages. The effects ofwater quality were evaluated and a model predictingtotal copper release using water quality and total phos-phorus concentrations was developed. XPS analysis ofcopper coupons was evaluated for solid phase surfacespresent on the coupon, and thermodynamic modelingwas performed to gain insight into inhibitor controlof copper release.
2. Experimental methods
2.1. Experimental design
Experimentation was conducted with the use ofpilot distribution systems (PDSs) built from actualpipelines extracted from TBW member governmentsdistribution systems (Hillsborough County, FL; PascoCounty, FL; Pinellas County, FL; City of New PortRichey, FL; City of St. Petersburg, FL; and City ofTampa, FL). Details regarding the PDS and prior studyresults are reported elsewhere [1]. Each PDS runs inparallel with segments of 20 feet of 6 in PVC, 20 feetof 6 in lined cast iron, 12 feet of 6 in unlined cast iron,and 40 feet of 2 in galvanized steel pipes that wereplaced sequentially to simulate actual distribution sys-tems. Each PDS was fed blends of GW, surface water(SW), and desalinated seawater by reverse osmosis(RO) along with different types and doses of corrosioninhibitor.
The GW unit used raw well water from the CypressCreek well field owned by TBW. The GW was treatedwith aeration, disinfection, and pH stabilization.Aeration was achieved in the GW by pumping theraw water to the top of the finished water tank througha spray nozzle. Sodium hypochlorite was used for pri-mary disinfection and was dosed to provide a 5 mg/Lresidual after a 5 min contact time. Afterwards, ammo-nium chloride was added to produce a 5 mg/L mono-chloramine residual. Ammonia was added in the formof NH4Cl at a 5:1 ratio. The Cl2:NH3 ratio was initially4:1 to protect against DBP formation. This ratio wasincreased to 5:1 in after 6 months of operation to reducefree ammonia.
SW was treated at the TBW Regional Surface WaterTreatment Facility by enhanced coagulation,
E.D. Stone et al. / Desalination and Water Treatment 8 (2009) 154–162 155
Dow
nloa
ded
by [
Nor
th D
akot
a St
ate
Uni
vers
ity]
at 1
7:04
30
Oct
ober
201
4
ozonation, biologically activated carbon (BAC) filtra-tion, aeration, and chloramination. The SW was hauledweekly to the field facility for use and temporarilystored in two 7000 gallon storage tanks before beingtransferred to the SW finished water tank. In the SWfinished tank, the chloramine residual was adjustedto 5 mg/L as Cl2.
The RO pilot plant was housed in a trailer at thetesting facility and utilized raw GW for the feedstream. The RO treatment pilot system required theaddition of TDS, calcium and alkalinity to the ROpermeate to represent the finished water producedby the TBW Regional Desalination Facility. RO pre-treatment consisted of 2.7 mg/L antiscalant addition(Hypersperse MDC700TM, GE Water, Minnetonka,Minn.) followed by 5-mm cartridge filtration. The ROmembrane unit was operated at 72–73% recovery, pro-ducing 9.3 gpm permeate flow, which was aerated by a10-in. diameter aeration tower filled with tripack plas-tic packing. After aeration, 50 mg/L of sea salt wasadded to the aerated permeate stream to simulate theTBW desalination process. Calcium chloride andsodium bicarbonate were also added to meet the cal-cium and alkalinity specifications. The finished wasstabilized with sodium hydroxide to 0.1–0.3 pH unitsabove pHs.
The effects of water quality were evaluated by vary-ing the blend quarterly, while seasonal effects wereevaluated by maintaining the same blend in the sum-mer and winter. The quarterly phases and percentagesof the blends and the average water quality are shownbelow in Table 1. The effects of season are seen in thetemperature as well as rainy and dry season effectson the SW between Phases I and III. The blends witha high percentage of GW in Phases I and III are charac-terized by high alkalinity and pH. Phase II had thehighest percentage of SW and is characterized by highsulfate concentrations. Phase IV has average water
quality parameters due to the equal percentage ofGW and SW.
The feed rate of the blend into each PDS was main-tained to achieve a 2-day hydraulic residence time(HRT). Pumps maintained the blend flow as well as theinhibitor addition into each PDS. The PDSs each werefed different inhibitor types and doses. The inhibitorswere dosed to the PDSs at three different levels, cate-gorized as low dose, medium dose, and high dose.OP was maintained at a target dose of 0.5 mg/L as P forthe low dose, 1.0 mg/L as P for the medium dose and2.0 mg/L as P for the high dose. Control PDSs were notfed any chemical inhibitor; one was maintained at pHs
and a second was treated with elevated pH, main-tained at pHsþ0.3. The PDS at pHsþ0.3 was maintainedat a positive LSI to assess the affect of elevated pHtreatment as a means of copper release control.
2.2. OP Inhibitor
The OP inhibitor used in this study is Inhibit-AllWSF-36 (SPER Chemical Corporation, Clearwater,FL). It is made of monosodium OP blended into 17M� purified water at a concentration of 36%. It is aclear, slightly viscous liquid with a bulk density of11.25 lbs/gal. The specific gravity is 1.35 the pH of1% solution is 5.1–5.4.
2.3. Data collection
Portions of the flow from each PDS were fed to acorrosion loop consisting of 30 feet of 5/8 in. coppertubing with one lead/tin coupon to represent solder.Each loop holds approximately 1.8 L of water. The cop-per tubes were flushed every morning with 2 gallons ofthe PDS water. Weekly samples were collected after a6-h stagnation period in order to simulate tap monitor-ing as described in the LCR.
Table 1Blend percentages and average water quality for each phase
Phase I II III IV
Quarter February–May 2006 May–August 2006 August–November 2006 November 2006–February 2007
% GW 62 27 62 40% SW 27 62 27 40% RO 11 11 11 20pH 8.0 7.9 8.0 7.9Alkalinity (mg/L CaCO3) 161 104 150 123Chloride (mg/L) 45 67 68 59Sulfate (mg/L) 62 103 66 76Temperature (�C) 21 26 26 21
156 E.D. Stone et al. / Desalination and Water Treatment 8 (2009) 154–162
Dow
nloa
ded
by [
Nor
th D
akot
a St
ate
Uni
vers
ity]
at 1
7:04
30
Oct
ober
201
4
Copper coupons were placed in cradles thatreceived flow in parallel with each PDS. The couponswere evaluated for surface characteristics after incuba-tion during each phase. X-ray photoelectron spectro-scopy (XPS) analysis was then performed on eachtype of coupon to identify chemical components on theouter layer of the corrosion surface. A survey scanreveals the presence of elements, whereas a high reso-lution scan of those elements found on the outer layershows the chemical states, providing detailed surfacecharacterization information.
3. Results and discussion
3.1. Dose maintenance
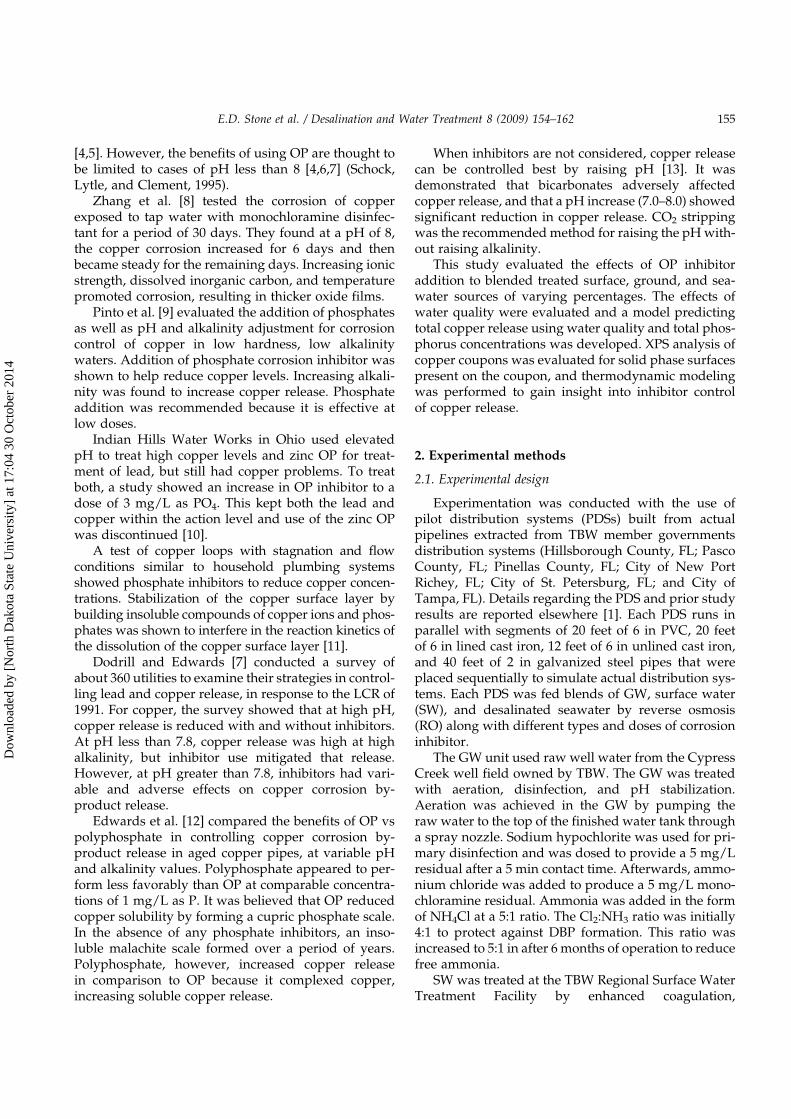
Three of the PDSs were treated with OP corrosioninhibitor at a low, medium, and high dose. These doseswere targeted to maintain at 0.5 mg/L as P, 1.0 mg/Las P, and 2.0 mg/L as P, respectively. The averageOP inhibitor dose for the course of the study in eachPDS is shown in Fig. 1. Error bars represent the mini-mum and maximum observations. The low dose ofOP averaged 0.51 mg/L as P, the medium dose aver-aged 0.94 mg/L as P, and the high dose averaged1.83 mg/L as P.
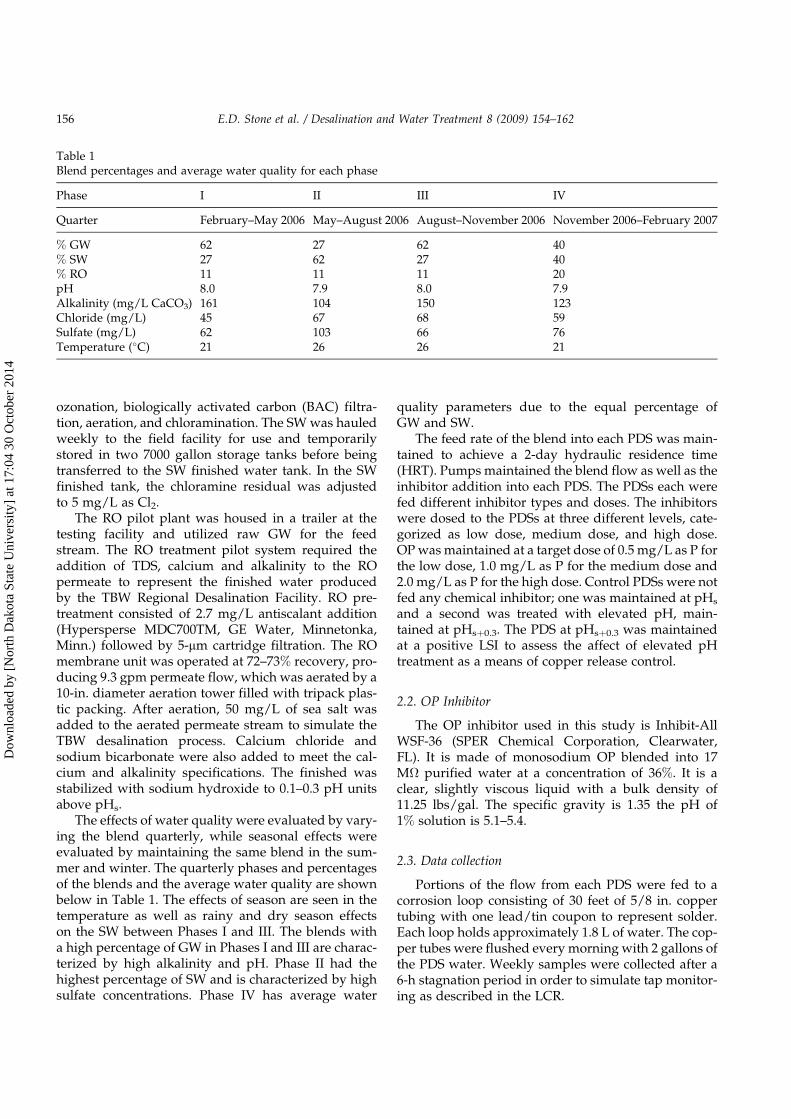
The OP inhibitor is added as phosphoric acid, so ithas an effect of lowering the pH is those PDSs treatedwith inhibitor. The pH maintained in each of these PDSis shown in Fig. 2 with the error bars representing theminimum and maximum observations. The differencein pH maintained in each of the PDSs is significantlydifferent with the exception of the low OP dosed PDSbeing the same as the elevated pH PDS at pHsþ0.3.
3.2. Empirical modeling
An empirical model for predicting total copperrelease was developed using the water quality data col-lected from the PDSs with OP inhibitor addition as well
as the pH control PDSs. The range of the data used indevelopment of this model is presented in Table 2. Theinclusion of water quality parameters was based onANOVA procedures for parameters that were statisti-cally significant. Non-linear least squares regressionwas performed and independent parameters not sig-nificant at a 95% confidence level were eliminated. Theresulting model is presented in Eq. (1). All parametersshown in the model retained p-values less than 0.05.
Total Cu ¼ 1:446� TP�0:280 � SiO�0:2812 � pH�4:591
� Alk1:459 � Cl0:408ð1Þ
where Total Cu is the total copper, mg/L; TP is the totalphosphorus, mg/L as P; SiO2 is the silica, mg/L asSiO2; pH is the �log[Hþ]; Alk is the alkalinity, mg/Las CaCO3; and Cl is the chloride, mg/L.
This model suggests the addition of the OP inhibi-tor, as measured by the total phosphorus concentra-tion, mitigates copper release. This is shown by thenegative exponent on the total phosphorus term. Simi-larly, higher silica and pH reduce copper levels in thecorrosion loops. The pH term suggests the elevatedpH treatment to pHsþ0.3 is a valuable treatment. How-ever, increased alkalinity and chloride contribute tocopper release.
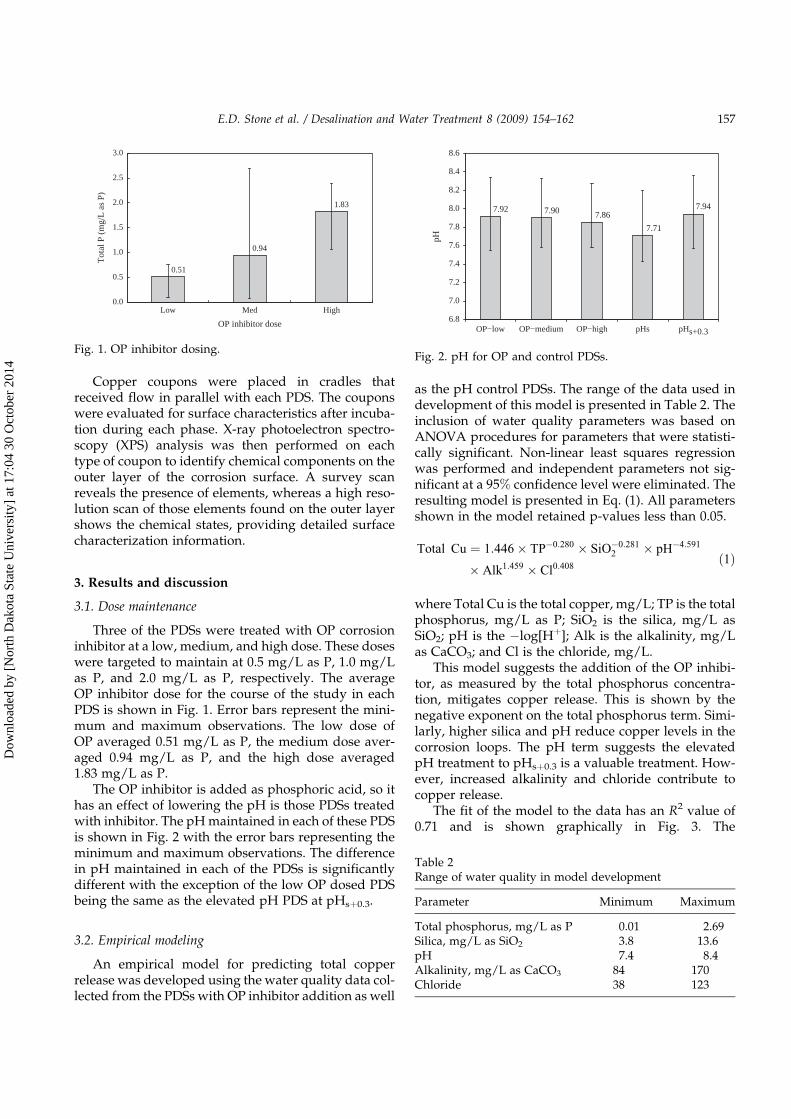
The fit of the model to the data has an R2 value of0.71 and is shown graphically in Fig. 3. The
1.83
0.94
0.51
0.0
0.5
1.0
1.5
2.0
2.5
3.0
Low Med High
OP inhibitor dose
Tot
al P
(m
g/L
as
P)
Fig. 1. OP inhibitor dosing.
7.94
7.71
7.867.907.92
6.8
7.0
7.2
7.4
7.6
7.8
8.0
8.2
8.4
8.6
OP−low OP−medium OP−high pHs pHs+0.3
pH
Fig. 2. pH for OP and control PDSs.
Table 2Range of water quality in model development
Parameter Minimum Maximum
Total phosphorus, mg/L as P 0.01 2.69Silica, mg/L as SiO2 3.8 13.6pH 7.4 8.4Alkalinity, mg/L as CaCO3 84 170Chloride 38 123
E.D. Stone et al. / Desalination and Water Treatment 8 (2009) 154–162 157
Dow
nloa
ded
by [
Nor
th D
akot
a St
ate
Uni
vers
ity]
at 1
7:04
30
Oct
ober
201
4
performance of each corrosion control treatment canalso be seen in Fig. 3. The highest dose of OP inhibitorhas the lowest copper concentration followed by themedium and low doses, respectively. The elevatedpH treatment at pHsþ0.3 is next followed by no treat-ment at pHs with the highest observed copper release.This agrees with the pH effect discussed previously.
For the data, but for the pHs PDS, the model under-predicts the copper concentration in some cases. Withrespect to the action level of 1.3 mg/L of total copper,the model describes the data below the action level bet-ter than above the action level. If exceeded, then themodel under-predicts very high concentrations. There-fore, the model is useful as a predictor of copper releasewith OP inhibitor addition. All of the PDSs operatingwith OP inhibitor addition are maintained below theaction level.
Fig. 3 shows the model predictions of the totalcopper release for each PDS by phase. The barsrepresent the 90th percentile total copper concentra-tions observed or predicted for comparison to theaction level of 1.3 mg/L for the 90th percentile ofsamples. The trend of decreasing concentration withincreasing inhibitor dose is well defined by themodel. It is also shown that actual and predictedtotal copper concentration for all PDSs receiving theOP inhibitor were maintained below the action levelof 1.3 mg/L.
3.3. OP inhibitor performance
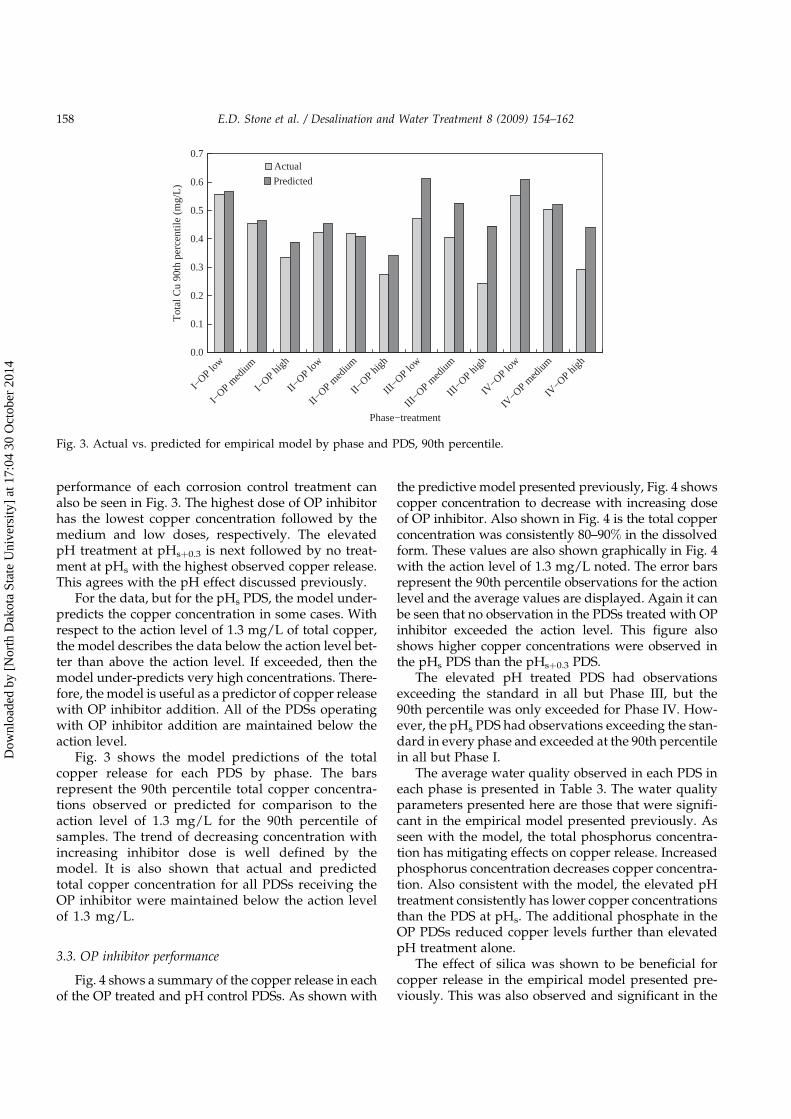
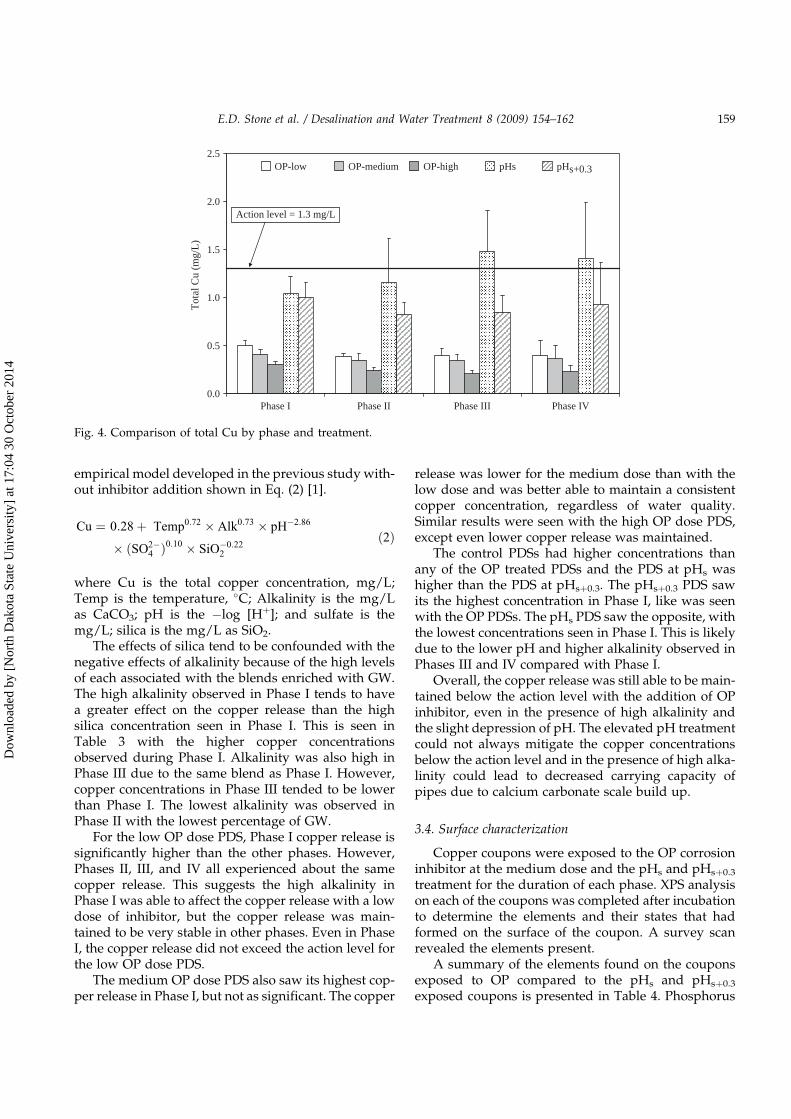
Fig. 4 shows a summary of the copper release in eachof the OP treated and pH control PDSs. As shown with
the predictive model presented previously, Fig. 4 showscopper concentration to decrease with increasing doseof OP inhibitor. Also shown in Fig. 4 is the total copperconcentration was consistently 80–90% in the dissolvedform. These values are also shown graphically in Fig. 4with the action level of 1.3 mg/L noted. The error barsrepresent the 90th percentile observations for the actionlevel and the average values are displayed. Again it canbe seen that no observation in the PDSs treated with OPinhibitor exceeded the action level. This figure alsoshows higher copper concentrations were observed inthe pHs PDS than the pHsþ0.3 PDS.
The elevated pH treated PDS had observationsexceeding the standard in all but Phase III, but the90th percentile was only exceeded for Phase IV. How-ever, the pHs PDS had observations exceeding the stan-dard in every phase and exceeded at the 90th percentilein all but Phase I.
The average water quality observed in each PDS ineach phase is presented in Table 3. The water qualityparameters presented here are those that were signifi-cant in the empirical model presented previously. Asseen with the model, the total phosphorus concentra-tion has mitigating effects on copper release. Increasedphosphorus concentration decreases copper concentra-tion. Also consistent with the model, the elevated pHtreatment consistently has lower copper concentrationsthan the PDS at pHs. The additional phosphate in theOP PDSs reduced copper levels further than elevatedpH treatment alone.
The effect of silica was shown to be beneficial forcopper release in the empirical model presented pre-viously. This was also observed and significant in the
0.0
0.1
0.2
0.3
0.4
0.5
0.6
0.7
I−OP lo
w
I−OP m
edium
I−OP hi
gh
II−OP lo
w
II−OP m
edium
II−OP hi
gh
III−OP lo
w
III−OP m
edium
III−OP hi
gh
IV−OP lo
w
IV−OP m
edium
IV−OP hi
gh
Phase−treatment
Tot
al C
u 90
th p
erce
ntile
(m
g/L
)Actual
Predicted
Fig. 3. Actual vs. predicted for empirical model by phase and PDS, 90th percentile.
158 E.D. Stone et al. / Desalination and Water Treatment 8 (2009) 154–162
Dow
nloa
ded
by [
Nor
th D
akot
a St
ate
Uni
vers
ity]
at 1
7:04
30
Oct
ober
201
4
empirical model developed in the previous study with-out inhibitor addition shown in Eq. (2) [1].
Cu ¼ 0:28þ Temp0:72 � Alk0:73 � pH�2:86
� ðSO2�4 Þ
0:10 � SiO�0:222
ð2Þ
where Cu is the total copper concentration, mg/L;Temp is the temperature, �C; Alkalinity is the mg/Las CaCO3; pH is the �log [Hþ]; and sulfate is themg/L; silica is the mg/L as SiO2.
The effects of silica tend to be confounded with thenegative effects of alkalinity because of the high levelsof each associated with the blends enriched with GW.The high alkalinity observed in Phase I tends to havea greater effect on the copper release than the highsilica concentration seen in Phase I. This is seen inTable 3 with the higher copper concentrationsobserved during Phase I. Alkalinity was also high inPhase III due to the same blend as Phase I. However,copper concentrations in Phase III tended to be lowerthan Phase I. The lowest alkalinity was observed inPhase II with the lowest percentage of GW.
For the low OP dose PDS, Phase I copper release issignificantly higher than the other phases. However,Phases II, III, and IV all experienced about the samecopper release. This suggests the high alkalinity inPhase I was able to affect the copper release with a lowdose of inhibitor, but the copper release was main-tained to be very stable in other phases. Even in PhaseI, the copper release did not exceed the action level forthe low OP dose PDS.
The medium OP dose PDS also saw its highest cop-per release in Phase I, but not as significant. The copper
release was lower for the medium dose than with thelow dose and was better able to maintain a consistentcopper concentration, regardless of water quality.Similar results were seen with the high OP dose PDS,except even lower copper release was maintained.
The control PDSs had higher concentrations thanany of the OP treated PDSs and the PDS at pHs washigher than the PDS at pHsþ0.3. The pHsþ0.3 PDS sawits the highest concentration in Phase I, like was seenwith the OP PDSs. The pHs PDS saw the opposite, withthe lowest concentrations seen in Phase I. This is likelydue to the lower pH and higher alkalinity observed inPhases III and IV compared with Phase I.
Overall, the copper release was still able to be main-tained below the action level with the addition of OPinhibitor, even in the presence of high alkalinity andthe slight depression of pH. The elevated pH treatmentcould not always mitigate the copper concentrationsbelow the action level and in the presence of high alka-linity could lead to decreased carrying capacity ofpipes due to calcium carbonate scale build up.
3.4. Surface characterization
Copper coupons were exposed to the OP corrosioninhibitor at the medium dose and the pHs and pHsþ0.3
treatment for the duration of each phase. XPS analysison each of the coupons was completed after incubationto determine the elements and their states that hadformed on the surface of the coupon. A survey scanrevealed the elements present.
A summary of the elements found on the couponsexposed to OP compared to the pHs and pHsþ0.3
exposed coupons is presented in Table 4. Phosphorus
0.0
0.5
1.0
1.5
2.0
2.5
Phase I Phase II Phase III Phase IV
Tota
l Cu
(mg/
L)
OP-low OP-medium OP-high pHs pHs+0.3
Action level = 1.3 mg/L
Fig. 4. Comparison of total Cu by phase and treatment.
E.D. Stone et al. / Desalination and Water Treatment 8 (2009) 154–162 159
Dow
nloa
ded
by [
Nor
th D
akot
a St
ate
Uni
vers
ity]
at 1
7:04
30
Oct
ober
201
4
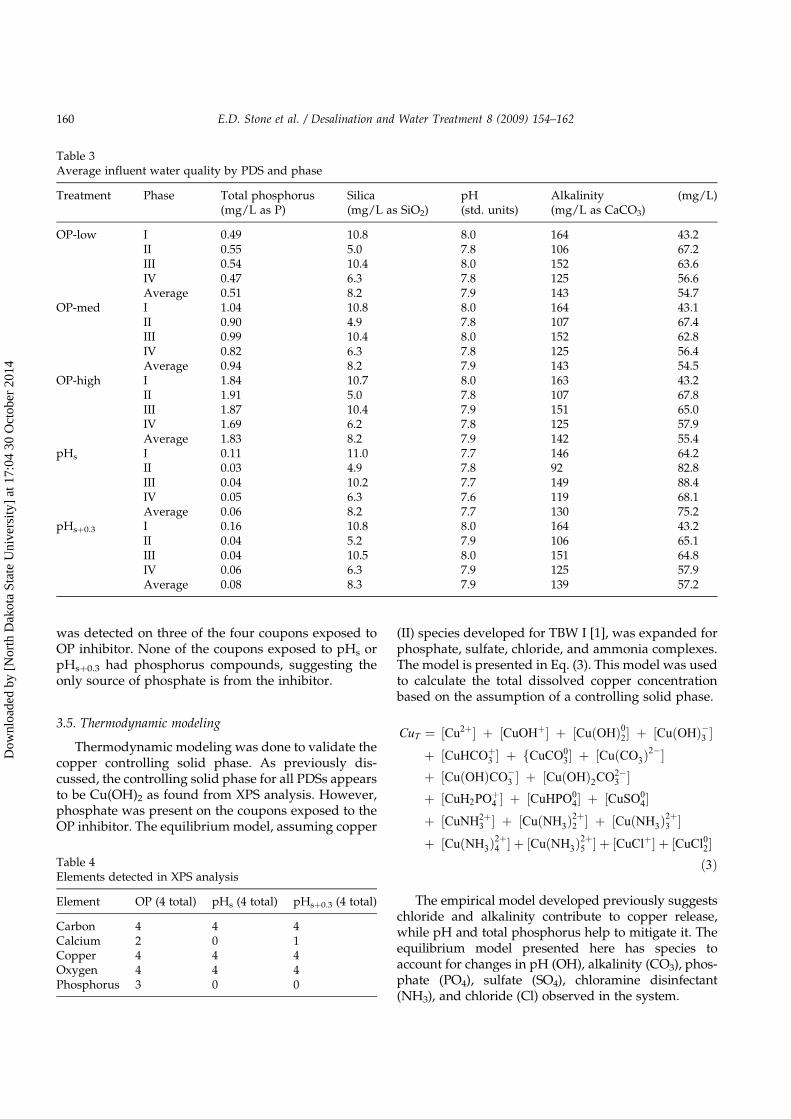
was detected on three of the four coupons exposed toOP inhibitor. None of the coupons exposed to pHs orpHsþ0.3 had phosphorus compounds, suggesting theonly source of phosphate is from the inhibitor.
3.5. Thermodynamic modeling
Thermodynamic modeling was done to validate thecopper controlling solid phase. As previously dis-cussed, the controlling solid phase for all PDSs appearsto be Cu(OH)2 as found from XPS analysis. However,phosphate was present on the coupons exposed to theOP inhibitor. The equilibrium model, assuming copper
(II) species developed for TBW I [1], was expanded forphosphate, sulfate, chloride, and ammonia complexes.The model is presented in Eq. (3). This model was usedto calculate the total dissolved copper concentrationbased on the assumption of a controlling solid phase.
CuT ¼ ½Cu2þ� þ ½CuOHþ� þ ½CuðOHÞ02� þ ½CuðOHÞ�3 �þ ½CuHCOþ3 � þ fCuCO0
3� þ ½CuðCO3Þ2��
þ ½CuðOHÞCO�3 � þ ½CuðOHÞ2CO2�
3 �þ ½CuH2POþ4 � þ ½CuHPO0
4� þ ½CuSO04�
þ ½CuNH2þ3 � þ ½CuðNH3Þ
2þ2 � þ ½CuðNH3Þ
2þ3 �
þ ½CuðNH3Þ2þ4 � þ ½CuðNH3Þ
2þ5 � þ ½CuClþ� þ ½CuCl0
2�ð3Þ
The empirical model developed previously suggestschloride and alkalinity contribute to copper release,while pH and total phosphorus help to mitigate it. Theequilibrium model presented here has species toaccount for changes in pH (OH), alkalinity (CO3), phos-phate (PO4), sulfate (SO4), chloramine disinfectant(NH3), and chloride (Cl) observed in the system.
Table 3Average influent water quality by PDS and phase
Treatment Phase Total phosphorus(mg/L as P)
Silica(mg/L as SiO2)
pH(std. units)
Alkalinity(mg/L as CaCO3)
(mg/L)
OP-low I 0.49 10.8 8.0 164 43.2II 0.55 5.0 7.8 106 67.2III 0.54 10.4 8.0 152 63.6IV 0.47 6.3 7.8 125 56.6Average 0.51 8.2 7.9 143 54.7
OP-med I 1.04 10.8 8.0 164 43.1II 0.90 4.9 7.8 107 67.4III 0.99 10.4 8.0 152 62.8IV 0.82 6.3 7.8 125 56.4Average 0.94 8.2 7.9 143 54.5
OP-high I 1.84 10.7 8.0 163 43.2II 1.91 5.0 7.8 107 67.8III 1.87 10.4 7.9 151 65.0IV 1.69 6.2 7.8 125 57.9Average 1.83 8.2 7.9 142 55.4
pHs I 0.11 11.0 7.7 146 64.2II 0.03 4.9 7.8 92 82.8III 0.04 10.2 7.7 149 88.4IV 0.05 6.3 7.6 119 68.1Average 0.06 8.2 7.7 130 75.2
pHsþ0.3 I 0.16 10.8 8.0 164 43.2II 0.04 5.2 7.9 106 65.1III 0.04 10.5 8.0 151 64.8IV 0.06 6.3 7.9 125 57.9Average 0.08 8.3 7.9 139 57.2
Table 4Elements detected in XPS analysis
Element OP (4 total) pHs (4 total) pHsþ0.3 (4 total)
Carbon 4 4 4Calcium 2 0 1Copper 4 4 4Oxygen 4 4 4Phosphorus 3 0 0
160 E.D. Stone et al. / Desalination and Water Treatment 8 (2009) 154–162
Dow
nloa
ded
by [
Nor
th D
akot
a St
ate
Uni
vers
ity]
at 1
7:04
30
Oct
ober
201
4
Cu(OH)2 has been identified as a metastable inter-mediate that forms in young copper pipe, and has beenused as the basis for thermodynamic models of copper[5,14]. Cupric hydroxide can age to its dehydratedform, tenorite, CuO, which is less soluble. In the pre-sence of alkalinity, old copper pipe tends to form themore stable, less soluble cupric hydroxycarbonateCu2(OH)2CO3, malachite (5).
For the OP inhibitor PDSs, equilibrium calculationsconsidered cupric hydroxide (Cu(OH)2), tenorite(CuO), cupric phosphate dihydride (Cu3(PO4)2�2H2O),and cupric phosphate (Cu3(PO4)2) as the controllingsolid phase and are presented in Table 5. These com-pounds are considered because cupric hydroxide andtenorite were the most predominant scales found onthe coupon. Additionally, thermodynamic data wasavailable for cupric phosphate dryhydride and cupricphosphate to account for the addition of OP inhibitorcorresponding to the reduction in copper release com-pared with the pH control PDSs.
It can be seen that cupric hydroxide and cupricphosphate dihydride over-predict the dissolved cop-per concentration observed in the PDSs. If the equili-brium constant for cupric hydroxide were elevated tomatch the observed copper release in the pHsþ0.3 PDS,then the cupric phosphate dihydride model wouldexplain the decrease in copper release with OP inhibi-tor addition. This trend of decreasing copper withincreasing OP dose can be seen in Table 5.
Cu3(PO4)2�2H2O models provided the best predictionof copper release, over predicting by no more than about0.3 mg/L Cu. The CuO model consistently under-predicted copper release by about 0.25 mg/L Cu. In
contrast, the values predicted by a cupric phosphate dihy-dride, Cu3(PO4)2�2H2O would be a closer match to thedata. A review of the literature confirmed the lack of infor-mation identifying the form of copper OP solids in waterdistribution systems. However, the forms Cu3(PO4)2�2H2O and Cu3(PO4)2, were modeled since thermody-namic data was available for these copper forms [5].
3.6. Copper coupons
Copper coupons were left to incubate for 14 monthsafter removal from the PDSs in 100 mL of distributionsystem water. These coupons were from Phase III ofoperations and shown in Fig. 5. As seen in the picture,a blue-green scale formed on the copper exposed to themedium and high dose OP inhibitor, but not on thepHsþ0.3 control PDS coupon. The pHs coupon similarly
Table 5Thermodynamic modeling calculations for OP PDSs
Phase OP dose Actual copper release (mg/L) Modeled copper release (mg/L)
Diss Cu Total Cu Cu(OH)2 CuO Cu3(PO4)2�2H2O Cu3(PO4)2
I Low 0.46 0.50 0.51 0.07 0.90 3.96Medium 0.38 0.41 0.54 0.08 0.53 2.34High 0.26 0.30 0.58 0.09 0.35 1.54
II Low 0.33 0.39 1.07 0.06 0.62 2.65Medium 0.28 0.35 1.15 0.06 0.47 1.99High 0.21 0.24 1.40 0.07 0.27 1.16
III Low 0.36 0.40 1.05 0.06 1.03 4.42Medium 0.29 0.35 1.07 0.06 0.68 2.93High 0.19 0.21 1.23 0.07 0.44 1.87
IV Low 0.34 0.40 0.59 0.08 0.64 2.78Medium 0.32 0.36 0.61 0.09 0.43 1.86High 0.21 0.23 0.68 0.10 0.26 1.14
Average Low 0.38 0.42 0.74 0.07 0.80 3.48Medium 0.32 0.37 0.78 0.07 0.53 2.30High 0.21 0.25 0.88 0.08 0.33 1.43
Fig. 5. Scale on coupons incubating for 14 months.
E.D. Stone et al. / Desalination and Water Treatment 8 (2009) 154–162 161
Dow
nloa
ded
by [
Nor
th D
akot
a St
ate
Uni
vers
ity]
at 1
7:04
30
Oct
ober
201
4
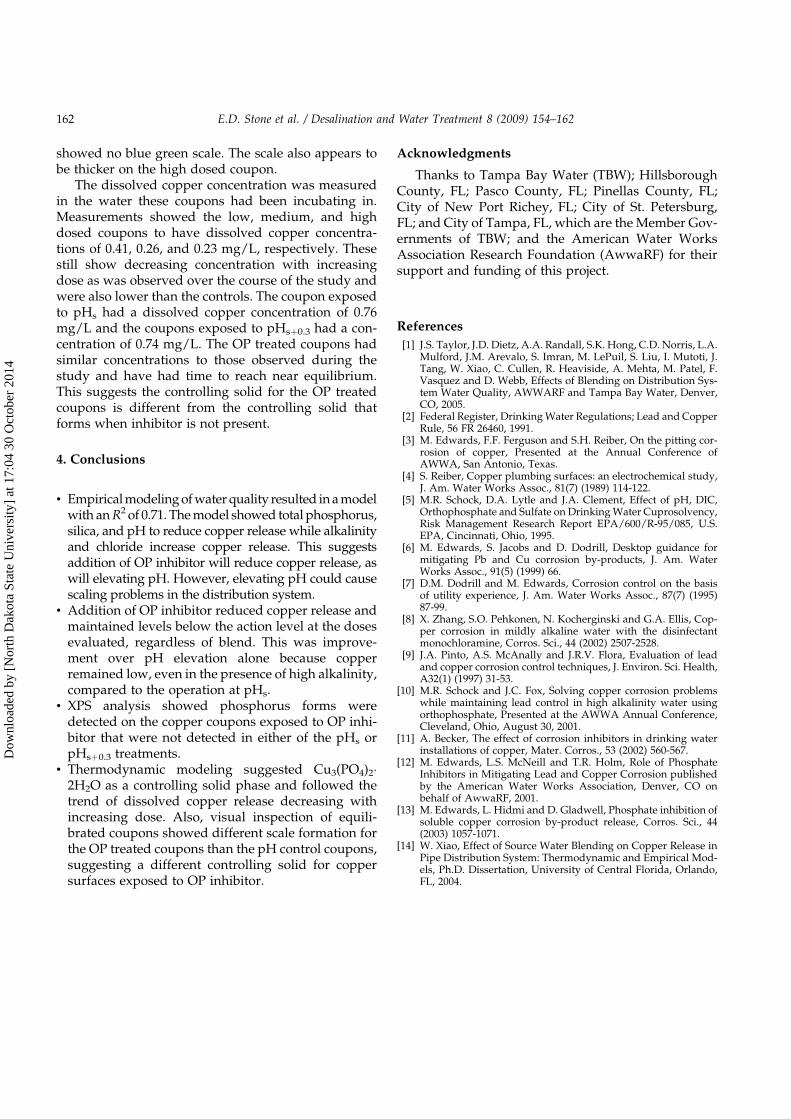
showed no blue green scale. The scale also appears tobe thicker on the high dosed coupon.
The dissolved copper concentration was measuredin the water these coupons had been incubating in.Measurements showed the low, medium, and highdosed coupons to have dissolved copper concentra-tions of 0.41, 0.26, and 0.23 mg/L, respectively. Thesestill show decreasing concentration with increasingdose as was observed over the course of the study andwere also lower than the controls. The coupon exposedto pHs had a dissolved copper concentration of 0.76mg/L and the coupons exposed to pHsþ0.3 had a con-centration of 0.74 mg/L. The OP treated coupons hadsimilar concentrations to those observed during thestudy and have had time to reach near equilibrium.This suggests the controlling solid for the OP treatedcoupons is different from the controlling solid thatforms when inhibitor is not present.
4. Conclusions
• Empirical modeling of water quality resulted in a modelwith an R2 of 0.71. The model showed total phosphorus,silica, and pH to reduce copper release while alkalinityand chloride increase copper release. This suggestsaddition of OP inhibitor will reduce copper release, aswill elevating pH. However, elevating pH could causescaling problems in the distribution system.
• Addition of OP inhibitor reduced copper release andmaintained levels below the action level at the dosesevaluated, regardless of blend. This was improve-ment over pH elevation alone because copperremained low, even in the presence of high alkalinity,compared to the operation at pHs.
• XPS analysis showed phosphorus forms weredetected on the copper coupons exposed to OP inhi-bitor that were not detected in either of the pHs orpHsþ0.3 treatments.
• Thermodynamic modeling suggested Cu3(PO4)2�2H2O as a controlling solid phase and followed thetrend of dissolved copper release decreasing withincreasing dose. Also, visual inspection of equili-brated coupons showed different scale formation forthe OP treated coupons than the pH control coupons,suggesting a different controlling solid for coppersurfaces exposed to OP inhibitor.
Acknowledgments
Thanks to Tampa Bay Water (TBW); HillsboroughCounty, FL; Pasco County, FL; Pinellas County, FL;City of New Port Richey, FL; City of St. Petersburg,FL; and City of Tampa, FL, which are the Member Gov-ernments of TBW; and the American Water WorksAssociation Research Foundation (AwwaRF) for theirsupport and funding of this project.
References
[1] J.S. Taylor, J.D. Dietz, A.A. Randall, S.K. Hong, C.D. Norris, L.A.Mulford, J.M. Arevalo, S. Imran, M. LePuil, S. Liu, I. Mutoti, J.Tang, W. Xiao, C. Cullen, R. Heaviside, A. Mehta, M. Patel, F.Vasquez and D. Webb, Effects of Blending on Distribution Sys-tem Water Quality, AWWARF and Tampa Bay Water, Denver,CO, 2005.
[2] Federal Register, Drinking Water Regulations; Lead and CopperRule, 56 FR 26460, 1991.
[3] M. Edwards, F.F. Ferguson and S.H. Reiber, On the pitting cor-rosion of copper, Presented at the Annual Conference ofAWWA, San Antonio, Texas.
[4] S. Reiber, Copper plumbing surfaces: an electrochemical study,J. Am. Water Works Assoc., 81(7) (1989) 114-122.
[5] M.R. Schock, D.A. Lytle and J.A. Clement, Effect of pH, DIC,Orthophosphate and Sulfate on Drinking Water Cuprosolvency,Risk Management Research Report EPA/600/R-95/085, U.S.EPA, Cincinnati, Ohio, 1995.
[6] M. Edwards, S. Jacobs and D. Dodrill, Desktop guidance formitigating Pb and Cu corrosion by-products, J. Am. WaterWorks Assoc., 91(5) (1999) 66.
[7] D.M. Dodrill and M. Edwards, Corrosion control on the basisof utility experience, J. Am. Water Works Assoc., 87(7) (1995)87-99.
[8] X. Zhang, S.O. Pehkonen, N. Kocherginski and G.A. Ellis, Cop-per corrosion in mildly alkaline water with the disinfectantmonochloramine, Corros. Sci., 44 (2002) 2507-2528.
[9] J.A. Pinto, A.S. McAnally and J.R.V. Flora, Evaluation of leadand copper corrosion control techniques, J. Environ. Sci. Health,A32(1) (1997) 31-53.
[10] M.R. Schock and J.C. Fox, Solving copper corrosion problemswhile maintaining lead control in high alkalinity water usingorthophosphate, Presented at the AWWA Annual Conference,Cleveland, Ohio, August 30, 2001.
[11] A. Becker, The effect of corrosion inhibitors in drinking waterinstallations of copper, Mater. Corros., 53 (2002) 560-567.
[12] M. Edwards, L.S. McNeill and T.R. Holm, Role of PhosphateInhibitors in Mitigating Lead and Copper Corrosion publishedby the American Water Works Association, Denver, CO onbehalf of AwwaRF, 2001.
[13] M. Edwards, L. Hidmi and D. Gladwell, Phosphate inhibition ofsoluble copper corrosion by-product release, Corros. Sci., 44(2003) 1057-1071.
[14] W. Xiao, Effect of Source Water Blending on Copper Release inPipe Distribution System: Thermodynamic and Empirical Mod-els, Ph.D. Dissertation, University of Central Florida, Orlando,FL, 2004.
162 E.D. Stone et al. / Desalination and Water Treatment 8 (2009) 154–162
Dow
nloa
ded
by [
Nor
th D
akot
a St
ate
Uni
vers
ity]
at 1
7:04
30
Oct
ober
201
4