Embed Size (px)
Citation preview
Effects of muscle fiber type and size on EMG median frequency and conduction velocity
E. J. KUPA, S. H. ROY, S. C. KANDARIAN, AND C. J. DE LUCA NeuroMuscular Research Center, Boston University; and Department of Health Sciences, Sargent College of Allied Health Professions, Boston, Massachusetts 02215
Kupa, E. J., S. H. Roy, S. C. Kandarian, and C. J. De Luca. Effects of muscle fiber type and size on EMG median frequency and conduction velocity. J. Appl. PhysioZ. 79(l): 23-32, 1995.-This paper describes an in vitro method for comparing surface-detected electromyographic median fre- quency (MF) and conduction velocity (CV) parameters with histochemical measurements of muscle fiber type composi- tion and cross-sectional area (CSA). Electromyographic sig- nals were recorded during electrically elicited tetanic contrac- tions from rat soleus, extensor digitorum longus, and dia- phragm muscles placed in an oxygenated Krebs bath. Fibers were typed as slow oxidative, fast oxidative glycolytic, and fast glycolytic based on histochemical enzyme stains. Muscles with a greater percentage of fast glycolytic and fast oxidative glycolytic fibers exhibited greater initial values of MF and CV as well as a greater reduction in these variables over the course of the contraction. Regression indicated that fiber type composition could be predicted based on two MF parameters. A weighted measure of muscle fiber CSA was found to be linearly related to both initial MF and CV. The results of this study suggest that MF and CV parameters recorded during a muscular contraction are related to muscle fiber type com- position and muscle fiber CSA.
electromyographic; soleus; extensor digitorum longus; dia- phragm; M-wave; cross-sectional area
DURING A SUSTAINED CONTRACTION, the depolarization and propagation of muscle fiber action potentials are modified. These modifications produce time-dependent changes to the resultant surface electromyographic (EMG) signal. It is well known, for instance, that the EMG signal undergoes a shift in its power spectrum toward lower frequencies as well as an alteration of its spectral shape during a constant-force isometric con- traction (7). The resultant decrease in EMG spectral variables, such as the median or mean frequency, has provided investigators with a noninvasive and localized method of monitoring electrophysiological fatigue pro- cesses. Despite the continued interest in this method, the specific relationships between EMG spectral vari- ables and the physiological and morphological proper- ties of the muscle fiber remain elusive.
The few empirical studies that have attempted to identify a relationship between EMG signal variables and muscle fiber characteristics have focused on histo- chemical measurements of muscle fiber type and mus- cle fiber size. Previous studies in humans have shown that the classification of muscle fibers into distinct cate- gories of “fast” or “slow” fibers on the basis of myosin adenosinetriphosphatase (mATPase) can be related to specific EMG spectral parameter values. For instance, it has been reported that muscles having a high per- centage of fast fibers have a correspondingly greater initial value and rate of decrease of EMG median fre-
quency (MF) than muscles with a low percentage of fast fibers (8,11,13,15,22,23,27,28,31). Additionally, human muscles composed primarily of fast fibers have a greater action potential conduction velocity (CV) than muscles composed of mostly slow fibers (15). These findings raise the possibility that the fiber type compo- sition of a muscle can be estimated on the basis of EMG spectral parameters, either singularly or in combina- tion with other parameters (9, 22, 31). This possibility is still highly speculative because previous investiga- tions were limited to in vivo studies in humans during voluntary contractions where confounding physiologi- cal and experimental factors could not be controlled. Also, muscle fiber type classification in these studies was derived purely on the basis of mATPase activity without regard to the metabolic profile of the muscle that may also influence the time-dependent behavior of the EMG signal (7). Attempts at relating EMG spectral parameters to the morphological characteristics of muscle fibers have also been inconclusive. The associa- tion between EMG spectral variables and muscle fiber size, as measured by fiber cross-sectional area (CSA) or diameter, has not been adequately determined on the basis of empirical measurements. Despite earlier successful investigations in isolated frog muscle (lo), which described a linearly increasing relationship be- tween muscle fiber diameter and CV, in vivo studies on whole muscles in humans have not been as success- ful in confirming this relationship for either CV or EMG spectral parameters (5, 8, 9, 15, 26, 31). Although sin- gle-fiber studies have provided the most direct method of relating muscle fiber properties to EMG measure- ments, they do not provide a realistic simulation of the condition most commonly present in human EMG applications in which surface-detected signals are re- corded from whole muscle.
It was therefore the aim of this study to further in- vestigate the relationship between muscle fiber charac- teristics and EMG signal parameters in whole muscle through the use of an in vitro model in which confound- ing experimental and physiological factors present dur- ing in vivo studies could be more adequately controlled. Specifically, we compared surface EMG measurements of MF and CV with histochemical measurements of muscle fiber type and size in three whole muscles of the rat selected according to distinct differences in fiber type composition and muscle fiber CSA.
METHODS
Animal preparation. A total of 14 female Wistar rats (weight 150-175 g; B. K. Breeding Laboratories) were used. Soleus (SOL) and extensor digitorum longus (EDL) muscles were excised from six animals and the diaphragm (DIA) mus-
0161-7567/95 $3.00 Copyright 0 1995 the American Physiological Society 23
24 MUSCLE FIBER TYPE AND EMG
Aeration inlet -+c_ Thermal Regulator
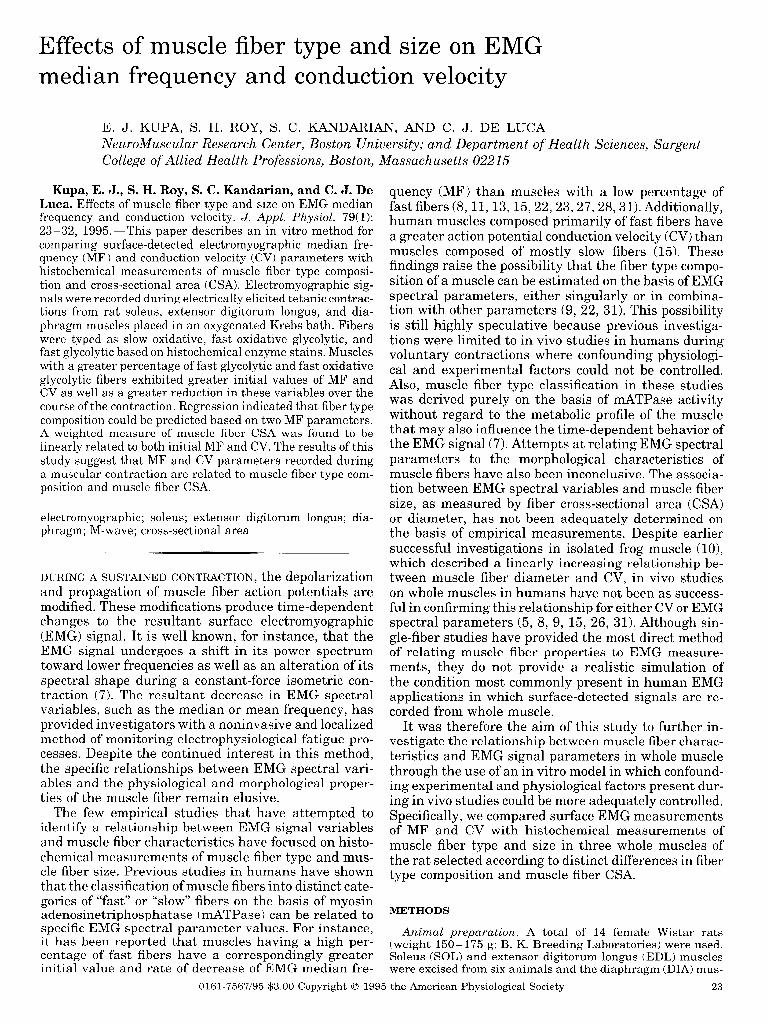
FIG. 1. Schematic representation of in vitro experimental setup for detecting EMG signals from isolated neuromuscular preparations mounted in isothermal bath. A/D, analog to digital. Krebs solution was maintained at constant temperature and circulated through test chamber as indicated by arrows showing direction of flow. Surface EMG electrode was placed on underside of muscle that was secured by its tendons to fixed post and force transducer. Nerve from muscle is shown in figure to be in contact with stimulation electrode located above bath. EMG and force signals were amplified and conditioned before they were digitally sampled using PC workstation.
cle was excised from eight animals (n = 8 for each muscle group). Animals were anesthetized with an intraperitoneal injection of pentobarbital sodium at a dose of 6.25 mg/lOO g body wt. EDL and SOL muscles were removed from each hindlimb with their corresponding branches of the sciatic nerve intact. The blood supply to all muscles was maintained until immediately before removal. Before extracting the DIA muscle, a tracheostomy was performed and the animal was connected to a small rodent ventilator. The entire DIA muscle and attached ribs were then removed with the left phrenic nerve intact. A lo-mm-wide muscle strip was cut from the left costal DIA and clamps were attached to the central ten- don and ribs.
Experimental procedure. The extracted neuromuscular preparations were placed in a bath of Krebs solution (in mM: 137 NaCl, 5 KCl, 1 MgS04, 1 NaHC03, 2 CaC12, and 11 glucose) maintained at a constant temperature of 26°C and continuously aerated with a gas mixture consisting of 80% OlL:5%j CO,:15% N,. The muscles were attached to a fixed post at one end and to a force transducer at the other using tendon sutures or clamps. The free end of the nerve was placed over a bipolar stimulation electrode positioned just outside the bath to help reduce stimulus artifact. A schematic representation of the setup is shown in Fig. 1. The stimula- tion was set to a frequency of 40 Hz and a pulse width of 0.2 ms at a supramaximal voltage. Supramaximal stimulation voltage was determined by first increasing the voltage until a peak twitch tension was observed and then setting the voltage to 1.5 times this value. Next, the muscle was adjusted to optimal length according to the position at which a maxi- mum twitch force occurred. The remaining experimental pro- tocol was carried out after allowing 10 min for the muscle to equilibrate in the bath.
The stimulation protocol began with the induction of a 5- s contraction to briefly check for signal quality followed 5 min
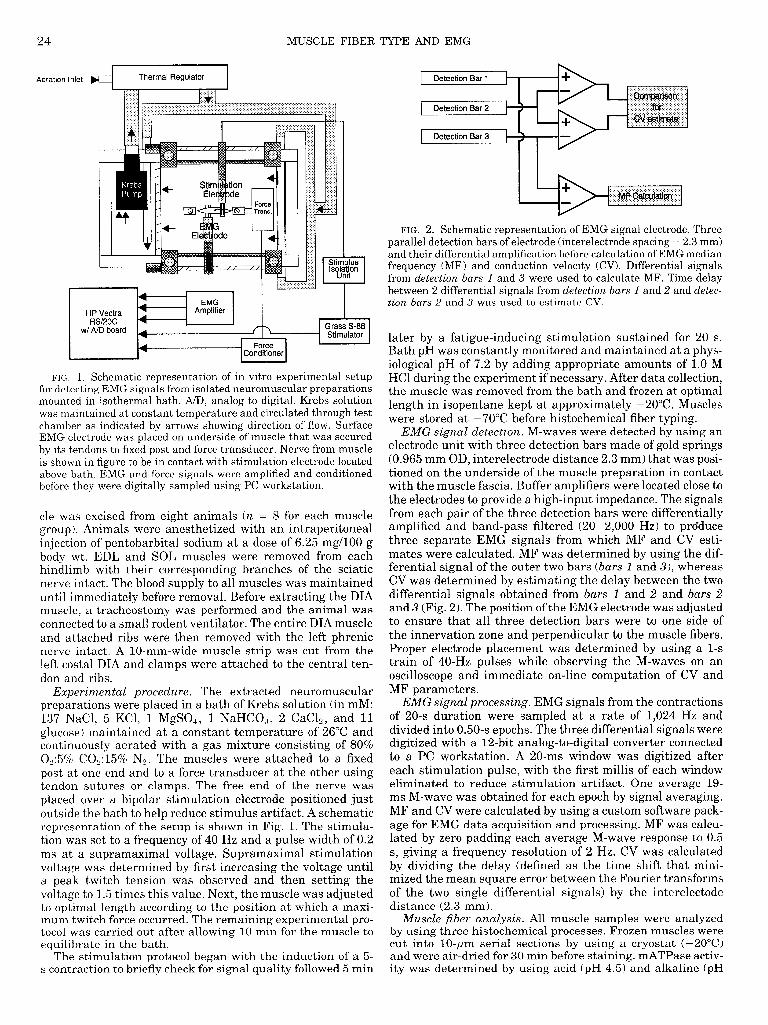
FIG. 2. Schematic representation of EMG signal electrode. Three parallel detection bars of electrode (interelectrode spacing = 2.3 mm) and their differential amplification before calculation of EMG median frequency (MF) and conduction velocity (CV). Differential signals from detection bars 1 and 3 were used to calculate MF. Time delay between 2 differential signals from detection bars 1 and 2 and detec- tion bars 2 and 3 was used to estimate CV.
later by a fatigue-inducing stimulation sustained for 20 s. Bath pH was constantly monitored and maintained at a phys- iological pH of 7.2 by adding appropriate amounts of 1.0 M HCl during the experiment if necessary. After data collection, the muscle was removed from the bath and frozen at optimal length in isopentane kept at approximately -20°C. Muscles were stored at -70°C before histochemical fiber typing.
EMG signal detection. M-waves were detected by using an electrode unit with three detection bars made of gold springs (0.965 mm OD, interelectrode distance 2.3 mm) that was posi- tioned on the underside of the muscle preparation in contact with the muscle fascia. Buffer amplifiers were located close to the electrodes to provide a high-input impedance. The signals from each pair of the three detection bars were differentially amplified and band-pass filtered (20-2,000 Hz) to produce three separate EMG signals from which MF and CV esti- mates were calculated. MF was determined by using the dif- ferential signal of the outer two bars (bars 1 and 3), whereas CV was determined by estimating the delay between the two differential signals obtained from bars 1 and 2 and bars 2 and 3 (Fig. 2). The position of the EMG electrode was adjusted to ensure that all three detection bars were to one side of the innervation zone and perpendicular to the muscle fibers. Proper electrode placement was determined by using a l-s train of 40-Hz pulses while observing the M-waves on an oscilloscope and immediate on-line computation of CV and MF parameters.
EMG signaL processing. EMG signals from the contractions of 20-s duration were sampled at a rate of 1,024 Hz and divided into 0.50-s epochs. The three differential signals were digitized with a 12-bit analog-to-digital converter connected to a PC workstation. A 20-ms window was digitized after each stimulation pulse, with the first millis of each window eliminated to reduce stimulation artifact. One average 19- ms M-wave was obtained for each epoch by signal averaging. MF and CV were calculated by using a custom software pack- age for EMG data acquisition and processing. MF was calcu- lated by zero padding each average M-wave response to 0.5 s, giving a frequency resolution of 2 Hz. CV was calculated by dividing the delay (defined as the time shift that mini- mized the mean square error between the Fourier transforms of the two single differential signals) by the interelectode distance (2.3 mm).
MuscZe fiber anaZysis. All muscle samples were analyzed by using three histochemical processes. Frozen muscles were cut into lO+m serial sections by using a cryostat (-20°C) and were air-dried for 30 min before staining. mATPase activ- ity was determined by using acid (pH 4.5) and alkaline (pH
MUSCLE FIBER TYPE AND EMG 25
A SOL
8001 - - - - - - - - -
-600' - - - - - - - - - ’ 0 9.5 19
B Time Scaling
DIA
EDL 1000
-600’ - - - - - - - - - ’ 0 9.5 19
Time (ms)
- SOL -- - DIA
I - - - - - -
0 4 8 12 16 20
Amplitude Scaling
1 -. - - - - - - .
0 4 8 12 16 20
Time (s)
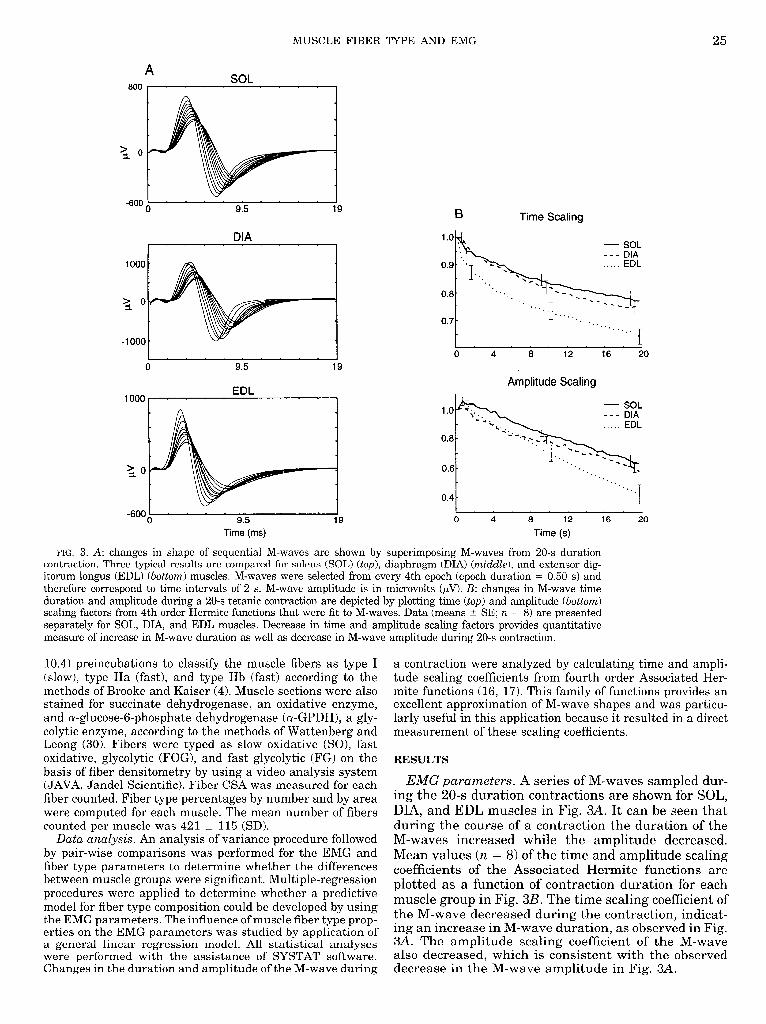
FIG. 3. A: changes in shape of sequential M-waves are shown by superimposing M-waves from 20-s duration contraction. Three typical results are compared for soleus (SOL) (top), diaphragm (DIA) (mid&e), and extensor dig- itorum longus (EDL) (bottom) muscles. M-waves were selected from every 4th epoch (epoch duration = 0.50 s> and therefore correspond to time intervals of 2 s. M-wave amplitude is in microvolts +V). B: changes in M-wave time duration and amplitude during a 20-s tetanic contraction are depicted by plotting time (top) and amplitude (bottom) scaling factors from 4th order Hermite functions that were fit to M-waves. Data (means + SE; n = 8) are presented separately for SOL, DIA, and EDL muscles. Decrease in time and amplitude scaling factors provides quantitative measure of increase in M-wave duration as well as decrease in M-wave amplitude during 20-s contraction.
10.4) preincubations to classify the muscle fibers as type I (slow), type IIa (fast), and type IIb (fast) according to the methods of Brooke and Kaiser (4). Muscle sections were also stained for succinate dehydrogenase, an oxidative enzyme, and a-glucose-6-phosphate dehydrogenase &GPDH), a gly- colytic enzyme, according to the methods of Wattenberg and Leong (30). Fibers were typed as slow oxidative (SO), fast oxidative, glycolytic (FOG), and fast glycolytic (FG) on the basis of fiber densitometry by using a video analysis system (JAVA, Jandel Scientific). Fiber CSA was measured for each fiber counted. Fiber type percentages by number and by area were computed for each muscle. The mean number of fibers counted per muscle was 421 t 115 (SD).
Data anaZysis. An analysis of variance procedure followed by pair-wise comparisons was performed for the EMG and fiber type parameters to determine whether the differences between muscle groups were significant. Multiple-regression procedures were applied to determine whether a predictive model for fiber type composition could be developed by using the EMG parameters. The influence of muscle fiber type prop- erties on the EMG parameters was studied by application of a general linear regression model. All statistical analyses were performed with the assistance of SYSTAT software. Changes in the duration and amplitude of the M-wave during
a contraction were analyzed by calculating time and ampli- tude scaling coefficients from fourth order Associated Her- mite functions (16, 17). This family of functions provides an excellent approximation of M-wave shapes and was particu- larly useful in this application because it resulted in a direct measurement of these scaling coefficients.
RESULTS
EMG parameters. A series of M-waves sampled dur- ing the 20-s duration contractions are shown for SOL, DIA, and EDL muscles in Fig. 3A. It can be seen that during the course of a contraction the duration of the M-waves increased while the amplitude decreased. Mean values (n = 8) of the time and amplitude scaling coefficients of the Associated Hermite functions are plotted as a function of contraction duration for each muscle group in Fig. 3B. The time scaling coefficient of the M-wave decreased during the contraction, indicat- ing an increase in M-wave duration, as observed in Fig. 3A. The amplitude scaling coefficient of the M-wave also decreased, which is consistent with the observed decrease in the M-wave amplitude in Fig. 3A.
26 MUSCLE FIBER TYPE AND EMG
A were nonsignificant (P < O.OS), and differences be- tween DIA and SOL muscles for ICV and ACV parame- ters were not significant (P = 0.25 and P = 0.07, respec- tively). MF parameters were in general less variable than CV parameters. There was a greater variability in CV measurements for SOL and EDL muscles compared with the DIA muscle.
- SOL - - DIA l l * EDL
0.6 .
**a...,. -a*...... . . . . . . . . **.,.... a*. 3. I 0.4 ’
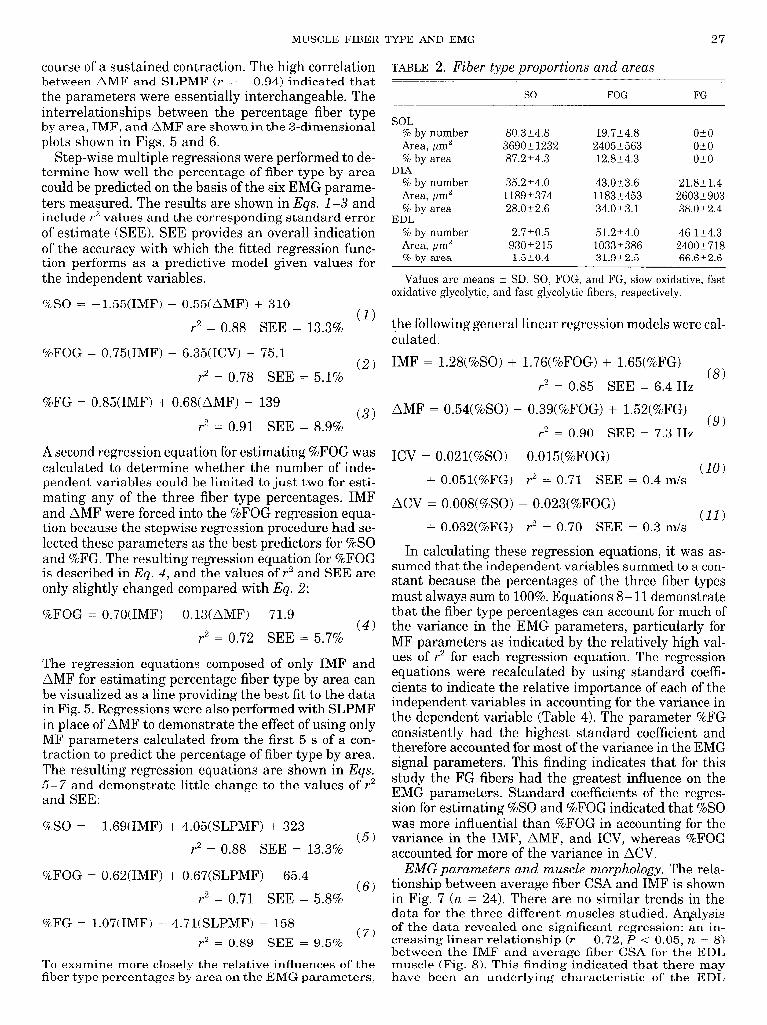
Muscle morphology and fiber type percentages. Mean fiber type percentage by number and by area were cal- culated for each muscle and are summarized in Table 2. Fiber type percentages by area were calculated ac- cording to
5 10 15 20 Af%f
B
%Fiber typef = ~ U&%>
x 100
- SOL - - DIA l l . EDL
N
E ‘. 25
‘a., .‘,. z a.
0.6 - **a...**
‘*..,
I
.*. *. . .
*.a, . . T
10 Time (s)
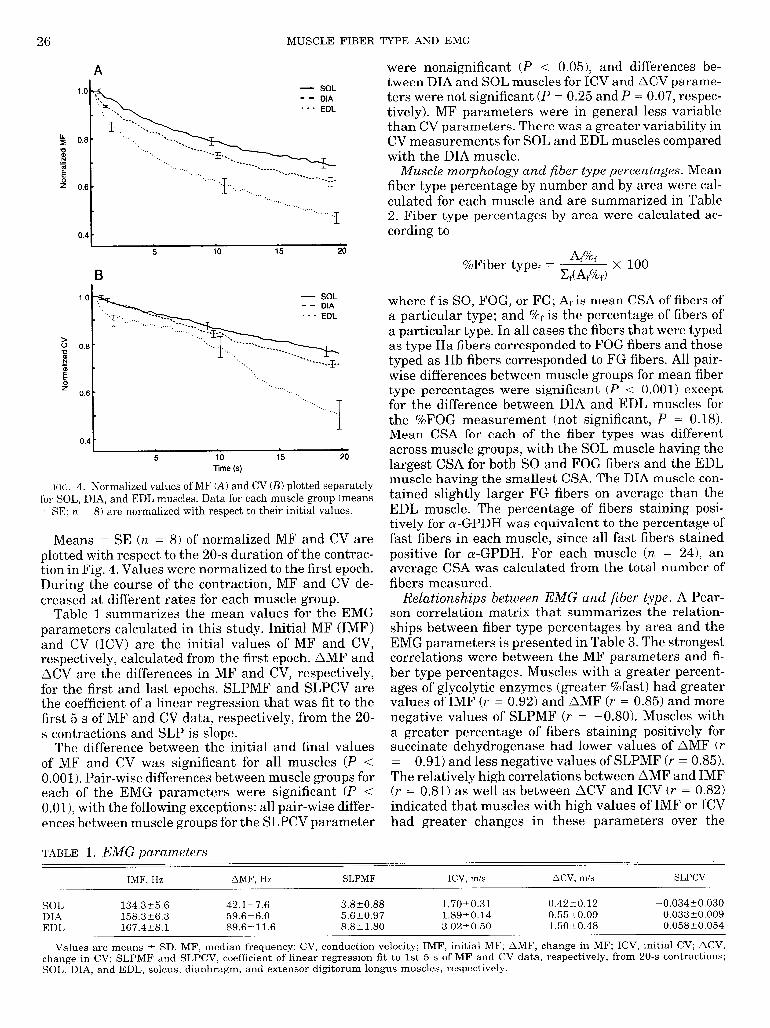
E‘IC;. 4. Normalized values of MF (A) and CV (B) plotted separately for SOL, DIA, and EDL muscles. Data for each muscle group (means t SE; n = 8) are normalized with respect to their initial values.
Means t_ SE (n = 8) of normalized MF and CV are plotted with respect to the 20-s duration of the contrac- tion in Fig. 4. Values were normalized to the first epoch. During the course of the contraction, MF and CV de- creased at different rates for each muscle group.
Table 1 summarizes the mean values for the EMG parameters calculated in this study. Initial MF (IMF) and CV (ICV) are the initial values of MF and CV, respectively, calculated from the first epoch. AMF and ACV are the differences in MF and CV, respectively, for the first and last epochs. SLPMF and SLPCV are the coefficient of a linear regression that was fit to the first 5 s of MF and CV data, respectively, from the 20- s contractions and SLP is slope.
The difference between the initial and final values of MF and CV was significant for all muscles (P < 0.001). Pair-wise differences between muscle groups for each of the EMG parameters were significant (P < O.Ol), with the following exceptions: all pair-wise differ- ences between muscle groups for the SLPCV parameter
TABLE 1. EMG parameters
where f is SO, FOG, or FG; Af is mean CSA of fibers of a particular type; and %f is the percentage of fibers of a particular type. In all cases the fibers that were typed as type IIa fibers corresponded to FOG fibers and those typed as IIb fibers corresponded to FG fibers. All pair- wise differences between muscle groups for mean fiber type percentages were significant (P < 0.001) except for the difference between DIA and EDL muscles for the %FOG measurement (not significant, P = 0.18). Mean CSA for each of the fiber types was different across muscle groups, with the SOL muscle having the largest CSA for both SO and FOG fibers and the EDL muscle having the smallest CSA. The DIA muscle con- tained slightly larger FG fibers on average than the EDL muscle. The percentage of fibers staining posi- tively for a-GPDH was equivalent to the percentage of fast fibers in each muscle, since all fast fibers stained positive for wGPDH. For each muscle (n = 24), an average CSA was calculated from the total number of fibers measured.
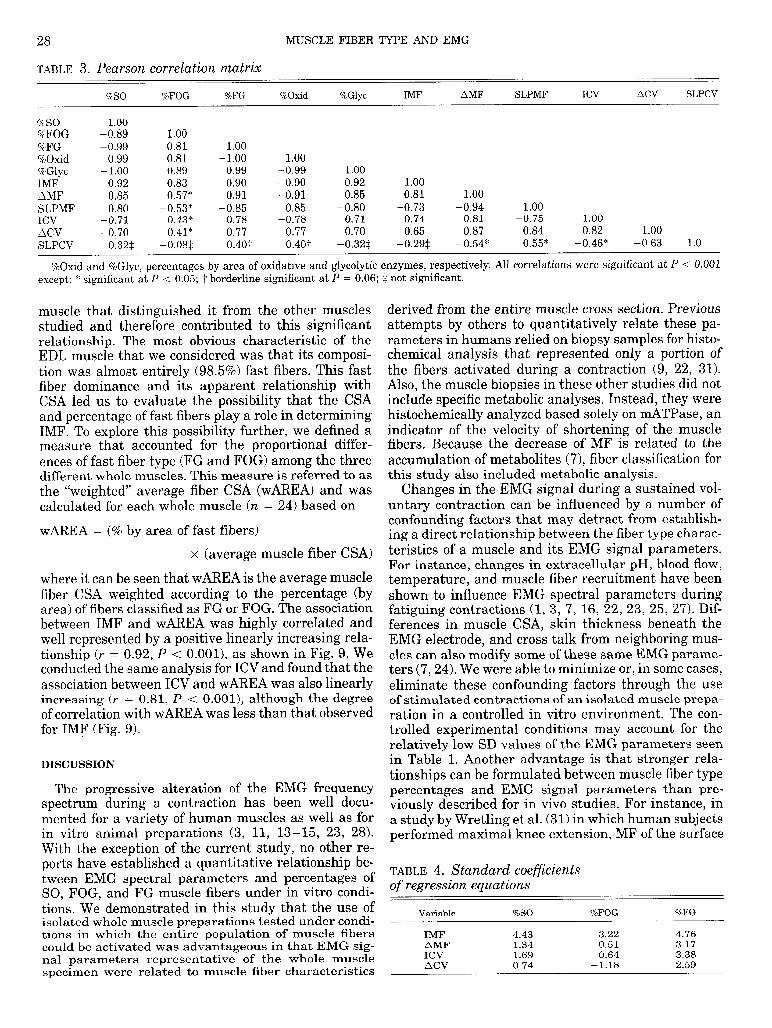
Relationships between EMG and fiber type. A Pear- son correlation matrix that summarizes the relation- ships between fiber type percentages by area and the EMG parameters is presented in Table 3. The strongest correlations were between the MF parameters and fi- ber type percentages. Muscles with a greater percent- ages of glycolytic enzymes (greater %fast) had greater values of IMF (r = 0.92) and AMF (r = 0.85) and more negative values of SLPMF (r = -0.80). Muscles with a greater percentage of fibers staining positively for succinate dehydrogenase had lower values of AMF (r = -0.91) and less negative values of SLPMF (r = 0.85). The relatively high correlations between AMF and IMF (r = 0 81) as well as between ACV and ICV (r = 0.82) indicated that muscles with high values of IMF or ICV had greater changes in these parameters over the
IMF, Hz AMF, Hz SLPMF ICV, l-n/s ACV, m/s SLPCV
SOL 134.325.6 42.1k7.6 -3.8~0.88 1.7OZO.31 0.4250.12 -0.034~0.030 DIA 158.3k6.3 59.6k6.0 4X6+0.97 1.89-tO.14 0.55t0.09 -0.033+0.009 EDL 167.428.1 89.6t11.6 -8.8+1.80 3.0220.50 1.50t0.48 -0.058+0.054
Values are means + SD. MF, median frequency; CV, conduction velocity; IMF, initial MF; AMF, change in MF; ICV, initial CV; ACV, change in CV; SLPMF and SLPCV, coefficient of linear regression fit to 1st 5 s of MF and CV data, respectively, from 20-s contractions; SOL, DIA, and EDL, soleus, diaphragm, and extensor digitorum longus muscles, respectively.
MUSCLE FIBER TYPE AND EMG 27
course of a sustained contraction. The high correlation TABLE 2. Fiber type proportions and areas between AMF and SLPMF (r = -0.94) indicated that the parameters were essentially interchangeable. The so FOG FG
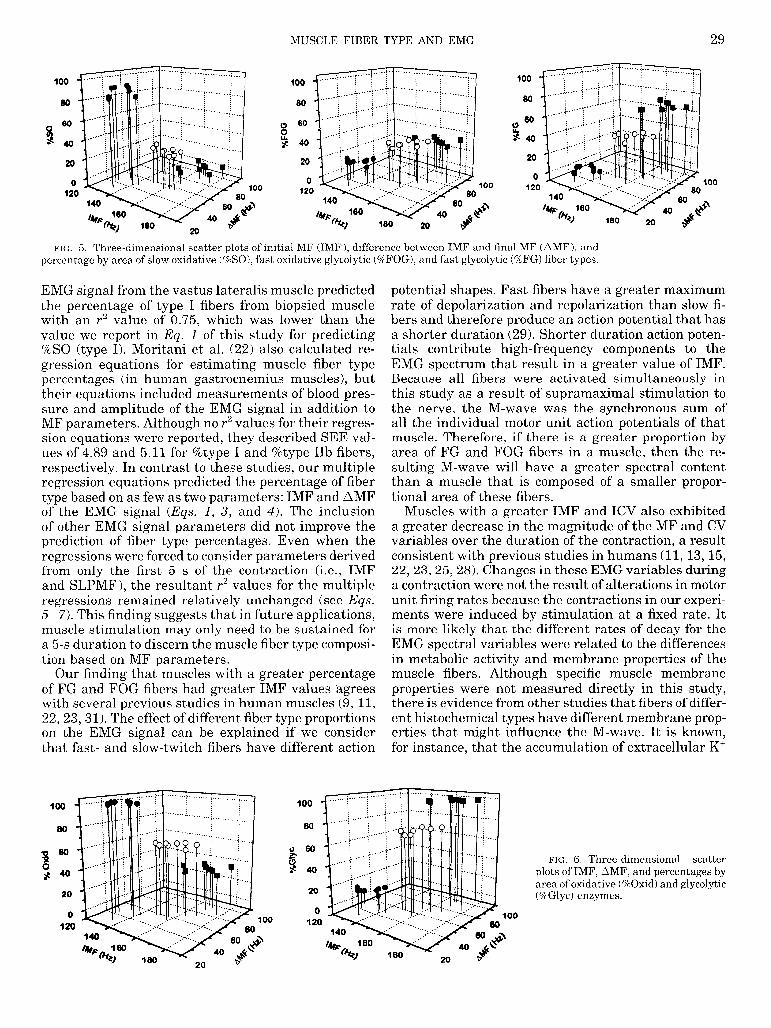
interrelationships between the percentage fiber type by area, IMF, and AMF are shown in the 3-dimensional plots shown in Figs. 5 and 6.
s”:b, number
irea, pm” 80.3 24.8 19.724.8 050
36902 1232 24052563 020 Step-wise multiple regressions were performed to de- % by area 87.2t4.3 12.824.3 020
termine how well the percentage of fiber type by area DIA could be predicted on the basis of the six EMG parame- % by number 35.254.0 43.023.6 21.8k 1.4
ters measured. The results are shown in Eqs. 1-3 and Area, pm2 1189t374 11832453 2603k903
include r2 values and the corresponding standard error % by area 28.022.6 34.023.1 38.Ok2.4
EDL
of estimate (SEE). SEE provides an overall indication of the accuracy with which the fitted regression func- tion performs as a predictive model given values for
% by number Area, pm2 % by area
2.7kO.5 51.2k4.0 46.124.3 93Ok215 10332386 2400t718 1.5+_0.4 31.952.5 66.622.6
the independent variables. Values are means 2 SD. SO, FOG, and FG, slow oxidative, fast oxidative glycolytic, and fast glycolytic fibers, respectively.
%SO = - 155(IMF) - O.X(AMF) + 310
r2 (1
= 0.88 SEE = 13.3%
%FOG = 0.75(IMF) - 6.35(ICV) - 75.1
r2 = 0.78 SEE = 5.1% (2
%FG = 0.85(IMF) + 0.68(AMF) - 139
r2 = 0.91 SEE = 8.9% (3
the following general linear regression models were cal- culated.
IMF = 1.28(%SO) + 1.76(%FOG) + 1,65(%FG)
r2 = 0.85 SEE = 6.4 Hz 0
AMF = 0.54(%SO) - 0.39(%FOG) + 1.52(%FG)
r2 = 0.90 SEE = 7.3 Hz 0
A second regression equation for estimating %FOG was calculated to determine whether the number of inde-
ICV = 0.021(%SO) _ ()015(%FOG) (10)
pendent variables could be limited to just two for esti- + O.O!X(%FG) r2 = 0.71 SEE = 0.4 m/s mating any of the three fiber type percentages. IMF and AMF were forced into the %FOG regression equa-
ACV = O.OOS(%SO) - O.O23(%FOG) (11)
tion because the stepwise regression procedure had se- + O.O32(%FG) r2 = 0.70 SEE = 0.3 m/s lected these parameters as the best predictors for %SO and %FG. The resulting regression equation for %FOG is described in Eq. 4, and the values of r2 and SEE are only slightly changed compared with Eq. 2:
%FOG = 0.70(IMF) - O.l3(AMF) - 71.9
r2 = 0.72 SEE = 5.7% (4)
The regression equations composed of only IMF and AMF for estimating percentage fiber type by area can be visualized as a line providing the best fit to the data in Fig. 5. Regressions were also performed with SLPMF in place of AMF to demonstrate the effect of using only MF parameters calculated from the first 5 s of a con- traction to predict the percentage of fiber type by area. The resulting regression equations are shown in Eqs. 5-7 and demonstrate little change to the values of r2 and SEE:
%SO = -1.69(IMF) + 4.05(SLPMF) + 323
r2 = 0.88 SEE = 13.3% (5)
%FOG = 0.62UMF) + 0.67(SLPMF) - 65.4
r2 (6)
= 0.71 SEE = 5.8%
%FG = l.O7(IMF) - 4.71(SLPMF) - 158
r2 (7)
= 0.89 SEE = 9.5%
To examine more closely the relative influences of the fiber type percentages by area on the EMG parameters,
In calculating these regression equations, it was as- sumed that the independent variables summed to a con- stant because the percentages of the three fiber types must always sum to 100%. Equations 8- 11 demonstrate that the fiber type percentages can account for much of the variance in the EMG parameters, particularly for MF parameters as indicated by the relatively high val- ues of r2 for each regression equation. The regression equations were recalculated by using standard coeffi- cients to indicate the relative importance of each of the independent variables in accounting for the variance in the dependent variable (Table 4). The parameter %FG consistently had the highest standard coefficient and therefore accounted for most of the variance in the EMG signal parameters. This finding indicates that for this study the FG fibers had the greatest influence on the EMG parameters. Standard coefficients of the regres- sion for estimating %SO and %FOG indicated that %SO was more influential than %FOG in accounting for the variance in the IMF, AMF, and ICV, whereas %FOG accounted for more of the variance in ACV.
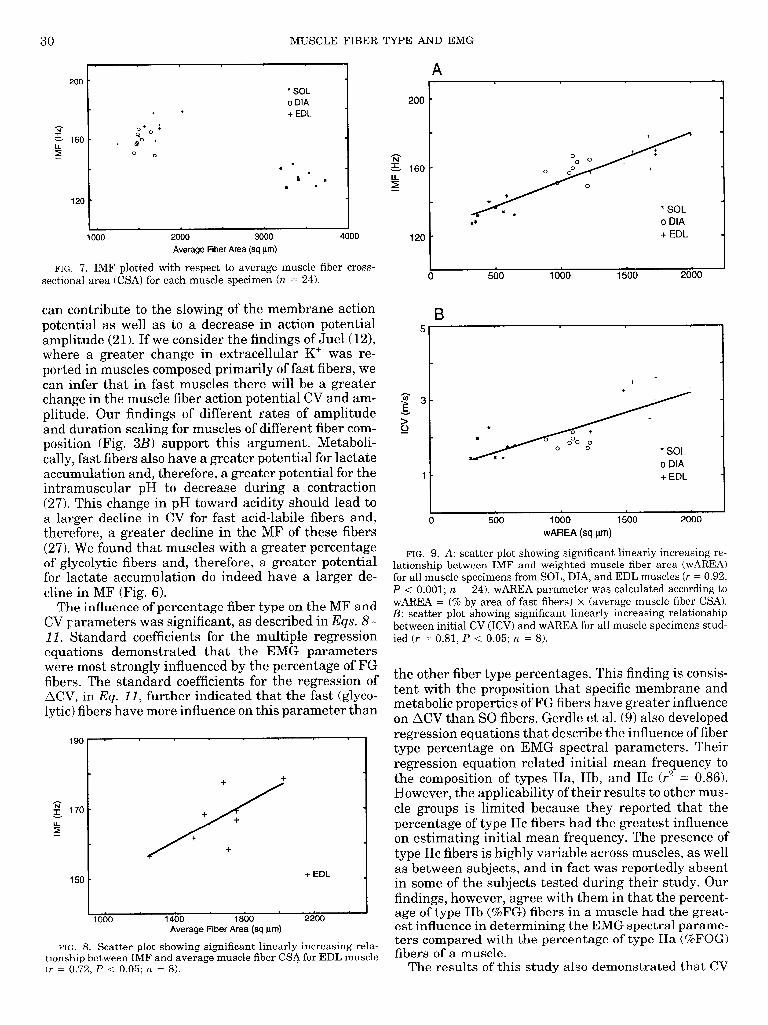
EMG parameters and muscle morphology. The rela- tionship between average fiber CSA and IMF is shown in Fig. 7 (n = 24). There are no similar trends in the data for the three different muscles studied. An,alysis of the data revealed one significant regression: an in- creasing linear relationship (r = 0.72, I[, < 0.05, n = 8) between the IMF and average fiber CSA for the EDL muscle (Fig. 8). This finding indicated that there may have been an underlying characteristic of the EDL
28 MUSCLE FIBER TYPE AND EMG
TABLE 3. Pearson correlation matrix
%SO %FOG %FG %Oxid %Glyc IMF AMF SLPMF ICV ACV SLPCV
%SO %FOG %FG %Oxid %Glyc
IMF AMF SLPMF ICV ACV SLPCV
1.00 -0.89 -0.99
0.99 - 1.00
-0.92 -0.85
0.80 -0.71 -0.70
0.32$
1.00 0.81 1.00
-0.81 - 1.00 1.00 0.89 0.99 -0.99 1.00 0.83 0.90 -0.90 0.92 1.00 0.57* 0.91 -0.91 0.85 0.81 1.00
-0.53* -0.85 0.85 -0.80 -0.73 -0.94 1.00 0.43* 0.78 -0.78 0.71 0.74 0.81 -0.75 1.00 0.41* 0.77 -0.77 0.70 0.65 0.87 -0.84 0.82 1.00
-O.OS$ -0.40-j. 0.40-f -0.323: -0.29$ -0.54* 0.55* -0.46* -0.63 1.0
%Oxid and %Glyc, percentages by area of oxidative and glycolytic enzymes, respectively. All correlations were significant at P < ~.~OI except: * significant at P < 0.05; “f borderline significant at P = 0.06; $ not significant.
muscle that distinguished it from the other muscles studied and therefore contributed to this significant relationship. The most obvious characteristic of the EDL muscle that we considered was that its composi- tion was almost entirely (98.5%) fast fibers. This fast fiber dominance and its apparent relationship with CSA led us to evaluate the possibility that the CSA and percentage of fast fibers play a role in determining IMF. To explore this possibility further, we defined a measure that accounted for the proportional differ- ences of fast fiber type (FG and FOG) among the three different whole muscles. This measure is referred to as the “weighted” average fiber CSA (wAREA) and was calculated for each whole muscle (n = 24) based on
WAREA = (% by area of fast fibers)
x (average muscle fiber CSA)
where it can be seen that wAREA is the average muscle fiber CSA weighted according to the percentage (by area) of fibers classified as FG or FOG. The association between IMF and wAREA was highly correlated and well represented by a positive linearly increasing rela- tionship (r = 0.92, P < O.OOl>, as shown in Fig. 9. We conducted the same analysis for ICV and found that the association between ICV and wAREA was also linearly increasing (r = 0.81, P < O.OOl>, although the degree of correlation with wAREA was less than that observed for IMF (Fig. 9).
DISCUSSION
The progressive alteration of the EMG frequency spectrum during a contraction has been well docu- mented for a variety of human muscles as well as for in vitro animal preparations (3, 11, 13-15, 23, 28). With the exception of the current study, no other re- ports have established a quantitative relationship be- tween EMG spectral parameters and percentages of SO, FOG, and FG muscle fibers under in vitro condi- tions. We demonstrated in this study that the use of isolated whole muscle preparations tested under condi- tions in which the entire population of muscle fibers could be activated was advantageous in that EMG sig- nal parameters representative of the whole muscle specimen were related to muscle fiber characteristics
derived from the entire muscle cross section. Previous attempts by others to quantitatively relate these pa- rameters in humans relied on biopsy samples for histo- chemical analysis that represented only a portion of the fibers activated during a contraction (9, 22, 31). Also, the muscle biopsies in these other studies did not include specific metabolic analyses. Instead, they were histochemically analyzed based solely on m.ATPase, an indicator of the velocity of shortening of the muscle fibers. Because the decrease of MF is related to the accumulation of metabolites (7), fiber classification for this study also included metabolic analysis.
Changes in the EMG signal during a sustained vol- untary contraction can be influenced by a number of confounding factors that may detract from establish- ing a direct relationship between the fiber type charac- teristics of a muscle and its EMG signal parameters. For instance, changes in extracellular pH, blood flow, temperature, and muscle fiber recruitment have been shown to influence EMG spectral parameters during fatiguing contractions (1, 3, 7, 16, 22, 23, 25, 27). Dif- ferences in muscle CSA, skin thickness beneath the EMG electrode, and cross talk from neighboring mus- cles can also modify some of these same EMG parame- ters (7,24). We were able to minimize or, in some cases, eliminate these confounding factors through the use of stimulated contractions of an isolated muscle prepa- ration in a controlled in vitro environment. The con- trolled experimental conditions may account for the relatively low SD values of the EMG parameters seen in Table 1. Another advantage is that stronger rela- tionships can be formulated between muscle fiber type percentages and EMG signal parameters than pre- viously described for in vivo studies. For instance, in a study by Wretling et al. (31) in which human subjects performed maximal knee extension, MF of the surface
TABLE 4. Standard coefficients of regression. equations
Variable %SO T&FOG %FG
IMF 4.43 3.22 4.76 AMF 1.34 -0.51 3.17 ICV 1.69 -0.64 3.38 ncv 0.74 -1.18 2.59
MUSCLE FIBER TYPE AND EMG 29
NC;. 5. Three-dimensional scatter plots of initial MF (IMF), difference between IMF and final MF (AMF), and percentage by area of slow oxidative (%SO), fast oxidative glycolytic (%FOG), and fast glycolytic (%FG) fiber types.
EMG signal from the vastus lateralis muscle predicted the percentage of type I fibers from biopsied muscle with an r2 value of 0.75, which was lower than the value we report in Eq. 1 of this study for predicting %SO (type I). Moritani et al. (22) also calculated re- gression equations for estimating muscle fiber type percentages (in human gastrocnemius muscles), but their equations included measurements of blood pres- sure and amplitude of the EMG signal in addition to MF parameters. Although no r2 values for their regres- sion equations were reported, they described SEE val- ues of 4.89 and 5.11 for %type I and %type IIb fibers, respectively. In contrast to these studies, our multiple regression equations predicted the percentage of fiber type based on as few as two parameters: IMF and AMF of the EMG signal (Eqs. 1, 3, and 4). The inclusion of other EMG signal parameters did not improve the prediction of fiber type percentages. Even when the regressions were forced to consider parameters derived from only the first 5 s of the contraction (i.e., IMF and SLPMF), the resultant r2 values for the multiple regressions remained relatively unchanged (see Eqs. 5-7). This finding suggests that in future applications, muscle stimulation may only need to be sustained for a 5-s duration to discern the muscle fiber type composi- tion based on MF parameters.
Our finding that muscles with a greater percentage of FG and FOG fibers had greater IMF values ‘agrees with several previous studies in human muscles (9, 11, 22,23,31). The effect of different fiber type proportions on the EMG signal can be explained if we consider that fast- and slow-twitch fibers have different action
potential shapes. Fast fibers have a greater maximum rate of depolarization and repolarization than slow fi- bers and therefore produce an action potential that has a shorter duration (29). Shorter duration action poten- tials contribute high-frequency components to the EMG spectrum that result in a greater value of IMF. Because all fibers were activated simultaneously in this study as a result of supramaximal stimulation to the nerve, the M-wave was the synchronous sum of all the individual motor unit action potentials of that muscle. Therefore, if there is a greater proportion by area of FG and FOG fibers in a muscle, then the re- sulting M-wave will have a greater spectral content than a muscle that is composed of a smaller propor- tional area of these fibers.
Muscles with a greater IMF and ICV also exhibited a greater decrease in the magnitude of the MF and CV variables over the duration of the contraction, a result consistent with previous studies in humans (11, 13,15, 22,23,25,28). Changes in these EMG variables during a contraction were not the result of alterations in motor unit firing rates because the contractions in our experi- ments were induced by stimulation at a fixed rate. It is more likely that the different rates of decay for the EMG spectral variables were related to the differences in metabolic activity and membrane properties of the muscle fibers. Although specific muscle membrane properties were not measured directly in this study, there is evidence from other studies that fibers of differ- ent histochemical types have different membrane prop- erties that might influence the M-wave. It is known, for instance, that the accumulation of extracellular K+
? 0 s 40
20
0 120
1
FIG. 6. Three-dimensional scatter plots of IMF, AMF, and percentages by area of oxidative (%Oxid) and glycolytic (%Glyc) enzymes.
30 MUSCLE FIBER TYPE AND EMG
200 l SOL o DIA
+ + + EDL
R *
t * R
l *
200
1000 2000 3000
Average Fiber Area (sq pm) 4000
FIG. 7. IMF plotted with respect to average muscle fiber cross- sectional area (CSA) for each muscle specimen (n = 24).
720
can contribute to the slowing of the membrane action potential as well as to a decrease in action potential amplitude (21). If we consider the findings of Juel(l2), where a greater change in extracellular K+ was re- ported in muscles composed primarily of fast fibers, we can infer that in fast muscles there will be a greater change in the muscle fiber action potential CV and am- plitude. Our findings of different rates of amplitude and duration scaling for muscles of different fiber com- position (Fig. 3B) support this argument. Metaboli- cally, fast fibers also have a greater potential for lactate accumulation and, therefore, a greater potential for the intramuscular pH to decrease during a contraction (27). This change in pH toward acidity should lead to a larger decline in CV for fast acid-labile fibers and, therefore, a greater decline in the MF of these fibers (27). We found that muscles with a greater percentage of glycolytic fibers and, therefore, a greater potential for lactate accumulation do indeed have a larger de- cline in MF (Fig. 6).
The influence of percentage fiber type on the MF and CV Farameters was significant, as described in Eqs. 8- 11. Standard coefficients for the multiple regression equations demonstrated that the EMG parameters were most strongly influenced by the percentage of FG fibers. The standard coefficients for the regression of ACV, in Eq. II, further indicated that the fast (glyco- lytic) fibers have more influence on this parameter than
190 -
+ +
s z 170- + LL z
- s
+
+ +
+ EDL 1 I
1000 1400 1800 2200 Average Fiber Area (sq pm)
FIG. 8. Scatter plot showing significant linearly increasing rela- tionship between IMF and average muscle fiber CSA for EDL muscle (r = 0.72,P < 0.05; n = 8).
B 5’
1 - + EDL
0 500 1000 1500 2000
wAREA (sq pm)
FIG. 9. A: scatter plot showing significant linearly increasing re- lationship between IMF and weighted muscle fiber area (wAREA) for all muscle specimens from SOL, DIA, and EDL muscles (r = 0.92, P < 0.001; n = 24). wAREA parameter was calculated according to wAREA = (% by area of fast fibers) x (average muscle fiber CSA). B: scatter plot showing significant linearly increasing relationship between initial CV (ICV) and wAREA for all muscle specimens stud- ied (r = 0.81, P < 0.05; n = 8).
the other fiber type percentages. This finding is consis- tent with the proposition that specific membrane and metabolic properties of FG fibers have greater influence on ACV than SO fibers. Gerdle et al. (9) also developed regression equations that describe the influence of fiber type percentage on EMG spectral parameters. Their regression equation related initial mean frequency to the composition of types IIa, IIb, and IIc (r2 = 0.86). However, the applicability of their results to other mus- cle groups is limited because they reported that the percentage of type IIc fibers had the greatest influence on estimating initial mean frequency. The presence of type IIc fibers is highly variable across muscles, as well as between subjects, and in fact was reportedly absent in some of the subjects tested during their study. Our findings, however, agree with them in that the percent- age of type IIb (%FG) fibers in a muscle had the great- est influence in determining the EMG spectral parame- ters compared with the percentage of type IIa (%FOG) fibers of a muscle.
The results of this study also demonstrated that CV
MUSCLE FIBER TYPE AND EMG 31
parameters were more variable and not as strongly associated with percentage of fiber type as MF parame- ters. The weaker association may indicate that MF is more strongly influenced by both the membrane char- acteristics of the muscle fibers and its metabolic capac- ity than CV parameters. The greater variability of CV parameters may be explained by the greater sensitivity of this measurement to EMG electrode placement and differences in muscle geometry. It has been shown in human muscles that the placement of the electrode can effect the EMG spectral parameters and CV such that an electrode position close to either the innervation zone or termination zone (muscle-tendon junction) will result in an increase in the high-frequency component of the EMG signal as well as a poorer estimate of CV (24, 25). Because CV is calculated by cross correlating the EMG signal spectrums from two adjacent electrode pairs, if one electrode pair is affected by the termina- tion zone and the other by the innervation zone, CV estimates may be unreliable. This argument is sup- ported by our finding that CV measurements were less variable in the DIA muscle strip than in either of the hindlimb muscles tested. The relatively simple ana- tomic construction of the DIA muscle strip, which con- tains relatively few layers of parallel fibers, favors a more consistent placement of the EMG electrode with respect to the innervation and termination zones of the muscle fibers than the pennated geometry of EDL and SOL muscle fibers.
The results of this study, which were limited to whole muscle preparations, suggest that unlike single-fiber studies, IMF and ICV of the EMG signal did not in- crease linearly with average muscle fiber CSA. Instead, we found that IMF and ICV increased linearly with the proportion (by area) of the whole muscle that was composed of FG and FOG fibers. The common belief that muscles with a relatively large fiber CSA have high ICV values (and therefore, according to previous studies, correspondingly high IMF values; Refs. 1, 25) was clearly not supported by data in the present study. Our results are in agreement with the work of Linssen et al. (15) on human quadriceps muscle, which demon- strated that ICV was dissociated from muscle fiber di- ameter. Other studies on human quadriceps muscles have also reported nonsignificant relationships be- tween muscle fiber size and either ICV or EMG mean frequency (26, 31).
For the EDL muscle, it was evident that IMF in- creased with increasing average muscle fiber CSA (Fig. 8, r = 0.72, P < 0.05). The question that arises is why this relationship did not exist in the other two muscles. The answer, we believe, can be found by looking more closely at the fiber composition of the different muscle groups. The EDL muscle was the only muscle in this study that was almost entirely composed of fast fibers (98.5%). It was th erefore possible that the relationship between IMF and the average fiber CSA was present due to the dominant proportion of fast fibers in the muscle. The effects of proportion and area were ac- counted for in the measure designated as wAREA, which provided a representation of the contribution of fast fiber area to the EMG signal independent of the
muscle being studied. The scatter plot in Fig. 9 demon- strates that the IMF increased in relation to wAREA. A similar relationship can be seen for ICV. The combined effect of fiber type proportions and CSA on the EMG signal can be explained if we consider the different action potential shapes of fast and slow fibers that were mentioned previously in this discussion. If CSA of the fast fibers is increased, the power density spectrum of the resulting M-wave will have more power in the high- frequency band of the spectrum, which will in turn be measured as a greater IMF. This increase in MF can be directly attributed to the fact that the signals from the larger fibers will have a greater amplitude and therefore contribute more of an influence to the spatial summation process that determines the final M-wave shape. Fiber type specific differences in membrane properties are the most likely source of the different frequency characteristics of their respective M-waves. If there is a greater number of fast fibers, or the fast fibers are larger, the effects due to differences in mem- brane properties will manifest themselves more readily in the M-wave that is evoked. One such difference in membrane properties was described by Luff and At- wood (18). They found that the mouse SOL muscle, a mostly slow-twitch muscle, had a greater membrane resistance than the EDL muscle, which was primarily composed of fast-twitch fibers. This difference in mus- cle membrane resistance can be a result of the more developed T-system and sarcoplasmic reticulum that fast-twitch fiber membranes have compared with slow- twitch fiber membranes (6). Differences in membrane resistance associated with fiber type may have contrib- uted to the differences in ICV and IMF that were re- ported in this study.
In summary, the results of this study suggest that the modification of the M-wave and resultant changes in MF and CV during a sustained contraction were related to the muscle fiber composition. We have shown that it is possible to predict muscle fiber compo- sition for three different whole rat muscles based on only two MF parameters. A significant linear relation- ship was described for both the initial MF and CV when plotted with respect to a measure of muscle fiber CSA that accounted for the proportion FG and FOG fibers in the whole muscle. The findings of this study and the work of others, that MF and CV are signifi- cantly associated with fiber type content, raise the question of which mechanisms are responsible for this association. Is it contractile speed, metabolic capacity, or some other fiber type related characteristic of the muscle that determines the EMG characteristics? The question is still unresolved because this and other studies were not designed to isolate specific physiolog- ical or morphological mechanisms to establish causal- ity. Although no causal relationships were identified between EMG signal parameters and mATPase, meta- bolic capacity, or CSA of the muscle, possible mecha- nisms accounting for their significant associations were discussed. These findings support the possibility of utilizing surface EMG techniques to obtain a nonin- vasive electrophysiological “muscle biopsy” for esti- mating muscle fiber composition.
32 MUSCLE FIBER TYPE AND EMG
We thank L. Don Gilmore for technical assistance throughout this project and Kyle Durick and Scott Riewald for initial contributions to this work.
This study was supported in part by the Rehabilitation Research and Development Service of Veterans Affairs and Liberty Mutual 16. Insurance Company.
Address for reprint requests: E. Kupa, NeuroMuscular Research 17. Center, 44 Cummington St., Boston, MA 02215
Received 15 August 1994; accepted in final form 13 February 1995. 18.
REFERENCES 19.
1.
2.
3.
4.
5.
6.
7.
8.
9.
10.
11.
12.
13.
14.
15.
Arendt-Nielsen, L., and K. R. Mills. The relationship between mean power frequency of the EMG spectrum and muscle fiber conduction velocity. Electromyogr. Clin. Neurophysiol. 60: 130- 134, 1985. Basmajian, J. V., and C. J. DeLuca. MuscZes AZiue: Their Functions ReveaLed Through EZectromyography (5th ed.). Balti- more, MD: Williams and Wilkins, 1985. Brody, L. R., M. T. Pollock, S. H. Roy, C. J. DeLuca, and B. Celli. pH-induced effects on median frequency and conduction velocity of the myoelectric signal. J. AppZ. Physiol. 71: 1878- 1885,1991. Brook, M. H., and K. K. Kaiser. Muscle fiber types: how many and what kind. Arch. NeuroZ. 23: 369-379, 1970. Buchthal, F., C. Guld, and P. Rosenflack. Innervation zone and propagation velocity in human muscle. Acta PhysioZ. Stand. 35: 174-190,1955. Burke, R. E., and V. R. Edgerton. Motor unit properites and selective involvement in movement. Exercise Sport Sci. Rev. 3: 31-81,1975. DeLuca, C. J. Myoelectric manifestations of localized muscular fatigue in humans. Crit. Rev. Biomed. Eng. 11: 251-279, 1985. Gerdle, B., K. Henriksson-Larsen, R. Lorentzon, and M. L. Wretling. Dependence of the mean power frequency of the elec- tromyogram on muscle force and fiber type. Acta PhysioZ. Stand. 142:457-465,199l. Gerdle, B., M. L. Wretling, and K. Henriksson-Larsen. Do the fiber-type proportion and angular velocity influence the mean power frequency of the electromyogram? Acta Physiol. Stand. 134:341-346,1988. Hakansson, C. H. Conduction velocity and amplitude of the action potential as related to circumference in the isolated fibre of frog muscle. Acta PhysioZ. Stand. 37: 14-34, 1956. Hakkinen, K., and P. V. Komi. Effects of fatigue and recovery on electromyographic and isometric force- and relaxation-time characteristics of human skeletal muscle. Eur. J. AppZ. Physiol. Occup. PhysioZ. 55: 588-596, 1986. Juel, C. Potassium and sodium shifts during in vitro isometric muscle contraction, and the time course of the ion-gradient re- covery. PfZuegers Arch. 406: 458-463, 1986. Komi, P. V., and P. Tesch. EMG frequency spectrum, muscle structure, and fatigue during dynamic contractions in man. Eur. J. AppZ. PhysioZ. Occup. PhysioZ. 42: 41-50, 1979. Lindstrom, L., R. Magnusson, and I. Petersen. Muscular fatigue and action potential conduction velocity changes studied with frequency analysis of EMG signals. Electromyography 4: 341-353,197o. Linssen. W.. D. Stegeman. E. Joosten, R. Binkhorst, M.
20.
21.
22.
23.
24.
25.
26.
27.
28.
29.
30.
31.
Merks, H. Laak, and S. Notermans. Fatigue in type I fiber predominance: a muscle force and surface EMG study on the relative role of type I and type II muscle fibers. MuscZe Nerve 14: 829-837, 1991. LoConte, L. R., and R. Merletti. Advances in processing of surface myoelectric signals. II. Med. BioZ. Eng. Comput. In press. LoConte, L. R., R. Merletti, and G. V. Sandri. Hermite expan- sions of compact support waveforms: applications to myoelectric signals. IEEE Trans. Biomed. Eng. 41: 1147-1159, 1994. Luff, A., and H. Atwood. Membrane properties and contraction of single muscle fibers in the mouse. Am. J. PhysioZ. 222: 1435- 1440, 1972. Merletti, R., and C. J. DeLuca. New techniques in surface electromyography. In: Computer-Aided Electromyography and Expert Systems, edited by J. E. Desmedt. New York: Elsevier, 1989,~. 115-124. Merletti, R., M. Knaflitz, and C. J. Deluca. Electrically evoked myoelectric signals. Crit. Rev. Biomed. Eng. 19: 293- 340, 1992. Milner-Brown, H. S., and R. G. Miller. Muscle membrane excitation and impulse propagation velocity are reduced during muscle fatigue. MuscZe Nerve 9: 367-374, 1986. Moritani, T., F. D. Gaffney, T. Carmichael, and J. Hargis. Interrelationships among muscle fiber types, electromyogram, and blood pressure during fatiguing isometric contraction. In: Biomechanics IX-A, edited by D. A. Winter, R. W. Norman, R. P. Wells, K. C. Hayes, and A. E. Patla. Champaign, IL: Human Kinetics, 1985, vol. 5a, p. 287-292. (Int. Ser. Biomech.) Moritani, T., A. Nagata, and M. Muro. Electromyographic manifestations of muscular fatigue. Med. Sci. Sports Exercise 14: 198-202, 1982. Roy, S. H., and C. J. DeLuca. Evolving characteristics of the median frequency of the EMG signal. In: Computer-Aided EZec- tromyography and Expert Systems, edited by J. E. Desmedt. New York: Elsevier, 1989, p. 206-221. Roy, S. H., C. J. DeLuca, and J. Schneider. Effects of elec- trode location on myoelectric conduction velocity and median frequency estimates. J. AppZ. Physiol. 61: 1510-1517, 1986. Sadoyama, T., T. Masuda, H. Miyata, and S. Katsuda. Fibre conduction velocity and fibre composition in human vastus later- alis. Eur. J. AppZ. PhysioZ. Occup. PhysioZ. 57: 767-771, 1988. Tesch, P. A., P. V. Komi, I. Jacobs, J. Karlsson, and J. T. Viitasalo. Influence of lactate accumulation on EMG frequency spectrum during repeated concentric contractions. Acta Physiol. Stand. 119: 61-67,1983. Viitasalo, J. T., and P. V. Komi. Isometric endurance, EMG power spectrum, and fiber composition in human quadriceps muscle. In: Biomechanics VI-A, edited by E. Asmussen and K. Jorgensen. Baltimore, MD: University Park Press, 1978, p. 244- 250. (Int. Ser. Biomech.) Wallinga-De Jonge, W., F. L. H. Gielen, P. Wirtz, P. De Jong, and J. Broenink. The different intracellular action po- tentials of fast and slow muscle fibres. Electroenceph. CZin. Neu- rophysiol. 60: 539-547, 1985. Wattenburg, L. W., and J. L. Leong. Effects of coenzyme Q10 and menadione on succinic dehydrogenase activity as measured by tetrazolium salt reduction. J. Histochem. Cytochem. 8: 296- 303, 1960. Wretling, M. L., B. Gerdle, and K. Henriksson-Larsen. EMG: a non-invasive method for determination of fiber type. Acta PhysioZ. Stand. 131: 627-628, 1987.