Embed Size (px)
Citation preview

Classification of EMG Signals for Assessment of
Neuromuscular Disorders
Anjana Goen Department of Electronics & Communication, Rustamji Institute of Technology, BSF, Tekanpur, 475005, India
Email: [email protected]
Abstract—An accurate and computationally efficient means
of feature extraction of electromyographic (EMG) signal
patterns has been the subject of considerable research effort
in recent years. Quantitative analysis of EMG signals
provides an important source of information for the
classification of neuromuscular disorders. The objective of
this study is to discriminate between normal (NOR),
myopathic (MYO) and neuropathic (NEURO) subjects. The
experiment consisted of 22 pathogenic (11 MYO and 11
NEURO) and 12 healthy persons. The signals were recorded
at 30% Maximum Voluntary Contraction (MVC) for 5
seconds. Features of MUAPs extracted in time have been
quantitatively analysed. We have used binary SVM for
classification. Separation of normal subjects from
neuromuscular disease subjects has an accuracy of 83.45%,
whereas separation of subjects from the two types of
subjects (myopathic and neuropathic) has an accuracy of
68.29% which is again high.
Index Terms—electromyography, myopathic, neuropathic,
RBFNN, SVM, SVM ensemble
I INTRODUCTION
Electromyography (EMG) is the study of the electrical
activity of the muscle and is a valuable tool in the
assessment of neuromuscular disorders. EMG findings
are used to detect and describe different disease processes
affecting the Motor Unit (MU), which is the smallest
functional unit of the muscle. There are numerous
neuromuscular disorders that influence the spinal cord,
nerves or muscles. Early finding and diagnosis of these
diseases by clinical examination and laboratory tests is
crucial for their management as well as their anticipation
through prenatal diagnosis and genetic counseling. This
information is also valuable in research, which may lead
to the understanding of the nature and eventual treatment
of these diseases [1].
The purpose of clinical electromyography (EMG) is to
analyze the electrical activity from skeletal muscles
during rest and during weak and maximal contraction.
EMG signal is composed of motor unit action potentials
(MUAPs)which is a compound signal generated by the
muscle fibers of the MU, and its amplitude, duration, and
shape vary in individual muscles according to a number
of factors including the number of muscle fibers of the
Manuscript received November 13, 2013; revised February 27, 2014.
MU, the spatial distribution of end-plates and the age of
the subject. Furthermore, the individual muscle MUAPs
vary, and it is insufficient to evaluate a single or a few
MUAPs. Thus, MUAPs can be identified and tracked
using pattern recognition techniques. The resulting
information can be used to determine the origin of the
disease, i.e. neuropathic or myopathic. When a patient
maintains a low level of muscle contraction, individual
MUAPs can be easily recognized, since only a few MUs
are active. As contraction intensity increases, more MUs
are recruited; different MUAPs overlap, causing an
interference pattern (i.e. superimposed MUAPs) EMG
signal decomposition and MUAP classification into
groups of similar shapes give significant information for
the assessment of neuromuscular pathology. Recent
advances in computer technology have made automated
EMG analysis feasible. A large number of computer-
based quantitative EMG analysis algorithms are
commercially available or developed, but none of them
are broadly accepted for widespread routine clinical use
[1].
Traditionally, neurophysiologists assess MUAPs from
their shape using an oscilloscope and listening to their
audio characteristics. On this way, an experienced
neurophysiologist can detect abnormalities with
reasonable accuracy. Subjective MUAP assessment,
although satisfactory for the detection of unequivocal
abnormalities, may not be sufficient to delineate less
obvious deviations or mixed patterns of abnormalities.
These ambiguous cases call for quantitative MUAP
analysis. Quantitative analysis of MUAPs was developed
to take this variability into account. The technique
compares the mean duration, amplitude, and shape of
several MUAPs from a muscle with age-matched
controls to document a reduction or increase in the
number of muscle fibers per MU as an indication of
myopathic or neuropathic lesion respectively [2]. Some
automated decision making systems of neuromuscular
disorder diagnosis also emerged. For instance cluster
analysis techniques for the automatic diagnosis of
pathology based on MUAP records [3], Muscle and
Nerve Inference Network (MUNIN) which employed a
causal probabilistic network for the interpretation of
EMG findings [4] and KANDID-a rule-based EMG
expert system [5].In most of these systems, the
generation of the input pattern assumes a probabilistic
242
International Journal of Electronics and Electrical Engineering Vol. 2, No. 3, September, 2014
©2014 Engineering and Technology Publishingdoi: 10.12720/ijeee.2.3.242-248

model, with the matching score representing the
likelihood that the input pattern was generated from the
underlying class [6]. In addition, assumptions are
typically made concerning the probability density
function of the input data. For classifying MUAPs for
differentiation of motor neuron diseases and myopathies
from normal, different techniques like back propagation
(BP), the radial basis function (RBFNN) and the Self
Organizing Feature Map (SOFM) have been used [7].
Analyses of surface EMG signals for clinical diagnosis
by various research group have produced not good results
and hence generally looked with suspicion or have been
neglected. Irrespective of the fact SEMG being unreliable
for clinical diagnosis Self Organising Feature Maps
(SOFM) and the Kohenen Neural Network (KNN) leave
one out method for classification is used and had
produced good results [8]. Nonlinear parameters were
very effective as an input to Fuzzy K-means and
Decision trees classifiers [9]. However, the aforesaid
techniques used to train the neural network classifiers are
based on the idea of minimizing the train error, which is
named empirical risk. As a result, limited amounts of
training data and over high training accuracy often lead
to over training instead of good classification
performance.
An overview and comparison of different EMG
methods for myopathic evaluation are presented in[10].
Different EMG methods can be helpful when diagnosing
myopathies, whereas the most useful are: Manual
analysis of the individual motor unit action potentials
(MUAPs) and turns–amplitude analyses. Analysis of the
firing rate of motor units, power spectrum analysis, as
well as multi-channel surface EMG may also be used in
the diagnostics, but are not so common. The frequency
spectrum of EMG can also be used, but it was shown the
analysis of individual MUAPs is more sensitive for
detecting myopathic than analysis of the EMG signal
frequency spectrum [11].
A. Main Characteristicsof the Neuromuscular Diseases
Neuromuscular diseases are a group of disorders
which involves the motor nuclei of the cranial nerves, the
anterior horn cells of the spinal cord, the nerve roots and
spinal nerves, the peripheral nerves, the neuromuscular
junction, and the muscle itself. These disorders cause
muscular weakness and/or wasting. From the large
number of neuromuscular disorders we have selected
neuropathy and myopathy for our study, as their
consistency of clinical appearance is good.
Neuropathies (NEURO) describe damage to the
peripheral nervous system which transmits information
from the brain and spinal cord to every other part of the
body. People may experience temporary numbness,
tingling, and pricking sensations, sensitivity to touch or
muscle weakness. Others may suffer more extreme
symptoms, including burning pain, muscle wasting,
paralysis or organ or gland dysfunction. In the advanced
stages, large motor units also denervate. Motor unit
potentials with duration values that are longer than
normal and with increased amplitude are typical findings
in neuropathy.
Myopathies (MYO) are a group of diseases that affect
primarily skeletal muscle fibers. The symptoms include
muscle dysfunction, cramps, stiffness, and spasm. They
are divided into two groups, inheritedor acquired. Most
muscular dystrophies are hereditary, causing severe
degenerative changes in the muscle fibers. They show
aprogressive clinical course from birth or after a variable
period of apparently normal infancy. One of the most
frequently acquired myopathies is polymyosit is, which is
characterized by acute or subacute onset with muscle
weakness progressing slowly over a matter of weeks.
MUAP’s with short duration and reduced amplitude are
typical findings in patients suffering from myopathy [12].
Fig. 1 shows the structure of normal and myopathic
muscle fibers.
Figure 1. Structure of Muscle fibers (Normal versus Myopathic)
Figure 2. Raw EMG signal
Typical EMG waveforms for all the three categories
are shown in Fig. 2.
Fig. 3 depicts very well that the frequency of MUAPs
are different for NOR, MYO and NEURO group. MYO
MUAPs have high frequency and small amplitude
whereas the frequency of NOR lies between that of the
MYO and NEURO subjects. This paper is organized
into5 sections: Section I briefly describes EMG and its
characteristics and previous work done by various
researchers. Section II describes data preprocessing,
MUAP identification, feature extraction and
classification of EMG signal. Section III illustrates result
section IV discussion and section V ends with conclusion
and future prospects.
243
International Journal of Electronics and Electrical Engineering Vol. 2, No. 3, September, 2014
©2014 Engineering and Technology Publishing
II MATERIALS AND METHODS
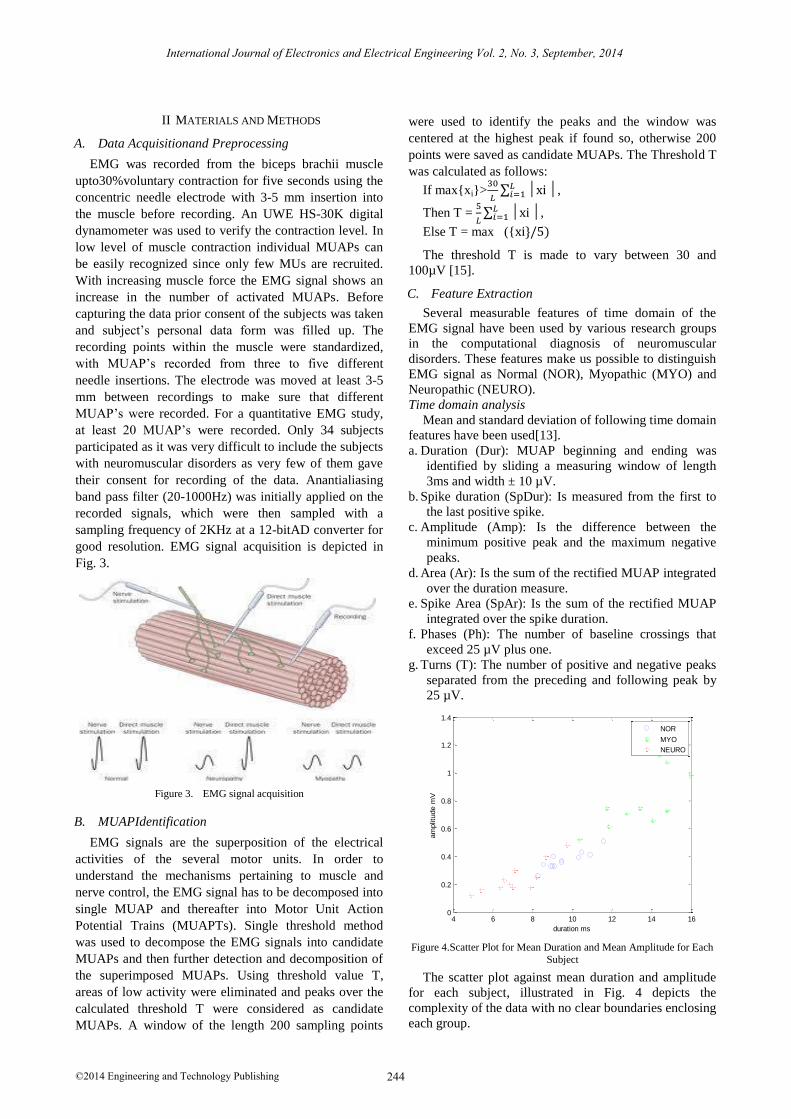
A. Data Acquisitionand Preprocessing
EMG was recorded from the biceps brachii muscle
upto30%voluntary contraction for five seconds using the
concentric needle electrode with 3-5 mm insertion into
the muscle before recording. An UWE HS-30K digital
dynamometer was used to verify the contraction level. In
low level of muscle contraction individual MUAPs can
be easily recognized since only few MUs are recruited.
With increasing muscle force the EMG signal shows an
increase in the number of activated MUAPs. Before
capturing the data prior consent of the subjects was taken
and subject’s personal data form was filled up. The
recording points within the muscle were standardized,
with MUAP’s recorded from three to five different
needle insertions. The electrode was moved at least 3-5
mm between recordings to make sure that different
MUAP’s were recorded. For a quantitative EMG study,
at least 20 MUAP’s were recorded. Only 34 subjects
participated as it was very difficult to include the subjects
with neuromuscular disorders as very few of them gave
their consent for recording of the data. Anantialiasing
band pass filter (20-1000Hz) was initially applied on the
recorded signals, which were then sampled with a
sampling frequency of 2KHz at a 12-bitAD converter for
good resolution. EMG signal acquisition is depicted in
Fig. 3.
Figure 3. EMG signal acquisition
B. MUAPIdentification
EMG signals are the superposition of the electrical
activities of the several motor units. In order to
understand the mechanisms pertaining to muscle and
nerve control, the EMG signal has to be decomposed into
single MUAP and thereafter into Motor Unit Action
Potential Trains (MUAPTs). Single threshold method
was used to decompose the EMG signals into candidate
MUAPs and then further detection and decomposition of
the superimposed MUAPs. Using threshold value T,
areas of low activity were eliminated and peaks over the
calculated threshold T were considered as candidate
MUAPs. A window of the length 200 sampling points
were used to identify the peaks and the window was
centered at the highest peak if found so, otherwise 200
points were saved as candidate MUAPs. The Threshold T
was calculated as follows:
If max{xi}>
∑
,
Then T =
∑
,
Else T = max ({
The threshold T is made to vary between 30 and
100µV [15].
C. Feature Extraction
Several measurable features of time domain of the
EMG signal have been used by various research groups
in the computational diagnosis of neuromuscular
disorders. These features make us possible to distinguish
EMG signal as Normal (NOR), Myopathic (MYO) and
Neuropathic (NEURO).
Time domain analysis
Mean and standard deviation of following time domain
features have been used[13].
a. Duration (Dur): MUAP beginning and ending was
identified by sliding a measuring window of length
3ms and width ± 10 µV.
b. Spike duration (SpDur): Is measured from the first to
the last positive spike.
c. Amplitude (Amp): Is the difference between the
minimum positive peak and the maximum negative
peaks.
d. Area (Ar): Is the sum of the rectified MUAP integrated
over the duration measure.
e. Spike Area (SpAr): Is the sum of the rectified MUAP
integrated over the spike duration.
f. Phases (Ph): The number of baseline crossings that
exceed 25 µV plus one.
g. Turns (T): The number of positive and negative peaks
separated from the preceding and following peak by
25 µV.
Figure 4.Scatter Plot for Mean Duration and Mean Amplitude for Each
Subject
The scatter plot against mean duration and amplitude
for each subject, illustrated in Fig. 4 depicts the
complexity of the data with no clear boundaries enclosing
each group.
4 6 8 10 12 14 160
0.2
0.4
0.6
0.8
1
1.2
1.4
duration ms
am
plitu
de m
V
NOR
MYO
NEURO
244
International Journal of Electronics and Electrical Engineering Vol. 2, No. 3, September, 2014
©2014 Engineering and Technology Publishing

TABLE I. COMPLETE SET OF DATA
DurMn DurSD AmpMn AmpSD SpDMn SpDSD SpAMn SpASD PhMn PhSD TurMn TurSD ArMn ArSD
8.93 2.77 0.33 0.23 6.05 2.7 0.24 0.17 2.5 0.61 3.1 1.21 0.47 0.38
10.48 2.83 0.43 0.18 4.39 1.74 0.22 0.1 3.15 0.88 3.6 1.05 0.4 0.22
11.6 3.4 0.51 0.3 4.77 2.62 0.25 0.13 2.6 0.5 3 0.56 0.3 0.19
9.11 3.01 0.33 0.19 4.78 2.23 0.2 0.12 2.75 0.97 2.95 0.83 0.29 0.23
9.01 2.04 0.33 0.15 4.86 1.98 0.19 0.07 2.45 0.51 2.75 0.72 0.3 0.21
10.32 2.14 0.39 0.17 5.93 2.87 0.26 0.14 2.95 1 3.35 1.27 0.35 0.19
8.26 2.12 0.26 0.11 5.43 2.61 0.19 0.08 2.4 0.5 3 1.08 0.37 0.27
9.45 1.74 0.37 0.15 5.63 1.85 0.26 0.09 2.3 0.47 2.75 1.07 0.33 0.22
9.45 2.86 0.36 0.21 6.08 2.41 0.25 0.13 2.2 0.41 2.55 0.6 0.39 0.55
10.9 2.37 0.41 0.15 6.82 2.59 0.26 0.09 2.5 0.76 2.75 1.33 0.43 0.29
8.56 3.06 0.34 0.21 4.97 1.63 0.22 0.12 2.55 0.94 3.65 1.27 0.37 0.34
9.05 2.72 0.4 0.18 5.31 2.97 0.27 0.12 2.8 1.01 3.3 1.26 0.51 0.36
15.94 2.37 0.98 0.36 12.98 5.73 0.84 0.4 5.65 2.5 6.2 2.5 0.82 0.34
14.42 3.17 1.13 1.19 7.81 2.65 0.72 0.56 3.75 1.12 5.75 2.79 0.91 0.73
14.78 3.42 1.08 0.49 6.29 2.02 0.62 0.27 3.7 1.63 4.75 2.36 0.72 0.43
14.05 3.69 0.66 0.29 5.48 5.14 0.32 0.27 3.95 1.64 4 1.62 0.41 0.19
12.76 4.65 0.71 0.32 5.86 1.92 0.43 0.19 2.7 0.57 3.05 0.89 0.56 0.3
13.65 4 1.22 0.86 5.82 2.38 0.7 0.51 3.6 1.19 4.05 1.43 0.72 0.5
11.84 3.74 0.62 0.29 4.32 2.84 0.33 0.16 3.05 0.6 3.6 1.05 0.44 0.17
11.73 3.92 0.75 0.57 6.53 3.36 0.48 0.37 4.5 2.84 5.95 3.75 0.67 0.55
14.75 4.52 0.73 0.32 7.63 4.32 0.42 0.22 4.7 1.59 5.55 2.61 0.37 0.13
10.34 2.39 0.52 0.27 5.15 1.97 0.34 0.18 3.3 1.17 3.6 1.05 0.39 0.18
13.39 3.12 0.75 0.39 7.58 3.88 0.53 0.28 4.75 2.15 5.75 2.81 0.74 0.37
8.18 1.52 0.25 0.09 4.36 2.19 0.15 0.08 2.7 1.03 3.1 1.37 0.28 0.19
8.65 3.08 0.4 0.29 3.52 1.32 0.23 0.17 2.75 0.72 2.95 1 0.34 0.24
5.41 1.34 0.16 0.08 2.97 1.31 0.1 0.05 2.5 0.95 3.25 1.37 0.33 0.24
6.87 2.19 0.2 0.14 4.1 1.57 0.13 0.09 2.4 0.75 3.05 1.15 0.24 0.14
4.91 0.98 0.12 0.11 3.45 0.79 0.08 0.07 2.25 0.55 2.4 0.75 0.29 0.24
6.99 2.15 0.18 0.1 4.62 1.48 0.12 0.06 3.05 1.15 3.65 1.57 0.25 0.2
7.89 2.6 0.18 0.1 6.12 2.55 0.15 0.09 2.75 0.97 2.8 0.95 0.21 0.09
6.37 1.76 0.18 0.13 4.57 1.8 0.14 0.12 2.7 0.92 3.05 1.1 0.26 0.2
9.74 2.15 0.48 0.31 4.92 1.77 0.32 0.21 3.25 1.07 3.7 1.38 0.4 0.33
7.07 1.62 0.3 0.12 4.83 1.16 0.22 0.1 2.6 0.94 3.45 1.36 0.44 0.27
6.57 1.22 0.23 0.16 2.9 1.07 0.15 0.15 3.1 1.33 3.1 1.17 0.43 0.4
Note: p values of the data are < 0.05
TABLE II. MEAN AND STANDARD DEVIATION STATISTICS FOR NOR, MYO AND NEURO SUBJECTS
MUAPs Duration ms
Mn SD
Amplitude mV
Mn SD
Spike duration ms
Mn SD
Spike area mVms
Mn SD
Phase
Mn SD
Turn
Mn SD
Area mVms
Mn SD
NOR 240 MYO 220
NEURO 220
9.60 1.91 13.42 3.54
7.15 1.87
0.40 0.16 0.83 0.49
0.24 0.12
5.42 2.35 6.86 3.29
4.21 1.55
0.23 0.11 0.52 0.31
0.16 0.11
2.60 0.71 3.97 1.55
2.73 0.94
3.06 1.02 4.75 2.08
3.14 1.20
0.38 0.29 0.61 0.35
0.31 0.23
2.4 MUAP Classification
In this study, we have used electromyography signals
from 12 normal and 22 pathogenic (11 MYO and 11
NEURO) subjects at 30% muscle contraction level and
examined. A binary SVM classifier, a feed forward
network, SVM ensemble and RBFNN has been used as
classifier.
Support Vector Machine being linear and binary can
be used as a two class classifier. With slight
245
International Journal of Electronics and Electrical Engineering Vol. 2, No. 3, September, 2014
©2014 Engineering and Technology Publishing

modifications in the algorithm, it can also be employed
for multiclass classification problem [14].
SVM ensemble to improve the limited classification
performance of the real SVM, SVM ensemble with
bagging or boosting is used. In bagging and boosting the
trained individual SVM are aggregated to make a
collective decision in several ways such as Majority
voting, least squares estimated-based weighting and the
double-layer hierarchical combining [15]-[16].
Radial Basis Function Neural Network is a two layer
feed forward network in which the hidden layer
implements a set of radial basis function e.g. Gaussian
functions. The output nodes implement functions as in
MLP and the training/learning is very fast and the
network training is divided into two stages.
The extracted MUAPs were first classified into normal
and pathogenic and the pathogenic MUAPs were further
classified into myopathic and neuropathic.
For comparing the results obtained from classifiers,
common classifier performance metric shave been used
[13]. For a given decision suggested by acertain output
neuron, four possible alternatives exist; true positive (TP),
false positive (FP), true negative (TN), and false negative
(FN). In our study, a TP decision occurs when the
positive diagnosis of the system coincides with a positive
diagnosis of the physician. A TN decision occurs when
the absence of a positive diagnosis of the system agree
with that of the physician. The classification rate was
computed for both the classifications for all the three
classifiers.
Classification rate% = 100 x (TP + TN)/ N
Also, performance evaluation parameters namely
sensitivity, specificity and Positive Predictive Value
(PPV) were computed. We have defined Sensitivity is the
probability that the test gives a positive result when
pathogenic features are tested. Specificity is the
probability that a test gives a negative result when normal
cases are tested. PPV is the probability that a patient with
a positive test is actually pathogenic.
We have used three-fold cross validation using 30
iterations for each of the classifiers. The total MUAPs
were divided into the ratio of 35% and 65%. During the
first fold, 65% of the data was used as training data for
developing the classifier. The remaining part 35% of the
data was used as the test data, and the performance
evaluation parameters were calculated. This procedure
was repeated three times by using a different test set in
each fold. The averages of the performance measures
obtained in each fold were reported as the final
performance measures. In our example out of 34 subjects,
test data consisted of 12 subjects and 22 subjects were
used for training purposes. More data was utilized for
training so that it could be well trained for evaluating the
remaining data. Training more data takes more
computing time hence small dataset is used but it was
compensated with the increase in classification accuracy.
The means and standard deviations of the time domain
features of each subject were taken as the input feature
vector for all three classifiers namely SVM, SVM
ensemble and RBFNN.
III RESULTS
EMG data collected from 34 subjects (12 normal and
22 pathogenic) were analyzed using the methodology
described in Section II. Subjects having no history or
signs of neuromuscular disorders were considered as
normal. The input feature vector for all the three
classifiers consisted of mean and standard deviations
(Table I and Table II) of each of the time domain
parameters of MUAPs. All the algorithms were
implemented using MATLAB R2012b.
Table III shows the results of detailed summary of the
all the classifiers used in this work. SVM ensemble
classifier performed better than the other classifiers. An
average of 91.2% classification accuracy was achieved.
Table IV depicts average positive predictive value (PPV),
sensitivity and specificity for SVM ensemble as 92.2%,
91.1% and 91.9% respectively. The performance of other
classifiers is close to the SVM ensemble. RBFNN has
PPV (91.5%), sensitivity (90.6%) and specificity (91.4%).
TABLE III. CLASSIFICATION RATE PERCENTAGE
Classification of
Subject as SVM
SVM
ensemble RBFNN
Normal/Pathogenic 87.2 90.1 90.2
Myopathic/Neuropathic 88.4 92.3 91.6
TABLE IV. OVERALL PERFORMANCE EVALUATION RESULTS OF THE
THREE CLASSIFIERS
Classifier PPV(%) Sensitivity(%) Specificity(%)
SVM 88.9 87.5 88.8
SVM Ensemble 92.2 91.1 91.9
RBFNN 91.5 90.6 91.4
IV DISCUSSIONS
EMG data collected from 34 subjects were analyzed
using mean and SD of time domain features mentioned in
Table II. Data diagnostic criteria were based on clinical
opinion, biochemical data and muscle biopsy. Only
subjects with no history or signs of neuromuscular
disorders were considered as normal. Examining the
classification rate for each 2-class classification, the
highest classification rate was obtained for the
pathogenic classification using SVM ensemble as
classifier. As shown in Table III and IV, the SVM
ensemble improved significantly the classification rate
and overall performance as compared to the other two
algorithms. The RBFNN result was very close to SVM
ensemble.
In this work, pattern recognition techniques forthe
classification of MUAP’s were investigated using an
artificial neural network technique based on supervised
learning for SVM, modified SVM and RBFNN. ANN
246
International Journal of Electronics and Electrical Engineering Vol. 2, No. 3, September, 2014
©2014 Engineering and Technology Publishing

techniques used yielded a higher classification rate and
seem more appropriate for the classification of MUAP’s
because of their ability to adapt and to create complex
classification boundaries. The modified SVM optimizes
the classification boundaries through slight adaptation of
the weights vectors. Moreover, the ANN technique
presented in this study performed well even with a
limited amount of data. In conclusion, the pattern
recognition techniques as described in this work make
possible the development of a fully automated EMG
signal analysis system which is accurate, simple, fast and
reliable enough to be used in routine clinical environment.
Future work will evaluate the algorithms developed in
this study on EMG data recorded from more muscles and
more subjects. In addition, this system may be integrated
into a hybrid diagnostic system for neuromuscular
diseases based on ANN where EMG [17], muscle biopsy,
biochemical and molecular genetics findings, and clinical
data may be combined to provide a diagnosis [18].
Table V shows the summary of the EMG classification.
Fast Fourier transform (FFT) and principal component
analysis (PCA) was used on sEMG signals taken from
bicep brachii muscle and the classifications of
neuromuscular disorders was performed using multilayer
perceptron (MLP) and Support Vector Machine (SVM)
classifier in reference [19]. They obtained the correct
classification of 85%. Ref. [20] used sEMG signal,
recorded from the biceps brachii muscle, and extracted
features using multi scale entropy and wavelet transform.
They classified subjects healthy/patient with 80.5%
accuracy and three-class classification
(healthy/myopathic/ neuropathic) with accuracy of 69.4%
using SVM ensemble classifier. Ref. [21] classified EMG
signals to normal, myopathic and neuropathic classes
using two stage classifier RBFNN and decision tree with
an accuracy of 88.7%. Ref. [22] analysed EMG signals
using Autoregressive (AR) analysis and the extracted
features was applied to neurofuzzy system. The
classification performance was evaluated for the three
classes normal, myopathy and neuropathy with an
accuracy of 90% using neurofuzzy classifier. In the
above discussed works, EMG signal was mainly analysed
in time and frequency domain. We achieved two-class
classification with an accuracy of 91.2% using a simple
technique (Table V). This classification accuracy can be
further increased using more diverse features and more
EMG data in each group. The comparison should take
into consideration that different EMG analysis methods
may focus on different MVC levels or different muscles.
For this reason only qualitative comparisons and
conclusions can be drawn.
The proposed approach can provide a valuable tool to
neurophysiologists for MUAP classification. MUAPs
features are computed and the MUAPs can be classified
according to their pathology. The extracted information is
valuable for the patient diagnosis irrespective of the fact
that the results produced are based only on features
extracted from the MUAP. In clinical practice,
neurophysiologists make considerable use of patient’s
clinical data while performing diagnosis. Hence, further
research is needed on the effect of such clinical data on
the classification outcome.
TABLE V. COMPARISON OF OUR WORK WITH OTHER REPORTED
WORKS FOR MUAP CLASSIFICATION
Work Approach Type Accuracy (%)
Guler et al.(2005) Feature-based 85.4(3-class)
Katsis et al.(2007) Feature-based 88.7(3-class)
Istenic et al.(2010) Multiscale entropy, WT 80.5(2-class)
69.43(3-class)
Kocer et al.(2010) AR coefficients 90(3-class)
This work Feature-based 91.2(3-class)
V CONCLUSIONS
Muscle is a vital organ of the body responsible for
movements. Study on EMG is very broad starting from
the design of electrodes to recording techniques, analysis
methods and application for various purposes. Many
studies have been conducted in an attempt to characterize
different muscle disorders using traditional methods like
time and frequency domain analysis. In this work, an
integrated binary classifier based on SVM and modified
SVM and RBFNN has been adopted for differentiating
the neuromuscular disorders. Experimental results show
that the binary SVM ensemble classifier can be
effectively trained for MUAPs diagnosis. We have
managed to obtain an accuracy of 91.2%, sensitivity of
91.1%, specificity of 91.9% and PPV of 92.2%. The
diagnostic results could be further improved in future
works with larger data sets and utilizing other features
sets may be linear or nonlinear as an input to the SVM.
In the last, we can say that the method combines high
performance, interpretability of results, automated mode
of operation and small training set. It is therefore highly
suitable for a clinical decision support system, providing
a valuable tool to neurophysiologists for MUAP
classification.
ACKNOWLEDGEMENT
The author is thankful to Prof. C.S. Pattichis for
providing EMG Time Domain Feature Database. The
database has been downloaded from the website,
http://www.medinfo.cs.ucy.ac.cy/.
REFERENCES
[1] A. Subasi, M. Yilmaz, and H. R. Ozcalik, “Classification of
EMG signals using wavelet neural network,” Journal of Neuroscience Methods, vol. 156, pp. 360–367, 2006.
[2] M. Nikolic and C. Krarup, “EMG tools, an adaptive and versatile
tool for detailed EMG analysis,” IEEE Transactions on Biomedical Engineering, vol. 58, no. 10, October 2011.
[3] J. L. Coatrieux, P. Toulouse, B. Rouvraisand, and R. L. Bars,
“Automatic classification of electromyographic signals,” EEG Clin. Neurophysiol., vol. 55, pp. 333-341, 1983.
[4] S. Andreassen, S. K. Andersen, F. V. Jensen, M. Woldbye, A.
Rosenfalck, B. Falck, U. Kjaerluffand, and A. R. Sorensen, “MUNIN-An expert system for EMG,” Electroenceph. Clin.
Neurophvsiol, vol. 66, 1987.
[5] A. F. Frederiksen and S. M. Jeppesen, “A rule-based EMG expert system for diagnosing neuromuscular disorders,” in Computer
Aided Electromyography and Expert Systems, J. E. Desmedt, ed. New York: Elsevier Science Publishers B.V., 1987, pp. 289-296.
[6] R. P. Lippmann, “An introduction to computing with neural nets,”
IEEE ASSP Mag., 1987.
247
International Journal of Electronics and Electrical Engineering Vol. 2, No. 3, September, 2014
©2014 Engineering and Technology Publishing
[7] C. I. Christodoulou and C. S. Pattichis, “Unsupervised pattern recognition for the classification of EMG signals,” IEEE
Transactions on Biomedical Engineering, vol. 46, no. 2,
February 1999. [8] P. A. Kaplanis, C. S. Pattichis, C. I. Christodoulou, L. J.
Hadjileontiadis, V. C. Roberts, and T. Kyriakides, “A surface
electromyography classification system,” in IFMBE Proc. Medicon and Health Telematics 2004, X Mediterranean
Conference on Medical and Biological Engineering, vol. 6.
[9] U. R. Acharya, E. Y. K. Ng, G. Swapna, and Y. S. L. Michelle, “Classification of normal, neuropathic, and myopathic
electromyograph signals using nonlinear dynamics method,”
Journal of Medical Imaging and Health Informatics, vol. 1, pp. 375–380, 2011.
[10] C. D. Katsis, Y. Goletsis, A. Likas, D. I. Fotiadis, and I. Sarmas,
“A novel method for automated EMG decomposition and MUAP classification,” Artificial Intelligence in Medicine, vol. 37, pp.
55-64, 2006.
[11] A. F. Frederiksen, “The role of different EMG methods in
evaluating myopathy,” Clinical Neurophysiology, vol. 117, no. 6,
pp. 1173– 1189, 2006.
[12] W. Trojaborg, “Motor unit disorders and myopathies,” in A Textbook book of clinical Neurophysiology, M. A. Halliday, R. J.
Butler and R. Paul, Eds. New York: Wiley, 1987, pp. 417-438.
[13] C. S. Pattichis, C. N. Schizas, and L. T. Middleton, “Neural network models in EMG diagnosis,” IEEE Transactions on
Biomedical Engineering, vol. 42, no. 5. pp. 486-496, May 1995.
[14] V. P. Vapnik, The Nature of Statistical Learning Theory, Springer Verlag, New York, 1995.
[15] H. Kim, S. Pang, H. Je D. Kim, and S. Y. Bang, “Constructing
SVM ensemble,” Elseveir, vol. 36, no. 12, pp. 2757-2767, December 2003.
[16] M. Claesen, F. D. Smet, and B. D. Moor. (March 2013).
Ensemble SVM. [Online]. Available: http://esat. kuleuven.be/sista/ensemblesvm/
[17] R. C. Eberchart and R. W. Dobbins, Neural Network PC Tools: A Practical Guide, New York: Academic. 1990
[18] C. N. Schizas, C. S. Pattichis, and C. A. Bonsett, “Medical
diagnostic systems: A case for neural networks,” Technol., Health Care, vol. 2, pp. 1–18, 1994.
[19] N. F. Güler and S. Koçer, “Classification of EMG signals using
PCA and FFT,” Journal of Medical Systems, vol. 29, no. 3, pp. 241-250, June 2005.
[20] R. Istenic, P. A. Kaplanis, C. S. Pattichis, and D. Zazula,
“Multiscale entropybasedapproach to automated surface EMG classification of neuromuscular disorders,” Med BiolEngComput.
vol. 48, no. 8, pp. 773-781, August 2010.
[21] C. D. Katsis, T. P. Exarchos, C. Papaloukas, Y. Goletsis, D. I. Fotiadis, and I. Sarmas, “A two-stage method for MUAP
classification based on EMG decomposition,” Computers in
Biology and Medicine, vol. 37, no. 9, pp. 1232-1240, 2007. [22] S. Kocer, “Classification of EMG signals using neuro-fuzzy
system and diagnosis of neuromuscular diseases,” Journal of
Medical Systems, vol. 34, pp. 321-329, 2010.
Anjana Goen was born in India completed her graduation B.E.(Electronics & Telecommunication) in 1991 from Ranchi
University, India and her master degree M.Tech Telecom Technology
in 2008 from RGPV, India. Presently she is doing PhD in biomedical signal processing from Jiwaji University, Gwalior, India. She had 20
years of teaching experience. She served as lecturer in BIT Dhanbad
and MITS Gwalior. Since 2000, she is an Assistant Professor at RJIT, Tekanpur, Madhya Pradesh, India. She had published more than 5
papers in International Journals & Conferences. She had presented more
than 10 papers in International & National Conferences. Her interest lies in Digital Signal and Image processing and especially in biomedical
signal and image processing. Ms Goen is life member of IETE. She had
also been associated with CSI and ISTE, India.
248
International Journal of Electronics and Electrical Engineering Vol. 2, No. 3, September, 2014
©2014 Engineering and Technology Publishing


![A motion-classification strategy based on sEMG-EEG signal ... · trol [13, 14], where some non-EMG signals are combined to sEMG signals to realize a more precise extraction of motor](https://img.pdfslide.us/doc/110x75/5ec6b980e9f89714fb635aa7/a-motion-classification-strategy-based-on-semg-eeg-signal-trol-13-14-where.jpg)