Embed Size (px)
Citation preview
Aus dem Institut für Tierernährung
Universität Hohenheim
Prof. Dr. Markus Rodehutscord
Effects of monensin and tannin extract
supplementation on methane production and
other criteria of rumen fermentation in vitro and
in long-term studies with sheep
Dissertation
zur Erlangung des Grades eines Doktors
der Agrarwissenschaften
vorgelegt
der Fakultät Agrarwissenschaften
von
Dipl.-Ing. agr. Gerald Wischer
geboren in Haldensleben
2012

Die vorliegende Arbeit wurde am 17. Januar 2013 von der Fakultät Agrarwissenschaften der
Universität Hohenheim als „Dissertation zur Erlangung des Grades eines Doktors der
Agrarwissenschaften“ angenommen.
Tag der mündlichen Prüfung: 30. Januar 2013
In Vertretung der Dekanin: Prof. Dr. R. Mosenthin
Berichterstatter, 1. Prüfer: Prof. Dr. M. Rodehutscord
Mitberichterstatter, 2. Prüfer: Prof. Dr. K.-H. Südekum
3. Prüfer: Prof. Dr. L.E. Hölzle

This work was supported through a doctoral fellowship by the H. Wilhelm Schaumann Stiftung, Hamburg, Germany.


TABLE OF CONTENTS
1. INTRODUCTION .......................................................................................................................... 1
1.1. METHANOGENESIS IN THE RUMEN ............................................................................................ 1
1.2. STRATEGIES TO REDUCE METHANE RELEASE IN RUMINANTS ................................................... 2
1.3. MONENSIN ................................................................................................................................. 7
1.4. TANNINS .................................................................................................................................... 9
1.5. OBJECTIVES ............................................................................................................................. 11
2. STUDY 1 .................................................................................................................................. 17
3. STUDY 2 .................................................................................................................................. 41
4. STUDY 3 .................................................................................................................................. 65
5. GENERAL DISCUSSION ............................................................................................................ 95
5.1. COMPARISON OF IN VITRO STUDIES ......................................................................................... 96
5.2. COMPARISON OF IN VITRO AND IN VIVO STUDIES ................................................................... 102
5.3. IMPACTS ON MICROBIAL PROTEIN SYNTHESIS, UNDEGRADABLE PROTEIN AND
MICROBIAL FRACTIONS ......................................................................................................... 107
6. GENERAL CONCLUSIONS AND OUTLOOK ............................................................................... 119
7. SUMMARY ............................................................................................................................. 121
8. ZUSAMMENFASSUNG ............................................................................................................ 125

ABBREVIATIONS
with exception of abbreviations defined by the International System of Units (SI) and abbreviations used in chapters 2 – 4
ADF acid detergent fibre
BW body weight
CP crude protein
DM dry matter
NDF neutral detergent fibre
OM organic matter
SF6 sulphur hexafluoride tracer gas technique
VFA volatile fatty acids

LIST OF TABLES AND FIGURES
with exception of tables and figures used in chapters 2 – 4
Table I1. Feed additives and their presumed mechanism to reduce rumen methanogenesis, specifics need to be considered, supposed reduction potential and recommendations for further research. .............................................................................................................. 6
Figure I1. Possible pathways for methanogenesis in the rumen (Mitsumori and Sun, 2008). ............ 1
Figure I2. Strategies to reduce enteric methane release in ruminants (Eckard et al., 2010, modified). ............................................................................................................................ 2
Figure I3. Monensin effects on VFA production and hydrogen utilization and transfer in the rumen (Russell and Mantovani, 2002, modified). .............................................................. 7
Figure I4. Schematic diagram of tannin effects on protein metabolism in ruminants (Mueller-Harvey, 2006, modified). .................................................................................................... 9
Figure D1. Comparison of monensin and tannin extracts supplemented to 120 mg grass silage with regard to their effect on methane production (methane reduction expressed as difference to the respective control, based on results obtained using the Hohenheim Gas Test, Study 1 and 2). .................................................................................................. 97
Figure D2. Dosage of monensin and tannin extracts supplemented to 120 mg grass silage needed to reduce methane production by 10% (calculations based on results obtained using Hohenheim Gas Test, Study 1 and 2). .............................................................................. 98
Figure D3. Relationship between the maximal methane reduction without adverse effect on total gas production observed in the Hohenheim Gas Test and the amounts of total phenols (a) and tannin phenols (b) supplemented to 120 mg grass silage. ....................... 99
Figure D4. Relationship between the maximal methane reduction without adverse effect on total gas production observed in the Hohenheim Gas Test and the concentration of total phenols (a) and tannin phenols (b) analysed in tannin extracts. ....................................... 99


Chapter 1 Introduction
1
1. INTRODUCTION
1.1. METHANOGENESIS IN THE RUMEN
Methane emission from ruminants has received global attention because of its contribution to the
greenhouse effect and global warming. Methane represents an end product of fermentation of feed to
dispose of hydrogen produced by rumen microbes in the rumen (Figure I1). Reduced cofactors
generated during different fermentation processes are re-oxidised by dehydrogenation reactions that
accumulate hydrogen in the rumen (Martin et al., 2010). Methanogenic archaea (known as
methanogens) synthesize methane using carbon dioxide and hydrogen, which is produced mainly in
the formation of acetate, and in some cases formate (Wolin et al., 1997). The disposal of hydrogen
maintains the dehydrogenase activity involved in the regeneration processes resulting in a low
hydrogen partial pressure and therefore enhances rumen efficiency (Martin et al., 2010). As methane is
the predominant means of removing hydrogen then it may only be possible to partly reduce
methanogenesis. It is essential for ruminants to maintain the ability to provide high-grade food from a
diet based on roughages, thereby maintaining their central role as a major world nutrient supplier
(Chalupa, 1977).
Figure I1. Possible pathways for methanogenesis in the rumen (Mitsumori and Sun, 2008).
Rumen methanogenesis accounts for ~90 % of methane emission of ruminant origin (Murray et al.,
1976). The digestion of feed by rumen microbes (archaea, bacteria, protozoa and fungi) under
anaerobic conditions results in the production of volatile fatty acids (VFA), ammonia, carbon dioxide
and methane (Martin et al., 2010). Whereas VFA are utilised by the animal e.g. as energy source,

Chapter 1 Introduction
2
gases are eructated and cannot be utilised. With an energy content of 55.2 MJ/kg (Brouwer, 1965),
methane represents a loss of energy for the animal of about 8 to 10 % of gross energy intake (Johnson
and Johnson, 1995). Therefore, reducing methane emission in ruminants would also improve their feed
efficiency. In the subsequent chapter, a literature survey of the most important approaches to reduce
methane emission of ruminants is given.
1.2. STRATEGIES TO REDUCE METHANE RELEASE IN RUMINANTS
Many strategies to reduce enteric methane release of ruminants have been reviewed in the literature
(Beauchemin et al., 2008; Cottle et al., 2011; Eckard et al., 2010; Martin et al., 2010). Figure I2
presents an overview of the main strategies.
Figure I2. Strategies to reduce enteric methane release in ruminants (Eckard et al., 2010, modified).
Strategies to reduce methane release
Animal
Breeding
Product performance
Lifetime performance
Rumen
Vaccination
Defaunation
Diet
Feeding non-structural carbohydrates
Forage typeand quality
Ruminal bypass
Feed additives

Chapter 1 Introduction
3
Animal manipulation
Breeding
Because high variations in methane release were observed between dairy cows, heritable differences in
methanogenesis were suggested (Eckard et al., 2010). Thus, some approaches to reduce ruminal
methane release focus on animal breeding (Cottle et al., 2011). Direct measurements of methane
release from a large number of animals are required in order to conduct a genetic selection. Such
measurements require for instance respiration chambers which are expensive and therefore the
selection against methane release. Consequently, other phenotypes are used as approximations (de
Haas et al., 2011), e.g. residual feed intake or the estimated methane release (IPCC, 2006). It also
remains open to question, as to what extent this goal is correlated with other breeding goals.
Improvements in product and lifetime performance
Other approaches deal with improvements in performance (e.g. more daily gain of beef cattle; Shibata
and Terada, 2010), which can reduce methane release per unit of product. Further improvements such
as extending the productive life of dairy cows in a sustainable way via an improved fertility would
reduce the need for heifers required for herd replacement (Garnsworthy, 2004). Because less heifers
are needed to produce the similar amount of milk, the on-farm emission per unit of product will be
further decreased (Eckard et al., 2010).
Rumen manipulation
Vaccination
Techniques to manipulate the rumen include different strategies. One of the approaches aims at the
stimulation of the animal’s immune system to elicit an immune response and distribute antibodies
against methanogens. In sheep vaccinated against methanogens, concentration of antibodies against
methanogens increased significantly after vaccination (Baker, 1999). Wright et al. (2004) achieved a
significant reduction in methane release in sheep of 8% using this immunization strategy, although the
results were not repeatable with subsequent vaccine preparations. It remains unclear whether it is
possible to develop a vaccine with persistent effects on methanogens.

Chapter 1 Introduction
4
Defaunation
Protozoa provide a habitat for 10 to 20% of rumen methanogens and produce acetate and butyrate as
substrates for methanogenesis (Stumm et al., 1982). The elimination of protozoa (defaunation) was
therefore considered to reduce methane release. If defaunation is done in a dietary way (e.g. low pH)
there is a strong risk of ruminal acidosis (Kreuzer and Kirchgessner, 1987). There are several
strategies for eliminating rumen protozoa. It is possible to get defaunated animals with a consequently
lower methane production, when they are isolated as new-borns from other ruminants (Faichney et al.,
1999). Hegarty (1999) reviewed further possibilities to eliminate protozoa by the use of synthetic
chemicals (e.g. copper sulphate or calcium peroxide), natural compounds (e.g. vitamin A, non-protein
amino acids and steroidal hormones) or biological agents (e.g. fungi, bacteriocins). Hegarty (1999)
also mentioned that in the absence of rumen protozoa the methane release was reduced across a range
of diets on average by 13%. A persistent effect of defaunation on methane release has however not
been demonstrated (Ranilla et al., 2004). Furthermore, there are indications that defaunated animals
have a reduced total tract nutrient digestibility (Eugène et al., 2010).
Dietary manipulation
Feeding diets based on non-structural carbohydrates
It is well known that feeding diets with higher grain contents result in less methane per kg dry matter
(DM) compared with forage-based diets (Blaxter and Clapperton, 1965). The inclusion of starchy
feeds can lower rumen pH and enhance the production of propionate resulting in a lower methane
release (Johnson and Johnson, 1995). The percentage of gross energy intake converted to methane of
diets consisting primarily of grains is typically less than 4% compared with 6.5% or more for diets
consisting mainly of forages (Beauchemin and McGinn, 2005). Using high contents of concentrates in
diets of dairy cattle is however limited, because rumen pH, milk quality and animal health are
negatively affected by an excessive concentrate content in the diet (Beauchemin et al., 2008).
Forage type and quality
The type (forage or grain) and the quality of forages (lower fibre or higher contents of soluble
carbohydrates) can affect methane production (Beauchemin et al., 2009). Improving forage type and
quality can also increase the voluntary feed intake, which consequently reduces retention time in the
rumen and partly shifts digestion from the rumen to the lower gut (Eckard et al., 2010). The digestion
of starch and protein in the small intestine is characterized to be more efficient compared to rumen
fermentation, resulting in a reduced conversion of feed energy to methane (Blaxter and Clapperton,
1965). Lower methane release observed for legume-based diets is often explained, in addition to the
higher feed intake, by the presence of secondary plant metabolites (e.g. tannins and saponins) or a

Chapter 1 Introduction
5
lower fibre content (Beauchemin et al., 2008). C4-plants often have a greater methane producing
potential compared to C3-plants, because of their relatively high cell wall content (Ulyatt et al., 2002).
Ruminal bypass
The use of feedstuffs with nutrients that are known to be digested in the small intestine instead of
being fermented in the rumen constitutes a further opportunity to reduce rumen methanogenesis
(Cone, 1991; McAllister et al., 1993). This is mainly due to their native structure or technical
treatments such as pressure and heat (Leberl, 2009). Bypass substances such as starch in maize or
sorghum are to a lesser degree rumen degradable compared to other grains (Orskov, 1986), and deliver
therefore less hydrogen as substrate for rumen methanogenesis. As pointed out by Leberl (2009)
bypass protein seems less important compared to bypass starch, because it was supposed that the
population of archaea remains unaffected by bypass protein, as long as the rumen microbes are not
undersupplied with nitrogen.
Feed additives
Feed additives have been comprehensively studied in vitro and in vivo for their methane mitigating
potential. Due to their different origin and chemical structures, it is assumed that they have different
modes of action (Bodas et al., 2012; Patra and Saxena, 2009). Therefore, local conditions on farm can
be considered by selecting the most suitable additive. Investigations of strategies which combine
different additives in a rotation, or combinations are however lacking. The different additives can be
classified mainly to one of the following groups: lipids, ionophores, secondary plant compounds and
organic acids. Lipids and secondary plant compounds can also be naturally feed ingredients, e.g. diets
consisting of sun flower seeds or clover. Table I1 gives an overview of feed additives and their
presumed mode of action to reduce rumen methanogenesis. In the following chapters, the mode of
action and the influences on rumen methanogenesis of monensin, an ionophore, and tannins,
secondary plant compounds, are described in more detail.

Chapter 1 Introduction
6
Tab
le I
1. F
eed
addi
tive
s an
d th
eir
pres
umed
mec
hani
sm t
o re
duce
rum
en m
etha
noge
nesi
s, s
peci
fics
nee
d to
be
cons
ider
ed,
supp
osed
red
ucti
on p
oten
tial
and
re
com
men
dati
ons
for
furt
her
rese
arch
. G
rou
p
E
xam
ple
s M
ech
anis
m o
f m
eth
ane
red
uct
ion
S
pec
ific
s n
eed
to
be
con
sid
ered
S
up
pos
ed r
edu
ctio
n
pot
enti
al in
viv
o N
eed
for
fu
rth
er
inve
stig
atio
ns
Ref
eren
ces
for
furt
her
re
adin
gs
Lip
ids
F
atty
aci
ds
O
ils
Red
uced
act
ivit
y of
m
etha
noge
ns a
nd p
roto
zoa;
de
crea
sed
orga
nic
mat
ter
ferm
enta
tion
; enh
ance
d pr
opio
nate
pro
duct
ion;
bi
ohyd
roge
nati
on o
f fa
tty
acid
s
Tot
al f
at s
houl
d no
t ex
ceed
6 %
of
diet
ary
DM
~ 25
%
Lon
g-te
rm e
ffec
ts o
n m
etha
ne
and
com
posi
tion
of
mic
robi
al
com
mun
ity,
mic
robi
al p
rote
in
synt
hesi
s, f
erti
lity
Bea
uche
min
et a
l., 2
008;
H
ook
et a
l., 2
010;
Joh
nson
an
d Jo
hnso
n, 1
995
Ion
oph
ores
Mon
ensi
n
Inhi
bitio
n of
Gra
m-p
osit
ive
bact
eria
and
pro
tozo
a;
enha
nced
pro
pion
ate
prod
ucti
on; l
ack
of s
ubst
rate
fo
r m
etha
noge
ns; i
mpr
oved
fe
ed e
ffic
ienc
y
Ban
ned
in th
e E
U;
mic
robe
s m
ay
adap
t
~ 30
%
Lon
g-te
rm e
ffec
ts o
n m
etha
ne
and
com
posi
tion
of
mic
robi
al
com
mun
ity,
mic
robi
al p
rote
in
synt
hesi
s
Gua
n et
al.,
200
6; H
ook
et
al.,
2010
; Joh
nson
and
Jo
hnso
n, 1
995
Sec
ond
ary
pla
nt
com
pou
nd
s
Tan
nins
Sap
onin
s
Ess
enti
al o
ils
Ant
imic
robi
al a
ctiv
ity;
re
duce
d hy
drog
en
avai
labi
lity
Hig
h va
riat
ion;
op
tim
um d
ose
unkn
own;
may
af
fect
dig
esti
bili
ty
~ 29
%
Lon
g-te
rm e
ffec
ts o
n m
etha
ne
and
com
posi
tion
of
mic
robi
al
com
mun
ity,
mic
robi
al p
rote
in
synt
hesi
s, c
ompa
riso
n be
twee
n in
vit
ro a
nd in
viv
o, u
se o
f m
ore
defi
ned
subs
tanc
es
Bea
uche
min
et a
l., 2
007;
C
arul
la e
t al.,
200
5; H
ook
et a
l., 2
010;
Puc
hala
et a
l.,
2005
Org
anic
aci
ds
F
umar
ate
M
alat
e
Alt
erna
tive
hyd
roge
n si
nk;
enha
nced
pro
pion
ate
prod
ucti
on
May
aff
ect
dige
stib
ility
~
10 %
L
ong-
term
eff
ects
on
met
hane
an
d co
mpo
siti
on o
f m
icro
bial
co
mm
unit
y, m
icro
bial
pro
tein
sy
nthe
sis
Alu
won
g et
al.,
201
1; C
lark
et
al.,
201
1; H
ook
et a
l.,
2010

Chapter 1 Introduction
7
1.3. MONENSIN
Monensin is the most commonly used ionophore in ruminant nutrition and was originally developed as
a coccidiostat in poultry (Chapman et al., 2010). Later investigations showed that monensin also had
properties to manipulate rumen fermentation. These effects included an increased propionate
production at the expense of acetate (Figure I3) and a decreased protein degradation to ammonia
(Richardson et al., 1976; Wallace et al., 1981). These effects are mainly responsible for improvements
in feed efficiency and weight gain observed in feedlot cattle (Goodrich et al., 1984). Monensin can
also be used to increase milk production and decrease milk fat synthesis in dairy cattle (Sauer et al.,
1998). Monensin is therefore able to reduce methane release in ruminants by improvements in product
performance by an increased milk production and increased daily gain in dairy and beef cattle,
respectively.
Figure I3. Monensin effects on VFA production and hydrogen utilization and transfer in the rumen (Russell and Mantovani, 2002, modified).
Chapter 1 Introduction
8
Monensin’s mode of action is generally characterized by a dissipation of ion gradients of Gram-
positive bacteria (Russell, 1987). Through this inhibition less substrate is provided for
methanogenesis, as propionate producers (Gram-negative bacteria) are favoured (Bergen and Bates,
1984). While a lasting propionate enhancing effect of monensin supplementation could be confirmed
in different studies (Mbanzamihigo et al., 1996; Richardson et al., 1976), the effects on methane
release varied with respect to extent and persistence of the effects from transient (Carmean and
Johnson, 1990) to long-lasting (6 months, Odongo et al., 2007). There is no evidence that ionophores
directly affect methanogenesis, but it is likely that these effects are due to the impact on protozoa
population (Hook et al., 2010) and feed intake (Goodrich et al., 1984). In a long-term monensin
supplementation trial with dairy cattle conducted by Odongo et al. (2007) a sustained reduction in
methane production of 7 to 9% was found, however no significant differences in the number and
diversity of methanogens were reported in same experiment (Hook et al., 2009). It is possible that the
discrepancies among the studies with regard to the effect on methane release are due to the diets used,
which affect microbial population in the rumen. Moreover, a decrease in feed intake and DM
digestibility often observed upon monensin supplementation may be responsible for the lower methane
release (Poos et al., 1979; Raun et al., 1976). Another important aspect in ruminant nutrition is the
protein supply by rumen microbes. The effects of monensin on microbial protein synthesis described
in the literature are also inconsistent and appear to be diet dependent (Schelling, 1984). The microbial
protein synthesis is of particular importance because it accounts to up to 80% to the protein supply at
the duodenum of ruminants (Storm and Orskov, 1983). Further investigations are needed to verify
whether monensin is able to reduce methane production without adverse effects on rumen
fermentation, and to clarify its effect on microbial protein synthesis on the basis of commonly used
feedstuffs in ruminant production, particularly grass and maize silages.
Since 2006 the use of monensin in the EU is limited as a coccidiostat in poultry production (EC,
2003). Therefore, several studies have been initiated to find alternatives for monensin to improve
rumen fermentation (Bodas et al., 2008; Busquet et al., 2005; Selje et al., 2007). These studies have
focused on plant extracts rich in total and tannin phenols. In the subsequent chapter, the mode of
action of tannins and their potential to reduce rumen methanogenesis is specified.

Chapter 1 Introduction
9
1.4. TANNINS
Recently, tannins have been increasingly investigated as a means to reduce the methane emission of
ruminants, because they are considered to represent promising substances to reduce rumen
methanogenesis (Animut et al., 2008; Bhatta et al., 2009; Carulla et al., 2005). Tannins are secondary
plant compounds with various molecular weights and are chemically not well-defined (Jayanegara et
al., 2012). Based on their molecular structure they have the ability to bind natural polymers and are
classified into hydrolysable (polyesters of gallic acid and various sugars) and condensed tannins
(polymers of flavonoids). There are also some tannins that represent a combination of the two
structures (McSweeney et al., 2001). Mueller-Harvey (2006) summarized the beneficial and
detrimental effects of tannins in ruminant nutrition. One of the main benefits is their effect on protein
digestion. Some tannins can reduce the amount of protein degraded in the rumen and enhance the
protein supply to the lower gut and to the animal (McSweeney et al., 2001; Waghorn et al., 1987),
provided that the bypass protein is at least partly digestible in the intestine. Generally, feeding tannins
results in a lower urinary nitrogen and a higher faecal nitrogen excretion (Figure I4). Based on in vitro
experiments, it is suggested that stable tannin-protein complexes built in the rumen at pH 6 to 7 are
dissolved by pH shifts in the abomasum (pH < 3.5) or the small intestine (pH > 7) (Jones and Mangan,
1977). These tannin effects can result in faster growth rates of wool and bodyweight (BW), higher
milk yields, increased fertility, and an improved animal welfare and health by preventing infections of
internal parasites or bloat (Mueller-Harvey, 2006). On the other side it has also been demonstrated that
feed intake, protein and DM digestibility, BW gain, milk yield and wool growth can be affected
negatively by tannins (Jansman, 1993; Kumar and Singh, 1984; Reed, 1995). Both, beneficial and
detrimental effects can also be regarded as being dose-dependent (Mueller-Harvey, 2006).
Figure I4. Schematic diagram of tannin effects on protein metabolism in ruminants (Mueller-Harvey, 2006, modified).
Chapter 1 Introduction
10
There are several in vitro and in vivo studies that describe a methane inhibiting effect of tannins
(Jayanegara et al., 2012). To omit detrimental effects to the animal, it is necessary that rumen
fermentation and further digestion processes are not disturbed. Prior to animal studies, in vitro studies
are useful to screen different tannin products for their effects on methane and identify the most
effective ones. Special attention should be given to indicators of rumen fermentation and digestibility,
because the supplementation of tannins often decreases digestibility [e.g. of crude protein (CP),
neutral detergent fibre (NDF) and acid detergent fibre (ADF)] and tends to decrease total VFA
production (Patra, 2010). But it is even more important that these compounds are, in the next steps,
also investigated over a longer period of time in animal studies (Flachowsky and Lebzien, 2012).
Information about tannin effects on microbial protein synthesis is rare and the existing studies have
provided inconsistent results (Carulla et al., 2005; Makkar et al., 1995).

Chapter 1 Introduction
11
1.5. OBJECTIVES
To summarize, further investigations are needed to verify whether monensin is able to reduce methane
production without negative consequences on rumen fermentation based on commonly used feedstuffs
such as grass and maize silages. Tannins are also known to affect rumen methanogenesis, but in
contrast to monensin they are not well defined. A comprehensive assessment of the effects of tannins
on rumen fermentation is also lacking.
The first objective of this thesis was to investigate the effect of monensin supplementation to grass
silage combined with or without concentrates on the production of total gas, methane, and VFA and on
the degradation of crude nutrients and the synthesis of microbial protein. Additionally, concentrations
of monensin should be defined for a maximal methane reduction without adverse effects on
fermentation of grass and maize silage (Study 1).
The second objective was to screen ten tannin extracts and four monomers of rapeseed tannin to find
their maximum methane reduction with an unchanged fermentation of grass silage (Study 2). The most
promising tannin substances selected this way were then investigated for their longer-term effects on
degradation of nutrients and microbial protein synthesis (Study 2).
The third objective was to determine the long-term effects of the most promising tannin substances
selected from the in vitro studies on the methane release in sheep when measured over 190 and 85 d
using respiration chambers. For a more detailed assessment the consequences on digestibility, energy
metabolism, nitrogen excretion and microbial protein synthesis were also investigated (Study 3).

Chapter 1 Introduction
12
REFERENCES
used in chapter 1
Aluwong, T., P. A. Wuyep, and L. Allam. 2011. Livestock-environment interactions: Methane emissions from ruminants. African Journal of Biotechnology 10:1265-1269.
Animut, G., R. Puchala, A. L. Goetsch, A. K. Patra, T. Sahlu, V. H. Varel, and J. Wells. 2008. Methane emission by goats consuming diets with different levels of condensed tannins from lespedeza. Animal Feed Science and Technology 144:212-227.
Baker, S. K. 1999. Biology of rumen methanogens, and the stimulation of animal immunity. Meeting the Kyoto Target. Implications for the Australian Livestock Industries 41-49.
Beauchemin, K. A., M. Kreuzer, F. O'Mara, and T. A. McAllister. 2008. Nutritional management for enteric methane abatement: A review. Australian Journal of Experimental Agriculture 48:21-27.
Beauchemin, K. A., T. A. McAllister, and S. M. McGinn. 2009. Dietary mitigation of enteric methane from cattle. CAB Reviews: Perspectives in Agriculture, Veterinary Science, Nutrition and Natural Resources 4:1-18.
Beauchemin, K. A. and S. M. McGinn. 2005. Methane emissions from feedlot cattle fed barley or corn diets. Journal of Animal Science 83:653-661.
Beauchemin, K. A., S. M. McGinn, T. F. Martinez, and T. A. McAllister. 2007. Use of condensed tannin extract from quebracho trees to reduce methane emissions from cattle. Journal of Animal Science 85:1990-1996.
Bergen, W. G. and D. B. Bates. 1984. Ionophores: Their effect on production efficiency and mode of action. Journal of Animal Science 58:1465-1483.
Bhatta, R., Y. Uyeno, K. Tajima, A. Takenaka, Y. Yabumoto, I. Nonaka, O. Enishi, and M. Kurihara. 2009. Difference in the nature of tannins on in vitro ruminal methane and volatile fatty acid production and on methanogenic archaea and protozoal populations. Journal of Dairy Science 92:5512-5522.
Blaxter, K. L. and J. L. Clapperton. 1965. Prediction of the amount of methane produced by ruminants. British Journal of Nutrition 19:511-522.
Bodas, R., S. López, M. Fernández, R. García-González, A. B. Rodríguez, R. J. Wallace, and J. S. González. 2008. In vitro screening of the potential of numerous plant species as antimethanogenic feed additives for ruminants. Animal Feed Science and Technology 145:245-258.
Bodas, R., N. Prieto, R. García-González, S. Andrés, F. J. Giráldez, and S. López. 2012. Manipulation of rumen fermentation and methane production with plant secondary metabolites. Animal Feed Science and Technology (In press).
Brouwer, E. 1965. Report of sub-committee on constants and factors. In 'Energy metabolism'. (Ed. KL Blaxter). Academic Press, London, UK.
Busquet, M., S. Calsamiglia, A. Ferret, and C. Kamel. 2005. Screening for effects of plant extracts and active compounds of plants on dairy cattle rumen microbial fermentation in a continuous culture system. Animal Feed Science and Technology 123-124 PART 2:597-613.
Carmean, B. R. and D. E. Johnson. 1990. Persistence of monensin-induced changes in methane emissions and ruminal protozoa numbers in cattle. Journal of Animal Science 65:517.

Chapter 1 Introduction
13
Carulla, J. E., M. Kreuzer, A. Machmüller, and H. D. Hess. 2005. Supplementation of Acacia mearnsii tannins decreases methanogenesis and urinary nitrogen in forage-fed sheep. Australian Journal of Agricultural Research 56:961-970.
Chalupa, W. 1977. Manipulating rumen fermentation. Journal of Animal Science 45:585-599.
Chapman, H. D., T. K. Jeffers, and R. B. Williams. 2010. Forty years of monensin for the control of coccidiosis in poultry. Poultry Science 89:1788-1801.
Clark, H., F. Kelliher, and C. Pinares-Patino. 2011. Reducing CH4 emissions from grazing ruminants in New Zealand: Challenges and opportunities. Asian-Australasian Journal of Animal Sciences 24:295-302.
Cone, J. W. 1991. Degradation of starch in feed concentrates by enzymes, rumen fluid and rumen enzymes. Journal of the Science of Food and Agriculture 54:23-34.
Cottle, D. J., J. V. Nolan, and S. G. Wiedemann. 2011. Ruminant enteric methane mitigation: A review. Animal Production Science 51:491-514.
de Haas, Y., J. J. Windig, M. P. L. Calus, J. Dijkstra, M. de Haan, A. Bannink, and R. F. Veerkamp. 2011. Genetic parameters for predicted methane production and potential for reducing enteric emissions through genomic selection. Journal of Dairy Science 94:6122-6134.
EC. 2003. Regulation (EC) No 1831/2003 of the European Parliament and of the council of 22 September 2003 on additives for use in animal nutrition. Official Journal of the European Union, http://irmm.jrc.ec.europa.eu/SiteCollectionDocuments/EC-1831-2003.pdf (accessed on 30 April 2012).
Eckard, R. J., C. Grainger, and C. A. M. de Klein. 2010. Options for the abatement of methane and nitrous oxide from ruminant production: A review. Livestock Science 130:47-56.
Eugène, M., D. Sauvant, J. L. Weisbecker, and H. Archimède. 2010. Effects of defaunation on digestion of fresh digitaria decumbens grass and growth of lambs. Animal 4:439-445.
Faichney, G. J., N. M. Graham, and D. M. Walker. 1999. Rumen characteristics, methane emissions, and digestion in weaned lambs reared in isolation. Australian Journal of Agricultural Research 50:1083-1089.
Flachowsky, G. and P. Lebzien. 2012. Effects of phytogenic substances on rumen fermentation and methane emissions: A proposal for a research process. Animal Feed Science and Technology (In Press).
Garnsworthy, P. C. 2004. The environmental impact of fertility in dairy cows: a modelling approach to predict methane and ammonia emissions. Animal Feed Science and Technology 112:211-223.
Goodrich, R. D., J. E. Garrett, D. R. Gast, M. A. Kirick, D. A. Larson, and J. C. Meiske. 1984. Influence of monensin on the performance of cattle. Journal of Animal Science 58:1484-1498.
Guan, H., K. M. Wittenberg, K. H. Ominski, and D. O. Krause. 2006. Efficacy of ionophores in cattle diets for mitigation of enteric methane. Journal of Animal Science 84:1896-1906.
Hegarty, R. S. 1999. Reducing rumen methane emissions through elimination of rumen protozoa. Australian Journal of Agricultural Research 50:1321-1327.
Hook, S. E., K. S. Northwood, A.-D. G. Wright, and B. W. McBride. 2009. Long-term monensin supplementation does not significantly affect the quantity or diversity of methanogens in the rumen of the lactating dairy cow. Applied and Environmental Microbiology 75:374-380.
Chapter 1 Introduction
14
Hook, S. E., A. D. G. Wright, and B. W. McBride. 2010. Methanogens: Methane producers of the rumen and mitigation strategies. Archaea 2010:1-11.
IPCC. 2006. (Intergovernmental Panel on Climate Change). Guidelines for National Greenhouse Gas Inventories. Vol. 4. Agriculture, Forestry and Other Land Use. Ch. 10. Emissions from Livestock and Manure Management:1–87.
Jansman, A. J. M. 1993. Tannins in feedstuffs for simple-stomached animals. Nutrition Research Reviews 6:209-236.
Jayanegara, A., F. Leiber, and M. Kreuzer. 2012. Meta-analysis of the relationship between dietary tannin level and methane formation in ruminants from in vivo and in vitro experiments. Journal of Animal Physiology and Animal Nutrition 96:365-375.
Johnson, K. A. and D. E. Johnson. 1995. Methane emissions from cattle. Journal of Animal Science 73:2483-2492.
Jones, W. T. and J. L. Mangan. 1977. Complexes of the condensed tannins of sainfoin (Onobrychis viciifolia scop.) with fraction 1 leaf protein and with submaxillary mucoprotein, and their reversal by polyethylene glycol and pH. Journal of the Science of Food and Agriculture 28:126-136.
Kreuzer, M. and M. Kirchgessner. 1987. Untersuchungen zur nutritiven Defaunierung des Pansens beim Wiederkäuer. Archiv für Tierernaehrung 37:489-503.
Kumar, R. and M. Singh. 1984. Tannins: Their adverse role in ruminant nutrition. Journal of Agricultural and Food Chemistry 32:447-453.
Leberl, P. 2009. Einfluss verschiedener Faktoren der Stickstoffversorgung auf den Stickstoff- und Energieumsatz sowie die Methanproduktion beim Wiederkäuer. Doctoral thesis, University of Hohenheim.
Makkar, H. P., M. Blümmel, and K. Becker. 1995. In vitro effects of and interactions between tannins and saponins and fate of tannins in the rumen. Journal of the Science of Food and Agriculture 69:481-493.
Martin, C., D. P. Morgavi, and M. Doreau. 2010. Methane mitigation in ruminants: from microbe to the farm scale. Animal 4:351-365.
Mbanzamihigo, L., C. J. van Nevel, and D. I. Demeyer. 1996. Lasting effects of monensin on rumen and caecal fermentation in sheep fed a high grain diet. Animal Feed Science and Technology 62:215-228.
McAllister, T. A., R. C. Phillippe, L. M. Rode, and K. J. Cheng. 1993. Effect of the protein matrix on the digestion of cereal grains by ruminal microorganisms. Journal of Animal Science 71:205-212.
McSweeney, C. S., B. Palmer, D. M. McNeill, and D. O. Krause. 2001. Microbial interactions with tannins: Nutritional consequences for ruminants. Animal Feed Science and Technology 91:83-93.
Mitsumori, M. and W. Sun. 2008. Control of rumen microbial fermentation for mitigating methane emissions from the rumen. Asian-Australasian Journal of Animal Sciences 21:144-154.
Mueller-Harvey, I. 2006. Unravelling the conundrum of tannins in animal nutrition and health. Journal of the Science of Food and Agriculture 86:2010-2037.
Murray, R. M., A. M. Bryant, and R. A. Leng. 1976. Rates of production of methane in the rumen and large intestine of sheep. British Journal of Nutrition 36:1-14.

Chapter 1 Introduction
15
Odongo, N. E., R. Bagg, G. Vessie, P. Dick, M. M. Or-Rashid, S. E. Hook, J. T. Gray, E. Kebreab, J. France, and B. W. McBride. 2007. Long-term effects of feeding monensin on methane production in lactating dairy cows. Journal of Dairy Science 90:1781-1788.
Orskov, E. R. 1986. Starch digestion and utilization in ruminants. Journal of Animal Science 63:1624-1633.
Patra, A. K. 2010. Meta-analyses of effects of phytochemicals on digestibility and rumen fermentation characteristics associated with methanogenesis. Journal of the Science of Food and Agriculture 90:2700-2708.
Patra, A. K. and J. Saxena. 2009. The effect and mode of action of saponins on the microbial populations and fermentation in the rumen and ruminant production. Nutrition Research Reviews 22:204-219.
Poos, M. I., T. L. Hanson, and T. J. Klopfenstein. 1979. Monensin effects on diet digestibility, ruminal Protein bypass and microbial protein synthesis. Journal of Animal Science 48:1516-1524.
Puchala, R., B. R. Min, A. L. Goetsch, and T. Sahlu. 2005. The effect of a condensed tannin-containing forage on methane emission by goats. Journal of Animal Science 83:182-186.
Ranilla, M. J., D. P. Morgavi, and J. P. Journay. 2004. Effect of time after defaunation on methane production in vitro. Reproduction Nutrition Development Suppl 1:35-S36.
Raun, A. P., C. O. Cooley, E. L. Potter, R. P. Rathmacher, and L. F. Richardson. 1976. Effect of monensin on feed efficiency of feedlot cattle. Journal of Animal Science 43:670-677.
Reed, J. D. 1995. Nutritional toxicology of tannins and related polyphenols in forage legumes. Journal of Animal Science 73:1516-1528.
Richardson, L. F., A. P. Raun, E. L. Potter, C. O. Cooley, and R. P. Rathmacher. 1976. Effect of monensin on rumen fermentation in vitro and in vivo. Journal of Animal Science 43:657-664.
Russell, J. B. 1987. A proposed mechanism of monensin action in inhibiting ruminant bacterial growth: Effects on ion flux and protonmotive force. Journal of Animal Science 64:1519-1525.
Russell, J. B. and H. C. Mantovani. 2002. The bacteriocins of ruminal bacteria and their potential as an alternative to antibiotics. Journal of Molecular Microbiology and Biotechnology 4:347-355.
Sauer, F. D., V. Fellner, R. Kinsman, J. K. Kramer, H. A. Jackson, A. J. Lee, and S. Chen. 1998. Methane output and lactation response in Holstein cattle with monensin or unsaturated fat added to the diet. Journal of Animal Science 76:906-914.
Schelling, G. T. 1984. Monensin mode of action in the rumen. Journal of Animal Science 58:1518-1527.
Selje, N., E. M. Hoffmann, S. Muetzel, R. Ningrat, R. J. Wallace, and K. Becker. 2007. Results of a screening programme to identify plants or plant extracts that inhibit ruminal protein degradation. British Journal of Nutrition 98:45-53.
Shibata, M. and F. Terada. 2010. Factors affecting methane production and mitigation in ruminants. Animal Science Journal 81:2-10.
Storm, E. and E. R. Orskov. 1983. The nutritive value of rumen micro-organisms in ruminants. I. Large-scale isolation and chemical composition of rumen micro-organisms. British Journal of Nutrition 50:463-470.

Chapter 1 Introduction
16
Stumm, C. K., H. J. Gijzen, and G. D. Vogels. 1982. Association of methanogenic bacteria with ovine rumen ciliates. British Journal of Nutrition 47:95-99.
Ulyatt, M. J., K. R. Lassey, I. D. Shelton, and C. F. Walker. 2002. Methane emission from dairy cows and wether sheep fed subtropical grass-dominant pastures in midsummer in New Zealand. New Zealand Journal of Agricultural Research 45:227-234.
Waghorn, G. C., M. J. Ulyatt, A. John, and M. T. Fisher. 1987. The effect of condensed tannins on the site of digestion of amino acids and other nutrients in sheep fed on Lotus corniculatus L. British Journal of Nutrition 57:115-126.
Wallace, R. J., J. W. Czerkawski, and G. Breckenridge. 1981. Effect of monensin on the fermentation of basal rations in the Rumen Simulation Technique (Rusitec). British Journal of Nutrition 46:131-148.
Wolin, M. J., T. L. Miller, and C. S. Stewart. 1997. Microbe-microbe interactions. The Rumen Microbial Ecosystem 467-491.
Wright, A. D. G., P. Kennedy, C. J. O'Neill, A. F. Toovey, S. Popovski, S. M. Rea, C. L. Pimm, and L. Klein. 2004. Reducing methane emissions in sheep by immunization against rumen methanogens. Vaccine 22:3976-3985.

Chapter 2 Study 1
17
2. STUDY 1
EFFECT OF MONENSIN ON IN VITRO FERMENTATION OF SILAGES
AND MICROBIAL PROTEIN SYNTHESIS
G. Wischer1, J. Boguhn1, H. Steingaß1, M. Schollenberger1, K. Hartung2 and M. Rodehutscord1
1Institut für Tierernährung, Universität Hohenheim, Emil-Wolff-Str. 10, 70599 Stuttgart, Germany 2Institut für Kulturpflanzenwissenschaften, Fachgebiet Bioinformatik, Universität Hohenheim,
Fruwirthstr. 23, 70599 Stuttgart, Germany
Submitted to Archives of Animal Nutrition
Chapter 2 Study 1
18
Effect of monensin on in vitro fermentation of silages and microbial protein synthesis
Gerald Wischer1, Jeannette Boguhn1, Herbert Steingaß1, Margit Schollenberger1, Karin Hartung2 and Markus Rodehutscord1,*
1Institut für Tierernährung, Universität Hohenheim, 70599 Stuttgart, Germany
2Institut für Kulturpflanzenwissenschaften, Fachgebiet Bioinformatik, Universität Hohenheim, 70599 Stuttgart, Germany
*Corresponding author: [email protected]
Chapter 2 Study 1
19
ABSTRACT
The ionophore monensin is known to improve feed conversion in ruminants. Although silage is
commonly fed to ruminants, the effects of monensin on rumen fermentation of silages and on
microbial protein synthesis have not been studied. It is also unknown whether monensin reduces
methane formation without adverse effects on other processes of rumen fermentation. The objective
was to investigate the effects on monensin on silage fermentation and microbial protein synthesis in
two in vitro experiments. In Experiment 1, monensin (0.5, 1, 2, 4, 6, or 10 µg) was added to syringes
(n = 8 replicates per treatment) that contained 120 mg of grass silage (GS), GS+concentrate (C), or
maize silage (MS), resulting in concentrations of 4.2, 8.3, 16.7, 33.3, 50.0, and 83.3 mg/kg feed. The
samples were incubated for 24 h to determine the monensin concentration that resulted in the
maximum reduction in methane production without adverse effects on total gas production. In
Experiment 2, GS and GS+C were incubated in a Rusitec to assess the effects of monensin (133 and
266 mg/kg feed, n = 4 replicates per treatment) on the production of total gas, methane and volatile
fatty acids (VFA), degradation of nutrients, and microbial protein synthesis. In Experiment 1, methane
production was reduced without significant adverse effects on total gas production up to certain
inclusions of monensin; the reductions were 17% (GS), 10% (GS+C), and 13% (MS) with 16.7 (GS),
50.0 (GS+C), and 33.3 (MS) mg monensin/kg feed. Monensin reduced the total gas and methane
production in GS and GS+C in Experiment 2. Propionate production was enhanced by monensin,
accompanied by a decrease in acetate production. Along with a reduction in crude protein degradation,
monensin reduced the ammonia nitrogen concentration in the effluent of vessels containing GS or
GS+C. While the protein produced by liquid-associated microbes increased in the samples incubated
with monensin, protein production by solid-associated microbes was reduced. Total microbial protein
synthesis increased in the presence of monensin. Monensin influenced the production of total gas,
methane, and VFA from the silages without a strong effect on the degradation of organic matter.
Different microbial fractions were affected differently by monensin supplementation. If monensin is
used as a tool to reduce methane emission, the supplementation level must be carefully chosen to
avoid negative effects on overall fermentation in the rumen.
Key Words: monensin, silage, microbial protein synthesis, methane, in vitro

Chapter 2 Study 1
20
INTRODUCTION
The ionophore monensin is used as a feed additive to increase the efficiency of feed conversion in
ruminants. Monensin is highly effective against Gram-positive bacteria, resulting in reduced hydrogen
formation (Russell and Strobel, 1989). The main effects consistently observed in in vitro and in vivo
experiments with monensin are decreased acetate production associated with concomitantly increased
propionate production and modified microbial protein synthesis (Schelling, 1984, Van Nevel, 1996).
The improved feed conversion efficiency due to monensin supplementation discussed by Goodrich et
al. (1984) may be caused by a shift in microbial fermentation towards propionate production
(Richardson et al., 1976), decreased ruminal protein degradation (Wallace et al., 1981), and reduced
loss of feed energy as methane (Johnson and Johnson, 1995). In contrast to the effect of monensin on
propionate production, its effects on methane production have been inconsistent in in vivo and in vitro
studies. Several investigations indicated that the decrease in methane production observed in feedlot
and dairy cattle is short-lived (Johnson and Johnson, 1995). In in vitro experiments, monensin was
associated with a reduction in methane production of up to 68%, but there are few data about the use
of total gas production as a sensitive tool that mirrors overall rumen fermentation (Van Nevel, 1996).
It remains unclear whether the reduction in methane production is due exclusively to a general
decrease in rumen fermentation, or whether monensin is capable of reducing methane to some extent
without adverse effects on the degradation of OM.
In vitro approaches offer advantages with regard to experimental effort and cost. They are particularly
useful for investigating substances that have not been approved as a feed additive, such as monensin in
the European Union. The Hohenheim Gas Test (Menke et al., 1979) is a widely used in vitro method
for the prediction of the energy value of feeds, but it can also be used to measure methane production.
This technique has also been used to screen other potential methane inhibitors (e.g., Bodas et al., 2008,
Soliva et al., 2008). However, no investigations using the Hohenheim Gas Test with monensin and
silages are known.
Some in vitro studies also investigated the effects of monensin (Van Nevel, 1996), several of which
used the semicontinuous rumen simulation technique (Rusitec, Czerkawski and Breckenridge, 1977).
The Rusitec was designed to simulate rumen physiology under standardized conditions. In addition to
the production of total gas, methane, and volatile fatty acids (VFA), the degradation of nutrients and
microbial protein synthesis can be studied over longer periods of time (2 weeks or more). Several
studies greatly differing in dosages of monensin have been conducted with the Rusitec (e.g., Bogaert
et al., 1990, Stanier and Davies, 1981, Wallace et al., 1981). These studies examined hay alone or in
combination with concentrate. To the best of our knowledge, silages have not been studied in the
Rusitec, although they are an important feed source for ruminants. Extrapolating from results obtained
with hay alone or combined with concentrate to silages must be done with caution, because different

Chapter 2 Study 1
21
flow and degradation rates are known for hay and silages (Aufrère et al., 2000, Hristov and Broderick,
1996), which probably affect rumen fermentation.
Any effort with focus on reducing methane emission in ruminants by modifying rumen microbes
should also consider effects on microbial protein synthesis. The Rusitec studies cited above did not
show that monensin had a consistent effect on microbial protein synthesis. It is likely that the effect of
monensin depends upon the fermented substrate. It is also possible that the different results obtained
were due to the different methods used to estimate microbial protein synthesis (Bogaert et al., 1990,
Jalč et al., 1992a, Stanier and Davies, 1981). Based on microscopic counting, Wallace et al. (1981)
indicated that solid- and liquid-associated microbes (SAM and LAM, respectively) are differently
affected by monensin. It is therefore necessary to quantify both bacterial fractions for an overall
assessment of the effects of monensin on microbial protein synthesis. Schönhusen et al. (1995)
concluded, from a systematic comparison of methods used to determine microbial protein synthesis,
that using 15N as an external marker is a more reproducible approach for determining rumen bacteria
than other methods used in Rusitec studies.
The objectives of the present study were (i) to use the Hohenheim Gas Test to identify the
concentration of monensin that will maximally reduce methane production without negative effects on
total gas production; (ii) to study the effects of monensin on the production of total gas, methane, and
VFA and on the degradation of nutrients when grass silage with or without concentrate is incubated in
the Rusitec; and (iii) to quantify the effects of monensin on protein synthesis by SAM and LAM.

Chapter 2 Study 1
22
MATERIALS AND METHODS
Two experiments were conducted. Experiment 1 was designed to study the short-term effects of
monensin on fermentation of grass silage (GS), grass silage plus concentrate (GS+C) and maize silage
(MS) using the Hohenheim Gas Test. Experiment 2 studied the effects of monensin on fermentation of
GS and GS+C in a Rusitec. Table 1 lists the composition of the diets and the chemical constituents of
each feed used in the experiments. Rumen inoculum for the in vitro incubations was collected from
two rumen-fistulated, nonlactating Holstein cows before morning feeding. The cows were offered hay
for ad libitum consumption and a mixed concentrate (2 kg/d). Cows had access to pasture during the
daytime.
Experiment 1
Total gas and methane production with different monensin dosages was measured using the
Hohenheim Gas Test according to the official method in Germany (method 25.1; VDLUFA [Verband
Deutscher Landwirtschaftlicher Untersuchungs- und Forschungsanstalten], 2006). Rumen fluid from
the two donor cows was filtered, mixed (1:1, v/v), and continuously flushed with CO2 until
incubation. A stock solution of monensin (0.2 g/L ethanol) was diluted with ethanol to final
concentrations from 0.01 to 0.2 g monensin/L ethanol.
Approximately 120 mg samples of feed were weighed and placed in 100-mL glass syringes. Fifty-
microliter samples of the final monensin solutions were pipetted onto the feed to achieve
concentrations of 4.2, 8.3, 16.7, 33.3, 50.0, and 83.3 mg monensin/kg feed, corresponding to 0.5, 1.0,
2.0, 4.0, 6.0, and 10.0 µg monensin/syringe, respectively. Syringes, which contained either feed
without monensin (control) or neither feed nor monensin (blank), were supplemented with 50 µL of
ethanol.
The prewarmed syringes were inoculated with 30 mL of medium (rumen fluid and buffer solution, 1:2
v/v) at 39° C for 24 h. Incubations were carried out in duplicate within each run using two incubators
(WTC Binder, Tuttlingen, Germany and Memmert, Schwabach, Germany). Each run was replicated
four times, providing eight replicated syringes per treatment. Total gas and methane production was
recorded after 24 h. After the incubation was stopped by cooling the syringes on ice, two samples of
supernatant of each treatment were pooled within each run, yielding four replicates per treatment for
analysis of VFA and NH3-N concentrations. Samples for VFA analysis were stored at -20° C.

Chapter 2 Study 1
23
Experiment 2
Experiment 2 was conducted using a 2 × 3-factorial arrangement of treatments: three doses of
monensin (0, 133 and 266 mg/kg feed) were combined with GS alone or GS+C. In two consecutive
runs, the six treatments were allocated to 24 vessels (12 in each run); thus, there were four replicates
per treatment. Treatments were assigned randomly to vessels, but in each run two vessels received the
same treatment. The technical details of the Rusitec and general incubation procedures were described
previously (Boguhn et al., 2006). In brief, each vessel contained two nylon bags (100 μm pore size),
each filled with 15 g of dried (65° C, 24 h) and ground (1 mm sieve) feed. A stock solution of
monensin (Chemical Abstracts Service Number (CAS): 22373-78-0, 98%, Dr. Ehrenstorfer GmbH,
Augsburg, Germany) with 40 mg monensin/mL ethanol was prepared. Different monensin dosages
were graded using 100 µL of ethanol (0 mg/kg feed, control), 50 µL of stock solution + 50 µL ethanol
(133 mg/kg feed), or 100 µL (166 mg/kg feed). The stock solution was added on top of the feed in the
nylon bags. The bags were set aside to allow the ethanol to evaporate until the incubation began.
Each day, one nylon bag was introduced into each vessel and withdrawn 48 h later, so that two bags
were in a vessel at any time. At the start of each incubation run, vessels were inoculated with 400 mL
of artificial saliva (McDougall, 1948), 400 mL of strained rumen fluid, and 60 g of solid rumen
content; equal portions of the rumen materials were pooled from the two donor animals. The artificial
saliva (524 mL/d, SD = 23.8) contained 0.0378 g ammonium chloride/L enriched with the stable
isotope 15N (104 mg 15N/g N; Chemotrade Chemiehandelsgesellschaft mbH Leipzig, Germany). After
a 6-d period of adaptation to the treatments, enrichment plateaus of 15N in the microbes were reached
(Boguhn et al., 2006) and samples were collected for 7 d. The pH in the vessel was measured daily
before the nylon bags with feed were changed. Feed residues from the bags were collected from days 7
to 12 and pooled per vessel. Samples (50 mL/d) were taken from well-mixed effluent to analyse the
NH3-N, 15N, and VFA concentrations. During sampling, a well-mixed suspension from the vessel
(25 mL/d) was taken to separate the fraction of LAM. On day 13, SAM were separated from feed
residues using a methylcellulose solution according to Ranilla and Carro (2003).
The liquid effluent was centrifuged for 15 min at 27,000 × g at 4° C. The LAM and SAM were
separated from the suspensions by differential centrifugation (twice for 5 min at 2,000 × g, three times
for 15 min at 27,000 × g). In the latter three steps, the supernatant was discarded and the pellet
containing the microbes was resuspended with 0.9% sodium chloride solution (w/v). The particle-free
supernatant of the effluent and the pellets of LAM and SAM were stored at -20° C until further
analyses and freeze dried for 15N analysis.
The Rusitec was equipped with gas-tight bags (10 L Plastigas; Linde AG, Munich, Germany) to
collect the fermentation gas. Total gas production was measured using a drum-type gas meter (TG3;
Dr.-Ing. Ritter Apparatebau GmbH & Co. KG, Bochum, Germany), and gas samples (100 mL) were

Chapter 2 Study 1
24
taken using gas-tight tubes and transferred to a gas chromatograph (GC) for analysis, as described
later.
Analytical Procedures and Calculations
For analysis of VFA, the samples were prepared by vacuum distillation as described previously
(Zijlstra et al., 1977) with the following modifications: Thawed samples were stirred and then
centrifuged at 4,000 × g for 5 min. One millilitre of the supernatant was transferred into an Erlenmeyer
flask, 0.1 mL of internal standard solution (80 mM 2-methylvaleric acid in 50% formic acid) was
added, and the sample was frozen in an alcohol bath at -20° C under continuous rotation.
For vacuum distillation, a glass distribution ring bearing eight three-way distilling receivers was
connected to a vacuum pump (RZ 16, Vacuubrand, Wertheim, Germany). Each of these receivers was
attached to an Erlenmeyer flask containing the frozen sample and a receiving tube. The receiving tubes
were submerged in a Dewar vessel containing liquid nitrogen. Vacuum was applied until the samples
were completely dry. The distillate was thawed at room temperature, and the samples were analysed in
duplicate using a GC (Hewlett-Packard 6890; Agilent, Waldbronn, Germany) equipped with a flame-
ionization detector, an autosampler, and an HP-FFAP fused silica capillary column (25 m × 0.32 mm,
film thickness 0.5 µm, HP 7683; Agilent). The oven temperature was initially 80° C isothermal for
1 min, and then increased to 205° C by 20° C/min and held at 205° C for 2 min. The temperatures of
the detector and injector were maintained at 260° C. The column head pressure of the carrier gas
(helium [purity ≥ 99.999]) was 227 kPa in constant pressure mode and total gas flow was at 62.5
mL/min. The injector was operated in split mode at a split ratio of 40:1 and a split flow of 60 mL/min.
The injection volume was 0.1 µl. The detector gas supply was 40 mL/min hydrogen (purity ≥ 99.999),
450 mL/min air (free of hydrocarbons), and 45 mL/min nitrogen (purity ≥ 99.999).
The method was validated with fatty acid standards (GC grade; Fluka, Taufkirchen, Germany) to be
linear within the range of 0.5 to 180 mM (R2 > 0.998) for all standards. Detection limits were between
2 and 8 µM at a signal-to-noise ratio of 3. Recovery rates at a spiking level of 40 mM for acetate and
propionate and 2 mM for all other standards were between 98% and 101%. Relative SDs were
between 1.8% and 3.6% (n = 8).
NH3-N was analysed by steam distillation (Vapodest; Gerhardt GmbH & Co. KG, Königswinter,
Germany) followed by titration (Titrator TR 154; Schott AG, Mainz, Germany). Fifteen millilitres of
0.25 M phosphate buffer (90 g Na2HPO412 H2O/L, adjusted to pH 11.0 using sodium hydroxide) was
added to 20 mL of the sample to adjust to a pH between 10.0 and 10.5. Distilled NH3 was trapped in
3% (w/v) boric acid and titrated with 0.05 N HCl (titre = 0.05 M).
The feed and feed residues were analysed for crude nutrients and fibre fractions according to official
methods (VDLUFA, 2006): DM (method 3.1), crude ash (method 8.1), CP (method 4.1.1), ether

Chapter 2 Study 1
25
extract (EE, sample treated with HCl and extracted with petroleum ether, method 5.1.1b), and crude
fibre (CF, method 6.1.1). Samples were also analysed for NDF (assayed with heat-stable amylase) and
ADF, both without residual ash (methods 6.5.1 and 6.5.2; VDLUFA, 2006). All chemical analyses
were run in duplicate. Degradation was calculated for each vessel as the difference between incubated
and residual in relation to incubated amounts.
Feed, feed residues, freeze-dried particle-free liquid effluent, LAM and SAM, and ammonium chloride
were analysed for 15N (SAM was also analysed for N) using an elemental analyser (EA 1108; Carlo
Erba Instruments, Biberach, Germany) combined with an isotope mass spectrometer (MS Finnigan
MAT; Thermoquest Italia S.p.A., Milan, Italy). The microbial protein (microbial N multiplied by 6.25)
from LAM was calculated as the difference between the input and output of 15N divided by the 15N
concentration in LAM. Microbial protein from SAM was calculated in accordance with Hildebrand et
al. (2011). The daily amount of microbial protein from LAM and SAM together was used to calculate
the efficiency of microbial protein synthesis (EMPS, in g/kg degraded OM). The amount of OM and
CP in feed residues was corrected for the contribution of the SAM (Boguhn et al., 2006).
In Experiment 1, total gas was analysed for the concentration of methane using an infrared methane
analyser (Pronova Analysentechnik GmbH & Co. KG, Berlin, Germany) calibrated with a reference
gas (18.0 vol% CH4; Air Liquide Deutschland GmbH). Total gas and methane production, corrected
with blanks, was standardized to 120 mg feed DM/syringe.
In Experiment 2, methane was analysed using a GC (GC 14 A; Shimadzu Deutschland GmbH,
Duisburg, Germany) equipped with an on-column injector and a thermal conductivity detector. The
GC was calibrated with a reference gas (5.16 vol% CH4; Air Liquide Deutschland GmbH, Düsseldorf,
Germany). A HayeSep DB (100 to 120 mesh, 6.0 m, 1/8 in; Alltech Deutschland GmbH, Düsseldorf,
Germany) was used as the stationary phase. The carrier gas (helium, purity ≥ 99.999) had a flow rate
of 30 mL/min. Injector and detector temperatures were 100° C and 120° C, respectively. The oven
temperature, following an initial period of 40° C for 9.5 min, was increased to 120° C at 40° C/min
and kept at 120° C for 10 min. The injection volume was 50 µL, and the bridge current was 150 mA.

Chapter 2 Study 1
26
Statistical Analyses
The MIXED procedure from the software package SAS (version 9.2; SAS Institute, Cary, NC, USA)
was used for statistical analysis. The statistical model used in Experiment 1 was as follows:
yijkl = + i1 + 1j + i2j + 2j2 + i2j
2 + k + eijkl.
The model included feed (i1), overall slope for monensin concentration (1j), separate slopes for
monensin concentration per feed (i2j ), overall quadratic term for monensin concentration (2j2),
separate quadratic terms for monensin concentration per feed (i3j2). The incubation run (k) was
considered as a random effect, and eijkl as the residual effect of the l-th replicate. Quadratic equations
were stated when the quadratic term was significant; otherwise linear equations were stated.
Because in Experiment 2 only three monensin dosages were tested the model included neither the
overall quadratic term for monensin concentration nor the separate quadratic term for monensin
concentration per feed. ANOVA was performed, and a significance level of p < 0.05 was chosen.
Treatments were compared using the t-test, in Experiment 1 to detect differences between treatments
and in Experiment 2 in case of interactions.

Chapter 2 Study 1
27
RESULTS
Experiment 1
An interaction between feed and monensin was detected for methane production (p < 0.01, Figure 1).
The total gas production ranged from 23.3 to 31.7 mL and was influenced by feed and monensin
(p < 0.001), whereas the quadratic term of monensin was not significant (p=0.41). Additionally, the
methane production was affected by feed and monensin (p < 0.001), and the quadratic term of
monensin was significant (p=0.005). Monensin inclusion resulted in a maximum reduction in total gas
production of 14%, 8%, and 11% in GS, GS+C, and MS, respectively. The maximum reduction in
methane production was 30%, 17%, and 18% in GS, GS+C, and MS, respectively. The total gas
production in GS, MS, and GS+C was not affected up to 16.7, 33.3, and 50.0 mg/kg feed, respectively.
Correspondingly, methane reduction without adverse significant effects on total gas production was
17%, 10%, and 13% for GS, GS+C, and MS, respectively (Figure 1). For total gas (TGP, mL) and
methane production (MP, mL) the regression equations at monensin concentration (µg) were as
follows:
TGPGS = 28.0425 – 0.4423 (1)
TGPGS+C = 31.2883 – 0.2570 (2)
TGPMS = 31.7397 – 0.3827 (3)
MPGS = 5.0954 – 0.3543 + 0.0184 2 (4)
MPGS+C = 5.6857 – 0.1556 + 0.0038 2 (5)
MPMS = 5.1731 – 0.1738 + 0.0070 2 (6)
Feeds and the inclusion of monensin significantly affected the concentrations of individual and total
VFA, as well as the acetate-to-propionate ratio (p < 0.001, Table 2). No significant interactions were
detected. The concentration of total VFA was equal for GS and MS (55.3 mM), whereas GS+C had a
significantly higher concentration (56.9 mM, p < 0.001). Monensin inclusion reduced the total VFA at
concentrations greater than 16.7 mg/kg feed (p < 0.006). The concentration of acetate and propionate
was similar with up to 8.3 mg/kg feed. Including more than 16.7 mg monensin/kg feed led to a
decrease in the acetate concentration of up to 9% (p < 0.001). Accordingly, the concentration of
propionate increased to the same extent (p < 0.001), which led to a significant reduction in the acetate-
to-propionate ratio.
The NH3-N concentration was significantly reduced in MS compared to GS and GS+C (p ≤ 0.001). In
contrast to feeds, monensin inclusion had no significant effect on the NH3-N concentration (p = 0.86).
Chapter 2 Study 1
28
Experiment 2
The average pH value was 6.82; pH was affected by run (p < 0.001), but not feed, monensin, or their
interaction (data not shown; p > 0.05). Total gas and methane production was higher in GS+C than in
GS (p < 0.001, Table 3). Monensin inclusion reduced the TGP in both feeds (p < 0.01), but there were
no differences between both monensin dosages. Methane production was also affected by feed and
monensin (p < 0.001). Monensin reduced MP by up to 23% and 24% in GS and GS+C, respectively.
For isobutyrate, isovalerate, the acetate-to-propionate ratio, and NH3-N, significant interactions
between feed and monensin were detected (Table 3). Monensin inclusion reduced acetate production
by a maximum of 15% and 14% in GS and GS+C, respectively. This was accompanied by an increase
in the production of propionate in GS and GS+C of 14% and 18%, respectively, with the inclusion of
up to 133 mg monensin/kg feed. As a consequence, the acetate-to-propionate ratio was lower
compared to the control. The inclusion of monensin significantly decreased the production of
isobutyrate, butyrate and isovalerate, while the production of valerate increased. Furthermore,
inclusion of 266 mg monensin/kg feed resulted in a reduction in total VFA production of up to 6% and
8% in GS and GS+C, respectively. In both feeds, inclusion of 133 and 266 mg monensin/kg feed
significantly reduced the NH3-N concentration; however, this occurred to a greater extent in GS+C
than in GS.
No significant interaction between feed and monensin with regard to the degradation of chemical
fractions was detected (Table 4). GS+C had significantly higher values for the degradation of DM,
OM, and NDF compared to GS. In contrast, degradation of CF and ADF was higher in GS than in
GS+C. CP degradation was affected by feed and monensin and ranged from 61.8% to 63.7% and from
51.4% to 55.0% in GS and GS+C, respectively. EE degradation was not affected by feed or by
monensin inclusion.
Significant interactions between feed and monensin were detected for microbial protein synthesis and
EMPS (Table 4). Microbial protein synthesis averaged 0.93 g/d across all treatments and was
significantly influenced by feed and monensin. Microbial protein synthesis by LAM was higher in GS
than in GS+C (p < 0.01) and was increased by monensin inclusion (p < 0.001). In contrast, microbial
protein synthesis by SAM was lower in GS than in GS+C and was decreased in the presence of
monensin (p < 0.05). For both feeds, 133 mg monensin/kg feed increased the synthesis of microbial
protein; however, no further increase was observed at 266 mg monensin/kg feed. The EMPS was
affected by feed and monensin inclusion (p < 0.01) and was maximal in GS at 266 mg monensin/kg
feed (221 g microbial protein/kg degraded OM, p ≥ 0.05 compared to the control) and in GS+C at
133 mg monensin/kg feed (212 g microbial protein/kg degraded OM, p < 0.05 compared to the
control).

Chapter 2 Study 1
29
DISCUSSION
In short-term batch cultures like the Hohenheim Gas Test, total gas production is a good indicator of
rumen fermentation (Rymer et al., 2005). The total gas production in GS, GS+C, and MS was not
adversely affected at monensin dosages of up to 16.7, 50.0, and 33.3 mg/ kg feed, respectively. The
maximum reductions in methane production achieved for these monensin concentrations were 17%
(GS), 10% (GS+C), and 13% (MS), respectively. The differences in monensin concentration among
the feeds can be explained by the fact that starch-fermenting bacteria are less sensitive to monensin
than cellulolytic bacteria (Callaway et al., 1997). Thus, it appears that there is a narrow range for a
reduction in methane production without an adverse effect on total gas production.
As we expected, the values of total gas production in the Rusitec were higher for GS+C compared to
GS. Compared to other Rusitec studies using hay and concentrate (Jalč et al., 1992b, Jalč and Certik,
2005), the total gas production in the present study was low. This may have been caused by
differences in the quality of grass silage as oven dried material was used with likely loss of volatiles
compared to fresh silages and hay, or by differences in the inclusion level and composition of the
concentrate in the diet. Moreover, methodological differences, such as the species of the donor
animals, their feeding or different vessel volumes, could have caused these differences in total gas
production (Boguhn et al., 2012). In both diets, the inclusion of monensin led to lower total gas
production. This is in contrast with the results of Jalč et al. (1992b). In their study, including 125 and
313 mg monensin/kg feed with hay and wheat bran increased TGP; however, levels higher than
313 mg monensin/kg feed reduced TGP. In the present Rusitec study monensin addition also reduced
MP to a similar extent in both diets. Contrary, results of TGP and MP observed in Experiment 1 and
other studies (Van Nevel, 1996) suggest that the in vitro fermentation of forage alone is more sensitive
to monensin compared to forage plus concentrate mixtures. This hypothesis is support by the
regression equations for GS, GS+C and MS (equ. 1-6). The linear slopes for TGP and MP were
smaller for GS (-0.44 and 30.35) compared to GS+C (-0.26 and -0.16) and MS (-0.38 and -0.17).
Although monensin does not directly inhibit methanogens, it inhibits the growth of bacteria that
produce acetate and butyrate, thus redirecting hydrogen from methane to propionate production (Van
Nevel and Demeyer, 1977). One of the main effects consistently observed in in vitro and in vivo
studies with monensin is increased propionate production at the expense of acetate. Consistent with
previous results (Bogaert et al., 1990, Jalč and Lauková, 2002, Wallace et al., 1981), the acetate
production in the present study was reduced at dosages of 133 and 266 mg/kg feed, whereas the
production of propionate was increased. Russell and Strobel (1989) suggested that succinate- and
propionate-producing bacteria are more tolerant to monensin inclusion, which could explain the
enhanced propionate production. These observations were also confirmed in Experiment 1.
Furthermore, the increasing effect of monensin on iso-butyrate and iso-valerate also indicates reduced
amino acid degradation. Monensin is known to inhibit the growth of proteolytic bacteria, resulting in

Chapter 2 Study 1
30
decreased protein degradation in the rumen (Russell and Strobel, 1989). This was confirmed in the
present study, in which the degradation of CP was reduced by monensin inclusion. Corresponding to
this, the amount of NH3-N in the effluent was reduced in GS and GS+C in the presence of monensin.
This decline in NH3-N was also described for diets consisting of alfalfa, sugar-beet pulp and wheat
bran, and hay and barley (Bogaert et al., 1990, Jalč and Lauková, 2002). Other studies, in which
monensin inclusion (up to 666 mg/kg feed) in a hay and wheat diet was investigated, indicated
marginal (Jalč and Certik, 2005) or no effects (Jalč et al., 1992b) on NH3-N outflow. According to
Yang and Russell (1993), decreased NH3-N production may be due to inhibition of deamination;
however, this effect seems to be diet dependent, and it is not predictable (Russell and Houlihan, 2003).
In both diets in Experiment 2, the inclusion of monensin had a significant effect on OM degradation;
however, the strong decline in the degradation of DM with 125 and 313 mg monensin /kg feed
observed by Wallace et al. (1981) and Jalč and Lauková (2002) could not be confirmed in the present
study. As expected, the degradation of NDF and ADF was reduced by monensin inclusion. These
results are in agreement with those of Jalč et al. (1992b). In their study, the degradation of NDF and
ADF was reduced in the presence of monensin (125 to 625 mg/kg feed). The effects of monensin on
the degradation of ADF are in line with results reported by Poos et al. (1979). These authors observed
a decrease in ADF digestibility in lambs in response to 22 and 33 mg monensin/kg DM of feed. They
assumed that this decrease was caused by the fact that the animals were not previously exposed to
monensin, because in a study by Dinius et al. (1976), no effects on fibre digestibility were noticed
when steers had been fed with a diet including monensin prior to the trial.
Several Rusitec studies examined the effects of monensin on microbial protein synthesis on the basis
of hay-concentrate-based diets, but they did not yield consistent results with regard to VFA
production. Wallace et al. (1981) indicated that microbes from the liquid and solid phase were
differently affected by monensin; thus, both microbial fractions should be considered when
investigating microbial protein synthesis. In agreement with this, microbial protein synthesis by LAM
increased up to 20% when monensin was included, whereas protein synthesis of SAM was inhibited
by 9% in the presence of monensin. These results are in line with the increased propionate production
and decreased acetate production accompanied by decreased fibre degradation mentioned above,
because more nonstructural soluble carbohydrates are metabolized to propionate by LAM, whereas the
enzymes to degrade plant cell-wall polysaccharides are possessed in greater abundance by SAM
(Legay-Carmier and Bauchart, 1989). It is also possible that in response to monensin part of SAM
were detached and became LAM.
Total microbial protein synthesis was increased in both diets with the added monensin. In contrast,
microbial protein synthesis, which was estimated by microbial nitrogen incorporation, was not
affected by monensin inclusion (5 mg/d) in a diet consisting of hay and barley (Jalč and Lauková,
2002), but its efficiency in fermenting OM was increased by 28%. This observation was confirmed in

Chapter 2 Study 1
31
the present study, because with GS+C, the EMPS increased up to 12%. In both studies, the increase in
EMPS was accompanied by a decline in OM degradation, although to a lesser extent in the present
study (4% vs. 13%). Studies of a hay-barley diet and monensin inclusion between 125 and 3125 mg/kg
feed also indicated an increase in EMPS of up to 24% and a decrease in DM degradation of up to 25%
(Jalč et al., 1992a, Wallace et al., 1981). In contrast, Stanier and Davies (1981) noticed no alteration in
EMPS (g /kg OM fermented) when a hay-concentrate diet was used. Jalč and Certik (2005) reported a
decrease in EMPS (16%) when monensin (63 mg/kg feed) was added to a hay-barley diet.
In addition to the different feeds used in the above-mentioned studies, the inconsistent results
concerning microbial protein synthesis may be due to the different methods used to measure microbial
protein synthesis. In our study, donor cows received a diet based on hay and concentrate and not
silages. This was done in accordance to the official method of the Hohenheim Gas Test to ensure
comparisons with other in in vitro approaches based on this method (method 25.1; VDLUFA, 2006).
Previously, microbial protein synthesis was quantified based on microscopic counting of bacteria and
protozoa (Wallace et al., 1981) or on the quantification of protozoa alone (Carro et al., 1992); these
quantifications should be used with caution, because it is known that protozoa disappear with time in
the Rusitec (Bogaert et al., 1990). Evidence from the literature also suggests that the use of
diaminopimelic acid as a microbial marker, which was used in some Rusitec studies (Jalč et al., 1992a,
Wallace et al., 1980), can lead to an overestimation of microbial protein synthesis compared to
external markers such as 15N (Schönhusen et al., 1995, Siddons et al., 1982).
The results of the present indicate that the effects of monensin on methane production are not due
solely to a general depression in rumen fermentation. Furthermore, these results can be used for a
comparison and evaluation, e.g., in the context of screening programs, to find new substances for
manipulating rumen fermentation, comparable to monensin. The lower relative methane reduction in
Experiment 1 compared to Experiment 2 could be due to methodological differences between the two
in vitro systems (e.g., ratio of feed to inoculum or incubation time) and therefore different monensin
dosages.
CONCLUSIONS
Both experiments showed that the inclusion of monensin in silage leads to reductions in the production
of total gas, methane, and acetate accompanied by increased propionate production. The results
obtained with the Hohenheim Gas Test indicate that monensin is able to reduce methane production
without adverse effects on total gas production; however, this range was quite narrow and depended
on the feed incubated. In the Rusitec, the inclusion of monensin in GS and GS+C did not result in a
strong decrease in DM degradation and did not enhance EMPS in GS. This appears to be in contrast to
results obtained with diets based on hay alone or combined with concentrates. Total microbial protein
synthesis was increased in both diets, but microbes associated with the liquid and solid phases were

Chapter 2 Study 1
32
affected differently. This suggests that the two fractions should be considered separately in further
studies.
ACKNOWLEDGEMENT
G. Wischer received a doctoral scholarship from the H. Wilhelm Schaumann Stiftung (Hamburg,
Germany), which is gratefully acknowledged.

Chapter 2 Study 1
33
REFERENCES
used in chapter 2
Aufrère, J., D. Graviou, R. Baumont, A. Detour, and C. Demarquilly. 2000. Degradation in the rumen of proteins from fresh lucerne forage in various stages of growth and conserved as silage or hay. Anim Res 49:461-474.
Bodas, R., S. López, M. Fernández, R. García-González, A. B. Rodríguez, R. J. Wallace, and J. S. González. 2008. In vitro screening of the potential of numerous plant species as antimethanogenic feed additives for ruminants. Anim Feed Sci Tech 145:245-258.
Bogaert, C., J. P. Jouany, and G. Jeminet. 1990. Effects of the ionophore antibiotics monensin, monensin-propionate, abierixin and calcimycin on ruminal fermentations in vitro (Rusitec). Anim Feed Sci Tech 28:183-197.
Boguhn, J., H. Kluth, and M. Rodehutscord. 2006. Effect of total mixed ration composition on fermentation and efficiency of ruminal microbial crude protein synthesis in vitro. J Dairy Sci 89:1580-1591.
Boguhn, J., T. Zuber, and M. Rodehutscord. 2012. Effect of donor animals and their diet on in vitro nutrient degradation and microbial protein synthesis using grass and corn silages. J Anim Physiol Anim Nutr, early view available.
Callaway, T. R., A. M. S. Carneiro De Melo, and J. B. Russell. 1997. The effect of nisin and monensin on ruminal fermentations in vitro. Curr Microbiol 35:90-96.
Carro, M. D., P. Lebzien, and K. Rohr. 1992. Influence of yeast culture on the in vitro fermentation (Rusitec) of diets containing variable portions of concentrates. Anim Feed Sci Tech 37:209-220.
Czerkawski, J. W. and G. Breckenridge. 1977. Design and development of a long-term rumen simulation technique (Rusitec). Br J Nutr 38:371-384.
Dinius, D. A., M. E. Simpson, and P. B. Marsh. 1976. Effect of monensin fed with forage on digestion and the ruminal ecosystem of steers. J Anim Sci 42:229-234.
Goodrich, R. D., J. E. Garrett, D. R. Gast, M. A. Kirick, D. A. Larson, and J. C. Meiske. 1984. Influence of monensin on the performance of cattle. J Anim Sci 58:1484-1498.
Hildebrand, B., J. Boguhn, and M. Rodehutscord. 2011. Effect of maize silage to grass silage ratio and feed particle size on protein synthesis and amino acid profile in different microbial fractions in a semi-continuous rumen simulation. Animal 5:537-546.
Hristov, A. N. and G. A. Broderick. 1996. Synthesis of microbial protein in ruminally cannulated cows fed alfalfa silage, alfalfa hay, or corn silage. J Dairy Sci 79:1627-1637.
Jalč, D., M. Baran, T. Vendrák, and P. Siroka. 1992a. Effect of monensin on fermentation of hay and wheat bran investigated by the Rumen Simulation Technique (Rusitec). 1. Basal parameters of fermentation. Arch Tierernahr 42:147-152.
Jalč, D., M. Baran, T. Vendrák, and P. Siroka. 1992b. Effect of monensin on fermentation of hay and wheat bran investigated by the Rumen Simulation Technique (Rusitec). 2. End-products of fermentation and protein synthesis. Arch Tierernahr 42:153-158.
Jalč, D. and M. Certik. 2005. Effect of microbial oil, monensin and fumarate on rumen fermentation in artificial rumen. Czech J Anim Sci 50:467-472.

Chapter 2 Study 1
34
Jalč, D. and A. Lauková. 2002. Effect of nisin and monensin on rumen fermentation in artificial rumen. Berl Münch Tierärztl Wschr 115:6-10.
Johnson, K. A. and D. E. Johnson. 1995. Methane emissions from cattle. J Anim Sci 73:2483-2492.
Legay-Carmier, F. and D. Bauchart. 1989. Distribution of bacteria in the rumen contents of dairy cows given a diet supplemented with soya-bean oil. Br J Nutr 61:725-740.
McDougall, E. I. 1948. Studies on ruminant saliva. 1. The composition and output of sheep’s saliva. Biochem J 43:99-109.
Menke, K. H., L. Raab, A. Salewski, H. Steingass, D. Fritz, and W. Schneider. 1979. The estimation of the digestibility and metabolizable energy content of ruminant feedingstuffs from the gas production when they are incubated with rumen liquor in vitro. J Agric Sci 93:217-222.
Poos, M. I., T. L. Hanson, and T. J. Klopfenstein. 1979. Monensin effects on diet digestibility, ruminal protein bypass and microbial protein synthesis. J Anim Sci 48:1516-1524.
Ranilla, M. J. and M. D. Carro. 2003. Diet and procedures used to detach particle-associated microbes from ruminal digesta influence chemical composition of microbes and estimation of microbial growth in Rusitec fermenters. J Anim Sci 81:537-544.
Richardson, L. F., A. P. Raun, E. L. Potter, C. O. Cooley, and R. P. Rathmacher. 1976. Effect of monensin on rumen fermentation in vitro and in vivo. J Anim Sci 43:657-664.
Russell, J. B. and A. J. Houlihan. 2003. Ionophore resistance of ruminal bacteria and its potential impact on human health. FEMS Microbiol Rev 27:65-74.
Russell, J. B. and H. J. Strobel. 1989. Effect of ionophores on ruminal fermentation. Appl Environ Microbiol 55:1-6.
Rymer, C., J. A. Huntington, B. A. Williams, and D. I. Givens. 2005. In vitro cumulative gas production techniques: History, methodological considerations and challenges. Anim Feed Sci Tech 123-124 Part 1:9-30.
Schelling, G. T. 1984. Monensin mode of action in the rumen. J Anim Sci 58:1518-1527.
Schönhusen, U., J. Voigt, F. Kreienbring, and F. Teuscher. 1995. Evaluation of different markers for determination of the microbial nitrogen flow into the duodenum of dairy cows. Arch Tierernahr 48:147-158.
Siddons, R. C., D. E. Beever, and J. V. Nolan. 1982. A comparison of methods for the estimation of microbial nitrogen in duodenal digesta of sheep. Br J Nutr 48:377-389.
Soliva, C. R., A. B. Zeleke, C. Clément, H. D. Hess, V. Fievez, and M. Kreuzer. 2008. In vitro screening of various tropical foliages, seeds, fruits and medicinal plants for low methane and high ammonia generating potentials in the rumen. Anim Feed Sci Tech 147:53-71.
Stanier, G. and A. Davies. 1981. Effects of the antibiotic monensin and an inhibitor of methanogenesis on in vitro continuous rumen fermentations. Br J Nutr 45:567-578.
Van Nevel, C. J. 1996. Control of rumen methanogenesis. Environ Monit Assess 42:73-97.
Van Nevel, C. J. and D. I. Demeyer. 1977. Effect of monensin on rumen metabolism in vitro. Appl Environ Microbiol 34:251-257.

Chapter 2 Study 1
35
VDLUFA (Verband Deutscher Landwirtschaftlicher Untersuchungs- und Forschungsanstalten). 2006. Handbuch der Landwirtschaftlichen Versuchs- und Untersuchungsmethodik (VDLUFA-Methodenbuch), Bd. III Die chemische Untersuchung von Futtermitteln. VDLUFA-Verlag, Darmstadt, Germany.
Wallace, R. J., K. J. Cheng, and J. W. Czerkawski. 1980. Effect of monensin on fermentation characteristics of the artificial rumen. Appl Environ Microbiol 40:672-674.
Wallace, R. J., J. W. Czerkawski, and G. Breckenridge. 1981. Effect of monensin on the fermentation of basal rations in the Rumen Simulation Technique (Rusitec). Br J Nutr 46:131-148.
Yang, C. M. J. and J. B. Russell. 1993. Effect of monensin on the specific activity of ammonia production by ruminal bacteria and disappearance of amino nitrogen from the rumen. Appl Environ Microbiol 59:3250-3254.
Zijlstra, J. B., J. Beukema, B. G. Wolthers, B. M. Byrne, A. Groen, and J. D. Ankert. 1977. Pretreatment methods prior to gaschromatographic analysis of volatile fatty acids from faecal samples. Clin Chim Acta 78:243-250.

Chapter 2 Study 1
36
Table 1. Composition and analyzed crude nutrients and fiber fractions of the feeds
Grass silage# Grass silage# + Concentrate#
Maize silage#
Ingredient composition [g/kg] Grass silage§ 1000 500 Maize silage§ 1000 Rapeseed meal, solvent extracted 143 Sugar beet pulp, dried 294 Wheat 38 Calcium carbonate 6 Urea 6 Vitamin-mineral mixѱ 13
Chemical composition [g/kg DM]
OM 865 901 963 CP 125 167 74 CF 274 201 197 NDF 531 417 428 ADF 363 251 236
Notes: # ground to pass a 1-mm screen; & pure silages, oven dried for 24 h at 65°C; ѱ Premix contained [g/kg]: Ca 250, Na 85, P 40, Mg 35, Zn 4, Mn 2, Cu 0.5, I 0.03, Co 0.01, Se 0.02, vitamin E 0.5; vitamin A 500.000 IU, vitamin D3 80.000 IU
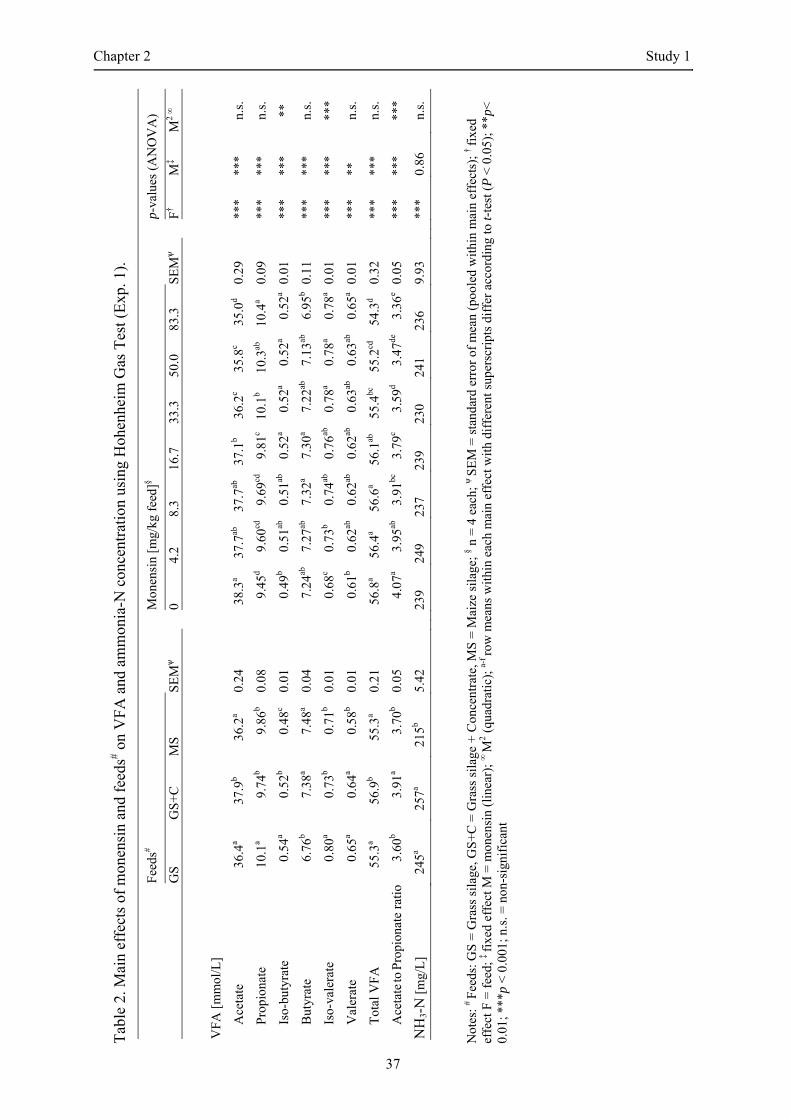
Chapter 2 Study 1
37
Tab
le 2
. Mai
n ef
fect
s of
mon
ensi
n an
d fe
eds# o
n V
FA
and
am
mon
ia-N
con
cent
rati
on u
sing
Hoh
enhe
im G
as T
est (
Exp
. 1).
F
eeds
#
M
onen
sin
[mg/
kg f
eed]
§
p-
valu
es (
AN
OV
A)
GS
GS
+C
M
S
SE
Mѱ
0
4.2
8.3
16.7
33
.3
50.0
83
.3
SE
Mѱ
F
† M
‡M
2 ∞
VFA
[m
mol
/L]
Ace
tate
36
.4a
37.9
b 36
.2a
0.24
38.3
a 37
.7ab
37
.7ab
37
.1b
36.2
c 35
.8c
35.0
d 0.
29
**
* **
* n.
s.
Pro
pion
ate
10.1
a 9.
74b
9.86
b 0.
08
9.
45d
9.60
cd9.
69cd
9.
81c
10.1
b 10
.3ab
10
.4a
0.09
***
***
n.s.
Iso-
buty
rate
0.
54a
0.52
b 0.
48c
0.01
0.49
b 0.
51ab
0.51
ab
0.52
a 0.
52a
0.52
a 0.
52a
0.01
***
***
**
But
yrat
e 6.
76b
7.38
a 7.
48a
0.04
7.24
ab7.
27ab
7.32
a 7.
30a
7.22
ab7.
13ab
6.95
b 0.
11
**
* **
* n.
s.
Iso-
vale
rate
0.
80a
0.73
b 0.
71b
0.01
0.68
c 0.
73b
0.74
ab
0.76
ab0.
78a
0.78
a 0.
78a
0.01
***
***
***
Val
erat
e 0.
65a
0.64
a 0.
58b
0.01
0.61
b 0.
62ab
0.62
ab
0.62
ab0.
63ab
0.63
ab0.
65a
0.01
***
**
n.s.
Tot
al V
FA
55
.3a
56.9
b 55
.3a
0.21
56.8
a 56
.4a
56.6
a 56
.1ab
55
.4bc
55
.2cd
54
.3d
0.32
***
***
n.s.
Ace
tate
to P
ropi
onat
e ra
tio
3.60
b 3.
91a
3.70
b 0.
05
4.
07a
3.95
ab3.
91bc
3.
79c
3.59
d 3.
47de
3.36
e 0.
05
**
* **
* **
*
NH
3-N
[m
g/L
] 24
5a 25
7a 21
5b 5.
42
23
9 24
9 23
7 23
9 23
0 24
1 23
6 9.
93
**
* 0.
86
n.s.
Not
es: #
Fee
ds: G
S =
Gra
ss s
ilag
e, G
S+
C =
Gra
ss s
ilage
+ C
once
ntra
te, M
S =
Mai
ze s
ilage
; § n =
4 e
ach;
ѱ S
EM
= s
tand
ard
erro
r of
mea
n (p
oole
d w
ithin
mai
n ef
fect
s); †
fixe
d ef
fect
F =
fee
d; ‡
fixe
d ef
fect
M =
mon
ensi
n (l
inea
r); ∞
M2 (
quad
ratic
); a-
f ro
w m
eans
wit
hin
each
mai
n ef
fect
wit
h di
ffer
ent s
uper
scri
pts
diff
er a
ccor
ding
to t-
test
(P
< 0
.05)
; **p
<
0.01
; ***
p <
0.0
01; n
.s. =
non
-sig
nifi
cant

Chapter 2 Study 1
38
Tab
le 3
. Eff
ect o
f m
onen
sin
on p
rodu
ctio
n of
tota
l gas
and
met
hane
, VF
A a
nd a
mm
onia
-N u
sing
Rus
itec
(E
xp. 2
, n =
4).
Gra
ss s
ilage
Gra
ss s
ilage
+ C
once
ntra
te
p-
valu
es (
AN
OV
A)
Mon
ensi
n [m
g/kg
fee
d]
013
3 26
60
133
266
SE
M#
F§
Mѱ
F ×
M
Tot
al g
as p
rodu
ctio
n [m
L/d
] 84
0 81
9 76
5 10
75
968
980
24.8
**
* **
0.
22
Tot
al g
as p
rodu
ctio
n [m
L/g
dO
M† ]
203
187
188
227
202
212
5.47
**
* **
0.
62
Met
hane
pro
duct
ion
[mL
/d]
45.8
38
.7
35.3
63
.6
50.6
48
.6
1.70
**
* **
* 0.
23
Met
hane
pro
duct
ion
[mL
/g d
OM
] 11
.1
8.9
8.7
13.4
10
.6
10.5
0.
31
***
***
0.57
VFA
[m
mol
/d]
Ace
tate
11
.59
10.5
3 9.
81
13.9
1 12
.78
11.9
4 0.
19
***
***
0.88
Pro
pion
ate
6.58
7.
50
7.10
6.
09
7.18
6.
82
0.12
**
**
* 0.
69
Iso-
buty
rate
0.
43a
0.40
b 0.
39b
0.33
c 0.
26d
0.22
e 0.
01
***
***
**
But
yrat
e 5.
27
4.94
4.
61
6.39
5.
90
5.25
0.
19
***
***
0.46
Iso-
vale
rate
0.
72ab
0.
65cb
0.
61c
0.75
a 0.
35d
0.29
d 0.
03
***
***
***
Val
erat
e 3.
88
4.38
4.
28
3.56
4.
11
3.89
0.
10
***
***
0.83
Tot
al V
FA
28
.46
28.4
0 26
.81
31.0
3 30
.57
28.4
1 0.
49
***
**
0.80
Ace
tate
:Pro
pion
ate
rati
o 1.
78b
1.41
c 1.
39c
2.29
a 1.
79b
1.75
b 0.
02
***
***
***
NH
3-N
[m
mol
/d]
4.28
b 3.
75c
3.53
d 5.
31a
4.37
b 3.
84c
0.06
**
* **
* **
*
Not
es: # S
EM
= s
tand
ard
erro
r of
mea
n (p
oole
d ov
er a
ll tr
eatm
ents
); § f
ixed
eff
ect F
= f
eed;
ѱ fi
xed
effe
ct M
= m
onen
sin;
† deg
rade
d O
M; a-
d ro
w m
eans
wit
h di
ffer
ent s
uper
scri
pts
diff
er a
ccor
ding
to t-
test
(p
< 0
.05)
; **p
< 0
.01;
***
p <
0.0
01
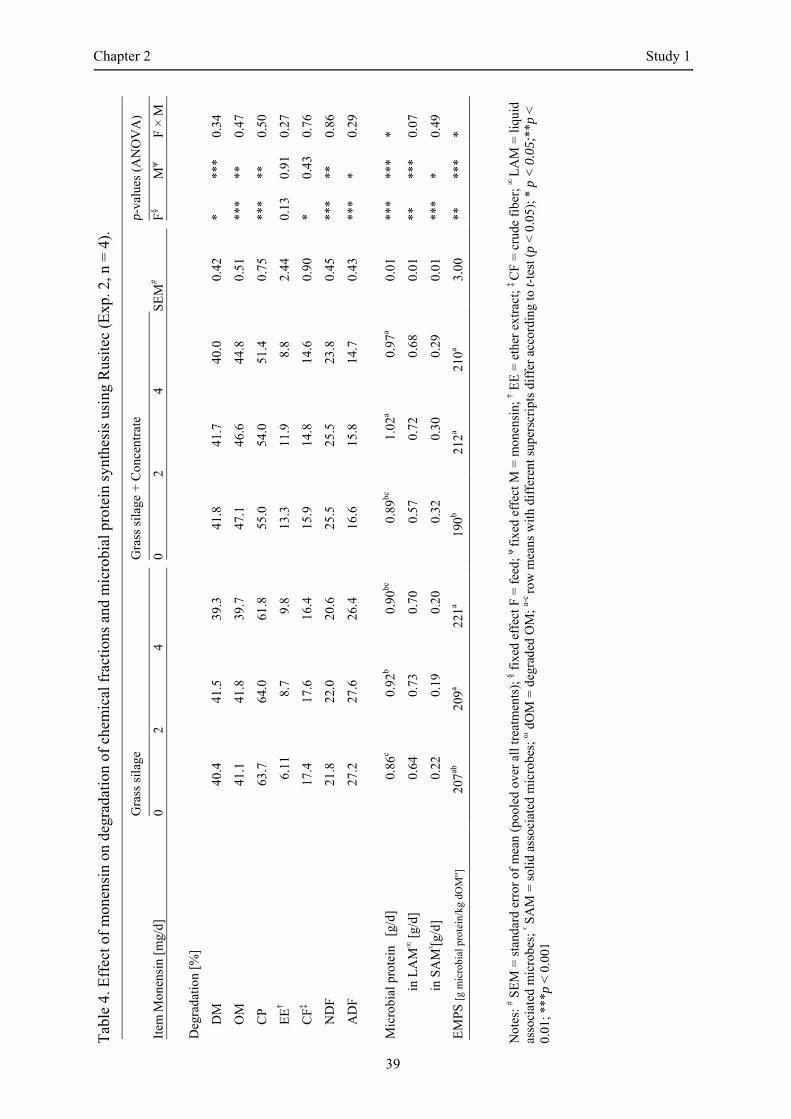
Chapter 2 Study 1
39
Tab
le 4
. Eff
ect o
f m
onen
sin
on d
egra
dati
on o
f ch
emic
al f
ract
ions
and
mic
robi
al p
rote
in s
ynth
esis
usi
ng R
usit
ec (
Exp
. 2, n
= 4
).
Gra
ss s
ilage
Gra
ss s
ilage
+ C
once
ntra
te
p-
valu
es (
AN
OV
A)
Item
Mon
ensi
n [m
g/d]
0
2 4
0
2 4
SE
M#
F§
Mѱ
F ×
M
Deg
rada
tion
[%]
DM
40
.4
41.5
39
.3
41
.8
41.7
40
.0
0.42
*
***
0.34
OM
41
.1
41.8
39
.7
47
.1
46.6
44
.8
0.51
**
* **
0.
47
CP
63
.7
64.0
61
.8
55
.0
54.0
51
.4
0.75
**
* **
0.
50
EE
† 6.
11
8.7
9.8
13
.3
11.9
8.
8 2.
44
0.13
0.
91
0.27
CF
‡ 17
.4
17.6
16
.4
15
.9
14.8
14
.6
0.90
*
0.43
0.
76
ND
F 21
.8
22.0
20
.6
25
.5
25.5
23
.8
0.45
**
* **
0.
86
AD
F 27
.2
27.6
26
.4
16
.6
15.8
14
.7
0.43
**
* *
0.29
Mic
robi
al p
rote
in
[g/d
]
0.86
c 0.
92b
0.90
bc
0.
89bc
1.
02a
0.97
a 0.
01
**
* **
* *
in
LA
M∞ [
g/d]
0.64
0.
73
0.70
0.57
0.
72
0.68
0.
01
**
**
* 0.
07
in
SA
Mᵡ [g
/d]
0.
22
0.19
0.
20
0.
32
0.30
0.
29
0.01
***
* 0.
49
EM
PS
[g m
icro
bial
pro
tein
/kg
dOM
ω]
207ab
20
9a 22
1a
190b
212a
210a
3.00
**
**
* *
Not
es: # S
EM
= s
tand
ard
erro
r of
mea
n (p
oole
d ov
er a
ll tr
eatm
ents
); § f
ixed
eff
ect F
= f
eed;
ѱ fi
xed
effe
ct M
= m
onen
sin;
† EE
= e
ther
ext
ract
; ‡ C
F =
cru
de f
iber
; ∞ L
AM
= li
quid
as
soci
ated
mic
robe
s; ᵡ S
AM
= s
olid
ass
ocia
ted
mic
robe
s; ω
dO
M =
deg
rade
d O
M; a-
c ro
w m
eans
wit
h di
ffer
ent s
uper
scri
pts
diff
er a
ccor
ding
to t-
test
(p
< 0
.05)
; * p
< 0
.05;
**p
<
0.01
; ***
p <
0.0
01

Chapter 2 Study 1
40
F
igur
e 1:
Eff
ects
of
mon
ensi
n in
clus
ion
on to
tal g
as a
nd m
etha
ne p
rodu
ctio
n w
ithin
eac
h di
et. D
iffe
rent
lett
ers
indi
cate
sig
nifi
cant
dif
fere
nces
in to
tal g
as
prod
ucti
on (
A-D
) an
d m
etha
ne p
rodu
ctio
n (a
-d).
04.
28.
316
.733
.350
.083
.3
10203040
2468
AB
AA
BB
CD
Eab
ab
cc
dd
Gra
ss s
ilage
gas production [mL]
methane production [mL]
04.
28.
316
.733
.350
.083
.3
10203040
2468
AB
AA
AA
B B
Ca
aa
ab
bc
Gra
ss s
ilage
+ C
once
ntra
te
mg
mon
ensi
n/ k
g fe
edgas production [mL]
methane production [mL]
04.
28.
316
.733
.350
.083
.3
10203040
2468
AB
AA
AC
BC
CD
aa
aab
cdbc
a
Mai
ze s
ilage
methane production [mL]

Chapter 3 Study 2
41
3. STUDY 2
EFFECTS OF DIFFERENT TANNIN EXTRACTS AND
RAPESEED TANNIN MONOMERS ON METHANE FORMATION AND
MICROBIAL PROTEIN SYNTHESIS IN VITRO
G. Wischer, J. Boguhn, H. Steingaß, M. Schollenberger, and M. Rodehutscord
Institut für Tierernährung, Universität Hohenheim, Emil-Wolff-Str. 10, 70599 Stuttgart, Germany
Submitted to Animal

Chapter 3 Study 2
42
Effects of different tannin extracts and rapeseed tannin monomers on
methane formation and microbial protein synthesis in vitro
G. Wischer, J. Boguhn, H. Steingaß, M. Schollenberger, and M. Rodehutscorda
Institut für Tierernährung, Universität Hohenheim, Emil-Wolff-Str. 10, 70599 Stuttgart, Germany
a Corresponding author: Markus Rodehutscord. E-mail: [email protected]
Running head: Tannin effects on methane and microbial protein
Presented in part at the annual meeting of the Society of Nutrition Physiology, Göttingen, Germany. March 09-11, 2010: G. Wischer, J. Boguhn, H. Steingaß, and M. Rodehutscord (2010): Screening of potential inhibitors of methanogenesis using the Hohenheim Gas Test. Proc. Soc. Nutr. Physiol. 19:103. March 15-17, 2011: G. Wischer, J. Boguhn, H. Steingaß, and M. Rodehutscord (2011): Effect of tannin extracts on fermentation of grass silage and microbial yield in a rumen simulation. Proc. Soc. Nutr. Physiol. 20:111.

Chapter 3 Study 2
43
ABSTRACT
Tannins, polyphenolic compounds found in plants, are known to complex with proteins of feed and
rumen bacteria. This group of substances has the potential to reduce methane production (MP) either
without or with negative effects on digestibility and microbial yield. In the first step of this study, ten
tannin extracts from chestnut, mimosa, myrabolan, quebracho, sumach, tara, valonea, oak, cocoa, and
grape seed and four rapeseed tannin monomers (pelargonidin, catechin, cyanidin, and sinapinic acid)
were used in a series of in vitro trials using the Hohenheim gas test with grass silage as the substrate.
The objective was to identify the respective dosage that leads to a reduction in MP without a
significant effect on total gas production (TGP). Supplementation with pelargonidin and cyanidin did
not reduce MP; however, catechin and sinapinic acid reduced MP without altering TGP. All tannin
extracts except tara extract significantly reduced MP by 8% to 28% without altering TGP. Based on
these results, five tannin extracts were further investigated in a second step utilising a Rusitec. In this
experiment, nutrient degradation, microbial protein synthesis, and volatile fatty acid production were
used as additional response criteria. Grass silage was used as the substrate. Chestnut extract caused the
greatest reduction in MP followed by valonea, grape seed, and sumach, while myrabolan extract did
not reduce MP. While chestnut extract reduced acetate production by 19%, supplementation with
grape seed or myrabolan extract increased acetate production; however, degradation of fibre fractions
was reduced in all tannin treatments. Degradation of dry matter and organic matter was also reduced
by tannin supplementation, and no differences were found between the tannin extracts. Crude protein
degradation and NH3-N production in the Rusitec were reduced by tannin treatment. The amount and
efficiency of microbial protein synthesis were not significantly affected by tannin supplementation.
The results of this study indicated that some tannin extracts are able to reduce MP without altering
microbial protein synthesis. We hypothesised that chestnut and valonea extract have the greatest
potential to reduce MP without negative side effects and we tested this hypothesis in a long-term
respiration experiment using sheep, which is reported separately.
Keywords: tannin extract, tannin monomer, screening, methane, microbial protein synthesis
IMPLICATIONS
Tannin extracts from different plants and rapeseed tannin monomers have different potential to reduce
methane production by rumen microbes. The reduction in methane production may be associated with
reduced fermentation and volatile fatty acid production; however, we found no indication for an
alteration in the efficiency of microbial protein synthesis. The relevance of these results, which were
obtained in vitro, can only be evaluated after the most promising products have been tested in animal
studies.

Chapter 3 Study 2
44
INTRODUCTION
Tannins are a group of secondary plant compounds that are usually classified as hydrolysable or
condensed tannins. Hydrolysable tannins are polymers of gallic and ellagic acid esters with a common
core of glucose, whereas condensed tannins (proanthocyanidins) consist of polymers of flavan-3-ols
linked by an interflavan carbon bond (Reed, 1995). In contrast to hydrolysable tannins, no cleavage of
monomers of condensed tannins (e.g. (epi)catechin and (epi)gallocatechin, both flavan-3-ols) from the
heterocyclic ring system occurs in the rumen (McSweeney et al., 2001). It has been well established
that tannins complex predominantly via hydrogen bonds with proteins from feed, rumen bacteria, and
extracellular secreted enzymes resulting in reduced N availability in the rumen and increased protein
and amino acid flow in the lower gut (Waghorn et al., 1987; McSweeney et al., 2001). Tannins are
also thought to suppress internal parasites and methanogenesis in ruminants (Patra and Saxena, 2011;
Jayanegara et al., 2012). Six to twelve percent of feed energy is lost as methane, which contributes to
the greenhouse effect (Johnson and Johnson, 1995). The inhibitory effects of tannins on rumen
methanogenesis have been attributed to their direct effects on methanogenic archaea and protozoa,
indirectly leading to a depression of fibre degradation in the rumen (Patra and Saxena, 2011).
In several studies, a reduction in methane production (MP) was accompanied with a reduction in
digestibility (e.g. Puchala et al., 2005; Animut et al., 2008); however, if tannin-containing plants are
used, it is difficult to distinguish between the potential effects of the tannins and the other constituents
of the supplemented plant. Studies using tannin monomers are scarce (Lowry and Kennedy, 1996);
however, some in vitro and in vivo studies have investigated the effects of tannin extracts, especially
chestnut (Castanea sativa), acacia (Acacia mearnsii), and quebracho (Schinopsis quebracho-colorado)
extracts (Śliwiński et al., 2002; Carulla et al., 2005; Beauchemin et al., 2007). In addition to the
reduced MP observed in vivo (up to 29%, Grainger et al., 2009), supplementation of the mentioned
tannin extracts often decreased digestibility (e.g. CP, NDF, and ADF) and tended to decrease total
volatile fatty acid (VFA) production, indicating their effects on the microbial community in the rumen.
Microbial protein synthesis is highly related to the protein supply in the duodenum of ruminants.
Carulla et al. (2005) observed reduced urinary allantoin excretion in sheep fed diets containing acacia
extract, which indicated that microbial protein synthesis was reduced. In contrast, Makkar et al.
(1995a) reported that microbial protein synthesis was enhanced in the presence of tannins in vitro. In
their study, 15N incorporation into microbes was significantly increased by tannins and was negatively
related to VFA production, indicating that the energy derived from nutrient fermentation was shifted
from VFA production towards microbial protein synthesis. Since no consistent effects of tannins on
microbial protein synthesis have been described (Patra and Saxena, 2011), additional studies
examining the potential conflicting effects of tannin feeding on MP and microbial protein synthesis are
needed.
Our first objective was an extensive screening of tannin substances (extracts and monomers) using the
Hohenheim gas test (HGT; Menke et al., 1979) to identify a specific reduction in MP that is

Chapter 3 Study 2
45
achievable without a reduction in total gas production (TGP) as an indicator of overall fermentation.
The second objective was to study the effect on MP together with nutrient degradation and different
microbial fractions using a rumen simulation technique (Rusitec; Czerkawski and Breckenridge,
1977) with the tannins that were most promising in the HGT screening. The outcome of these in vitro
studies formed the basis for a long-term experiment with sheep which is reported separately (Wischer
et al., 2012b).
Chapter 3 Study 2
46
MATERIALS AND METHODS
In Experiment 1, the HGT was used in four consecutive trials to screen 14 tannin substances for
methane reduction when added to grass silage. In Experiment 2, five tannin substances were chosen
for further investigation using a Rusitec to study the effects on nutrient degradation and microbial
protein synthesis.
The grass silage used in both experiments was ground to pass through a 1-mm screen, and its chemical
composition was as follows, organic matter (OM), 922; CP, 129; crude fibre (CF), 264; NDF, 444;
and ADF, 283 g/kg dry matter (DM).
Rumen content was obtained before the morning feeding from two rumen fistulated, non-lactating
cows (Holstein-Friesian). The same amount from both cows was mixed and collected into pre-warmed
thermos flasks, filtered, and flushed with carbon dioxide until HGT incubation. The cows had ad
libitum access to hay and received 2 kg/d of a mixed concentrate. They had free access to water and
pasture during the daytime.
Tannin substances
Fourteen tannin extracts were used, chestnut (Castanea sativa, total tannin (TT) concentration
according to the manufacturer ≥76%), mimosa (Acacia negra, TT ≥72%), myrabolan (Terminalia
chebula, TT ≥70%), quebracho (Schinopsis balansae, TT ≥76%), sumach (Rhus coriaria, TT ≥62%),
tara (Caesalpinia spinosa, TT ≥61%), valonea (Quercus valonea, TT ≥67%) (all from Baeck GmbH &
Co. KG, Norderstedt, Germany), oak (Oaktan FU; Quercus robur, TT ≥55%), cocoa (OmniCoa 55;
Theobroma cacao, polyphenol (PP) concentration according to the manufacturer ≥55%), and grape
seed (OmniVin 20R; Vitis vinifera, PP ≥95%) (all from S.A. Ajinimoto OmniChem N.V., Louvain-la-
Neuve, Belgium). Four rapeseed tannin monomers were also used, pelargonidin (pelargonidin chloride
Rotichrom, Chemical Abstracts Service Number (CAS): 134-04-3), catechin ((+)-catechin Rotichrom,
CAS: 154-23-4), cyanidin (cyanidin chloride Rotichrom, CAS: 528-58-5), and sinapinic acid
(sinapinic acid ≥97%, CAS: 530-59-6) (Carl Roth GmbH, Karlsruhe, Germany).
Experiment 1
The HGT was performed according to the official method (method 25.1, Verband Deutscher
Landwirtschaftlicher Untersuchungs- und Forschungsanstalten (VDLUFA), 2006) and modified as
follows. Approximately 120 mg of grass silage was weighed and placed in 100-mL glass syringes. The
tannin extracts were administered in doses of 6 and 12 mg/syringe in the first trial. The
supplementation level of 5% in DM represents the native tannin concentration in Lotus pedunculatus
(Chiquette et al., 1989). We also used twice this level because it was assumed that the different tannin
extracts consist of different tannin phenols. The concentrations of rapeseed monomers that were
initially used were 0.3 and 0.7 mg/syringe based on the concentration of proanthocyanidins found in

Chapter 3 Study 2
47
crude tannin extracts of rapeseed hulls, which were assumed to be 5% for each monomer (Naczk et al.,
1998). Tannin substances were diluted in double distilled water, and 500 µL of these solutions or
500 µL of double distilled water (control) were added to pre-warmed syringes prior to incubation.
Syringes were inoculated with 30 mL of a rumen fluid-buffer mix (10 mL rumen fluid, 20 mL buffer)
at 39°C for 24 h. In total, four consecutive trials comprised of four runs each were conducted. Each
treatment was incubated in duplicate within one of the four runs (days) using two incubators (WTC
Binder, Tuttlingen, Germany; Memmert, Schwabach, Germany). Therefore, there were eight syringe
replicates per treatment and trial. After 24 h, TGP was measured, the inoculum was decanted, and the
methane concentration in the gas was analysed. TGP and MP were corrected using blanks (incubation
of rumen fluid-buffer mix without grass silage) and standardized to 120 mg DM of grass silage.
In each trial, the TGP and MP of treatments that included tannins were compared to the respective
control treatment. Based on the results obtained with the previously mentioned initial doses, in
subsequent trials, the dose was adapted for each tannin to identify the optimum dose. This optimum
was defined by the maximum reduction in MP without a significant effect on TGP. Tannin products
that reduced both MP and TGP, increased TGP, or were not able to reduce MP were no longer
considered. The maximum tannin product dose was set at 32 mg/syringe.
Experiment 2
Five of the 14 tannin extracts from Experiment 1 were used (chestnut, grape seed, myrabolan, sumach,
and valonea) in the Rusitec. In two consecutive runs, six treatments (the five tannin extracts and a
tannin-free control) were allocated to 24 vessels (12 in each run) with four replicates per treatment.
Two vessels were randomly assigned to each treatment in both runs. The technical details and general
incubation procedure were previously described in detail by Boguhn et al. (2006). In brief, each vessel
contained two nylon bags (100 μm pore size) containing 15 g of grass silage. The tannin extract was
weighed on top of the grass silage. A supplementation level of 1.5 g was chosen based on a pre-test
that we conducted using grape seed extract, which was in accordance with the 10% supplementation
level used in Experiment 1.
Each day, one nylon bag was introduced into the vessel and removed 48 h later, so that two bags were
placed in a vessel at any time. At the start of each run, vessels were inoculated with 400 mL of
artificial saliva (McDougall, 1948), 400 mL of strained rumen fluid, and 60 g of solid rumen content,
originating and mixed in equal parts from the donor animals as mentioned before. The artificial saliva
(572 mL/d, s.d. = 88.9) contained 0.0378 g 15N enriched NH4Cl/L (104 mg 15N/g N analysed;
Chemotrade Chemiehandelsgesellschaft mbH, Leipzig, Germany), and was continuously infused.
After a 7-d adaptation period, enrichment plateaus of 15N in the microbes were reached (Boguhn et al.,
2006), and samples were collected for 7 d. The pH was measured daily before the nylon bags with
feed were changed. Feed residue from the bags was collected from d 8 to d 13 and pooled per vessel.
Samples (50 mL/d) were taken from well-mixed effluent to analyze the ammonia-N (NH3-N), 15N, and

Chapter 3 Study 2
48
VFA concentrations. A suspension from the vessel (25 mL/d) was taken to separate the fraction of
liquid associated microbes (LAM). On d 14, solid associated microbes (SAM) were separated from
feed residues according to Ranilla and Carro (2003) using a methylcellulose solution (1 g/L plus 9 g
NaCl/L).
For VFA, NH3-N, and 15N analyses, the liquid effluent was centrifuged for 15 min at 27,000 × g at
4°C, and the supernatant was frozen at -20°C until analysis. The LAM and SAM fractions were
separated from the suspensions by differential centrifugation. The obtained LAM and SAM fractions
were immediately frozen and stored at -20°C until analysis or freeze dried for 15N analysis.
The Rusitec was modified to be air-tight and allow for quantitative collection of fermentation gas
without dilution by the air originally contained in the flask (Figure 1). A glass cylinder (34 mm in
diameter and 230 mm long) was interconnected between each vessel and the corresponding effluent
flask. At the bottom, the glass cylinder was equipped with an inlet for both gas and effluent from the
vessel and an outlet that led to an effluent collecting flask. At the top of the glass cylinder, the
accumulated gas was directed into a gas-tight plastic bag (10 L Plastigas; Linde AG, Munich,
Germany). The glass cylinder was placed in a water bath (4°C) and filled at the start of each run with a
mix of artificial saliva and rumen fluid as previously mentioned. Glass valves between the vessel,
glass cylinder, and outlet to the gas bag were closed before the daily replacement of nylon bags, gas
bags, and effluent flasks and opened again thereafter.
Figure 1 about here
The TGP was measured as the volume contained in the bags using a drum-type gas meter (TG3; Dr.-
Ing. Ritter Apparatebau GmbH & Co. KG, Bochum, Germany). Samples of the gas (100 mL) were
collected in gas-tight tubes using two valves on each side that were interposed between the gas bags
and the drum-type gas meter.
Analytical Procedures and Calculations
In Experiment 1, the methane concentration in total gas was analysed using an infrared methane
analyzer (Pronova Analysentechnik GmbH & Co. KG, Berlin, Germany) calibrated using a reference
gas (18.0 Vol% CH4; Air Liquide Deutschland GmbH, Düsseldorf, Germany).
In Experiment 2, carbon dioxide and methane were analysed by gas chromatography (GC 14 A;
Shimadzu Deutschland GmbH, Duisburg, Germany) as described by Wischer et al. (2012a) and
calibrated using a reference gas (5.16 Vol% CH4; 74.8 Vol% CO2, Air Liquide Deutschland GmbH,
Düsseldorf, Germany).
The feed and feed residue were analysed for crude nutrients according to official methods (VDLUFA,
2006): DM (method 3.1), crude ash (method 8.1), CP (method 4.1.1), ether extract (EE, extraction
with petroleum ether after treatment with HCl, method 5.1.1b), and CF (method, 6.1.1). Samples were

Chapter 3 Study 2
49
also analysed for NDF, assayed with heat stable amylase, and ADF, both without residual ash
(methods 6.5.1 and 6.5.2, VDLUFA, 2006). All chemical analyses were run in duplicate. Degradation
was calculated as the difference between the input and output of each vessel in relation to input and
expressed as a percentage. The amount of OM and CP in feed residue was corrected for the
contribution by SAM (Boguhn et al., 2006).
Grass silage, residue from the bags, freeze-dried particle-free liquid effluent, LAM, SAM, and
ammonium chloride were analysed for 15N and, in the case of SAM, for total N, using an elemental
analyzer (EA 1108; Carlo Erba Instruments, Biberach, Germany) combined with an isotope mass
spectrometer (MS Finnigan MAT; Thermoquest Italia S.p.A., Milan, Italy). Microbial protein
(microbial N multiplied by 6.25) from LAM was calculated as the difference between the input and
output of 15N divided by the 15N concentration in LAM. Microbial protein originating from SAM was
calculated according to Hildebrand et al. (2011). The daily amount of microbial protein originating
from LAM and SAM together was used to calculate the efficiency of microbial protein synthesis
(EMPS, in g/kg of degraded OM, dOM).
The analysis of VFA was performed by vacuum distillation according to the method of Zijlstra et al.
(1977) with the modifications described by Wischer et al. (2012a). NH3-N was measured by Kjeldahl
steam distillation using phosphate buffer (90 g Na2HPO4 12 H2O/L, adjusted to pH 11.0 with sodium
hydroxide) (Wischer et al., 2012a).
The tannin extracts used in Experiment 2 were analysed for total phenol concentration, non-tannin
phenol concentration, and extractable condensed tannins according to Makkar (2003b) and Jayanegara
et al. (2011) modified as follows. For extraction, a 10-mL mixture of acetone/water (70/30, v/v) was
added to 100 mg of sample and sonicated three times for 15 min on ice with 5 min breaks. After
centrifugation at 3,000 × g for 15 min at 4°C, the supernatants were analysed. To remove the
polyvinylpolypyrrolidone used for the separation of tannin phenols from total phenols, the sample was
centrifuged for 15 min, the supernatant was decanted, and the sample was centrifuged again for
10 min. Extracts were diluted between 1:667 and 1:333 for total phenols and between 1:40 and 1:25
for non-tannin phenols, and 1 mL of diluted extract was mixed with Folin-Ciocalteu’s phenol reagent
(500 µL, diluted 1:1 v/v with distilled water) and sodium carbonate solution (2.5 mL, 88.5 g
Na2CO3·10H2O in 500 mL distilled water). After 60 min, the absorbance of total phenols and non-
tannin phenols was recorded at 725 nm using a UV-VIS spectrophotometer. Tannic acid was used as
calibrant, and values were expressed as tannic acid equivalents. Condensed tannins were expressed as
leucocyanidin equivalents. All analyses were run in duplicate. Chemicals were purchased from VWR
International GmbH, Darmstadt, Germany.

Chapter 3 Study 2
50
Statistical Analyses
The MIXED procedure in the software package SAS (version 9.2, SAS Institute, Cary, NC, USA) was
used for statistical analysis and the level of significance was set at P < 0.05. For both experiments, the
model was as follows: yijk = + i + j + eijk, where the model included tannin i (i) as a fixed effect,
the incubation run j (j) as a random effect, and eijk as a residual effect. Significant differences
between treatments were compared using the t-test.
Chapter 3 Study 2
51
RESULTS
Experiment 1
In trials 1 to 4, the TGP of the control treatment was 30.1 ± 0.4, 26.7 ± 0.5, 25.0 ± 0.4, and 26.7 ±
0.2 mL (LSM ± s.e.), and the respective MP was 5.0 ± 0.1, 4.3 ± 0.1, 4.1 ± 0.1, and 4.0 ± 0.1 mL.
Pelargonidin and cyanidin supplementation did not reduce MP; however, catechin and sinapinic acid
at 0.7 mg/syringe reduced MP by 13% and 10%, respectively, as compared to the control. However,
these effects could not be confirmed for both monomers in a second trial (Figure 2).
Figure 2 about here
The effects of the tannin extracts are presented in Figure 3. Tara extract significantly increased TGP.
Because the focus of this experiment was a reduction in MP and an unchanged TGP, this extract was
not further considered. The individual adaptations in the doses of the remaining tannin extracts
resulted in maximum MP reductions from 8% to 28% without significant effects on TGP. The greatest
reductions in MP at an unchanged TGP were detected with grape seed (28% relative to the control at
24 mg/syringe), myrabolan (22% at 32 mg), valonea (17% at 6 mg), oak (15% at 6 mg), chestnut (14%
at 6 mg), quebracho (13% at 6 mg), sumach (11% at 12 mg), mimosa (10% at 6 mg), and cocoa extract
(8% at 12 mg). Based on these results, chestnut, grape seed, myrabolan, sumach, and valonea extracts
were selected for further investigation in Experiment 2.
Figure 3 about here
Experiment 2
The concentrations of total phenols and tannin phenols (% in DM) for chestnut, grape seed,
myrabolan, sumach, and valonea were 74 and 54, 122 and 99, 60 and 55, 36 and 33, and 72 and 63,
respectively. Grape seed also contained condensed tannins (14% in DM). No condensed tannins were
detected in the other tannin extracts.
The average pH of the vessel fluid was 6.81, and was affected by run (P < 0.001) but not by tannins (P
= 0.48; data not shown). Although carbon dioxide production was not influenced by tannin
supplementation (P = 0.08), the variation between treatments was high and ranged from 464 to
639 mL/d (Table 1). Chestnut caused the greatest decline in MP (63%), followed by valonea (35 %),
grape seed (23%), sumach (18%), and myrabolan (7%; not significantly different from the control). In
relation to the dOM, the production of both carbon dioxide and methane was affected by tannin
supplementation (P = 0.02 and P < 0.001, respectively).
Tannin supplementation significantly affected VFA production, except propionate, which was an
average of 10.6 mmol/d across all treatments. Chestnut extract significantly reduced acetate

Chapter 3 Study 2
52
production by 19%, while grape seed and myrabolan significantly increased acetate production by
22% and 13%, respectively, compared to the control. The average total VFA production was
35.6 mmol/d, and was only significantly reduced by chestnut supplementation. The ratio of acetate to
propionate ranged from 1.17 (chestnut) to 1.91 (grape seed). The production of NH3-N was
significantly reduced by the addition of all tannins except myrabolan. The addition of chestnut led to
the greatest reduction in NH3-N production.
Supplementation with tannin extracts decreased the degradation of all chemical fractions studied (P <
0.05, Table 2). Incubation of grass silage alone resulted in DM and OM degradation of 48.0% and
51.2%, respectively, whereas in treatments supplemented with tannin extracts, the degradation of DM
and OM ranged from 43.6 to 44.7% and from 46.2% to 47.7%, respectively. Significant differences in
DM and OM degradation were not detected between the different tannin treatments. CP degradation
was reduced by supplementation with grape seed, myrabolan, sumach, and valonea, whereas CP
degradation in the presence of chestnut extract did not differ from that of the control. In the control
treatment, degradation of CF, NDF, and ADF was 19.6%, 17.7%, and 19.3%, respectively, and was
significantly reduced in the presence of tannin extracts.
Microbial protein synthesis ranged from 1.10 to 1.15 g/d and was not affected by tannin
supplementation (P = 0.18). The microbial protein averages in the LAM and SAM fractions were 0.82
and 0.32 g/d, respectively, and were not significantly influenced by tannin treatment. The EMPS
ranged between 165 and 174 g/kg dOM, and did not differ significantly between treatments (P = 0.13).

Chapter 3 Study 2
53
DISCUSSION
One of our objectives was to screen different tannin substances commonly used in the food and leather
industries along with rapeseed tannin monomers to determine their potential to reduce MP without
changing TGP. Supplementation of grass silage with catechin, pelargonidin, cyanidin, and sinapinic
acid did not inhibit TGP (Figure 2). In contrast, Lowry and Kennedy (1996) reported that catechin
supplementation reduced in vitro gas production. This discrepancy may have been caused by the
different doses of tannin monomers used. The highest dose of catechin investigated in the present
study was 0.8 mg/syringe (corresponding to 6.66 mg/g of feed). However, the reduction in MP by
catechin and sinapinic acid in trial 1 of Experiment 1 could not be confirmed in trial 2 (Figure 2). It is
possible that the difference between these trials was caused by variation in the composition of the
rumen liquor sampled in each trial. The latter may affect the fermentation characteristics measured
with in vitro techniques like the HGT and the Rusitec (Rymer et al., 2005). The anti-nutritive effects
of tannins are associated with their ability to build complexes with dietary proteins, polymers
(cellulose, hemicellulose, and pectin), and minerals (McSweeney et al., 2001), and their
concentrations in the rumen liquor may have differed. It is not clear to what extent the monomers of
condensed tannins have these complexion properties. Cyanidin and pelargonidin may not have had an
effect on MP because they were degraded to acetate, butyrate, and di- and monohydroxy phenolics by
microorganisms (Lowry and Kennedy, 1996; McSweeney et al., 2001).
All tannin extracts except tara extract had inhibitory effects on MP ranging from 8% to 28% but did
not alter TGP. In contrast to other investigations using plants or plant extracts (Busquet et al., 2005;
Selje et al., 2007; Bodas et al., 2008), the present screening used individually adapted doses of each
tannin product (from 0.3 to 32 mg/syringe) depending on their respective effects on TGP and MP. The
concentration of total phenols, tannin phenols, and condensed tannins was analysed in the tannin
extracts used in Experiment 2 (chestnut, grape seed, myrabolan, sumach, and valonea). They were
characterized by the concentration of tannin phenols, which ranged from 33% to 98% of DM. While
grape seed contained 14% extractable condensed tannins, chestnut, myrabolan, sumach, and valonea
contained only hydrolysable tannins. For grape seed extract, a total phenol concentration of 122% (of
DM) was calculated. We assume that this extract contained substances whose derivatives showed a
stronger absorption at the detection wavelength than those of tannic acid, used as reference in the
determination of total phenols.
When the MP observed in Experiment 1 is correlated to the amount of tannin phenols supplemented, it
becomes clear that valonea and chestnut extract were more efficient in reducing MP than sumach,
myrabolan, and grape seed. This was confirmed by the results of Experiment 2, in which chestnut and
valonea caused the highest reductions in MP (63% and 35%, respectively) compared to the control,
followed by grape seed and sumach. Myrabolan supplementation did not significantly reduce MP. It is
not known whether the dose used in Experiment 2 was too low compared to the doses used in
Experiment 1. However, the total phenol concentration was more than 1.5 fold higher than that of
Chapter 3 Study 2
54
sumach extract, which significantly reduced MP by 18% in Experiment 2. In contrast to experiment 1,
in Experiment 2, the selected tannin extracts were supplemented at equal doses of 1.5 g to 15 g of
grass silage resulting in a trend towards reduced carbon dioxide production (P = 0.08). The tannin
extracts had different effects on acetate production. While chestnut extract supplementation led to
lower acetate production than the control, the inclusion of valonea, sumach, grape seed, and
myrabolan extract did not change or enhance acetate production. Lower acetate production indicates
depression of in vitro fermentation, which is in line with the lower ADF and NDF degradation in
tannin-containing treatments. However, the equal or enhanced acetate production in the presence of
valonea, sumach, grape seed, and myrabolan extract, which was not reflected in equal or enhanced
degradation of fibre fractions, may be due to the accumulation of acetate and butyrate originating from
the degradation of hydrolysable tannins (McSweeney et al., 2001). Propionate production was not
affected by tannin inclusion. In contrast to other substances like monensin, saponins, and essential oils,
the effects of tannins on methanogenesis are not attributed to changes in propionate production
(Stanier and Davies, 1981; Patra, 2010). Regarding the numerically lower production of carbon
dioxide and the significantly reduced total VFA production observed for chestnut extract, it is likely
that the chestnut extract dose was already too high; therefore, in vitro fermentation was adversely
affected.
Degradation of DM and OM was significantly affected by tannin inclusion. In addition to an inhibitory
tannin effect, it is possible that the observed effect was caused by the tannin extract being less
degradable by microorganism than the grass silage (Makkar et al., 1995b). The degradation of fibre
fractions was reduced in all tannin-containing treatments, which suggests that fibrolytic bacteria were
inhibited by tannin extracts. As previously mentioned, this probably interfered with the degradation of
hydrolysable tannins, resulting in acetate as the end product. Therefore, it is possible that the reduction
in MP was partly due to a decline in the degradation of fibre fractions, which supports the hypothesis
that decreased hydrogen availability leads to reduced MP (Bodas et al., 2008). A meta-analysis
conducted by Patra (2010) indicated that decreased MP due to tannin supplementation was
accompanied by a linear decrease in OM (P = 0.08, R2 = 0.19) and NDF digestibility (P = 0.12, R2 =
0.23).
It is well known that tannins complex with proteins, thereby reducing their degradation in the rumen,
which seems not to be related to their potential to reduce methane (Patra, 2010). In the present study,
the degradation of CP was reduced for all tannin treatments except chestnut. This was in agreement
with the lower NH3-N production in effluent observed for grape seed, sumach, and valonea. This also
indicates that tannins form complexes with feed and microbial proteins and render them undegradable.
Moreover, it has been suggested that these tannin extracts reduce the growth of proteolytic bacteria.
Jones et al. (1994) previously reported that condensed tannins (Onobrychis viciifolia) inhibited the
growth and protease activity of Butyrivibrio fibrisolvens and Streptococcus bovis, and to a lesser
extent, Prevotella ruminicola and Ruminobacter amylophilus.

Chapter 3 Study 2
55
In the present study, microbial protein synthesis was not significantly affected by tannin inclusion (P =
0.18), which is probably due to the fact that the reduced NH3-N concentration was still sufficient for
microbial protein synthesis (greater than 5 mg NH3-N/100 mL rumen fluid, Roffler and Satter, 1975).
The microbial protein synthesis originating from SAM tended to be increased by tannin treatment (P =
0.07), whereas the microbial protein synthesis originating from LAM was not affected by tannin
inclusion (P = 0.21). Makkar (2003a) found a 16% decline in total VFA production upon chestnut
extract addition, but the EMPS remained unaffected. These results contradict his hypothesis that
tannins increase EMPS by channelling a higher proportion of available nutrients towards synthesis of
microbial protein. The discrepancies between his and the present findings perhaps were related to the
different in vitro systems used (HGT vs. Rusitec). Differences in the amount of OM introduced into
the vessels may also contribute to the differences. Compared to the control (15 g grass silage), tannin
treatments received 1.5 g of tannin extract on top, which increased the OM available for fermentation.
In future investigations, a reduction in the grass silage to compensate for the inclusion of tannin
extracts, or the use of more purified tannin extracts may allow for better clarification of the effects on
EMPS.
CONCLUSIONS
Nine of the ten tannin extracts tested and two of the rapeseed tannin monomers reduced MP without
inhibiting TGP. The Rusitec results showed that chestnut and valonea extracts have great potential to
reduce MP in vitro. We hypothesised that similar effects may be found in vivo, and this hypothesis
was tested in a long-term respiration study using sheep (Wischer et al., 2012b).
ACKNOWLEDGEMENTS
Support for this study from the H. Wilhelm Schaumann Stiftung (Hamburg, Germany) through a
doctoral scholarship for G. Wischer is gratefully acknowledged. We thank Helga Terry and Sibylle
Rupp for their excellent technical support in gas and tannin analyses.

Chapter 3 Study 2
56
REFERENCES
used in chapter 3
Animut G, Puchala R, Goetsch AL, Patra AK, Sahlu T, Varel VH and Wells J 2008. Methane emission by goats consuming diets with different levels of condensed tannins from lespedeza. Animal Feed Science and Technology 144, 212-227.
Beauchemin KA, McGinn SM, Martinez TF and McAllister TA 2007. Use of condensed tannin extract from quebracho trees to reduce methane emissions from cattle. Journal of Animal Science 85, 1990-1996.
Bodas R, López S, Fernández M, García-González R, Rodríguez AB, Wallace RJ and González JS 2008. In vitro screening of the potential of numerous plant species as antimethanogenic feed additives for ruminants. Animal Feed Science and Technology 145, 245-258.
Boguhn J, Kluth H and Rodehutscord M 2006. Effect of total mixed ration composition on fermentation and efficiency of ruminal microbial crude protein synthesis in vitro. Journal of Dairy Science 89, 1580-1591.
Busquet M, Calsamiglia S, Ferret A and Kamel C 2005. Screening for effects of plant extracts and active compounds of plants on dairy cattle rumen microbial fermentation in a continuous culture system. Animal Feed Science and Technology 123-124 PART 2, 597-613.
Carulla JE, Kreuzer M, Machmüller A and Hess HD 2005. Supplementation of Acacia mearnsii tannins decreases methanogenesis and urinary nitrogen in forage-fed sheep. Australian Journal of Agricultural Research 56, 961-970.
Chiquette J, Cheng KJ, Rode LM and Milligan LP 1989. Effect of tannin content in two isosynthetic strains of birdfoot trefoil (Lotus corniculatus L.) on feed digestibility and rumen fluid composition in sheep. Canadian Journal of Animal Science 69, 1031-1039.
Czerkawski JW and Breckenridge G 1977. Design and development of a long-term rumen simulation technique (Rusitec). British Journal of Nutrition 38, 371-384.
Grainger C, Clarke T, Auldist MJ, Beauchemin KA, McGinn SM, Waghorn GC and Eckard RJ 2009. Potential use of Acacia mearnsii condensed tannins to reduce methane emissions and nitrogen excretion from grazing dairy cows. Canadian Journal of Animal Science 89, 241-251.
Hildebrand B, Boguhn J and Rodehutscord M 2011. Effect of maize silage to grass silage ratio and feed particle size on protein synthesis and amino acid profile in different microbial fractions in a semi-continuous rumen simulation. Animal 5, 537-546.
Jayanegara, A., F. Leiber, and M. Kreuzer. 2012. Meta-analysis of the relationship between dietary tannin level and methane formation in ruminants from in vivo and in vitro experiments. Journal of Animal Physiology and Animal Nutrition 96, 365-375.
Jayanegara, A., E. Wina, C. R. Soliva, S. Marquardt, M. Kreuzer, and F. Leiber. 2011. Dependence of forage quality and methanogenic potential of tropical plants on their phenolic fractions as determined by principal component analysis. Animal Feed Science and Technology 163, 231-243.
Johnson KA and Johnson DE 1995. Methane emissions from cattle. Journal of Animal Science 73, 2483-2492.

Chapter 3 Study 2
57
Jones GA, McAllister TA, Muir AD and Cheng K-J 1994. Effects of Sainfoin (Onobrychis viciifolia Scop.) Condensed Tannins on Growth and Proteolysis by Four Strains of Ruminal Bacteria. Applied and Environmental Microbiology 60, 1374-1378.
Lowry JB and Kennedy PM 1996. Fermentation of flavonols by rumen organisms. Proceedings of the Australian Society of Animal Production 21, 366.
Makkar HP, Blummel M and Becker K 1995a. In vitro effects of and interactions between tannins and saponins and fate of tannins in the rumen. Journal of the Science of Food and Agriculture 69, 481-493.
Makkar HPS 2003a. Effects and fate of tannins in ruminant animals, adaptation to tannins, and strategies to overcome detrimental effects of feeding tannin-rich feeds. Small Ruminant Research 49, 241-256.
Makkar HPS 2003b. Quantification of tannins in tree and shrub foliage: A laboratory manual. Kluwer Academic Publishers, Dordrecht, The Netherlands.
Makkar HPS, Becker K, Abel H and Szegletti C 1995b. Degradation of condensed tannins by rumen microbes exposed to quebracho tannins (QT) in rumen simulation technique (RUSITEC) and effects of QT on fermentative processes in the RUSITEC. Journal of the Science of Food and Agriculture 69, 495-500.
McDougall EI 1948. Studies on ruminant saliva. 1. The composition and output of sheep’s saliva. The Biochemical Journal 43, 99-109.
McSweeney CS, Palmer B, McNeill DM and Krause DO 2001. Microbial interactions with tannins: Nutritional consequences for ruminants. Animal Feed Science and Technology 91, 83-93.
Menke KH, Raab L, Salewski A, Steingass H, Fritz D and Schneider W 1979. The estimation of the digestibility and metabolizable energy content of ruminant feedingstuffs from the gas production when they are incubated with rumen liquor in vitro. The Journal of Agricultural Science 93, 217-222.
Naczk M, Amarowicz R, Sullivan A and Shahidi F 1998. Current research developments on polyphenolics of rapeseed/canola: A review. Food Chemistry 62, 489-502.
Patra AK 2010. Meta-analyses of effects of phytochemicals on digestibility and rumen fermentation characteristics associated with methanogenesis. Journal of the Science of Food and Agriculture 90, 2700-2708.
Patra AK and Saxena J 2011. Exploitation of dietary tannins to improve rumen metabolism and ruminant nutrition. Journal of the Science of Food and Agriculture 91, 24-37.
Puchala R, Min BR, Goetsch AL and Sahlu T 2005. The effect of a condensed tannin-containing forage on methane emission by goats. Journal of Animal Science 83, 182-186.
Ranilla MJ and Carro MD 2003. Diet and procedures used to detach particle-associated microbes from ruminal digesta influence chemical composition of microbes and estimation of microbial growth in Rusitec fermenters. Journal of Animal Science 81, 537-544.
Reed JD 1995. Nutritional toxicology of tannins and related polyphenols in forage legumes. Journal of Animal Science 73, 1516-1528.
Roffler RE and Satter LD 1975. Relationship between ruminal ammonia and nonprotein nitrogen utilization by ruminants. I. Development of a model for predicting nonprotein nitrogen utilization by cattle. Journal of Dairy Science 58, 1880-1888.
Chapter 3 Study 2
58
Rymer C, Huntington JA, Williams BA and Givens DI 2005. In vitro cumulative gas production techniques: History, methodological considerations and challenges. Animal Feed Science and Technology 123-124 Part 1, 9-30.
Selje N, Hoffmann EM, Muetzel S, Ningrat R, Wallace RJ and Becker K 2007. Results of a screening programme to identify plants or plant extracts that inhibit ruminal protein degradation. British Journal of Nutrition 98, 45-53.
Śliwiński BJ, Soliva CR, Machmüller A and Kreuzer M 2002. Efficacy of plant extracts rich in secondary constituents to modify rumen fermentation. Animal Feed Science and Technology 101, 101-114.
Stanier G and Davies A 1981. Effects of the antibiotic monensin and an inhibitor of methanogenesis on in vitro continuous rumen fermentations. British Journal of Nutrition 45, 567-578.
VDLUFA (Verband Deutscher Landwirtschaftlicher Untersuchungs- und Forschungsanstalten) 2006. Handbuch der Landwirtschaftlichen Versuchs- und Untersuchungsmethodik (VDLUFA-Methodenbuch), Bd. III Die chemische Untersuchung von Futtermitteln. VDLUFA-Verlag, Darmstadt, Germany.
Waghorn GC, Ulyatt MJ, John A and Fisher MT 1987. The effect of condensed tannins on the site of digestion of amino acids and other nutrients in sheep fed on Lotus corniculatus L. British Journal of Nutrition 57, 115-126.
Wischer G, Boguhn J, Steingaß H, Schollenberger M and Rodehutscord M 2012a. Effect of monensin on in vitro fermentation of silages and microbial protein synthesis. Journal of Dairy Science, submitted.
Wischer, G, Greiling AM, Boguhn, J, Steingaß H, Schollenberger M, Hartung K and Rodehutscord M 2012b. Effects of long-term supplementation of chestnut and valonea extracts on methane release, digestibility, and nitrogen excretion in sheep. Animal, submitted simultaneously with this manuscript
Zijlstra JB, Beukema J, Wolthers BG, Byrne BM, Groen A and Ankert JD 1977. Pretreatment methods prior to gaschromatographic analysis of volatile fatty acids from faecal samples. Clinica Chimica Acta 78, 243-250.

Chapter 3 Study 2
59
Figure 1: Schematic diagram of a vessel (a) of the Rusitec extended by a glass cylinder (b) and valves
(c) to ensure gas separation from the effluent and collection in a gas-tight plastic bag (d) without
dilution from the dead volume of the flask collecting effluent (e). The glass cylinder (b) was filled
with a rumen fluid-buffer mix at the start of incubation. The glass cylinder and the effluent flask were
placed in an ice-cold water bath (not shown).

Chapter 3 Study 2
60
Figure 2: Effect of different doses of rapeseed tannin monomers on total gas production (white bars)
and methane production (black bars) relative to the control (set to 100) using the HGT. The asterisks
indicate treatments that differ significantly from the control treatment within the respective trial.
Pelargonidin
0.3 0.7 0.7 0.8 1.00
20
40
60
80
100
120
0
20
40
60
80
100
120
trial 1 trial 2
mg per syringe
Catechin
0.3 0.7 0.3 0.5 0.7 0.80
20
40
60
80
100
120
0
20
40
60
80
100
120
*
trial 1 trial 2
mg per syringe
Cyanidin
0.3 0.70
20
40
60
80
100
120
0
20
40
60
80
100
120
trial 1
mg per syringe
Sinapinic acid
0.3 0.7 0.7 0.8 1.00
20
40
60
80
100
120
0
20
40
60
80
100
120
*
trial 1 trial 2
mg per syringe

Chapter 3 Study 2
61
Cocoa
6 12 12 240
20
40
60
80
100
120
0
20
40
60
80
100
120
* *
* *
*
trial 1 trial 3
mg per syringe
Chestnut
6 12 4 6 10 3 6 20
20
40
60
80
100
120
0
20
40
60
80
100
120
**
*
* *** *
**
*
trial 1 trial 2 trial 3 trial 4
mg per syringe
Mimosa
6 12 4 6 10 6 10 6 80
20
40
60
80
100
120
0
20
40
60
80
100
120
* ***
** * * * *
trial 1 trial 2 trial 3 trial 4
mg per syringe
Myrabolan
6 12 12 16 20 12 32 12 160
20
40
60
80
100
120
0
20
40
60
80
100
120
* * * * **
**
trial 1 trial 2 trial 3 trial 4
mg per syringe
Oak
6 12 4 6 10 5 10 2 40
20
40
60
80
100
120
0
20
40
60
80
100
120
* **
*
* * * * **
**
trial 1 trial 2 trial 3 trial 4
mg per syringe
Quebracho
6 12 6 10 16 6 8 8 100
20
40
60
80
100
120
0
20
40
60
80
100
120
* *
* **
* * *
*
* ** *
trial 1 trial 2 trial 3 trial 4
mg per syringe
Valonea
6 12 6 10 16 6 8 60
20
40
60
80
100
120
0
20
40
60
80
100
120
** *
*** *
* **
*
trial 1 trial 2 trial 3 trial 4
mg per syringe
Grape seed
6 12 12 16 20 12 24 12 200
20
40
60
80
100
120
0
20
40
60
80
100
120
*
*
* ** *
*
**
*
trial 1 trial 2 trial 3 trial 4
mg per syringe
Sumach
6 12 12 16 200
20
40
60
80
100
120
0
20
40
60
80
100
120
*
* *
*
trial 1 trial 2
mg per syringe
Tara
6 120
20
40
60
80
100
120
0
20
40
60
80
100
120
*
*
trial 1
mg per syringe

Chapter 3 Study 2
62
Figure 3: Effect of different doses of tannin extracts on total gas production (white bars) and methane
production (black bars) relative to the control (set to 100) using the HGT. The asterisks indicate
treatments that differ significantly from the control within the respective trial.
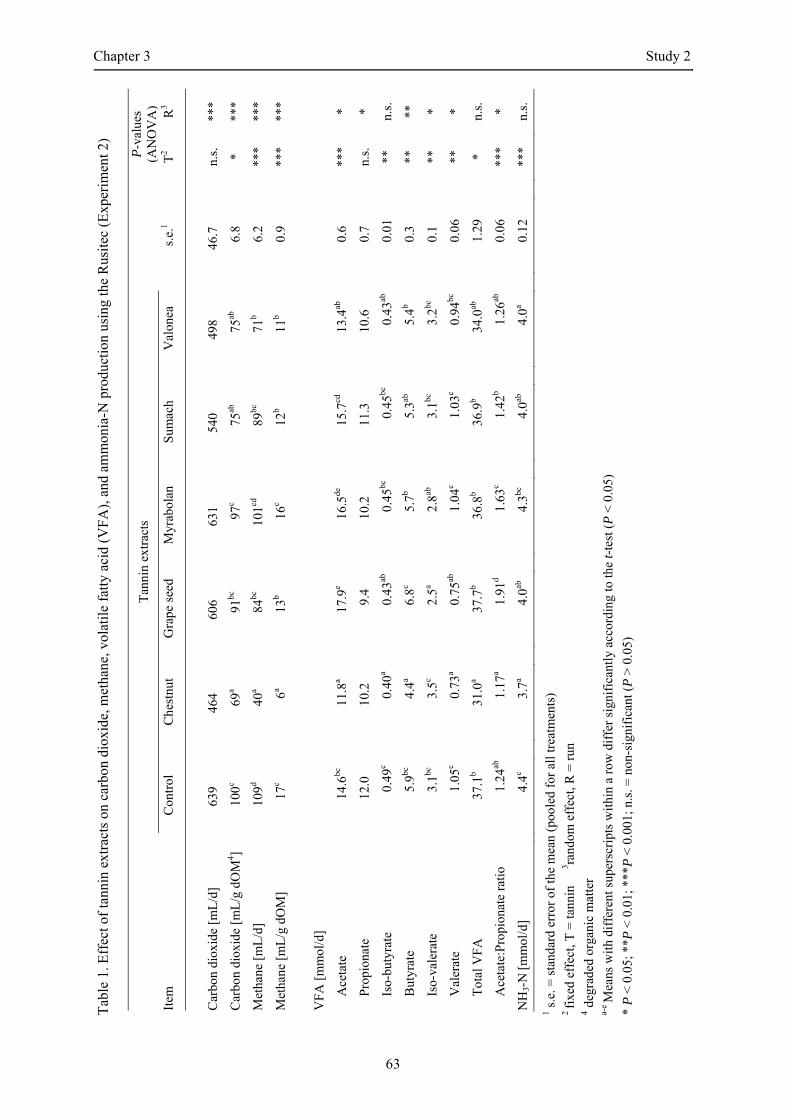
Chapter 3 Study 2
63
Tab
le 1
. Eff
ect o
f ta
nnin
ext
ract
s on
car
bon
diox
ide,
met
hane
, vol
atil
e fa
tty
acid
(V
FA
), a
nd a
mm
onia
-N p
rodu
ctio
n us
ing
the
Rus
itec
(E
xper
imen
t 2)
Tan
nin
extr
acts
P-v
alue
s (A
NO
VA
) It
em
C
ontr
ol
C
hest
nut
G
rape
see
d
Myr
abol
an
S
umac
h
Val
onea
s.e.
1
T2
R3
Car
bon
diox
ide
[mL
/d]
63
9 46
4 60
6 63
1 54
0 49
8 46
.7
n.
s.
***
Car
bon
diox
ide
[mL
/g d
OM
4 ]
100c
69a
91bc
97
c 75
ab
75ab
6.
8
* **
*
Met
hane
[m
L/d
]
109d
40a
84bc
10
1cd
89bc
71
b 6.
2
***
***
Met
hane
[m
L/g
dO
M]
17
c 6a
13b
16c
12b
11b
0.9
**
* **
*
VFA
[m
mol
/d]
Ace
tate
14.6
bc
11.8
a 17
.9e
16.5
de
15.7
cd
13.4
ab
0.6
**
* *
Pro
pion
ate
12
.0
10.2
9.
4 10
.2
11.3
10
.6
0.7
n.
s.
*
Iso-
buty
rate
0.49
c 0.
40a
0.43
ab0.
45bc
0.
45bc
0.43
ab0.
01
**
n.
s.
But
yrat
e
5.9bc
4.
4a 6.
8c 5.
7b 5.
3ab
5.4b
0.3
**
**
Iso-
vale
rate
3.1bc
3.
5c 2.
5a 2.
8ab
3.1bc
3.
2bc
0.1
**
*
Val
erat
e
1.05
c 0.
73a
0.75
ab1.
04c
1.03
c 0.
94bc
0.06
**
*
Tot
al V
FA
37.1
b 31
.0a
37.7
b 36
.8b
36.9
b 34
.0ab
1.
29
*
n.s.
Ace
tate
:Pro
pion
ate
rati
o
1.24
ab1.
17a
1.91
d 1.
63c
1.42
b 1.
26ab
0.06
***
*
NH
3-N
[mm
ol/d
]
4.4c
3.7a
4.0ab
4.
3bc
4.0ab
4.
0a 0.
12
**
* n.
s.
1 s.e
. = s
tand
ard
erro
r of
the
mea
n (p
oole
d fo
r al
l tre
atm
ents
) 2 fi
xed
effe
ct, T
= ta
nnin
3 ra
ndom
eff
ect,
R =
run
4 d
egra
ded
orga
nic
mat
ter
a-e M
eans
wit
h di
ffer
ent s
uper
scri
pts
wit
hin
a ro
w d
iffe
r si
gnif
ican
tly
acco
rdin
g to
the
t-te
st (
P <
0.0
5)
* P
< 0
.05;
**P
< 0
.01;
***
P <
0.0
01; n
.s. =
non
-sig
nifi
cant
(P
> 0
.05)

Chapter 3 Study 2
64
Tab
le 2
. Eff
ect o
f ta
nnin
ext
ract
s on
the
degr
adat
ion
of c
hem
ical
fra
ctio
ns a
nd m
icro
bial
pro
tein
syn
thes
is u
sing
the
Rus
itec
(E
xper
imen
t 2)
Tan
nin
extr
acts
P-v
alue
s (A
NO
VA
) It
em
C
ontr
ol
C
hest
nut
G
rape
see
d
Myr
abol
an
S
umac
h
Val
onea
s.e.
1
T2
R3
Deg
rada
tion
[%]4
DM
48.0
b 44
.0a
44.7
a 43
.6a
44.0
a 43
.8a
0.57
***
n.s.
OM
51.2
b 47
.7a
46.8
a 46
.2a
47.1
a 47
.2a
0.52
***
n.s.
CP
80.8
c 79
.1bc
74
.5a
76.3
ab
75.1
a 76
.5ab
1.
21
*
n.s.
CF
19.6
d 11
.2a
13.1
ab
16.0
c 15
.2bc
12
.3a
0.77
***
n.s.
ND
F
17.7
d 13
.4c
10.5
ab
12.5
bc
13.1
c 9.
9a 0.
72
**
* n.
s.
AD
F
19.3
c 11
.1a
13.2
ab
15.8
b 15
.9b
15.2
b 1.
02
**
* n.
s.
mic
robi
al p
rote
in [
g/d]
5
1.14
1.
15
1.10
1.
11
1.15
1.
13
0.02
n.s.
n.
s.
in
LA
M [
g/d]
0.85
0.
79
0.84
0.
80
0.82
0.
79
0.02
n.s.
n.
s.
in
SA
M [
g/d]
0.29
0.
37
0.26
0.
32
0.33
0.
34
0.02
n.s.
n.
s.
EM
PS
6
174
171
165
171
172
172
1.99
n.s.
n.
s.
1 s.e
. = s
tand
ard
erro
r of
the
mea
n (p
oole
d fo
r al
l tre
atm
ents
) 2 fi
xed
effe
ct, T
= ta
nnin
3 ra
ndom
eff
ect,
R =
run
4 D
M =
dry
mat
ter;
OM
= o
rgan
ic m
atte
r; C
F =
cru
de f
ibre
5 L
AM
= li
quid
ass
ocia
ted
mic
robe
s; S
AM
= s
olid
ass
ocia
ted
mic
robe
s 6 E
ffic
ienc
y of
mic
robi
al p
rote
in s
ynth
esis
(g
mic
robi
al p
rote
in/k
g de
grad
ed o
rgan
ic m
atte
r)
a-e M
eans
wit
h di
ffer
ent s
uper
scri
pts
wit
hin
a ro
w d
iffe
r si
gnif
ican
tly
acco
rdin
g to
the
t-te
st (
P <
0.0
5).
* P
< 0
.05;
***
P <
0.0
01; n
.s. =
non
-sig
nifi
cant
(P
> 0
.05)

Chapter 4 Study 3
65
4. STUDY 3
EFFECTS OF LONG-TERM SUPPLEMENTATION OF CHESTNUT
AND VALONEA EXTRACTS ON METHANE RELEASE,
DIGESTIBILITY, AND NITROGEN EXCRETION IN SHEEP
G. Wischer*, A.M. Greiling*, J. Boguhn*, H. Steingaß*, M. Schollenberger*, K. Hartung† and M. Rodehutscord*
*Institut für Tierernährung, Universität Hohenheim, Emil-Wolff-Str. 10, 70599 Stuttgart, Germany †Institut für Kulturpflanzenwissenschaften, Fachgebiet Bioinformatik, Universität Hohenheim, Fruwirthstr. 23, 70599 Stuttgart, Germany
Submitted to Animal

Chapter 4 Study 3
66
Effects of long-term supplementation of chestnut and valonea extracts on
methane release, digestibility, and nitrogen excretion in sheep
G. Wischer1, A.M. Greiling1, J. Boguhn1, H. Steingaß1, M. Schollenberger1, K. Hartung2 and M.
Rodehutscord1,a
1Institut für Tierernährung, Universität Hohenheim, Emil-Wolff-Str. 10, 70599 Stuttgart, Germany 2Institut für Kulturpflanzenwissenschaften, Fachgebiet Bioinformatik, Universität Hohenheim,
Fruwirthstr. 23, 70599 Stuttgart, Germany
a Corresponding author: Markus Rodehutscord. E-mail: [email protected]
Running head: Long-term effects of tannins on methane release
Presented in part at the annual meeting of the Society of Nutrition Physiology, Göttingen, Germany. March 20-23, 2012. G. Wischer, A. M. Greiling, J. Boguhn, H. Steingaß, M. Schollenberger, K. Hartung and M. Rodehutscord (2012) Long-term effects of feeding tannin extracts on methane release, digestibility and urinary excretion of purine derivatives in sheep. Proc. Soc. Nutr. Physiol. 21:44.

Chapter 4 Study 3
67
ABSTRACT
The long-term effects of adding chestnut (CHE; Castanea sativa) and valonea (VAL; Quercus
valonea) tannin extracts to sheep feed were investigated. In Experiment 1, sheep (65 kg BW) were fed
842 g/day of hay. The control-treated animals (CON) received 464 g/day of concentrate, and tannin-
treated animals received the same amount of concentrate additionally containing 20 g of the respective
tannin extract. After the onset of treatment, methane release was measured in respiration chambers for
23.5-h intervals (nine times) in a 190-days period. Faeces and urine were collected three times
(including once before the onset of tannin treatment) to assess digestibility, N and energy metabolism,
and urinary excretion of purine derivatives. Based on the results obtained for Experiment 1, a second
experiment (Experiment 2) was initiated, in which the tannin dosage was almost doubled from 0.9
(Experiment 1) to 1.7 g/kg BW0.75 per day. With the exception of the dosage and duration of treatment
(85 days), Experiment 2 followed the same design as Experiment 1, and the same measurements were
taken. Hay and concentrates used in both experiments were examined in vitro for their effects on total
gas and methane production by using the Hohenheim gas test. In vitro methane production was
significantly reduced by the addition of tannins when concentrates were incubated alone, but not when
concentrates and hay were incubated together. However, neither tannin extract of either dosage was
able to reduce methane release significantly from sheep during the experimental periods. On the first
day of tannin feeding in both experiments, tannin inclusion tended to decrease methane release, but
this trend disappeared by day 57. In balance period 3 of Experiment 1, lower dry matter and organic
matter digestibility was noted for tannin treatments. The digestibility of CP, but not NDF or ADF, was
reduced in both experiments. A significant shift in N excretion from urine to faeces was observed for
both tannin extracts in both experiments, particularly in Experiment 2. In balance period 2 of
Experiment 2, an increased intake of metabolisable energy for VAL was observed. The urinary
excretion of purine derivatives was not significantly different between treatments, indicating that
microbial protein synthesis was equal for all treatments. Thus, we concluded that both tannin extracts
affect processes in the rumen but did not alter methane release over a longer period, despite the fact
that in vitro tests with the same products produced an effect.
Keywords: tannin extract, long-term respiration, methane release, nitrogen, microbial protein
synthesis
Chapter 4 Study 3
68
IMPLICATIONS
A study on the effects of tannin extracts on methane release from sheep was conducted. Few long-term
studies of this type have been carried out. We found that the inclusion of chestnut and valonea extract
in feed did not change the release of methane from sheep. Upon feeding with the tannin extracts, a
portion of the excreted N was shifted from urine to faeces, which may help to reduce ammonia release
from manure. The effects may have been greater if higher dosages were used. However, at higher
dosages, negative effects of nutrient digestibility and feed intake are likely to occur.

Chapter 4 Study 3
69
INTRODUCTION
Methane is a potent greenhouse gas, of which about 11% to 17% of global emissions consist of enteric
methane produced by ruminants (Beauchemin et al., 2009). Its production serves as an electron sink,
thereby avoiding hydrogen accumulation, which would negatively affect rumen fermentation (Martin
et al., 2010). The release of methane is an essential process of rumen fermentation, but it also
represents an energy loss for the host animal (Johnson and Johnson, 1995).
Methane production can be reduced by different means, including by plant constituents such as
saponins and tannins (Van Nevel, 1996; McAllister and Newbold, 2008; Hook et al., 2010). Tannins -
a fraction of polyphenols in plants- are generally divided into condensed (cT) and hydrolysable (hT)
tannins. Since tannins are able to form complexes with feed and microbial proteins, polymer
carbohydrates (e.g. cellulose and hemicellulose), and minerals, they may modify the metabolism of
these substances in the rumen (McSweeney et al., 2001). For example, tannins may protect dietary
protein against rumen degradation, which can increase the efficiency of microbial protein synthesis
(Patra and Saxena, 2011) and alter N excretion (Makkar, 2003).
Tannins may have anti-nutritive effects (Reed, 1995), which are assumed to be mainly associated with
hT (McAllister and Newbold, 2008), suggesting that only cT are suitable for use in animals. Hence,
research on the influence of tannins on the release of methane has mainly focused on cT. However,
Mueller-Harvey (2006) suggested that both tannin classes are similar with regard to their methane
mitigating effects. Moreover, Goel and Makkar (2011) found that hT appear even more promising for
methane reduction than cT.
In a previous in vitro study, we showed that chestnut (CHE) and valonea (VAL) extracts -which
mainly contain hT- have great potential to reduce methane production (Wischer et al., 2012). In
contrast to cT, hT are thought to be degradable in the rumen (Makkar, 2003), suggesting that the
effects of hT identified in vitro may disappear with time in vivo due to rumen degradation (Murdiati et
al., 1992). Thus, animal studies are required to investigate whether tannins are able to reduce methane
release over a longer period of several weeks (de Oliveira et al., 2007; Beauchemin et al., 2009;
Jayanegara et al., 2011). The first objective of the present study was to examine the effect of long-term
feeding of CHE and VAL extract on methane release in sheep. We hypothesised that the
supplementation of CHE and VAL extract to the diet would lead to a consistent decrease in methane
release.
For a more comprehensive and long-term assessment, the effects of supplementation of the two tannin
extracts on digestibility, energy metabolism, N excretion, and microbial protein synthesis were also
investigated. It was hypothesised that the pathways of N excretion and microbial protein synthesis in
the rumen, but not digestibility, would be altered by the tannin extracts.

Chapter 4 Study 3
70
MATERIALS AND METHODS
The study was approved in accordance with the animal welfare legislation by the Provincial
Government of Stuttgart, Germany (No. V 285/10 TE). Two experiments were conducted using
different amounts of tannin extract supplement. The second experiment was initiated four months after
starting the first experiment, when it became apparent that the tannin dosage in Experiment 1 did not
produce significant effects on methane release.
Two tannin extracts (CHE and VAL) were used in both experiments. The CHE extract, which
predominantly contains hT, originated from sweet chestnut wood (Castanea sativa; Tanin Sevnica
d.d., Sevnica, Slovenia). The VAL extract, an extract of the cups from the valonea tree (Quercus
valonea; Valonea extract Standard, Baeck GmbH & Co. KG, Norderstedt, Germany), contained a
tannin concentration of 67.0% (manufacturer’s specification) and a high proportion of hT.
Animals and treatments
Twenty-four 8-month-old wether sheep (Merinolandschaf breed) were used in the study. Prior to the
study, the sheep were adapted to the experimental conditions and facilities. Twelve sheep with an
initial BW of 65.4 ± 5.0 kg (mean ± s.d.) were used in Experiment 1. The other 12 animals (59.9 ± 5.5
kg) were used in Experiment 2. The amount of feed offered was related to the metabolic body size
(BW0.75) and equal in both experiments. Animals were housed in groups of four; however, they were
individually fixed to troughs for meals in order to control individual feed intake. Animals had
unrestricted access to water.
The feed comprised a hay-concentrate mix, which was offered in two equal meals per day (at about
08:00 h and 15:30 h). It was calculated to achieve a daily metabolisable energy (ME) intake of
approximately 1.2-fold of the mean maintenance requirement (Gesellschaft für Ernährungsphysiologie
[GfE], 1991; Deutsche Landwirtschafts-Gesellschaft, 1997). Sheep were fed 842 and 784 g/day of hay
(Table 1) in Experiments 1 and 2, respectively. The control animals (CON) received 464 and
432 g/day of mixed concentrate, whereas the animals treated with tannins received 484 and 468 g/day
concentrate in Experiments 1 and 2, respectively, with the respective differences from CON
representing the amount of tannin extracts. Concentrates were calculated to provide a daily amount of
0.9 and 1.7 g/kg BW0.75 of tannin extract in Experiments 1 and 2, respectively. The composition of the
concentrates is shown in Table 1. The total amount of concentrate required was mixed in one batch
and divided into three equal portions. The CON concentrate was not supplemented. For tannin
treatments in Experiments 1 and 2, 45.5 or 91.0 g of each tannin extract was added on top of each
kilogram of the concentrate. Tannin-containing concentrates were mixed again, and all three
concentrates were pelleted through a pellet die with a hole diameter of 3 mm.
Chapter 4 Study 3
71
Respiration measurements
Two respiration chambers were used in both experiments. During a 3-week pre-experimental period,
all sheep were fed with the CON diet (Figure 1). Thereafter, the pre-experimental methane release
from each animal was measured twice for 23.5 h (periods R1 and R2, Figure 1). Sheep were weighed
(BWI-30000; Bosche GmbH, Damme, Germany) before and after each respiration measurement.
Animals were then allocated to the treatments in a way that the average pre-experimental methane
release related to BW0.75 was equal (n = 4 sheep per treatment). Within one treatment, two animals
were assigned to each of the two chambers.
Feeding of the experimental diets was started consecutively for two animals per day so that all
respiration measurements could be taken at the same time intervals (Figure 1), i.e. on days 1, 8, 15, 29,
57, and 85 after the onset of treatment in both experiments. Experiment 1 was conducted for a longer
period, and additional respiration measurements were taken on days 113, 148, and 190.
Insert Figure 1 here.
The dimensions of the open circuit, independently constructed respiration chambers were 205 × 100 ×
250 cm, with an effective volume of 5,000 L. A humidity of approximately 50% and a temperature of
approximately 20°C were maintained by air conditioning. Sheep were placed in balance cages inside
the chambers (70 cm wide, 150 cm long) to collect samples of urine and faeces.
During the 23.5-h measurement period, the amount of exhaust air from the chambers were quantified
by using differential pressure transmitters (H+B ND400; ABB Automation GmbH, Ratingen,
Germany). The concentrations of methane (CH4) and carbon dioxide (CO2) in fresh and exhaust air
were measured by using an infrared absorption gas analyser (H+B Uras 10; ABB Automation GmbH,
Ratingen, Germany) and were logged online in 15-min intervals (separately for each chamber). In
addition to the online measurements, aliquots of fresh and exhaust air were collected in gas receptors,
which were used when the online measurement failed. The gas analyser was calibrated daily using a
reference gas (vol%: 0.099 CH4 and 0.964 CO2; Air Liquide Deutschland GmbH, Düsseldorf,
Germany) and controlled for subsequent correction of temporary drift. The recovery was controlled
periodically by the release of a defined amount (approximately 400 g within 6 h) of CO2. Recovery
rates were considered in calculation of the volume of inflowing and outflowing air.
Balance studies
In both experiments, three balance studies (B) were conducted and digestibility was determined
considering the protocol suggested by GfE (1991): B1, pre-experimental period; B2, starting 22 days
after the onset of treatments; and B3, at the end of the respective experiment (Figure 1). Urinary

Chapter 4 Study 3
72
excretion of total N and purine derivatives was also determined during these periods. Faeces and urine
were collected for six and three consecutive days, respectively. Urine was trapped in approximately
200 mL of 10% sulphuric acid, achieving a final pH of less than three to prevent the release of volatile
N compounds. Amount of faeces and urine were determined, aliquots taken, accumulated for each
animal, and stored at 0°C. A representative sample of fresh faeces was crushed and used for analysis
of total N concentration. Subsequently, the faeces were oven-dried at 60°C for 48 h and ground
through a 0.5-mm sieve for further analyses. Urine was filtered (MN 615 ¼ Filter Papers; Macherey-
Nagel, Düren, Germany) and analysed for total N concentration. For analysis of purine derivatives, 10
mL of urine was diluted with double-distilled water (1:10, v/v), placed in six centrifuge tubes per
sample, and stored at -20°C for a maximum of three months until analysis.
Hohenheim gas test
In addition to the animal experiments, the total gas and methane production of the feed was measured
using the Hohenheim gas test (Menke et al., 1979) according to the official method (25.1; VDLUFA
[Verband Deutscher Landwirtschaftlicher Untersuchungs- und Forschungsanstalten], 2006). Rumen
content was obtained before the morning feeding from two rumen fistulated, non-lactating Holstein-
Friesian cows, mixed, filtered, and flushed with carbon dioxide until the incubation started. Either 44
mg of concentrate (combined with 76 mg of hay) or 120 mg of concentrate was weighed in 100 mL
glass syringes. Eight replicated syringes were used per treatment. Pre-warmed syringes were filled
with the feed and 30 mL of a mixed rumen fluid-buffer solution and incubated at 39°C for 24 h. The
total gas production was recorded and the methane concentration was analysed by using an infrared
methane analyser (Pronova Analysentechnik GmbH & Co. KG, Berlin, Germany), which was
calibrated using a reference gas (12.0 vol% CH4; Air Liquide Deutschland GmbH, Düsseldorf,
Germany). Total gas and methane production corrected by blanks were standardised to 120 mg dry
matter (DM) of feed per syringe.
Analyses
Tannin extracts and concentrates were analysed for total and tannin phenols by using the Folin-
Ciocalteu method (Jayanegara et al., 2011) with modifications as described by Wischer et al. (2012).
Condensed tannins were analysed according to Jayanegara et al. (2011).
Hay, concentrate, and faeces were analysed for crude nutrients according to official methods
(VDLUFA, 2006): DM (method 3.1) and crude ash (method 8.1), CP (method 4.1.1), ether extract
(EE; sample treated with HCl and extracted with petroleum ether, method 5.1.1b), and crude fibre
(CF; method, 6.1.1). Samples were also analysed for NDF -assayed using thermally stable amylase-
and ADF, both without residual ash (methods 6.5.1 and 6.5.2, VDLUFA, 2006). The total N
Chapter 4 Study 3
73
concentration of fresh faeces and urine was analysed using the Kjeldahl method (method 4.1.1;
VDLUFA, 2006). The gross energy in feed and faeces was determined using a bomb calorimeter
(C 200; Ika-Werke GmbH & Co.KG, Staufen, Germany).
Uric acid, hypoxanthine, and xanthine were analysed according to the method of Balcells et al. (1992)
with the following modifications. HPLC consisted of a binary pump, an autosampler, a column oven,
and a diode-array detector from the Agilent 1100 series (Waldbronn, Germany). A Nucleosil 120-5
C18 column (250 × 4 mm) equipped with a corresponding guard column was used as the stationary
phase (Macherey-Nagel, Düren, Germany). The column temperature was maintained at 15°C.
Injection volume was 20 µL. Two solvents [0.01 M sodium dihydrogen phosphate (pH
4.0)/acetonitrile, (99/1) (v/v) (A) and 0.04 M sodium dihydrogen phosphate (pH 4.0)/acetonitrile,
80/20 (v/v) (B)] were used as mobile phases in gradient mode with a flow rate of 0.8 mL/min: 0–5 min
isocratically 100% A, 5–10 min from 0% B to 15% B, 10–12 min from 15% B to 100% B, 12–20 min
isocratically 100% B, 15 min post-runtime 100% A. Oxypurines were detected with the diode-array
detector using wavelengths of 286, 248, and 268 nm for uric acid, hypoxanthine, and xanthine,
respectively. Samples were analysed in duplicate. The method was shown to be linear within a range
of 1–250 µmol/L for uric acid and xanthine and 1–500 µmol for hypoxanthine (R2 > 0.999 for all
analytes). The detection limit was 0.1 µmol/L at a signal-to-noise ratio of 3:1. Recovery rates at a
spiking level of 10 µmol for uric acid and xanthine and 5 µmol for hypoxanthine were between 97%
and 100%, with relative standard deviations below 1% (n = 4).
Pre-column derivatisation of allantoin using 2,4-dinitrophenylhydrazine was performed according to
Chen et al. (1993). A blank value of each sample was derivatised without 60-min heating of the
sample with NaOH prior to 2,4-dinitrophenylhydrazine addition and was subtracted from the sample
value. Samples were analysed in duplicate. The apparatus and column used were as described above,
and the column temperature was 20°C. Gradient elution was performed using two solvents as mobile
phases: 0.01 M acetic acid/methanol 84/16 (v/v) (sol. A) and methanol (sol. B) in gradient mode with
a flow rate of 0.8 mL/min: 0–15 min from 75% A to 40% A, 15–21 min 40% A, 21–22 min from
40% A to 75% A, 10 min post-runtime 75% A. Detection was set at UV 360 nm; the injection volume
was 20 µL. The main isomer was used for quantification. The method was shown to be linear within
the range of 1 µmol/L to 2 mmol/L (R2 > 0.999). The detection limit was at 0.2 µmol/L at a signal to
noise ratio of 3:1. The recovery rate at a spiking level of 0.5 mmol was at 100%, and the relative
standard deviation was 1.3% (n = 6).

Chapter 4 Study 3
74
Calculations and statistical analyses
Methane and CO2 release -measured in 23.5 h- was extrapolated to 24 h based on the release of gases
averaged in the last 2 h and expressed per kilogram of BW0.75. Digestibility was calculated as the
difference between intake and faecal excretion in relation to intake and expressed as a percentage.
To calculate ME, urinary energy and methane energy were subtracted from digestible energy. Urinary
energy was estimated from the concentration of N in urine by equation No. 5.33 of Schiemann et al.
(1971) and converted to MJ. The two respiration measurements next to the balance period were used
average methane release, and the methane energy was calculated using the equation of Brouwer (1965)
and converted to MJ. Microbial protein synthesis was calculated using the urinary excretion of purine
derivatives according to Chen et al. (1992).
The SAS MIXED procedure (version 9.2; SAS Institute, Cary, NC, USA) was used for statistical
analysis (significance level, P < 0.05). Respiration measurements were analysed as repeated
measurements using the REPEATED statement for the day of measurement after the experimental
phases commenced, using the animal as the subject. Different distances between measurements to day
1 were considered in an exponential spatial covariance structure. ANOVA was performed with
treatment (i), day of measurement after the experiment started (j), and their interaction [()ij] as fix
effects and animal (k) as a random effect. Thus, the model was as follows: yijkl = + i + j + ()ij +
k + eijkl, with eijkl as the residual.
ANOVA was performed for balance data and daily BW gain, and treatment (i) was factored as a
fixed effect. The model was as follows: yij = + i + eij. Significant differences between treatments
were compared using the t-test.
Chapter 4 Study 3
75
RESULTS
The analysed concentrations of total and tannin phenols (in % of DM) for CHE and VAL extract were
79.1 and 68.6, and 71.5 and 63.3, respectively. Condensed tannins were not detected in either tannin
extract. In Experiment 1, the concentrations of total and tannin phenols in the concentrates were (in %
DM) 0.2 and 0.2 (CON), 2.6 and 2.3 (CHE), and 1.5 and 1.3 (VAL), compared with 0.3 and 0.2
(CON), 4.2 and 3.7 (CHE), and 4.5 and 4.0 (VAL) for Experiment 2.
Methane and carbon dioxide release
The release of methane per day ranged from between 1.84 and 1.98 L/kg BW0.75 across both
experiments, which was equivalent to 39.9 and 46.1 L/day (Table 2). Significant differences between
treatments were not detected. The release of CO2 ranged from 441 to 481 L/day and it was not
influenced by tannin supplementation in either experiment. The average ratio of CO2 to methane was
10.7 in Experiment 1 and 11.1 in Experiment 2. With the exception of day 190 in Experiment 1 (P =
0.045), no significant effect of tannins on methane release within individual respiration periods could
be detected (Figure 2). The release of CO2 increased from day 1 over the course of the experiment by
0.5% (Experiment 1) and 8.8% (Experiment 2).
Insert Figure 2 here.
Digestibility
The digestibility of DM ranged between 60.9% and 64.1% in Experiment 1 and 58.4% and 62.6% in
Experiment 2 (Table 3). In comparison with CON, lower digestibility values of DM and organic
matter (OM) were noted for CHE and VAL (P ≤ 0.04) in period B3 of Experiment 1. In comparison
with CON, the digestibility of CP in CHE was 4 and 7 percentage points lower in periods B2 and B3
of Experiment 1 (P < 0.01) and 11 and 6 percentage points lower for B2 and B3 in Experiment 2 (P <
0.05). Significant differences in CP digestibility between VAL and CON were observed in periods B3
of Experiment 1 and B2 of Experiment 2 (P < 0.05). In both experiments, the digestibility of EE and
fibre fractions was not affected by tannin supplementation, with the exception that the digestibility of
EE was increased by the addition of tannin extracts in period B3 of Experiment 2 (P < 0.001).
N balance
In both experiments, CHE supplementation produced higher faecal N excretion than CON (P < 0.01)
(Table 4). However, the effects of the addition of VAL were not consistent across both experiments.
Chapter 4 Study 3
76
Significant increases in faecal N caused by VAL were observed in periods B3 of Experiment 1 (P <
0.01) and B2 of Experiment 2 [7.5% and 13.6% (P < 0.05), respectively, in comparison with CON].
Tannin supplementation reduced the urinary N excretion in period B3 of Experiment 1 and during
periods B2 and B3 of Experiment 2 (P < 0.05). The retained N ranged between 1.2 and 3.6 g/day and
was not significantly different between treatments.
Urinary excretion of purine derivatives and estimated microbial protein synthesis
The urinary excretion of allantoin ranged from 9.0 to 12.1 mmol/day, and it was not influenced by the
addition of tannin extracts (Table 5; P > 0.05). The addition of VAL produced a decrease in the
excretion of uric acid and xanthine compared with CON in period B3 of Experiment 2 (P < 0.01).
Other purine derivatives and total purine derivatives were not affected in either experiment. The
estimated synthesis of microbial protein ranged from 61.0 to 78.4 g/day in Experiment 1 and 61.8 to
72.9 g/day in Experiment 2, and it was not significantly affected by tannin supplementation. The
average efficiency of microbial protein synthesis was 96.9 and 104 g/kg digested organic matter
(DOM) in Experiments 1 and 2, respectively, and was not significantly different between treatments.
Energy metabolism and daily BW gain
In Experiment 1, the addition of tannin extracts did not alter faecal energy loss in B2 (Table 6; P =
0.64). In period B3, CHE produced an increase of 7.5% in faecal energy output compared with CON
(P < 0.01), which was accompanied by a significant decrease in urinary energy excretion. Similar
effects were seen in period B3 of Experiment 2. Addition of VAL also reduced the urinary energy in
both balance periods of Experiment 2. No effects of tannins on methane energy were detected. In
period B2 of Experiment 2, an increased ME intake for VAL was observed compared with CON (0.5
MJ ME/day; P < 0.05), whereas this effect was not found in B3. The energy digestibility was
decreased by tannin supplementation in B3 of Experiment 1 and B2 of Experiment 2, but energy
metabolizability was unaffected by tannin supplementation in both experiments.
Daily BW gain ranged from 9.9 to 25.1 g/day in Experiment 1, without significant differences between
treatments (data not shown). In Experiment 2, the daily BW gain for CON, CHE, and VAL was 39.4,
43.2, and 58.0 g/day, respectively, and was not significantly influenced by tannin supplementation (P
= 0.07).

Chapter 4 Study 3
77
Gas and methane production in vitro
The average total gas and methane production of concentrate was 37.2 and 7.1 mL/120 mg DM,
respectively, compared with 26.7 and 5.0 mL/120 mg DM for concentrate plus hay (Table 7).
Significant treatment effects were not detected for concentrates that were incubated together with hay.
For concentrates without hay, the total gas production was influenced by tannin treatment. Methane
production was significantly reduced by 7.9% for CHE in Experiment 1 and by 18.7% and 9.3% for
CHE and VAL, respectively, in Experiment 2. For total gas and methane production, significant
interactions were observed.

Chapter 4 Study 3
78
DISCUSSION
It was hypothesised that the continuous supplementation of CHE and VAL extract would cause a
permanent decrease in methane release. However, neither of the two tannin treatments at either level
of supplementation (0.9 or 1.7 g/kg BW0.75 per day) significantly affected methane release from sheep,
with the exception of CHE on day 190 of Experiment 1 (Figure 2). Based on the first results of
Experiment 1 (i.e. the trend for reduced methane release after the onset of tannin extract
supplementation), we speculated that the higher dose of tannin extracts administered in Experiment 2
would cause greater effects. This was not the case; although, once again, the differences between the
results of CON and tannin treatments were greatest immediately after the onset of tannin
supplementation. Therefore, our initial hypothesis must be rejected. The differences between
individual animals within one treatment were greater than the differences between treatment means.
This contributed to the lack of significance, even though we used four sheep per treatment. Assuming
that the technical equipment is available, we conclude that more than four replicates should be
considered in future studies in order to separate treatment from random effects.
The principal result of the present study confirms the findings of Beauchemin et al. (2007), who did
not observe a reduction in methane release from growing cattle fed on up to 1.8 g/kg BW0.75 of
quebracho extract per day. The authors suggested that the tannin dose administered was not high
enough to decrease methane release. Carulla et al. (2005) showed that methane release from sheep was
reduced by up to 13% upon the addition of approximately 2.9 g/kg BW0.75 per day of an acacia extract
to their diet. Methane release was measured on days 19 and 20 after starting supplementation; thus, it
remains to be seen whether this effect can be retained over longer periods. In grazing dairy cattle,
supplementation of up to 3.0 g/kg BW0.75 per day of an acacia extract caused a significant decrease in
methane release (up to 28%), measured 2 and 5 weeks after supplementation was initiated by using the
sulphur hexafluoride tracer gas technique (Grainger et al., 2009). However, the authors concluded that
the chosen level of supplementation was too high, because feed intake and milk yield were negatively
affected.
Although not statistically significant, the differences in methane release between tannin treatments and
CON were greatest immediately after the onset of supplementation in both experiments (Figure 2).
This may be an indication that rumen microbes are affected, but that they are able to adapt to the
tannin extracts. Indeed, tannins may directly inhibit methanogenic microorganisms (Tavendale et al.,
2005). Based on the results of the development of methane release over time in the present study, it is
assumed that the microbes adapted within about two weeks (Figure 2). Smith et al. (2005) listed
strategies used by rumen bacteria to overcome the inhibitory effects of tannins, including the cleavage
of hT and the salivary secretion of high-affine tannin binders. The complete ruminal degradation of
both tannin extracts rich in hT, as discussed by Mueller-Harvey (2006), is unlikely, since a significant
effect on methane was observed at one specific time (effect of CHE on day 190 in Experiment 1). It is
Chapter 4 Study 3
79
possible that the tannin extract dosages employed were still not high enough to initiate microbial
reactions, e.g. the secretion of tannases (Smith et al., 2005), or the significant breakdown of individual
strains of microbes. Further increase in the dosage of tannin carries the risk of negative effects on feed
consumption and animal performance (Hervás et al., 2003). However, Frutos et al. (2004)
demonstrated that feeding up to 1.4 g/kg BW0.75 of CHE extract caused neither histopathological nor
other adverse effects on the performance of lambs. Moreover, no indication of adverse effects was
observed in the present study.
In agreement with the experiments conducted on sheep, tannins did not reduce methane production in
vitro when concentrates and hay were incubated together (Table 7). In contrast, when the concentrates
were incubated without hay, methane production was reduced by 8% for CHE in Experiment 1 and by
19% and 9% for CHE and VAL, respectively, in Experiment 2, which is probably related to higher
dosages in the concentrate compared with the whole diet. When compared to a previous in vitro study
(Wischer et al., 2012), methane production was influenced in the present study to a lesser extent by
tannin addition. In the study by Wischer et al. (2012), CHE and VAL extract produced the greatest
reduction in methane production (14% and 17%, respectively) at dosages of 6 mg per syringe.
However, the substrate used was grass silage, which may have caused a different response to that of
the concentrate used in the present study.
Analytical recovery of the tannin phenols supplemented as extracts in the concentrates was
incomplete. Based on analysis of the extracts, the recovery of phenols in the concentrates was between
50% and 82%. We could not identify a reason for this discrepancy. It is possible that the phenolic
compounds were modified during feed processing, e.g. by the mixing or pelleting process.
Furthermore, negative impacts during storage and sampling may have contributed to the incomplete
recovery. It is also possible that during the pelleting process tannin formed complexes with other feed
constituents, and that the method used for tannin extraction was not able to extract the tannins
completely from these complexes. However, the results confirmed that the tannin dosages were much
higher in Experiment 2 than in Experiment 1 (CHE, 1.6- vs. 2.0-fold; VAL, 3.1- vs. 2.0-fold).
Zimmer and Cordesse (1996) reported a significant decline in the digestibility of DM and OM (by 5.6
and 5.9 percentage points, respectively) when sheep received hay and approximately 5.7 g/kg BW0.75
of CHE extract. However, in agreement with the present study, BW change and animal performance
were not affected in their study. There is a commonly held view that feeding hT is associated with
negative effects for the animals’ metabolism compared to cT (Mueller-Harvey, 2006). Treatment
effects on digestibility were rare in the present study (apart from CP) indicating that feeding hT does
not necessarily have more negative effects than cT. Indeed, while Goel and Makkar (2011) proposed
that hT are more effective in decreasing methane release than cT, Mueller-Harvey (2006) suggested
that the classification of tannins into cT and hT has not proved useful for predicting animal responses.
Chapter 4 Study 3
80
In the studies of Carulla et al. (2005) and Grainger et al. (2009), higher faecal N excretion and
concomitantly lower urinary N excretion were observed without an effect on N retention. This was
confirmed by the present study, in which the shift in N excretion was found in periods B2 and B3 for
both experiments. This indicates that tannin-protein complexes were not completely disassociated in
the small intestine, resulting in altered CP digestibility (Beauchemin et al., 2007), or that the location
of OM digestion shifted towards the lower intestine, and more microbial protein was synthesised and
subsequently excreted in the faeces. The higher faecal N excretion may originate from tannins forming
complexes with protein originating from the diet, bacterial or intestinal tissue cells, and endogenous
constituents (Mueller-Harvey, 2006). Alternatively, this may be due to inhibition of digestive enzymes
or intestinal microorganisms (Mueller-Harvey, 2006), as previously described.
A number of in vitro studies have indicated that tannin supplementation may improve the efficiency of
microbial protein synthesis (Makkar et al., 1995; Bhatta et al., 2001). Makkar (2003) suggested that
low levels of tannins have the potential to modulate rumen fermentation towards increased microbial
protein synthesis. In the present study, microbial protein synthesis was estimated from the urinary
excretion of purine derivatives, and its mean efficiency was 96.9 and 104 g/kg DOM for Experiments
1 and 2, respectively. These findings are similar to those of Lima et al. (2011), who estimated that the
microbial protein synthesis in sheep fed with ensiled or fresh sorghum-soybean forages was 99 and
143 g/kg DOM, respectively. The results indicate that microbial protein synthesis is unaffected by
tannin supplementation due to the unchanged urinary excretion of allantoin. This is in good agreement
with the study by Roth (2003), who fed approximately 0.4 and 0.7 g/kg BW0.75 of CHE extract to dairy
cattle. In contrast, in the study of Carulla et al. (2005), the supplementation of 2.9 g/kg BW0.75 of
acacia extract caused a decrease in allantoin excretion, indicating reduced microbial protein synthesis.
Thus, tannin dosages in this and subsequent studies may have been too high to improve the efficiency
of microbial protein synthesis. Furthermore, it is possible that the influence of tannins on the
efficiency of microbial protein synthesis depends on the composition of the respective tannin (i.e. hT
vs. cT), or that estimation from the excretion of urinary purine derivatives is not a sufficiently
sensitive method.
Based on the results of Carulla et al. (2005) and those of this study, it seems unlikely that tannin
extracts are able to reduce methane release without adverse effects on digestibility. Since higher tannin
dosages may affect animal metabolism, further studies should include balance periods to examine the
effects of tannins on digestibility, as well as energy and N metabolism.

Chapter 4 Study 3
81
CONCLUSIONS
This study showed that feeding CHE and VAL extracts to sheep affected rumen fermentation, but
without significant consequences for methane release over a long-term period. Higher dosages of
tannin extracts may reduce methane release; however, in view of the reduction in OM digestibility
observed with a lower tannin dosage, it is likely that this would be accompanied by reduced
digestibility. The extent to which negative tannin effects can be tolerated should be assessed in balance
periods to examine energy and N metabolism. Moreover, since higher tannin dosages may affect feed
intake, strategies should be established to overcome refusals in feed intake.
ACKNOWLEDGEMENT
We gratefully acknowledge support for this study from H. Wilhelm Schaumann Stiftung (Hamburg,
Germany) through a doctoral scholarship awarded to G. Wischer.

Chapter 4 Study 3
82
REFERENCES
used in chapter 4
Balcells J, Guada JA, Peiro JM and Parker DS 1992. Simultaneous determination of allantoin and oxypurines in biological fluids by high-performance liquid chromatography. Journal of Chromatography - Biomedical Applications 575, 153-157.
Beauchemin KA, McAllister TA and McGinn SM 2009. Dietary mitigation of enteric methane from cattle. CAB Reviews: Perspectives in Agriculture, Veterinary Science, Nutrition and Natural Resources 4, 1-18.
Beauchemin KA, McGinn SM, Martinez TF and McAllister TA 2007. Use of condensed tannin extract from quebracho trees to reduce methane emissions from cattle. Journal of Animal Science 85, 1990-1996.
Bhatta R, Krishnamoorthy U and Mohammed F 2001. Effect of tamarind (Tamarindus indica) seed husk tannins on in vitro rumen fermentation. Animal Feed Science and Technology 90, 143-152.
Brouwer E 1965. Report of sub-committee on constants and factors. In 'Energy metabolism'. (Ed. KL Blaxter). Academic Press, London, UK.
Carulla JE, Kreuzer M, Machmüller A and Hess HD 2005. Supplementation of Acacia mearnsii tannins decreases methanogenesis and urinary nitrogen in forage-fed sheep. Australian Journal of Agricultural Research 56, 961-970.
Chen XB, Kyle DJ and Orskov ER 1993. Measurement of allantoin in urine and plasma by high-performance liquid chromatography with pre-column derivatization. Journal of Chromatography - Biomedical Applications 617, 241-247.
Chen XB, Chen YK, Franklin MF, Orskov ER and Shand WJ 1992. The effect of feed intake and body weight on purine derivative excretion and microbial protein supply in sheep. Journal of Animal Science 70, 1534-1542.
de Oliveira SG, Berchielli TT, Pedreira MdS, Primavesi O, Frighetto R and Lima MA 2007. Effect of tannin levels in sorghum silage and concentrate supplementation on apparent digestibility and methane emission in beef cattle. Animal Feed Science and Technology 135, 236-248.
Deutsche Landwirtschafts - Gesellschaft 1997. Futterwerttabellen Wiederkäuer. DLG - Verlag, Frankfurt, Germany.
Frutos P, Raso M, Hervás G, Mantecón ÁR, Pérez V and Giráldez FJ 2004. Is there any detrimental effect when a chestnut hydrolysable tannin extract is included in the diet of finishing lambs? Animal Research 53, 127-136.
Gesellschaft für Ernährungsphysiologie 1991. Leitlinien für die Bestimmung der Verdaulichkeit von Rohnährstoffen an Wiederkäuern. Journal of Animal Physiology and Animal Nutrition 65, 229-234.
Goel G and Makkar HPS 2011. Methane mitigation from ruminants using tannins and saponins. Tropical Animal Health and Production, 1-11.
Grainger C, Clarke T, Auldist MJ, Beauchemin KA, McGinn SM, Waghorn GC and Eckard RJ 2009. Potential use of Acacia mearnsii condensed tannins to reduce methane emissions and nitrogen excretion from grazing dairy cows. Canadian Journal of Animal Science 89, 241-251.

Chapter 4 Study 3
83
Hervás G, Pérez V, Giráldez FJ, Mantecón AR, Almar MM and Frutos P 2003. Intoxication of sheep with quebracho tannin extract. Journal of Comparative Pathology 129, 44-54.
Hook SE, Wright ADG and McBride BW 2010. Methanogens: Methane producers of the rumen and mitigation strategies. Archaea 2010, 1-11.
Jayanegara A, Wina E, Soliva CR, Marquardt S, Kreuzer M and Leiber F 2011. Dependence of forage quality and methanogenic potential of tropical plants on their phenolic fractions as determined by principal component analysis. Animal Feed Science and Technology 163, 231-243.
Johnson KA and Johnson DE 1995. Methane emissions from cattle. Journal of Animal Science 73, 2483-2492.
Lima R, Díaz RF, Castro A and Fievez V 2011. Digestibility, methane production and nitrogen balance in sheep fed ensiled or fresh mixtures of sorghum-soybean forage. Livestock Science 141, 36-46.
Makkar HP, Blummel M and Becker K 1995. In vitro effects of and interactions between tannins and saponins and fate of tannins in the rumen. Journal of the Science of Food and Agriculture 69, 481-493.
Makkar HPS 2003. Effects and fate of tannins in ruminant animals, adaptation to tannins, and strategies to overcome detrimental effects of feeding tannin-rich feeds. Small Ruminant Research 49, 241-256.
Martin C, Morgavi DP and Doreau M 2010. Methane mitigation in ruminants: from microbe to the farm scale. Animal 4, 351-365.
McAllister TA and Newbold CJ 2008. Redirecting rumen fermentation to reduce methanogenesis. Australian Journal of Experimental Agriculture 48, 7-13.
McSweeney CS, Palmer B, McNeill DM and Krause DO 2001. Microbial interactions with tannins: Nutritional consequences for ruminants. Animal Feed Science and Technology 91, 83-93.
Menke KH, Raab L, Salewski A, Steingass H, Fritz D and Schneider W 1979. The estimation of the digestibility and metabolizable energy content of ruminant feedingstuffs from the gas production when they are incubated with rumen liquor in vitro. The Journal of Agricultural Science 93, 217-222.
Mueller-Harvey I 2006. Unravelling the conundrum of tannins in animal nutrition and health. Journal of the Science of Food and Agriculture 86, 2010-2037.
Murdiati TB, McSweeney CS and Lowry JB 1992. Metabolism in sheep of gallic acid, tannic acid and hydrolysable tannin from Terminalia oblongata. Australian Journal of Agricultural Research 43, 1307-1319.
Patra AK and Saxena J 2011. Exploitation of dietary tannins to improve rumen metabolism and ruminant nutrition. Journal of the Science of Food and Agriculture 91, 24-37.
Reed JD 1995. Nutritional toxicology of tannins and related polyphenols in forage legumes. Journal of Animal Science 73, 1516-1528.
Roth S 2003. Reducing methane emission and optimising N-supply in ruminants by treating feeds with tannins. Doctoral thesis, University of Hohenheim.
Schiemann R, Nehring K, Hoffmann L, Jentsch W and Chudy A 1971. Energetische Futterbewertung und Energienormen. VEB Deutscher Landwirtschaftsverlag, Berlin.

Chapter 4 Study 3
84
Smith AH, Zoetendal E and Mackie RI 2005. Bacterial mechanisms to overcome inhibitory effects of dietary tannins. Microbial Ecology 50, 197-205.
Tavendale MH, Meagher LP, Pacheco D, Walker N, Attwood GT and Sivakumaran S 2005. Methane production from in vitro rumen incubations with Lotus pedunculatus and Medicago sativa, and effects of extractable condensed tannin fractions on methanogenesis. Animal Feed Science and Technology 123-124 Part 1, 403-419.
Van Nevel CJ 1996. Control of rumen methanogenesis. Environmental Monitoring and Assessment 42, 73-97.
VDLUFA (Verband Deutscher Landwirtschaftlicher Untersuchungs- und Forschungsanstalten) 2006. Handbuch der Landwirtschaftlichen Versuchs- und Untersuchungsmethodik (VDLUFA-Methodenbuch), Bd. III Die chemische Untersuchung von Futtermitteln. VDLUFA-Verlag, Darmstadt, Germany.
Wischer G, Boguhn J, Steingaß H, Schollenberger M and Rodehutscord M 2012. Effects of different tannin extracts and rapeseed tannin monomers on methane formation and microbial protein synthesis in vitro. Animal, submitted simultaneously with this manuscript
Zimmer N and Cordesse R 1996. Digestibility and ruminal digestion of non-nitrogenous compounds in adult sheep and goats: Effects of chestnut tannins. Animal Feed Science and Technology 61, 259-273.
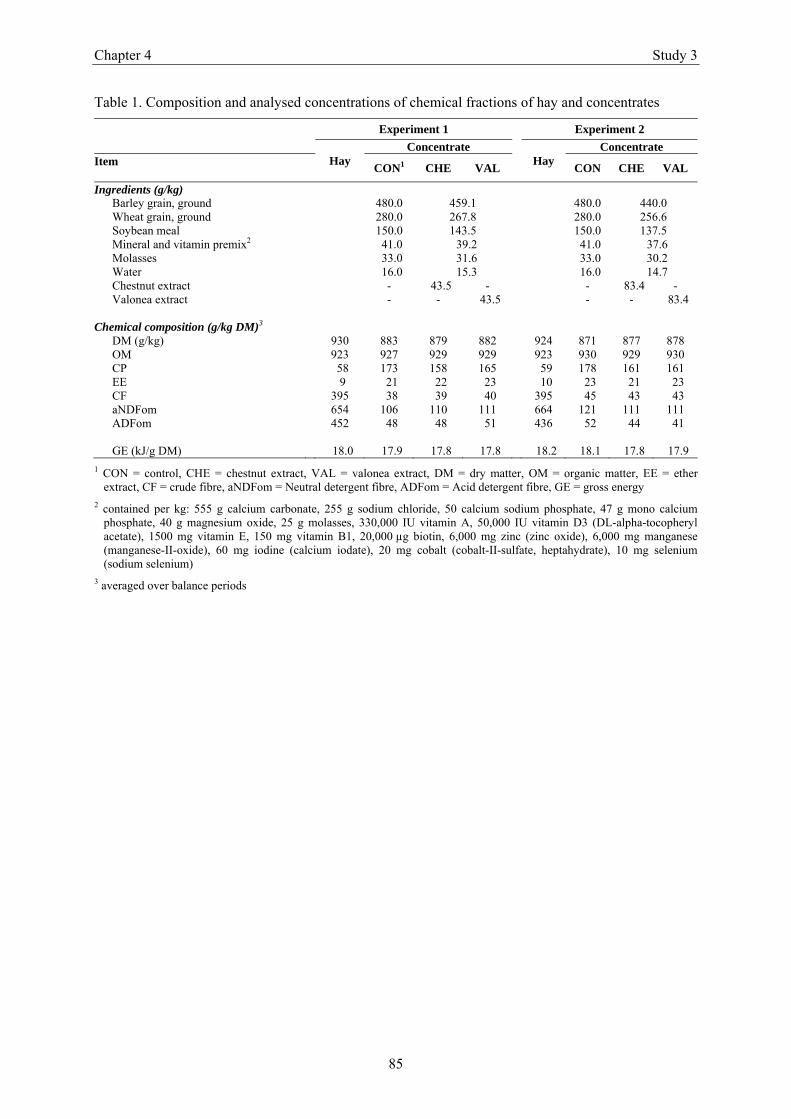
Chapter 4 Study 3
85
Table 1. Composition and analysed concentrations of chemical fractions of hay and concentrates
Experiment 1 Experiment 2
Hay
Concentrate Hay
Concentrate Item
CON1 CHE VAL CON CHE VAL
Ingredients (g/kg) Barley grain, ground 480.0 459.1 480.0 440.0 Wheat grain, ground 280.0 267.8 280.0 256.6 Soybean meal 150.0 143.5 150.0 137.5 Mineral and vitamin premix2 41.0 39.2 41.0 37.6 Molasses 33.0 31.6 33.0 30.2 Water 16.0 15.3 16.0 14.7 Chestnut extract - 43.5 - - 83.4 - Valonea extract - - 43.5 - - 83.4
Chemical composition (g/kg DM)3
DM (g/kg) 930 883 879 882 924 871 877 878 OM 923 927 929 929 923 930 929 930 CP 58 173 158 165 59 178 161 161 EE 9 21 22 23 10 23 21 23 CF 395 38 39 40 395 45 43 43 aNDFom 654 106 110 111 664 121 111 111 ADFom 452 48 48 51 436 52 44 41 GE (kJ/g DM) 18.0 17.9 17.8 17.8 18.2 18.1 17.8 17.9
1 CON = control, CHE = chestnut extract, VAL = valonea extract, DM = dry matter, OM = organic matter, EE = ether extract, CF = crude fibre, aNDFom = Neutral detergent fibre, ADFom = Acid detergent fibre, GE = gross energy
2 contained per kg: 555 g calcium carbonate, 255 g sodium chloride, 50 calcium sodium phosphate, 47 g mono calcium phosphate, 40 g magnesium oxide, 25 g molasses, 330,000 IU vitamin A, 50,000 IU vitamin D3 (DL-alpha-tocopheryl acetate), 1500 mg vitamin E, 150 mg vitamin B1, 20,000 µg biotin, 6,000 mg zinc (zinc oxide), 6,000 mg manganese (manganese-II-oxide), 60 mg iodine (calcium iodate), 20 mg cobalt (cobalt-II-sulfate, heptahydrate), 10 mg selenium (sodium selenium)
3 averaged over balance periods
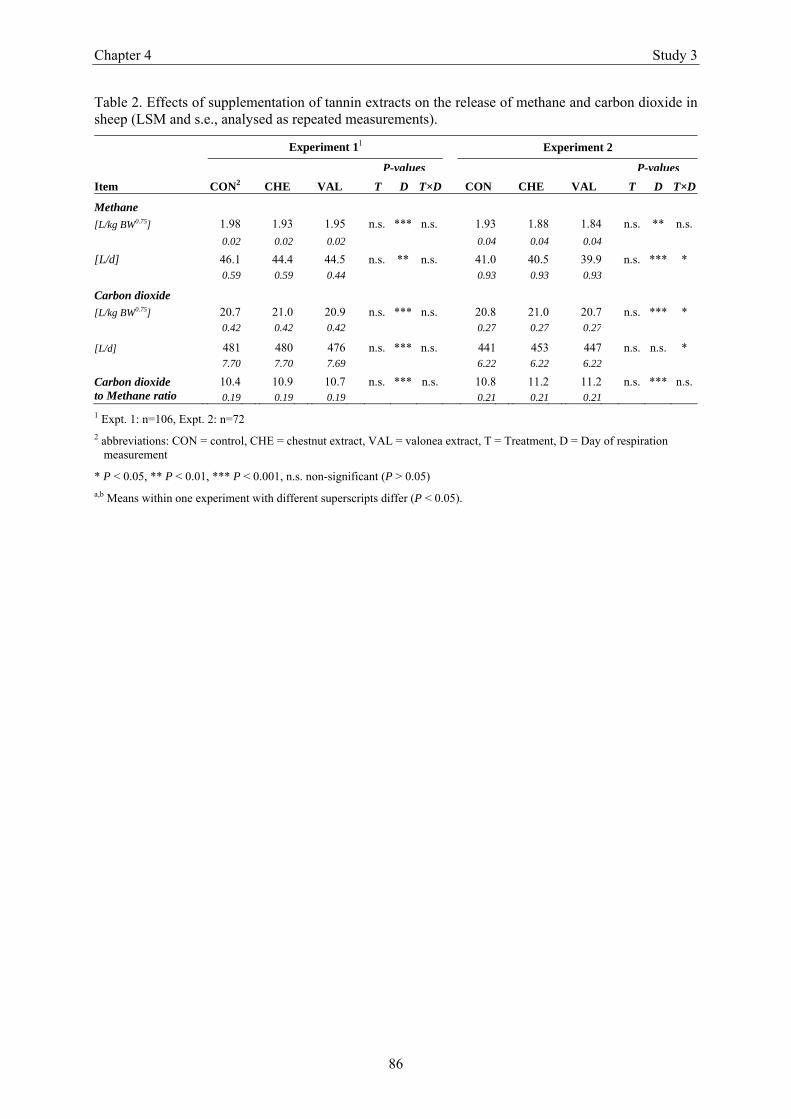
Chapter 4 Study 3
86
Table 2. Effects of supplementation of tannin extracts on the release of methane and carbon dioxide in sheep (LSM and s.e., analysed as repeated measurements).
Experiment 11 Experiment 2
Item CON2 CHE VAL
P-values
CON
CHE
VAL
P-values
T D T×D T D T×D
Methane
[L/kg BW0.75] 1.98 1.93 1.95 n.s. *** n.s. 1.93 1.88 1.84 n.s. ** n.s.
0.02 0.02 0.02 0.04 0.04 0.04
[L/d] 46.1 44.4 44.5 n.s. ** n.s. 41.0 40.5 39.9 n.s. *** * 0.59 0.59 0.44 0.93 0.93 0.93
Carbon dioxide
[L/kg BW0.75] 20.7 21.0 20.9 n.s. *** n.s. 20.8 21.0 20.7 n.s. *** * 0.42 0.42 0.42 0.27 0.27 0.27
[L/d] 481 480 476 n.s. *** n.s. 441 453 447 n.s. n.s. * 7.70 7.70 7.69 6.22 6.22 6.22
Carbon dioxide 10.4 10.9 10.7 n.s. *** n.s. 10.8 11.2 11.2 n.s. *** n.s.to Methane ratio 0.19 0.19 0.19 0.21 0.21 0.21
1 Expt. 1: n=106, Expt. 2: n=72 2 abbreviations: CON = control, CHE = chestnut extract, VAL = valonea extract, T = Treatment, D = Day of respiration
measurement
* P < 0.05, ** P < 0.01, *** P < 0.001, n.s. non-significant (P > 0.05) a,b Means within one experiment with different superscripts differ (P < 0.05).

Chapter 4 Study 3
87
Tab
le 3
. Eff
ects
of
supp
lem
enta
tion
of
tann
in e
xtra
cts
on d
iges
tibi
lity
of
crud
e nu
trie
nts
and
fibr
e fr
acti
ons
in s
heep
(%
, mea
ns a
nd s
.d.,
n=4)
.
E
xper
imen
t 1
E
xper
imen
t 2
B1
B21
B32
B1
B
21
B32
Item
C
ON
3
C
HE
VA
L
P
C
ON
CH
E
VA
L
P
CO
N
CH
E
V
AL
P
CO
N
CH
E
V
AL
P
DM
61
.8
64.1
63
.563
.6n.
s.
62.6
b 60
.9a
61.3
a *
61.8
60
.958
.460
.2n.
s.
62.6
61.8
62.5
n.s.
1.
42
2.48
0.
570.
641.
220.
360.
671.
48
0.91
2.01
0.66
0.97
2.72
0.57
OM
64
.9
67.5
66
.767
.0n.
s.
65.3
b 63
.3a
63.8
a *
64.3
63
.561
.462
.8n.
s.
64.8
63.8
64.6
n.s.
1.
38
2.38
0.
690.
741.
140.
250.
881.
49
0.92
1.75
0.78
0.87
2.81
0.61
CP
63
.2
63.7
b 59
.7a
62.1
b *
63.1
c 56
.3a
59.7
b **
* 63
.1
61.4
c 50
.7a
56.1
b **
* 63
.2b
57.4
a 60
.2ab
*
1.52
1.
83
1.22
1.28
1.48
1.13
1.23
1.64
1.
433.
931.
254.
132.
311.
11
EE
51
.6
53.2
55
.357
.2n.
s.
56.5
60.7
62.6
n.s.
60
.9
53.1
51.2
52.8
n.s.
54
.4a
57.4
b 61
.6c
***
4.81
9.
93
5.07
3.78
2.29
3.94
4.70
3.29
7.
431.
093.
830.
572.
321.
30
CF
53
.4
54.5
54
.555
.6n.
s.
52.3
49.8
49.6
n.s.
49
.9
48.4
47.6
49.9
n.s.
48
.750
.650
.2n.
s.
1.66
4.
48
2.49
0.94
2.31
0.54
3.17
2.57
1.
302.
901.
402.
646.
091.
13
ND
F
50.8
51
.5
51.7
52.1
n.s.
47
.444
.745
.5n.
s.
47.9
46
.945
.146
.6n.
s.
48.5
48.4
49.0
n.s.
2.
08
3.86
1.
450.
602.
040.
552.
422.
85
1.07
2.45
1.55
1.97
5.25
1.02
AD
F
47.9
49
.9
47.7
49.5
n.s.
45
.241
.242
.6n.
s.
49.9
41
.337
.040
.6
n.s.
42
.9
40.5
42
.3
n.s.
2.
07
3.78
1.
461.
202.
990.
252.
482.
44
0.81
3.63
2.32
1.28
5.
50
0.78
1 d22
to d
27 a
fter
the
star
t of
tann
in f
eedi
ng
2 Exp
t.1: d
183
to d
188
afte
r th
e st
art o
f ta
nnin
fee
ding
; Exp
t.2: d
78 to
d83
aft
er th
e st
art o
f ta
nnin
fee
ding
3 a
bbre
viat
ions
: CO
N =
con
trol
, CH
E =
che
stnu
t ext
ract
, VA
L =
val
onea
ext
ract
, P =
P-v
alue
, DM
= d
ry m
atte
r, O
M =
org
anic
mat
ter,
EE
= e
ther
ext
ract
, CF
= c
rude
fib
re
* P
< 0
.05,
***
P <
0.0
01, n
.s. n
on-s
igni
fica
nt (
P >
0.0
5)
a-c M
eans
wit
hin
one
bala
nce
tria
l wit
h di
ffer
ent s
uper
scri
pts
diff
er (
P <
0.0
5).

Chapter 4 Study 3
88
Tab
le 4
. Eff
ects
of
supp
lem
enta
tion
of
tann
in e
xtra
cts
on n
itro
gen
excr
etio
n in
she
ep (
mea
ns a
nd s
.d.,
n=4)
.
E
xper
imen
t 1
E
xper
imen
t 2
B1
B21
B32
B1
B
21
B32
Item
C
ON
3
CH
E
V
AL
P
CO
N
CH
E
VA
L
P
CO
N
CH
E
VA
L
P
C
ON
C
HE
V
AL
P
N in
take
18
.4
19.3
19
.119
.318
.117
.317
.918
.0
17.1
17.0
17.0
17.7
17.7
17.7
[g/d
] 0.
00
0.00
0.
000.
000.
000.
000.
000.
00
0.00
0.00
0.00
0.00
0.00
0.00
Faec
al N
6.
8 7.
0 a
7.7
b 7.
3ab
*
6.7
a 7.
5b
7.2
b **
6.
6 6.
6a
8.4
c 7.
5b
***
6.5
a 7.
5b
7.1
ab
* [g
/d]
0.28
0.
35
0.23
0.25
0.27
0.20
0.22
0.30
0.
240.
670.
210.
730.
410.
20
Uri
nary
N
9.4
10.2
9.
19.
2n.
s.
9.7
b 8.
4a
9.1
b **
9.
0 9.
1b
7.4
a 8.
0a
* 8.
6b
7.9
ab7.
1a
* [g
/d]
1.34
0.
76
0.47
0.60
0.43
0.46
0.32
0.74
0.
610.
800.
660.
461.
080.
42
Ret
aine
d N
2.
2 2.
1 2.
22.
8n.
s.
1.7
1.3
1.6
n.s.
2.
4 1.
41.
21.
5n.
s.
2.5
2.3
3.6
n.s.
[g
/d]
1.19
0.
96
0.28
0.52
0.25
0.35
0.54
0.61
0.
731.
300.
530.
690.
870.
45
Uri
nary
N/ N
inta
ke
51.0
52
.7
47
.9
47.8
n.
s.
53
.9b
48.7
a 50
.9ab
*
49
.8
53.3
b 43
.4a
47.2
ab
*
49.0
b 44
.6ab
40.1
a *
[%]
7.28
3.91
2.49
3.13
2.36
2.65
1.80
4.
11
3.
544.
663.
862.
606.
092.
35
Ret
aine
d N
/ N in
take
12
.1
10.9
11.7
14
.3
n.s.
9.2
7.
6
8.9
n.
s.
13
.3
8.0
7.
3
8.9
n.
s.
14
.3
12.8
20
.1
n.s.
[%
] 6.
47
4.
97
1.
482.
701.
402.
053.
01
3.40
4.28
7.60
3.13
3.90
4.92
2.53
1 d22
to d
27 a
fter
the
star
t of
tann
in f
eedi
ng
2 Exp
t.1: d
183
to d
188
afte
r th
e st
art o
f ta
nnin
fee
ding
; Exp
t.2: d
78 to
d83
aft
er th
e st
art o
f ta
nnin
fee
ding
3 a
bbre
viat
ion:
CO
N =
con
trol
, CH
E =
che
stnu
t ext
ract
, VA
L =
val
onea
ext
ract
, P =
P-v
alue
* P
< 0
.05,
**
P <
0.0
1, *
** P
< 0
.001
, n.s
. non
-sig
nifi
cant
(P
> 0
.05)
a-
c Mea
ns w
ithi
n on
e ba
lanc
e tr
ial w
ith
diff
eren
t sup
ersc
ript
s di
ffer
(P
< 0
.05)
.

Chapter 4 Study 3
89
Tab
le 5
. E
ffec
ts o
f su
pple
men
tati
on o
f ta
nnin
ext
ract
s on
uri
nary
exc
reti
on o
f pu
rine
der
ivat
ives
and
est
imat
ed m
icro
bial
pro
tein
syn
thes
is i
n sh
eep
(mea
ns a
nd
s.d.
, n=
4).
E
xper
imen
t 1
E
xper
imen
t 2
B1
B21
B32
B1
B
21
B32
Item
C
ON
3
CH
E
V
AL
P
CO
N
CH
E
VA
L
P
CO
N
CH
E
VA
L
P
C
ON
C
HE
V
AL
P
All
anto
in
9.0
10.8
11
.311
.5n.
s.
11.1
12.1
11.3
n.s.
10
.9
11.0
9.8
10.3
n.s.
11
.29.
39.
7n.
s.
[mm
ol/d
] 2.
39
1.82
2.
061.
252.
320.
700.
961.
56
2.45
1.93
1.62
2.27
2.14
1.44
Uri
c ac
id
1.46
1.
41
1.44
1.39
n.s.
1.
591.
481.
35n.
s.
1.56
1.
671.
381.
25n.
s.
1.62
b 1.
39ab
1.24
a *
[mm
ol/d
] 0.
39
0.37
0.
040.
400.
440.
170.
280.
23
0.31
0.19
0.13
0.17
0.15
0.17
Hyp
oxan
thin
e 0.
90
1.00
0.
921.
24n.
s.
0.88
0.87
0.99
n.s.
0.
81
0.73
0.66
0.73
n.s.
0.
650.
740.
60n.
s.
[mm
ol/d
] 0.
28
0.25
0.
210.
190.
190.
320.
120.
29
0.12
0.33
0.24
0.14
0.46
0.27
Xan
thin
e 0.
10
0.09
0.
090.
11n.
s.
0.10
0.10
0.10
n.s.
0.
09
0.12
0.10
0.10
n.s.
0.
12b
0.10
ab0.
08a
* [m
mol
/d]
0.03
0.
02
0.01
0.02
0.03
0.01
0.02
0.02
0.
040.
010.
010.
020.
010.
01
Mic
robi
al p
rote
in
[g/d
] 61
.0
71
.3
74
.176
.9n.
s.
73.3
78.4
74.0
n.s.
71.9
72.9
64.0
66.7
n.s.
72
.961
.862
.4n.
s.
15.2
13.0
11.4
7.2
13
.73.
95.
0
10
.4
15
.512
.79.
8
13.5
13.0
9.
6
[g/k
g D
OM
] 85
96
99
102
n.s.
10
311
210
5n.
s.
10
9
113
9910
1n.
s.
111
93
93
n.s.
21.7
19.2
16.1
10.5
20
.55.
77.
6
15
.7
22
.719
.515
.5
20.6
20.1
14
.2
1 d22
to d
27 a
fter
the
star
t of
tann
in f
eedi
ng
2 Exp
t.1: d
183
to d
188
afte
r th
e st
art o
f ta
nnin
fee
ding
; Exp
t.2: d
78 to
d83
aft
er th
e st
art o
f ta
nnin
fee
ding
3 a
bbre
viat
ion:
CO
N =
con
trol
, CH
E =
che
stnu
t ext
ract
, VA
L =
val
onea
ext
ract
, P =
P-v
alue
, DO
M =
dig
este
d or
gani
c m
atte
r
* P
< 0
.05,
n.s
. non
-sig
nifi
cant
(P
> 0
.05)
a,
b Mea
ns w
ithi
n on
e ba
lanc
e tr
ial w
ith
diff
eren
t sup
ersc
ript
s di
ffer
(P
< 0
.05)
.

Chapter 4 Study 3
90
Tab
le 6
. Eff
ects
of
supp
lem
enta
tion
of
tann
in e
xtra
cts
on e
nerg
y m
etab
olis
m in
she
ep (
mea
ns a
nd s
.d.,
n=4)
.
E
xper
imen
t 1
E
xper
imen
t 2
B1
B21
B32
B1
B
21
B32
Item
C
ON
3
CH
E
V
AL
P
CO
N
CH
E
VA
L
P
C
ON
C
HE
V
AL
P
CO
N
CH
E
VA
L
P
Gro
ss e
nerg
y in
take
21
.5
21.5
21
.821
.821
.221
.521
.520
.2
19.9
20.5
20.5
19.9
20.4
20.4
[MJ/
d]
0.00
0.
00
0.00
0.00
0.00
0.00
0.00
0.00
0.
000.
000.
000.
000.
000.
00
Faec
al e
nerg
y 8.
1 7.
6 7.
87.
8n.
s.
8.0
a 8.
6b
8.4
ab
* 7.
7 7.
8a
8.5
b 8.
1a
**
7.5
7.9
7.7
n.s.
[M
J/d]
0.
28
0.51
0.
160.
200.
300.
080.
180.
28
0.13
0.37
0.13
0.16
0.53
0.13
Uri
nary
ene
rgy
0.67
0.
70
0.66
0.66
n.s.
0.
68b
0.64
a 0.
66b
**
0.66
0.
66b
0.60
a 0.
63a
* 0.
65b
0.62
ab0.
59a
* [M
J/d]
0.
04
0.02
0.
020.
020.
010.
020.
010.
02
0.02
0.03
0.02
0.02
0.04
0.01
Dig
esti
ble
ener
gy
13.3
13
.9
14.0
14.1
n.s.
13
.212
.913
.1n.
s.
12.5
12
.111
.912
.4n.
s.
12.4
12.4
12.7
n.s.
[M
J/d]
0.
28
0.51
0.
160.
200.
300.
080.
180.
28
0.13
0.37
0.13
0.16
0.53
0.13
Met
hane
ene
rgy
1.8
1.8
1.7
1.7
n.s.
1.
81.
81.
7n.
s.
1.5
1.6
1.6
1.6
n.s.
1.
61.
61.
6n.
s.
[MJ/
d]
0.06
0.
05
0.06
0.11
0.05
0.05
0.05
0.05
0.
070.
070.
110.
110.
060.
06
Met
abol
izab
le e
nerg
y 10
.9
11.4
11
.611
.7n.
s.
10.7
10.5
10.7
n.s.
10
.3
9.7
a 9.
7a
10.2
b *
10.1
10.2
10.4
n.s.
[M
J/d]
0.
25
0.53
0.
170.
270.
240.
090.
140.
25
0.13
0.39
0.13
0.19
0.50
0.08
Ene
rgy
dige
stib
ilit
y 62
.1
64
.7
64
.1
64.4
n.
s.
62.2
b 60
.1a
60.9
ab
*
62.0
60.7
b 58
.2a
60.4
b *
62.2
61
.1
62.1
n.
s.
[%]
1.29
2.37
0.73
0.93
1.
420.
380.
85
1.
37
0.
681.
800.
64
0.81
2.61
0.62
Ene
rgy
met
abol
izab
ilit
y 50
.6
53
.0
53
.2
53.5
n.
s.
50.4
49
.0
49.7
n.
s.
51
.2
49
.1
47.3
49
.6
n.s.
50
.8
50.0
51
.1
n.s.
[%]
1.15
2.49
0.78
1.24
1.
130.
400.
63
1.
24
0.
681.
920.
64
0.96
2.44
0.38
1 d22
to d
27 a
fter
the
star
t of
tann
in f
eedi
ng
2 Exp
t.1: d
183
to d
188
afte
r th
e st
art o
f ta
nnin
fee
ding
; Exp
t.2: d
78 to
d83
aft
er th
e st
art o
f ta
nnin
fee
ding
3 a
bbre
viat
ion:
CO
N =
con
trol
, CH
E =
che
stnu
t ext
ract
, VA
L =
val
onea
ext
ract
, P =
P-v
alue
* P
< 0
.05,
**
P <
0.0
1, n
.s. n
on-s
igni
fica
nt (
P >
0.0
5)
a,b M
eans
wit
hin
one
bala
nce
tria
l wit
h di
ffer
ent s
uper
scri
pts
diff
er (
P <
0.0
5).

Chapter 4 Study 3
91
Tab
le 7
. In
vitr
o to
tal g
as a
nd m
etha
ne p
rodu
ctio
n of
con
cent
rate
s al
one
or in
com
bina
tion
wit
h ha
y (L
SM
and
s.e
., at
leas
t n=
7).
E
xper
imen
t 1
E
xper
imen
t 2
P
-val
ues1
C
once
ntra
te
Con
cent
rate
+ H
ay
C
once
ntra
te
C
once
ntra
te +
Hay
Item
CO
N2
CH
E
VA
L
CO
N
CH
E
VA
L
C
ON
C
HE
V
AL
CO
N
CH
E
VA
L
T
C
E
T
×C
T
×E
C
×E
T
×C
×E
Tot
al g
as p
rodu
ctio
n 38
.5d
38.1
cd
37.9
cd
27.2
a 27
.1a
26.1
a 38
.5d
34.0
b 36
.4c
26.7
a 27
.0a
26.1
a *
***
**
**
n.s.
*
*
[mL
/120
mg
DM
] 0.
610.
65
0.61
0.
650.
610.
650.
650.
610.
610.
610.
650.
61
Met
hane
con
cent
rati
on
20.1
19
.2
19.8
19
.8
18.9
19
.8
20.1
19
.0
19.4
19
.7
19.3
19
.7
***
n.s.
n.
s.
n.s.
n.
s.
n.s.
n.
s.
[%]
0.28
0.30
0.
28
0.30
0.28
0.30
0.30
0.28
0.28
0.28
0.30
0.28
Met
hane
pro
duct
ion
7.6
e 7.
0 cd
7.
3 de
5.
2a 4.
8a 5.
0a 7.
5e 6.
1b 6.
8c 5.
0a 4.
9a 4.
9a **
* **
* **
**
n.
s.
* *
[mL
/120
mg
DM
] 0.
150.
16
0.15
0.
160.
150.
160.
160.
150.
150.
150.
160.
15
1 fro
m th
ree-
way
AN
OV
A o
f T
reat
men
t (T
: CO
N, C
HE
, VA
L),
Con
cent
rate
(C
: wit
h or
wit
hout
hay
), E
xper
imen
t (E
: con
cent
rate
fed
in E
xper
imen
t 1 o
r 2)
and
thei
r in
tera
ctio
ns
2 abb
revi
atio
n: C
ON
= c
ontr
ol, C
HE
= c
hest
nut e
xtra
ct, V
AL
= v
alon
ea e
xtra
ct, D
M =
dry
mat
ter
* P
< 0
.05,
**
P <
0.0
1, *
** P
< 0
.001
, n.s
. non
-sig
nifi
cant
(P
> 0
.05)
a-
e In
case
of
sign
ific
ant i
nter
actio
n di
ffer
ent s
uper
scri
pts
diff
er (
P <
0.0
5)

Chapter 4 Study 3
92
Figure 1. Schedule of the experiments (R = respiration, B = balance) with sheep fed a hay-based diet and concentrates with different concentrations of tannin extracts (CON = control, without tannin extract; CHE = chestnut extract, VAL = valonea extract).
Period:
CON: continuing 'control' 'control' (all animals) CHE: initiating 'chestnut'
VAL: initiating 'valonea'
R1 R2 R3 R4 R5 R6 R7 R8 R9 R10 R11
B1 B2 B3
R1 R2 R3 R4 R5 R6 R7 R8
B1 B2 B3
183 190
adaptationallocation measurements
and one balance studyexperimental phase
-20 15 22 113 148
Expt. 2:
Feeding:
Expt. 1:
time [d]-48 -41 -34 -27 29 57 78 85-13 -6 1 8

Chapter 4 Study 3
93
Figure 2. Methane release (means and s.d., based on L/kg BW0.75, related to CON=100%) for both experiments during experimental phase.
* significant (P<0.05) different to CON, statistical analysis within each measuring time
0
80
90
100
110
d1 d8 d15 d29 d57 d85 d113 d148 d1900
80
90
100
110
CHEVAL
at allocation
Experiment 1
Experiment 2
days after initial tannin supply
Met
hane
rele
ase
in %
com
pare
d to
CO
N
*


Chapter 5 General Discussion
95
5. GENERAL DISCUSSION
In recent years, research on mitigating methane emission of ruminants and its contribution the global
warming has received considerable attention (Jayanegara et al., 2012). According to Beauchemin et al.
(2008), ruminant livestock produce annually ~80 million tons of methane, which accounts for ~28% of
anthropogenic emission. Methane emissions represent a loss of dietary energy for the animal. Thus,
reducing methane release would on the one hand decrease ruminants impact on global warming and on
the other improve their feed efficiency and performance. In the last few decades, numerous additives
have been investigated in vitro and in vivo, which has revealed many promising opportunities to
increase profitability by reducing methane release from ruminants (Beauchemin et al., 2009; Eckard et
al., 2010; Patra and Saxena, 2009).
Since the legislation of European Union has prohibited the use of growth-promoting antibiotics such
as monensin, scientific interest in alternatives to manipulate rumen fermentation has increased (EC,
2003; Newbold, 2007). Several in vitro based screenings with plant extracts have been conducted
(Bodas et al., 2008; Busquet et al., 2005; Selje et al., 2007). Such in vitro studies are recommended as
within a short period of time many test substances can be investigated precisely under well controlled
conditions. This approach was therefore applied in the current project to find adequate alternatives to
reduce rumen methanogenesis.
In the following sections a comparison of the effects of monensin and tannin extracts obtained in the
Hohenheim Gas Test and Rusitec experiments is made. Moreover, results obtained in the Hohenheim
Gas Test, Rusitec and sheep experiments are then compared. Finally, the compatibility of efforts
reducing rumen methanogenesis and maintaining the efficiency of microbial protein synthesis is
discussed.

Chapter 5 General Discussion
96
5.1. COMPARISON OF IN VITRO STUDIES
Hohenheim Gas Test
One of the objectives of the current studies was to investigate the effect of monensin supplementation
to different silages (grass silage with and without concentrate, and maize silage) on the production of
total gas, methane and VFA using the Hohenheim Gas Test (Study 1). Additionally, several tannin
extracts and monomers of rapeseed tannin were screened for their methane reduction potential based
on grass silage using the same technique (Study 2). In both approaches finding the maximal methane
reduction without adverse effects on total gas production was intended. Subsequently, tannin extracts
were ranked according to their methane reduction potential.
Monensin inclusion resulted in a maximum methane reduction of 17, 10, and 13% for grass silage,
grass silage with concentrate and maize silage, respectively, without adverse effects on total gas
production. These results demonstrate that monensin is able to reduce methane production under in
vitro conditions without negative effects on total gas production. In short-term batch cultures like the
Hohenheim Gas Test, total gas production is a good indicator of rumen fermentation (Rymer et al.,
2005). Even some of the investigated tannin extracts when supplemented to grass silage based diets
showed the potential to reduce methane production by 8 to 28% and without adverse effects on total
gas production. The donor animals, their feeding, the in vitro protocol and the batch of grass silage
used in both experiments were identical.
Results from the Hohenheim Gas Test (Figure D1) showed that several tannin extracts can cause a
similar or even greater effect on reducing methane production than monensin. These results contradict
findings observed by Hassanat and Benchaar (2012). They studied the influences of increasing
dosages (20 to 200 g/kg) of acacia, quebracho, chestnut and valonea extract supplemented to a total
mixed ration on total gas and methane production compared with monensin (10 mg/L) or an untreated
control. Despite the fact that a different in vitro method was used and a decline in total gas production
was reported, in the study of Hassanat and Benchaar (2012) it was evident that monensin decreased
methane production to a greater extent than any of the tannin treatments. In the study of Min et al.
(2005), monensin and tannin treatments reduced methane production in vitro to a similar extent
(~46%), whereas the total gas production was decreased to a greater extent in the monensin than the
tannin treatment. Differences across these studies may be caused by different in vitro protocols used.
Furthermore, another explanation could be that these differences may due to different origins of tannin
extracts and the extraction methods used. This may explain the different composition of tannin
extracts analysed in the latter studies compared to tannin composition analysed in the present study. In
contrast to the present study, the chestnut and valonea extract used by Hassanat and Benchaar (2012)
also contained condensed tannins. Finally, it is also likely that the different results could be due to the
different substrates incubated across these studies (total mixed ration, wheat forage from pasture and

Chapter 5 General Discussion
97
grass silage). Other influences, as pointed out by Boguhn et al. (2012), can be related to differences in
methodological procedures and donor animals or their feeding. Moreover, it appears that these
discrepancies across the studies could be caused by different rumen pH values or different pH values
of rumen fluid adjusted in in vitro incubations (Cardozo et al., 2005).
Figure D1. Comparison of monensin and tannin extracts supplemented to 120 mg grass silage with regard to their effect on methane production (methane reduction expressed as difference to the respective control, based on results obtained using the Hohenheim Gas Test, Study 1 and 2).
Figure D1 illustrates also a wide range within dosages required to cause a reduction in methane
production by 8 to 28%. To enable a direct comparison of the efficacy of these compounds to reduce
methane production, the dosages needed to cause a methane reduction by 10% was calculated
(Figure D2). This demonstrates that none of the tannin extracts had an efficacy with regard to the
amount of feed additive needed to suppress rumen methanogenesis in vitro such as monensin.
Compared to any of the tannin treatments the dosage of monensin needed to reduce methane
production to a similar extent was more than 3000 times lower.
The fact, that higher dosages of tannin extracts are required to produce the same reduction in methane
production as monensin indicates that the use of monomers of these tannin extracts should be
considered in further investigations. It has previously been reviewed that monomers of tannins (e.g.
pyrogallol, gallic and tannic acid) are toxic for methanogens (Scalbert, 1991). The results of the
monomers of rapeseed tannin investigated in the present study were not convincing. This it probably
due to the fact these monomers are typical basic units of condensed tannins of rapeseed (Naczk et al.,
1998), whereas chestnut, myrabolan, sumach and valonea extract used in the present study consisted
only of hydrolysable tannins. Grape seed extract consisted solely of 14% of the DM of condensed
tannins.

Chapter 5 General Discussion
98
monen
sin
grape
seed
myr
abola
n
valo
nea oak
ches
tnut
quebra
cho
sum
ach
mim
osa
coco
a
0.001
0.011
1015
do
sag
e (m
g/1
20 m
g g
rass
sila
ge)
Figure D2. Dosage of monensin and tannin extracts supplemented to 120 mg grass silage needed to reduce methane production by 10% (calculations based on results obtained using Hohenheim Gas Test, Study 1 and 2).
As previously mentioned, one of the main reasons to explain the discrepancy between different studies
in the effect of tannins on methane reduction is the differences in diet incubated in vitro or fed to the
animals. The experiments in the present study were based on one batch of grass silage. Thus, it
remains open to question as to what extent these results can be extrapolated to other substrates. Even
between several batches of grass silage a degree of variation in chemical and therefore their nutritional
value can be expected (Deutsche Landwirtschafts - Gesellschaft, 1997). Therefore, further
investigations should be conducted to investigate the effect of different substrates. It remains
interesting whether different batches of grass silage, different silages or forages supplemented with
concentrates would result in the same extent of methane reduction and in a similar ranking of tannin
extracts as reported here.
The tannin extracts that were investigated in the Rusitec were also analysed for their total and tannin
phenol concentration. This allows a comparison of the results obtained in the Hohenheim Gas Test
screening and whether it is possible in further screening approaches to predict an effect on methane
production based on their total or tannin phenol concentration. Therefore, a correlation -determined by
linear regression- of the maximal methane reductions obtained from the Hohenheim Gas Test
screening and the total phenols (a) and tannin phenols (b) of five tannin extracts supplemented to
120 mg grass silage was made (Figure D3). A close relationship between total phenols supplemented
to 120 mg grass silage and the resulting methane reduction was found (a, R2 = 0.90). For tannin
phenols a slightly lower relationship was determined (b, R2 = 0.88).

Chapter 5 General Discussion
99
0 10 20 30 400
10
20
30
y = 0.56x - 11.53R² = 0.90Sy.x = 2.47
total phenols (mg/ 120 mg grass silage)
met
han
e re
du
ctio
n (
%)
0 5 10 15 20 250
10
20
30
y = 0.66x - 11.46R² = 0.88Sy.x = 2.65
tannin phenols (mg/ 120 mg grass silage)
met
han
e re
du
ctio
n (
%)
(b)(a)
Figure D3. Relationship between the maximal methane reduction without adverse effect on total gas production observed in the Hohenheim Gas Test and the amounts of total phenols (a) and tannin phenols (b) supplemented to 120 mg grass silage. Taking this approach one step further, it raises the question as to whether the analysis of tannin
extracts for their total and tannin phenols concentration can be used as a first step for further pre-
selection investigations. Figure D4 represents the relationship between the maximal methane reduction
and total (a) and tannin phenols (b) concentration. Despite an obviously unrealistic total phenol
concentration analysed in grape seed extract (122% of DM, discussed in Study 2), a relatively close
relationship (R2 = 0.67) between total phenol concentration and the maximal methane reduction was
found. A considerably more favourable relationship was found between the tannin phenol
concentration and the reduction in methane production, with an R² = 0.79. This clearly shows that the
reduction in methane production is dependent on the total or tannin phenols concentration in the tannin
extract. Although the quantitative input of total or tannin phenols was closer (Figure D3), the analysed
concentrations of total and tannin phenols can be used with an acceptable accuracy to assess the
potential to reduce methane production in vitro.
0 50 100 1500
10
20
30
y = 0.18x + 5.52R² = 0.67Sy.x = 4.44
total phenols in tannin extracts (%)
met
han
e re
du
ctio
n (
%)
0 50 100 1500
10
20
30
y = 0.25x + 3.07R² = 0.79Sy.x = 3.52
tannin phenols in tannin extracts (%)
met
han
e re
du
ctio
n (
%)
(a) (b)
Figure D4. Relationship between the maximal methane reduction without adverse effect on total gas production observed in the Hohenheim Gas Test and the concentration of total phenols (a) and tannin phenols (b) analysed in tannin extracts.

Chapter 5 General Discussion
100
As shown in Figure D3 (b) several tannin extracts supplemented at a similar dosage (3.2 to 4.0 mg
tannin phenols) to grass silage caused a reduction in methane production of 11 to 17%. This probably
indicates that the tannin phenols of these three tannin extracts may have a different composition,
which is responsible for the different reductions observed in methane production.
Rumen simulation technique
The objectives of the Rusitec experiments were to study the effects of monensin and tannin extract
supplementation on the production of carbon dioxide (in the case of monensin total gas production),
methane, and VFA; the degradation of nutrients and the microbial protein synthesis when grass silage
(in the case of monensin: with or without concentrate) was incubated as the basal ration.
Different ratios of substrate to liquid in the Hohenheim Gas Test and the Rusitec eliminate an
extrapolation of dosages of monensin and tannin extracts used in the Hohenheim Gas Test to Rusitec.
Therefore pre-tests were conducted to determine the concentration required to cause effects on the
production of total gas or carbon dioxide and methane. Furthermore, an evaluation of dosages as
conducted in the Hohenheim Gas Test experiments was not carried out. In the Rusitec system the
inclusion of monensin to grass silage reduced total gas production (expressed as mL/g degraded
organic matter, OM) by up to 9% (Study 1), whereas the supplementation of chestnut, sumach and
valonea extracts reduced the production of carbon dioxide by 31, 25 and 25%, respectively. Compared
to the respective control, monensin, chestnut, valonea, sumach and grape seed reduced methane
production by 22, 65, 35, 29 and 24% (Study 2). A comparison of the effects of monensin and tannin
extract supplementation illustrates that some tannin extracts had greater effects on total gas and
methane production than monensin. This also confirmed observations made in the Hohenheim Gas
Test experiments.
The main effects consistently observed with monensin in in vitro and in vivo experiments are
decreased acetate production associated with concomitantly increased propionate production, and
modified microbial protein synthesis (Schelling, 1984; Van Nevel, 1996). This was confirmed in both
experiments with monensin in the present study. In contrast to monensin, none of the investigated
tannin extracts in the present study increased propionate production. Acetate production was only
reduced when chestnut extract was supplemented, whereas the production of total VFA was reduced
by monensin and chestnut extract. This suggests that monensin and the tannin extracts used have
different modes of action to inhibit methane production. Monensin is known to inhibit protozoa and
Gram-positive bacteria and to reduce feed intake (Poos et al., 1979), whereas the reduction in methane
production caused by tannins is probably in part due to a reduced hydrogen availability as
consequence of a reduced fibre degradation in the rumen (Hook et al., 2010).

Chapter 5 General Discussion
101
Based on the in vitro approach, tannin extracts do not have the propionate enhancing property like
monensin (Richardson et al., 1976). But through their reduction in methane production tannins may
improve feed efficiency by a reduced loss of feed energy. As indicated by both in vitro approaches in
the present study, tannins may have a greater potential to reduce methane emission of ruminants
compared to monensin.
Monensin and tannin extracts affected degradation of DM and OM. The lower degradation observed
for tannin extracts could be due to the fact that the tannin extracts per se are less degradable by rumen
microbes then the grass silage (Makkar et al., 1995b). The degradation of NDF and ADF was reduced
by monensin and tannin extracts, which may indicate that the fibrolytic bacteria were inhibited in both
cases. Thus, it can be speculated that the achieved reduction in methane production was partly due to a
decline in fibre degradation and supports the hypothesis that lower hydrogen availability led to the
reduced methane production in the rumen (Bodas et al., 2008). Monensin and tannin supplementation
also resulted in a reduced CP degradation, which is in line with the reduced concentration of ammonia
in the effluent (excepting myrabolan). During CP degradation, in addition to branched-chain fatty
acids, acetate and butyrate are produced (Tamminga, 1979). Thus, CP degradation can, to a lesser
degree than fibre fractions, also increase rumen methanogenesis. In multiple regression equations to
calculate the methane energy of cattle and sheep, often the digestible CP is considered in addition to
crude fibre and nitrogen free extract (Schiemann et al., 1971). Due to the fact that the CP degradation
was more affected than the degradation of fibre fractions, it is possible that the observed methane
reduction was mainly caused through decreased CP degradation.

Chapter 5 General Discussion
102
5.2. COMPARISON OF IN VITRO AND IN VIVO STUDIES
The aim of the in vitro screening using the Hohenheim Gas Test was to find promising tannin
substances by increasing their dosages individually to cause their maximal methane reduction without
adverse effects on total gas production (Study 2). In a second step the most promising tannin extracts
were investigated in more detail using the Rusitec (Study 2). The Rusitec approach delivers more
parameters than the Hohenheim Gas Test, and therefore can be considered a more comprehensive
assessment. Compared to a simple and easy to perform batch culture like the Hohenheim Gas Test, the
assessment based on more traits is more difficult. In Rusitec, chestnut and valonea extract showed the
greatest reductions in methane production compared to the other treatments. Whereas both tannin
extracts decreased the degradation of NDF and ADF, only chestnut extract showed adverse effects on
carbon dioxide and VFA production. In contrast to the Hohenheim Gas Test, in the Rusitec study
tannin dosages were not investigated to determine the optimal dose to reduce methane production
without an adverse effect on other parameters. Thus, based on the results, chestnut and valonea were
selected for further long-term investigations in vivo (Study 3).
It is well-known that an extrapolation of in vitro results to in vivo conditions should be handled with
care. Therefore, in the following section the in vitro effects on methane production are compared with
results observed in vivo. In the literature, it was often demonstrated that positive effects obtained in
vitro could not be confirmed in vivo (Roth, 2003; Waghorn and Shelton, 1997). Therefore, possible
reasons for differences in the methane reducing effects between approaches are discussed.
Dosages and pre-tests
In the Hohenheim Gas Test screening, the tannin dosages were increased to achieve a maximal
methane reduction, starting with 5 and 10% of the diet. Neither in the Rusitec study nor in both in vivo
experiments were tannin dosages adapted as was the case in the Hohenheim Gas Test screening.
Therefore, the results observed in the Rusitec study and the in vivo experiments did not represent the
maximal methane reduction potential in the respective method. Due to different ratios of liquid to solid
phase a transfer of dosages from the Hohenheim Gas Test to Rusitec or from Rusitec to the in vivo
experiments was not possible. Therefore, for the Rusitec study and the in vivo experiments pre-tests
were required to provide an initial impression of the effective tannin dosages required.
For the Rusitec study, the pre-test was conducted with grape seed extract which, based on the
manufacturers information, was the most purified tannin extract. In the pre-test different amounts
(0.05, 0.10, 0.20, 0.40, 0.60, 0.80, 1.00, 1.25, 1.50, 1.75 and 2.00 g per vessel, n = 1) of grape seed
extract were supplemented to 15 g grass silage. Parameters investigated were total gas, methane,
NH3N production and OM degradation. The final dosage was chosen based on the results obtained for
methane production and OM degradation, which decreased (not statistically analysed) with increasing
dosage. At this time the exact composition of the other tannin extracts was still unknown. Therefore,

Chapter 5 General Discussion
103
to stay on the safe side with regard to a possible overdosage, a tannin dosage of 1.50 and not 2.00 g
per 15 g grass silage was fixed for the Rusitec approach.
The dosages used in the in vivo experiments were also chosen based on a pre-test. In that case, dosages
of up to 5% chestnut extract of the diet were stepwise tested for only a few days in sheep. The
deciding parameter in this case was feed intake, because for tannins an astringent taste is often
described (Lamy et al., 2011). With increasing tannin dosage, feed intake was reduced. The sheep fed
with 5% chestnut extract in the diet stopped eating immediately, indicating that this dosage was
definitely too high. To omit detrimental effects due to long-term feeding of chestnut and valonea
extract, the tannin dosages were chosen as 25 g tannin extract/100 kg BW as, based on toxicological
studies, this dosage was considered as being harmless (Hervás et al., 2003). Based on the actual BW of
the sheep a tannin dosage of 1.6% of the diet (0.9 g/kg BW0.75) for chestnut and valonea extract was
applied. In the second in vivo experiment this dosage was doubled to 3.1% of the diet
(1.7 g/kg BW0.75).
Explanation for different effects on methane
The tannin dosages used in vivo (1.6 and 3.1% of the diet) were very low compared with those in the
in vitro experiments. During the Hohenheim Gas Test screening, chestnut and valonea extract were
supplemented at 5% of the diet (6 mg to 120 mg of grass silage) which decreased methane production
by 14 and 17%, respectively. Supplementation of 10% chestnut and valonea extract of the diet (1.5 g
to 15 g of grass silage) in the Rusitec decreased methane production by 63 and 35%, respectively. In
the first in vivo experiment, on the first day the supplementation of chestnut and valonea extract
caused a non-significant decrease in methane release (based on L/kg BW0.75) of 3.9 and 2.9%, and
across all respiration measurements a decrease of 2.5 and 1.5%, respectively. In the second
experiment, in which the tannin dosage was doubled, on day 1 a non-significant reduction in methane
release was observed of 7.2 and 8.2% for chestnut and valonea extract, respectively. Across all
respiration measurements in the second experiment chestnut and valonea extract decreased methane
release by 2.5 and 4.6% (both not significant).
An explanation why the methane release was not or only little affected compared to the in vitro results
could be the dilution of tannin extracts by saliva and water intake, and thereby increasing their outflow
from the rumen. A complete degradation of tannin extracts in the rumen can be excluded due to their
long-lasting effect on nitrogen excretion. To omit a washout from the rumen in further studies,
measures should be developed to increase the retention in the rumen, where methanogenesis occurs.
Promising approaches could be limiting the access to water during feed intake or to achieve a more
stable mix using carrier substances. Even the use of release capsules as for monensin could represent a
solution to increase the retention time of tannins in the rumen.

Chapter 5 General Discussion
104
Compared to the Hohenheim Gas Test results, tannin extracts in the Rusitec showed a greater impact
on methane production. This may be due on the one hand to the higher tannin dosage (10 vs. 5% of
DM) and on other hand to methodical differences between both in vitro approaches. For example in
the Hohenheim Gas Test a ratio between substrate and rumen liquid of 12 mg/mL is used. In the
Rusitec this ratio is more than three times higher at 37.5 mg/mL. The tannin dosage was also greater in
the Rusitec than in the Hohenheim Gas Test (0.6 mg/mL vs. 3.75 mg/mL). Finally, the values
observed in the Hohenheim Gas Test and the Rusitec were obtained over different periods of time,
24 h vs 8 d (after 7 d of adaption), respectively. But with both in vitro approaches a higher methane
reduction was observed compared to both in vivo experiments. Even though not significant in both in
vivo experiments a numeric reduction in methane release was observed, to a greater extent in the
second experiment that investigated the higher tannin dosage.
In general, in vitro studies are suitable for screening numerous test substances towards their effect on
rumen fermentation. There are several reasons for their practicability. First their use allows
investigations under laboratory conditions. Depending on the methodical protocol often several
repetitions are needed for statistical analysis. Furthermore, they are relatively cheap and can be carried
out quickly. There are also some studies that demonstrated that in vitro batch culture can accurately
estimate methane emission in vivo (Bhatta et al., 2007; Blümmel et al., 2005). For example Bhatta et
al. (2007) compared the methane release from five different diets in Holstein cows measured using the
sulphur hexafluoride (SF6) tracer gas technique with the two in vitro techniques as used in the present
study. They found that the methane production estimated by Hohenheim Gas Test was very close to
that measured based on SF6 technique (R² < 0.98), whereas those estimated by Rusitec had a low
correlation (R² < 0.20). But this study also showed that these results highly depend on the diets
incubated. The alfalfa hay used by Bhatta et al. (2007) contained a high CP concentration (190 g/kg
DM) compared with the other diets (maize silage, Italian ryegrass hay, rice straw, sudan grass hay).
They assumed that this resulted in the relatively low correlation when all five diets were considered
(R² < 0.75) compared with the correlation when all diets except alfalfa hay were considered
(R² < 0.98).
In comparison to in vivo studies, there are also some differences or limitations which may be
responsible for the different effects on methanogenesis among the experiments of the present study.
For example, in in vitro studies finely ground feed is used. The animal-to-animal variation which is
not existent in vitro, even when inoculum of different animals is used, can create difficulties in
separating treatment from random effects in in vivo studies (Storm et al., 2012). Even if these are
probably only partly responsible for the discrepancies in methane production between studies, in vitro
studies usually only reproduce effects of rumen fermentation and not digestibility and whole animal
emission (Storm et al., 2012). Therefore, it is conceivable that a decreased rumen methane release can
partly be compensated by methane originated from cecum and colon (Van Nevel, 1996). Furthermore,
Chapter 5 General Discussion
105
the longer the in vitro incubation lasts the more does the microbial population move further away from
the initial population in vivo. For example, Bogaert et al. (1990) reported that all large ciliate protozoa
disappear from Rusitec vessels within the first 8 days.
It remains unclear whether the selection process described previously will result in the same findings
when other diets or another batch of grass silage is used. In Study 2, it was concluded that the two in
vitro techniques led to different rankings. Based on the findings of Bhatta et al. (2007) as mentioned
before, it is assumed that the Hohenheim Gas Test is more suitable to predict methane release than the
Rusitec. In principle, a comparison between Hohenheim Gas Test and respiration measurements
should be conducted in future investigation to examine whether both approaches will result in the
same effects of tannin extracts. If this is the case, subsequently it should be clarified what measures are
needed to improve the transferability to short and longer term effects in vivo.
When arriving at a point where conflicting results among in vitro studies were obtained, Klevenhusen
et al. (2012) supposed that results of a meta-analysis may explain responses in vivo. Based on this
study it remains questionable whether meta-analyses based on in vitro experiments can fully replace
animal studies. As this study shows, it appears that in vitro methods cannot reproduce in vivo
responses with enough precision and certainly not their long-term effects on animals’ metabolism.
Jayanegara et al. (2012) conducted a meta-analysis using several in vitro batch cultures and in vivo
experiments with the focus on methane mitigation using tannins. In their analysis it appears that in
vitro batch cultures are able to reproduce in vivo changes in methane release up to a level of 100 g
tannins/kg DM, whereas with higher tannin dosages (>60 g/kg) significant decreases in feed intake
have been reported (Bhatta et al., 2002). Jayanegara et al. (2012) suggested that these in vitro batch
cultures cannot predict the longer term effect on methane release of tannin feeding. Thus, often it is
concluded that promising substances should be investigated for a greater period of time in vivo, as
done in the present study, to determine their long-term effect (Abdalla et al., 2012; Hook et al., 2010;
Jayanegara et al., 2012).
The current in vitro studies were performed with grass silage alone. Thus, the in vitro studies were not
able to reproduce accurately the effects of in vivo conditions, where a concentrate-hay diet was fed to
sheep. It is known that silages may have higher degradation rates in the rumen compared to hay
(Aufrère et al., 2000) and that may have influenced the results. Feeding hay instead of grass silage was
done to omit feed variation during the long-term respiration experiment. Concentrates were added to
the diet firstly to fulfil the energy requirements of the wethers and secondly to achieve a higher
feeding level as would be the case if only hay was fed. It is known that an increased feeding level is
accompanied with an increase in methane release, because more fermentable substrates (in this case
concentrates) are available in the rumen (Murray et al., 1978). Therefore, a higher effect on methane
release was expected, but it is possible that a washout through water intake and saliva as mentioned

Chapter 5 General Discussion
106
previously reduced these effects. Additionally as discussed in Study 3, partly degradation of
hydrolysable tannins in the rumen by anaerobic ruminal bacteria as demonstrated by Nelson et al.
(1995) is possible.
Another point, which may explain the differences between the in vitro and in vivo results may be
ascribed to different animals used in both approaches. Whereas in vitro two non-lactating cows were
used as donor animals, the in vivo trials were conducted with wethers. There are studies that
demonstrated that different species of donor animals have great influence for in vitro approaches
(Boguhn et al., 2012; Rymer et al., 2005). This might mean that donor species, which had already had
an influence on the in vitro approaches, could possibly also have caused also some of the differences.
Additionally, the concentrates used in both in vivo experiments were also incubated with or without
hay using the Hohenheim Gas Test. The incubation of concentrate alone the first in vivo experiment
resulted in decreased methane production by 7.9% (P ≤ 0.05) and 3.9% (P > 0.05) for chestnut and
valonea extract. Combined with hay, chestnut and valonea extract reduced methane production by 7.7
and 3.8% (both P > 0.05), respectively. When the concentrate used in the second in vivo experiment
was incubated using the Hohenheim Gas Test, chestnut and valonea extract resulted in a decline of
methane production by 18.7 and 9.3% (both P ≤ 0.05), respectively. When the concentrate was
combined with hay only a non-significant decrease by 2% was observed for both tannin extracts. This
may also indicate that the tannin dosages were not sufficient to reproduce inhibitory effects of methane
production in vitro.

Chapter 5 General Discussion
107
5.3. IMPACTS ON MICROBIAL PROTEIN SYNTHESIS, UNDEGRADABLE PROTEIN
AND MICROBIAL FRACTIONS
The microbial protein which arrives at the duodenum is essential for the protein supply of ruminants
and is closely related to energy intake (Clark et al., 1992). Rumen microbes mainly use energy
occurring from the fermentation of carbohydrates (Hungate, 1966). In addition, for an optimal
microbial growth an adequate nitrogen supply from degradable protein and non-protein-nitrogen
originating from feed and recycled nitrogen is required. As pointed out by Bach et al. (2005), it is also
important to create a synchrony of available nitrogen and fermentable carbohydrates. In a study by
Sinclair et al. (1995), a synchronous and an asynchronous diet, according to the hourly release of
nitrogen, were fed in four equal portions per day to sheep. In that study the efficiency of microbial
protein synthesis was increased by 11 to 20% when sheep received the synchronous diet compared to
sheep fed the asynchronous diet. Any approach that aims at modifying methane formation in the
rumen through a modification of the microbial community should therefore also consider potential
effects on microbial yield. Therefore, the following sections aim to discuss monensin and tannin
effects on methane formation and microbial protein synthesis, and in the in case of tannins their effects
on rumen undegradable protein. In a latter section their impacts on microbial fractions are discussed.
Microbial protein synthesis
Monensin
Animal studies investigating the effects of monensin on microbial protein synthesis together with
methane release are not available to the best of the authors’ knowledge. Monensin used in ruminant
nutrition is known to reduce feed intake, without adverse effects on BW gain, resulting in an improved
feed efficiency (Nagaraja et al., 1997). Monensin also reduced ammonia concentration in the rumen
(Poos et al., 1979). This was also observed in the Rusitec experiment in the present study, in which
monensin inclusion to grass silage combined with or without concentrates resulted in a significant
decrease in ammonia production. According to Ghorbani et al. (2008), this decreasing effect does not
need to have negative effects on microbial protein synthesis. In that study, two monensin treatments
were used in a 2x3 design with total mixed rations differing in their CP concentration. Although
ammonia concentration was reduced, urinary allantoin excretion was unaffected by monensin
supplementation. This indicates that the microbial protein synthesis was also unaffected by monensin
supplementation.
In the Rusitec experiment used in the present study, monensin inclusion to grass silage with and
without concentrates increased microbial protein synthesis (Study 1). These results are in contradiction
to a Rusitec study based on hay and barley (Jalč and Lauková, 2002), in which microbial protein
synthesis was unaffected by monensin inclusion. In vitro effects of monensin on the efficiency of
microbial protein synthesis in the literature examined in Rusitec are inconsistent. Reported effects

Chapter 5 General Discussion
108
ranged from a decrease of 16% (Jalč and Certik, 2005), to no effects (Stanier and Davies, 1981), and
an increase of 24% (Jalč et al., 1992; Wallace et al., 1981). For grass silage combined with or without
concentrates the Rusitec experiment in the present study demonstrated that monensin inclusion
resulted in a reduced methane production up to 24% without adverse effects on efficiency of microbial
protein synthesis. In addition to different methods used to measure microbial protein synthesis or
differing methodical protocols such as different donor animals (discussed in Study 1), the
discrepancies across these Rusitec studies can also be explained by the different diets incubated. For
example, there are indications from literature (Chamberlain et al., 1976), which suggest that the
inclusion of concentrates could lead to a reduced microbial protein synthesis. In that study a high
content of concentrates in the diet reduced microbial protein synthesis of sheep, which indicates that
these effects were due to lower pH values in the rumen. Across these Rusitec studies a relationship
between pH and the effect on microbial protein synthesis could not be found.
Investigations with steers demonstrated that microbial protein synthesis was reduced by monensin
supplementation to high fibre diets and brewers dried grains, whereas the undegradable protein was
increased (Faulkner et al., 1985; Poos et al., 1979). Reveneau et al. (2012) hypothesized that the
combination of monensin and coconut oil or animal-vegetable fat to a total mixed ration fed to dairy
cows can improve the efficiency of microbial protein synthesis. Although not significant, the
supplementation of monensin to a total mixed ration led to a numerically higher efficiency of
microbial protein synthesis by 24% (Reveneau et al., 2012). The combination of monensin with each
of the two fat types did not, however, increase the efficiency of microbial protein synthesis.
In addition to the inconsistent results with respect to microbial protein synthesis, effects of monensin
on methane release of animals are also variable. Because monensin reduces methane production in
vitro, it is often used as positive control in in vitro approaches used to screen alternatives to
manipulate rumen fermentation (e.g. García-González et al., 2008; Selje et al., 2007). Van Nevel
(1996) reviewed inter alia the effect of monensin on rumen methanogenesis. In this review the author
pointed out that the effect on methane production is related to its dosage and to the substrate incubated
or ration fed to animals. Across several in vitro studies, the inhibitory effect on methane production
ranged from 9 to 69%, but there were no information about the effects on rumen fermentation (Van
Nevel, 1996). In this review, there was also an overview given to the in vivo effects on monensin on
methane release. Effects observed in investigations with sheep and steers ranged from 0 to 31% (Van
Nevel, 1996). The monensin effects on methane release reported in literature varied with respect to
extent and persistence of the effects from transient (Carmean and Johnson, 1990) to long-lasting (6
months, Odongo et al., 2007). In the latter study monensin supplementation caused a decrease in
methane release by 7 to 9% over the entire treatment period (Odongo et al., 2007), however no
significant differences in the number and diversity of methanogens were found in same experiment
(Hook et al., 2009). Thus, it is likely that the microbial protein synthesis was also unchanged by

Chapter 5 General Discussion
109
monensin supplementation. The latter study also confirmed previous assumptions that monensin is
able to reduce methane release indirectly by a reduced feed intake and therefore less substrate for
rumen methanogens (Hook et al., 2010; O'Kelly and Spiers, 1992).
The in vitro and in vivo studies mentioned previously suggested that effects on efficiency of microbial
protein synthesis may occur when monensin is supplemented to animal diets. Because no systematic
pattern could be seen when monensin affected microbial protein synthesis or its efficiency, further
investigations with monensin should include objectives to examine its effects on microbial protein
synthesis, bearing in mind that the effects of monensin on methane release are probably not caused by
a direct effect on rumen methanogens. Moreover it remains open why the methane reducing effect of
monensin is heterogeneous across animal studies.
Tannins
In contrast to monensin, investigations with tannins have used different tannin rich plants or tannin
extracts from differing plant origins. In order of this respect it is difficult to make accurate
comparisons. Information about tannin effects on microbial protein synthesis is scarce, with existing
studies with tannins producing inconsistent results. Some in vitro and in vivo studies have
demonstrated that tannin supplementation can increase microbial protein synthesis (Bhatta et al., 2001;
Lima et al., 2011; Makkar et al., 1995a). In contrast, Carulla et al. (2005) reported that the
supplementation of acacia extract to sheep led to a reduction in methane release and a decrease in
urinary allantoin excretion, indicating that microbial protein synthesis was also lower. Based on an in
vitro study using the Hohenheim Gas Test, Getachew et al. (2001) suggested that tannin-containing
browses can be used to improve the efficiency of microbial protein synthesis, which probably result
from a better synchronisation of energy availability and nitrogen degradability.
As shown in Study 2, the microbial protein synthesis recorded in the Rusitec was not influenced by
tannin supplementation. As mentioned previously, the ammonia concentration was probably still
sufficient for microbial protein synthesis. In the present studies, the results observed in vivo are in line
with those in vitro. In Study 3, it was speculated that the tannin dosages used were too high to improve
the efficiency of microbial protein synthesis or that the estimation from urinary purine derivatives
excretion was not sensitive enough to detect small differences in microbial protein synthesis in vivo.
Min et al. (2002) showed in a study with sheep fed Lotus corniculatus that the population of some
proteolytic bacteria was reduced, whereas microbial protein synthesis and its outflow to the abomasum
were unaffected. This suggests that feeding tannins protects soluble plant protein in the rumen and that
this bypass protein is partly available for absorption in the small intestine, which may explain the shift
in nitrogen excretion from urine to faeces observed in both in vivo experiments. In contrast to the
observed alteration in methane release by tannin supplementation, the effect on nitrogen excretion was
persistent over the whole experimental period.

Chapter 5 General Discussion
110
The efficiency of microbial protein synthesis was not altered by tannin supplementation. In the in vivo
experiments of the present study no negative impact on microbial protein synthesis was observed, but
even no effect on methane release. Strategies for tannin substances that reduce methane release and
microbial protein synthesis, as was the case in the study of Carulla et al. (2005), should be developed
in order to maintain their reducing effect on methane and to eliminate the effect on microbial protein
synthesis. One approach could be a stepwise decrease of tannin dosage to find a maximal methane
reduction without negative effects on the animals’ metabolism measured using respiration and balance
periods.
There are studies that have examined several approaches to reduce ruminal methanogenesis without
feed additives such as tannins or monensin and are compatible with maintaining the efficiency of
microbial protein synthesis in vivo. For example, Lima et al. (2011) investigated the feeding value of
fresh or ensiled mixtures of sorghum-soybean forage in sheep. In that study sorghum and soybean
harvested during the Cuban rainy season were ensiled for up to 182 days. Compared to freshly
harvested sorghum and soybean forage, silage increased the efficiency of microbial protein synthesis
by 43% and reduced methane emission of sheep by 40%. Furthermore, Chanthakhoun (2011) reported
that the supplementation of legume hay (Phaseolus calcaratus, 2.8% condensed tannins) to rice straw
fed to swamp buffalo reduced methane emission by 9%, whereas microbial protein synthesis was
increased by 30%. The efficiency of microbial protein synthesis was unaffected in that study.
To summarize, deficits in nitrogen would inhibit bacterial growth, but in most situations CP
degradation in the rumen creates more ammonia than rumen microbes need (Russell et al., 1992). The
in vitro and in vivo experiments in the present study showed that the tannin extracts used did not have
adverse effects on the efficiency of microbial protein synthesis. If effects on microbial protein
synthesis are expected based on in vitro observation, further balance investigations with animals
should be included whenever possible to ensure a comprehensive assessment of the methane reducing
substances. Based on these results of the present study and other results mentioned in the literature, it
is suggested that the compatibility of reducing rumen methanogenesis and maintaining the efficiency
of microbial community do not have to necessarily be mutually exclusive.
Undegradable Protein
Because CP is one of the most expensive ingredients in ruminant diets some detailed remarks are
given to effects of tannins on undegradable protein. The supplementation of tannin extracts to grass
silage incubated in the Rusitec resulted, with exception of chestnut extract, in a reduction in CP
degradation by up to 8%. In both in vivo experiments, the supplementation of chestnut and valonea
extract led to a decrease in CP digestibility by up to 17%, with the greatest extent for chestnut extract.
Generally, this supports the Rusitec results. For chestnut extract, no significant decrease in CP
Chapter 5 General Discussion
111
degradation was observed in vitro, although, its supplementation resulted in the greatest decrease in
ammonia. With regard to the numerically higher microbial protein originating from solid associated
microbes it becomes clear that the higher CP degradation compared to other tannin treatments was due
to the correction for the contribution by solid associated microbes (Study 2). The reduced CP
degradation supports the hypothesis, that tannin supplementation to the ration protects protein against
rumen degradation. In general, this protection is more effective for CP than for substances such as
cellulose, hemicellulose, pectin, and minerals. This was reflected in the in vivo experiments in the
present study, in which only small effects on nutrient digestibility except CP were found. Digestibility
of DM and OM was only reduced at the lower tannin dosage. In contrast, the tannin supplementation
to grass silage in the Rusitec also resulted in a reduction in DM, OM, NDF and ADF degradation. As
mentioned in Study 2, it is possible that the decreases in DM and OM degradation in vitro was due to
the different amount of OM weighed in the vessels through the supplementation of the tannin extracts,
which consists mainly of OM.
Microbial fractions
In the Rusitec experiments of the present study, microbial protein synthesis was unchanged by
monensin as well as by tannin extract supplementation to grass silage. In both cases the microbial
protein of liquid associated microbes was higher than for solid associated microbes. Based on their
results obtained in a Rusitec study with monensin, Wallace et al. (1981) pointed out that solid
associated microbes cannot be ignored when estimating microbial protein synthesis. The author
mentioned that exceptionally low microbial yields obtained in Stanier and Davies (1981) are probably
due to an underestimation of microbial protein synthesis. In the study of Wallace et al. (1981) the
microbial protein synthesis was estimated by direct counts. The authors reported that monensin
inclusion at 2, 10 and 50 mg per vessel to a mixed ration based on hay and bruised barley increased
the number of liquid associated microbes, whereas the number of solid associated microbes was
decreased. Statistical data were not presented in the latter study (Wallace et al., 1981). The present
study confirmed the indications made by Wallace et al. (1981). Monensin inclusion at 2 and 4 mg per
vessel to grass silage and grass silage combined with concentrate led to an increase microbial protein
originating from liquid associated microbes. In both diets, solid associated microbes were inhibited by
monensin inclusion. These results are in line with the increased propionate production and decreased
acetate production accompanied by decreased fiber degradation mentioned previously, because more
nonstructural soluble carbohydrates are metabolized to propionate by liquid associated microbes,
whereas the enzymes to degrade plant cell-wall polysaccharides are produced in greater abundance by
solid associated microbes (Legay-Carmier and Bauchart, 1989).
Chapter 5 General Discussion
112
Whereas monensin inclusion had a different influence on liquid and solid associated microbes, the
supplementation of tannin extracts had no influence on either fraction. Although not significant, for all
tannin extracts supplemented to grass silage a lower microbial protein synthesis originating from
liquid associated microbes was observed, whereas the microbial protein from solid associated
microbes was increased by tannin extract supplementation, except for grape seed extract.

Chapter 5 General Discussion
113
REFERENCES
used in chapter 5
Abdalla, A. L., H. Louvandini, S. M. A. H. Sallam, I. C. S. da Bueno, S. M. Tsai, and A. V. O. de Figueira. 2012. In vitro evaluation, in vivo quantification, and microbial diversity studies of nutritional strategies for reducing enteric methane production. Tropical Animal Health and Production 44:953-964.
Aufrère, J., D. Graviou, R. Baumont, A. Detour, and C. Demarquilly. 2000. Degradation in the rumen of proteins from fresh lucerne forage in various stages of growth and conserved as silage or hay. Animal Research 49:461-474.
Bach, A., S. Calsamiglia, and M. D. Stern. 2005. Nitrogen metabolism in the rumen. Journal of Dairy Science. 88 Suppl 1:E9-21.
Beauchemin, K. A., M. Kreuzer, F. O'Mara, and T. A. McAllister. 2008. Nutritional management for enteric methane abatement: A review. Australian Journal of Experimental Agriculture 48:21-27.
Beauchemin, K. A., T. A. McAllister, and S. M. McGinn. 2009. Dietary mitigation of enteric methane from cattle. CAB Reviews: Perspectives in Agriculture, Veterinary Science, Nutrition and Natural Resources 4:1-18.
Bhatta, R., U. Krishnamoorthy, and F. Mohammed. 2001. Effect of tamarind (Tamarindus indica) seed husk tannins on in vitro rumen fermentation. Animal Feed Science and Technology 90:143-152.
Bhatta, R., A. K. Shinde, S. Vaithiyanathan, S. K. Sankhyan, and D. L. Verma. 2002. Effect of polyethylene glycol-6000 on nutrient intake, digestion and growth of kids browsing Prosopis cineraria. Animal Feed Science and Technology 101:45-54.
Bhatta, R., K. Tajima, N. Takusari, K. Higuchi, O. Enishi, and M. Kurihara. 2007. Comparison of in vivo and in vitro techniques for methane production from ruminant diets. Asian-Australasian Journal of Animal Sciences 20:1049-1056.
Blümmel, M., D. I. Givens, and A. R. Moss. 2005. Comparison of methane produced by straw fed sheep in open-circuit respiration with methane predicted by fermentation characteristics measured by an in vitro gas procedure. Animal Feed Science and Technology 123–124, Part 1:379-390.
Bodas, R., S. López, M. Fernández, R. García-González, A. B. Rodríguez, R. J. Wallace, and J. S. González. 2008. In vitro screening of the potential of numerous plant species as antimethanogenic feed additives for ruminants. Animal Feed Science and Technology 145:245-258.
Bogaert, C., J. P. Jouany, and G. Jeminet. 1990. Effects of the ionophore antibiotics monensin, monensin-propionate, abierixin and calcimycin on ruminal fermentations in vitro (Rusitec). Animal Feed Science and Technology 28:183-197.
Boguhn, J., T. Zuber, and M. Rodehutscord. 2012. Effect of donor animals and their diet on in vitro nutrient degradation and microbial protein synthesis using grass and corn silages. Journal of Animal Physiology and Animal Nutrition (In Press).
Busquet, M., S. Calsamiglia, A. Ferret, and C. Kamel. 2005. Screening for effects of plant extracts and active compounds of plants on dairy cattle rumen microbial fermentation in a continuous culture system. Animal Feed Science and Technology 123-124 PART 2:597-613.
Chapter 5 General Discussion
114
Cardozo, P. W., S. Calsamiglia, A. Ferret, and C. Kamel. 2005. Screening for the effects of natural plant extracts at different pH on in vitro rumen microbial fermentation of a high-concentrate diet for beef cattle. Journal of Animal Science 83:2572-2579.
Carmean, B. R. and D. E. Johnson. 1990. Persistence of monensin-induced changes in methane emissions and ruminal protozoa numbers in cattle. Journal of Animal Science 65:517.
Carulla, J. E., M. Kreuzer, A. Machmüller, and H. D. Hess. 2005. Supplementation of Acacia mearnsii tannins decreases methanogenesis and urinary nitrogen in forage-fed sheep. Australian Journal of Agricultural Research 56:961-970.
Chamberlain, D. G., P. C. Thomas, and A. G. Wilson. 1976. Efficiency of bacterial protein synthesis in the rumen of sheep receiving a diet of sugar beet pulp and barley. Journal of the Science of Food and Agriculture 27:231-238.
Chanthakhoun, V., M. Wanapat, C. Wachirapakorn, and S. Wanapat. 2011. Effect of legume (Phaseolus calcaratus) hay supplementation on rumen microorganisms, fermentation and nutrient digestibility in swamp buffalo. Livestock Science 140:17-23.
Clark, J. H., T. H. Klusmeyer, and M. R. Cameron. 1992. Microbial protein synthesis and flows of nitrogen fractions to the duodenum of dairy cows. Journal of Dairy Science 75:2304-2323.
Deutsche Landwirtschafts - Gesellschaft. 1997. Futterwerttabellen Wiederkäuer. Vol. 7. DLG - Verlag, Frankfurt, Germany.
EC. 2003. Regulation (EC) No 1831/2003 of the European Parliament and of the council of 22 September 2003 on additives for use in animal nutrition. Official Journal of the European Union, http://irmm.jrc.ec.europa.eu/SiteCollectionDocuments/EC-1831-2003.pdf (accessed on 30 April 2012).
Eckard, R. J., C. Grainger, and C. A. M. de Klein. 2010. Options for the abatement of methane and nitrous oxide from ruminant production: A review. Livestock Science 130:47-56.
Faulkner, D. B., T. J. Klopfenstein, T. N. Trotter, and R. A. Britton. 1985. Monensin effects on digestibility, ruminal protein escape and microbial protein synthesis on high-fiber diets. Journal of Animal Science 61:654-660.
García-González, R., S. López, M. Fernández, and J. S. González. 2008. Dose-response effects of Rheum officinale root and Frangula alnus bark on ruminal methane production in vitro. Animal Feed Science and Technology 145:319-334.
Getachew, G., H. P. S. Makkar, and K. Becker. 2001. Method of polyethylene glycol application to tannin-containing browses to improve microbial fermentation and efficiency of microbial protein synthesis from tannin-containing browses. Animal Feed Science and Technology 92:51-57.
Ghorbani, B., T. Ghoorchi, H. Amanlou, and S. Zerehdaran. 2008. Effects of monensin and increasing crude protein in early lactation on performance of dairy cows. Pakistan Journal of Biological Sciences 11:1669-1675.
Hassanat, F. and C. Benchaar. 2012. Assessment of the effect of condensed (acacia and quebracho) and hydrolysable (chestnut and valonea) tannins on rumen fermentation and methane production in vitro. Journal of the Science of Food and Agriculture (In press).
Hervás, G., V. Pérez, F. J. Giráldez, A. R. Mantecón, M. M. Almar, and P. Frutos. 2003. Intoxication of sheep with quebracho tannin extract. Journal of Comparative Pathology 129:44-54.

Chapter 5 General Discussion
115
Hook, S. E., K. S. Northwood, A.-D. G. Wright, and B. W. McBride. 2009. Long-term monensin supplementation does not significantly affect the quantity or diversity of methanogens in the rumen of the lactating dairy cow. Applied and Environmental Microbiology 75:374-380.
Hook, S. E., A. D. G. Wright, and B. W. McBride. 2010. Methanogens: Methane producers of the rumen and mitigation strategies. Archaea 2010:1-11.
Hungate, E. R. 1966. The rumen and its microbes. Acadamic Press, NewYork, London.
Jalč, D., M. Baran, T. Vendrák, and P. Siroka. 1992. Effect of monensin on fermentation of hay and wheat bran investigated by the Rumen Simulation Technique (Rusitec). 1. Basal parameters of fermentation. Archiv für Tierernährung 42:147-152.
Jalč, D. and M. Certik. 2005. Effect of microbial oil, monensin and fumarate on rumen fermentation in artificial rumen. Czech Journal of Animal Science, 50:467-472.
Jalč, D. and A. Lauková. 2002. Effect of nisin and monensin on rumen fermentation in artificial rumen. Berliner und Münchener Tierärztliche Wochenschrift 115:6-10.
Jayanegara, A., F. Leiber, and M. Kreuzer. 2012. Meta-analysis of the relationship between dietary tannin level and methane formation in ruminants from in vivo and in vitro experiments. Journal of Animal Physiology and Animal Nutrition 96:365-375.
Klevenhusen, F., A. Muro-Reyes, R. Khiaosa-ard, B. U. Metzler-Zebeli, and Q. Zebeli. 2012. A meta-analysis of effects of chemical composition of incubated diet and bioactive compounds on in vitro ruminal fermentation. Animal Feed Science and Technology.
Lamy, E., H. Rawel, F. J. Schweigert, F. C. E. Silva, A. Ferreira, A. R. Costa, C. Antunes, A. M. Almeida, A. V. Coelho, and E. Sales-Baptista. 2011. The effect of tannins on mediterranean ruminant ingestive behavior: The role of the oral cavity. Molecules 16:2766-2784.
Legay-Carmier, F. and D. Bauchart. 1989. Distribution of bacteria in the rumen contents of dairy cows given a diet supplemented with soya-bean oil. British Journal of Nutrition 61:725-740.
Lima, R., R. F. Díaz, A. Castro, and V. Fievez. 2011. Digestibility, methane production and nitrogen balance in sheep fed ensiled or fresh mixtures of sorghum-soybean forage. Livestock Science 141:36-46.
Makkar, H. P., M. Blummel, and K. Becker. 1995a. In vitro effects of and interactions between tannins and saponins and fate of tannins in the rumen. Journal of the Science of Food and Agriculture 69:481-493.
Makkar, H. P. S., K. Becker, H. Abel, and C. Szegletti. 1995b. Degradation of condensed tannins by rumen microbes exposed to quebracho tannins (QT) in rumen simulation technique (RUSITEC) and effects of QT on fermentative processes in the RUSITEC. Journal of the Science of Food and Agriculture 69:495-500.
Min, B. R., G. T. Attwood, K. Reilly, W. Sun, J. S. Peters, T. N. Barry, and W. C. McNabb. 2002. Lotus corniculatus condensed tannins decrease in vivo populations of proteolytic bacteria and affect nitrogen metabolism in the rumen of sheep. Canadian Journal of Microbiology 48:911-921.
Min, B. R., W. E. Pinchak, J. D. Fulford, and R. Puchala. 2005. Effect of feed additives on in vitro and in vivo rumen characteristics and frothy bloat dynamics in steers grazing wheat pasture. Animal Feed Science and Technology 123–124, Part 2:615-629.
Murray, R. M., A. M. Bryant, and R. A. Leng. 1978. Methane production in the rumen and lower gut of sheep given lucerne chaff: effect of level of intake. British Journal of Nutrition 39:337-345.

Chapter 5 General Discussion
116
Naczk, M., R. Amarowicz, A. Sullivan, and F. Shahidi. 1998. Current research developments on polyphenolics of rapeseed/canola: A review. Food Chemistry 62:489-502.
Nagaraja, T. G., C. J. Newbold, C. J. Van Nevel, and D. I. Demeyer. 1997. Manipulation of ruminal fermentation. Page 748 in The rumen microbial ecosystem. P. N. Hobson and C. S. Stewart, ed. Springer Netherlands, Weinheim.
Nelson, K. E., A. N. Pell, P. Schofield, and S. Zinder. 1995. Isolation and characterization of an anaerobic ruminal bacterium capable of degrading hydrolyzable tannins. Applied and Environmental Microbiology 61:3293-3298.
Newbold, C. J. 2007. New products for rumen manipulation. British Journal of Nutrition 98:15-16.
O'Kelly, J. and W. Spiers. 1992. Effect of monensin on methane and heat productions of steers fed lucerne hay either ad libitum or at the rate of 250 g/hour. Australian Journal of Agricultural Research 43:1789-1793.
Odongo, N. E., R. Bagg, G. Vessie, P. Dick, M. M. Or-Rashid, S. E. Hook, J. T. Gray, E. Kebreab, J. France, and B. W. McBride. 2007. Long-term effects of feeding monensin on methane production in lactating dairy cows. Journal of Dairy Science 90:1781-1788.
Patra, A. K. and J. Saxena. 2009. Dietary phytochemicals as rumen modifiers: A review of the effects on microbial populations. Antonie van Leeuwenhoek, International Journal of General and Molecular Microbiology 96:363-375.
Poos, M. I., T. L. Hanson, and T. J. Klopfenstein. 1979. Monensin effects on diet digestibility, ruminal protein bypass and microbial protein synthesis. Journal of Animal Science 48:1516-1524.
Reveneau, C., S. K. R. Karnati, E. R. Oelker, and J. L. Firkins. 2012. Interaction of unsaturated fat or coconut oil with monensin in lactating dairy cows fed 12 times daily. I. Protozoal abundance, nutrient digestibility, and microbial protein flow to the omasum. Journal of Dairy Science 95:2046-2060.
Richardson, L. F., A. P. Raun, E. L. Potter, C. O. Cooley, and R. P. Rathmacher. 1976. Effect of Monensin on Rumen Fermentation in Vitro and in Vivo. Journal of Animal Science 43:657-664.
Roth, S. 2003. Reducing methane emission and optimising N-supply in ruminants by treating feeds with tannins. Doctoral thesis, University of Hohenheim.
Russell, J. B., J. D. O'Connor, D. G. Fox, P. J. Van Soest, and C. J. Sniffen. 1992. A net carbohydrate and protein system for evaluating cattle diets: I. Ruminal fermentation. Journal of Animal Science 70:3551-3561.
Rymer, C., J. A. Huntington, B. A. Williams, and D. I. Givens. 2005. In vitro cumulative gas production techniques: History, methodological considerations and challenges. Animal Feed Science and Technology 123-124 Part 1:9-30.
Scalbert, A. 1991. Antimicrobial properties of tannins. Phytochemistry 30:3875-3883.
Schelling, G. T. 1984. Monensin mode of action in the rumen. Journal of Animal Science 58:1518-1527.
Schiemann, R., K. Nehring, L. Hoffmann, W. Jentsch, and A. Chudy. 1971. Energetische Futterbewertung und Energienormen. VEB Deutscher Landwirtschaftsverlag, Berlin.
Selje, N., E. M. Hoffmann, S. Muetzel, R. Ningrat, R. J. Wallace, and K. Becker. 2007. Results of a screening programme to identify plants or plant extracts that inhibit ruminal protein degradation. British Journal of Nutrition 98:45-53.

Chapter 5 General Discussion
117
Sinclair, L. A., P. C. Garnsworthy, J. R. Newbold, and P. J. Buttery. 1995. Effects of synchronizing the rate of dietary energy and nitrogen release in diets with a similar carbohydrate composition on rumen fermentation and microbial protein synthesis in sheep. Journal of Agricultural Science 124:463-472.
Stanier, G. and A. Davies. 1981. Effects of the antibiotic monensin and an inhibitor of methanogenesis on in vitro continuous rumen fermentations. British Journal of Nutrition 45:567-578.
Storm, I. M. L. D., A. L. F. Hellwing, N. I. Nielsen, and J. Madsen. 2012. Methods for measuring and estimating methane emission from ruminants. Animals 2:160-183.
Tamminga, S. 1979. Protein degradation in the forestomachs of ruminants. Journal of Animal Science 49:1615-1630.
Van Nevel, C. J. 1996. Control of rumen methanogenesis. Environmental Monitoring and Assessment 42:73-97.
Waghorn, G. C. and I. D. Shelton. 1997. Effect of condensed tannins in Lotus corniculatus on the nutritive value of pasture for sheep. Journal of Agricultural Science 128:365-372.
Wallace, R. J., J. W. Czerkawski, and G. Breckenridge. 1981. Effect of monensin on the fermentation of basal rations in the Rumen Simulation Technique (Rusitec). British Journal of Nutrition 46:131-148.


Chapter 6 General conclusions and outlook
119
6. GENERAL CONCLUSIONS AND OUTLOOK
Hohenheim Gas Test and Rusitec experiments showed that monensin inclusion to silage led to
reductions in the production of total gas, methane, and acetate, accompanied by increased propionate
production. In contrast to studies using hay-based diets, supplementation of monensin to grass silage
with or without concentrate, increased microbial protein synthesis. The results obtained in the
Hohenheim Gas Test suggest that monensin is able to reduce methane production; however, there is
only a narrow range to reduce methane production without adverse effects on rumen fermentation.
In the screening of tannin substances using the Hohenheim Gas Test, nine of ten tannin extracts and
two monomers of rapeseed tannin were able to decrease methane production without affecting in vitro
fermentation. Furthermore, Rusitec results confirmed the greatest potential of chestnut and valonea
extract to reduce methane production in vitro, without negative effects on microbial protein synthesis.
In both long-term experiments with sheep, chestnut and valonea extract affected rumen fermentation,
but failed to reduce methane release. The methane reducing potential of both extracts obtained in vitro
could therefore not be confirmed in vivo. However, a further increase in tannin dosage could have
possibly led to detrimental effects on feed intake and digestibility of OM and detergent fibre fractions.
It is recommended to combine respiration studies, whenever possible with balance studies. This allows
a more comprehensive evaluation of products which may be suitable to reduce methane production in
the rumen. Based on the short-term reduction in methane release observed immediately following
tannin feeding, strategies should be established to overcome adaptation of rumen microbes. For
example, it is conceivable to increase the retention time of tannins in the rumen or to use different
tannin extracts and other methane mitigating substances in a rotation or combination.
There are indications from literature, which showed that the Hohenheim Gas Test is more useful to
predict animal responses than the Rusitec. Thus, a methodical approach should be conducted to
compare directly the Hohenhein Gas Test and the Rusitec with respiration measurements. In this case,
it is recommended to obtain rumen fluid and solids for the in vitro studies from animals that are
simultaneously used in the respiration experiments. The investigation should then be conducted in
parallel, based on the same diets. Alternatively, rumen fluid of animals on diets containing tannins
could be used as inoculum. This approach would probably clarify questions that remained in the
present study. For example, if all methods come to the same ranking of tannin extracts regarding their
methane reduction potential, the Hohenheim Gas Test would be preferred because of its easy handling
compared to Rusitec and in vivo studies.
Thereafter, it should be clarified what measures are required to improve in vitro methods for a better
estimation of longer-term effects in vivo. The present study showed that both in vitro systems were not
Chapter 6 General conclusions and outlook
120
able to reproduce the in vivo methane production effects of chestnut and valonea extract with enough
precision.
Based on in vitro experiments reported in the present study, higher dosages of tannin extracts are
required to cause a similar effect on methane production as monensin. Thus, the use of their monomers
can be advantageous and should be considered in further investigations. The investigated monomers of
the rapeseed tannin -typical basic units of condensed tannins- were not convincing on their effects to
reduce methane production. Most of the tannin extracts selected in the present study consisted mainly
of hydrolysable tannins.
Although both tannin extracts are regarded as being hydrolysable, their degradation in the rumen as
often mentioned in the literature, could not be proved or disproved. The shift in nitrogen excretion
observed when feeding tannins could have a positive effect on the environment due to the lowered
urinary nitrogen excretion resulting in a decline in ammonia emission.

Chapter 7 Summary
121
7. SUMMARY
Ruminants increasingly attract public concern due to their methane release and contribution to the
greenhouse effect. One strategy to reduce the release of methane is to modify microbial fermentation
in the rumen by the use of feed additives such as monensin and tannin extracts. However, other
characteristics of fermentation including the synthesis of microbial protein may also be affected. The
aim of the present studies was to provide a comprehensive evaluation of the effects of monensin and
tannin extracts on ruminal fermentation and methane production.
The ionophore monensin is known to increase feed efficiency in ruminants. Although the use of
silages is common practice in cattle feeding, the effects of monensin on the fermentation of silages in
the rumen and microbial protein synthesis are lacking. Monensin has often been described to have
indirect effects on methane production resulting from its effects on feed intake, protozoa and Gram-
positive bacteria. It has rarely been studied whether monensin can reduce methane production without
adverse effects on other criteria of rumen fermentation. The first objective therefore was to investigate
the effects of different dosages of monensin on methane production and microbial protein synthesis
when supplemented to different silages in two in vitro systems (Study 1). In Experiment 1 of Study 1,
15 g of oven-dried grass silage alone or combined with a concentrate was incubated in a rumen
simulation (Rusitec) over a period of 13 d to examine the effects of monensin supplementation (2 or 4
mg/d, n = 4) on the production of total gas, methane, volatile fatty acids (VFA), degradation of
nutrients and microbial protein synthesis. In Experiment 2 of Study 1, different dosages of monensin
(0.5, 1, 2, 6 and 10 µg) were supplemented to syringes containing 120 mg of grass silage alone, grass
silage combined with concentrates, or maize silage alone. After 24 h of incubation the effects of
monensin on total gas, methane and VFA production were determined. In Experiment 1 monensin
inclusion to grass silage and grass silage combined with concentrate resulted in a decreased total gas,
methane and acetate production, while propionate production was increased. Along with a decreased
degradation of crude protein, ammonia concentration in the system was reduced. While microbial
protein originating from solid associated microbes decreased with monensin inclusion, microbial
protein from liquid associated microbes was increased, resulting in an increase in total microbial
protein synthesis. In Experiment 2, different dosages of monensin reduced methane production in
grass silage (17%), grass silage combined with concentrate (10%) and maize silage (13%) without
adverse effects on total gas production. Based on these two in vitro experiments it was concluded that
monensin is able to reduce methane production without a major decrease in total gas and VFA
production and degradation of organic matter. Although microbial fractions were differently affected,
the total microbial protein synthesis was increased upon monensin supplementation.
Tannins are secondary plant compounds that are known to complex with feed and microbial proteins.
Several products from this heterogeneous group have shown potential to affect rumen fermentation in

Chapter 7 Summary
122
vivo and, even more, in vitro, but are often accompanied by negative effects on digestibility, feed
intake and microbial protein synthesis. In Study 2 of the present work, ten tannin extracts (chestnut,
mimosa, myrabolan, quebracho, sumach, tara, valonea, oak, cocoa and grape seed) and four monomers
of rapeseed tannin (pelargonidin, catechin, cyanidin and sinapinic acid) were screened in grass silage
based diets in successive runs using the Hohenheim Gas Test. The objective was to determine the
optimal dosage of each tannin extract to cause a maximal methane reduction without negative effects
on total gas production. Whereas the supplementation of pelargonidin and cyanidin to grass silage did
not reduce methane production; catechin and sinapinic acid reduced methane production without
affecting total gas production. Except tara extract, all tannin extracts reduced methane production by 8
to 28% without adverse effects on total gas production. Based on these results, chestnut, grape seed,
myrabolan, sumach and valonea extract were investigated in a second step in a Rusitec to determine
their effects on degradation of nutrients, VFA and ammonia production, and particularly on microbial
protein synthesis. All tannin extracts were supplemented at similar dosages of 1.5 g to 15 g of grass
silage. The supplementation of chestnut resulted in the greatest decrease in methane production (63%),
followed by valonea (35%), grape seed (23%), sumach (18%), and myrabolan (7%; not significantly
different from the control). While chestnut extract reduced acetate production by 19%,
supplementation with grape seed or myrabolan extract increased acetate production; however,
degradation of fibre fractions was reduced in all tannin treatments. Degradation of dry and organic
matter was reduced by all tannin extracts, but there were no differences between tannin treatments.
Crude protein degradation and ammonia production were also reduced by tannin extract
supplementation. Microbial protein synthesis and its efficiency were not affected by tannin
supplementation, which indicates that a reduction in methane production due to tannin extract
supplementation is possible without negatively affecting microbial protein synthesis.
Chestnut and valonea extract had the greatest potential in reducing methane production without
negative effects on rumen fermentation of grass silage and microbial protein synthesis. Therefore,
these tannin extracts were investigated for their long-term effects in sheep (Study 3). In Experiment 1
of Study 3, sheep receiving the control, chestnut or valonea treatment (each n = 4) were fed 842 g/d of
hay (fresh weight). The animals on the control treatment also received 464 g/d of concentrate, and
animals on the tannin treatments received the same amount of concentrate but were also fed 20 g of
the respective tannin extract. Following initiation of tannin feeding, methane release from sheep was
measured in 23.5 h intervals in respiration chambers on day 1, 8, 15, 29, 57, 85, 113, 148, and 190. In
three balances periods faeces and urine were collected for 6 and 3 days, respectively. Effects on
nutrient digestibility, nitrogen and energy metabolism were evaluated, with microbial protein synthesis
estimated from the urinary excretion of purine derivatives. Based on the results of Experiment 1, a
second experiment was conducted four month after the start of Experiment 1. Experiment 2 had the
same study design and data collected, but the dosage of tannin extracts was doubled compared to
Experiment 1 (0.9 vs. 1.7 g tannin extract/kg body weight) and the duration was shorter (85 days). Hay

Chapter 7 Summary
123
and concentrates used in both experiments were also evaluated using the Hohenheim Gas for their
effects on total gas and methane production. In both experiments, methane release was not
significantly reduced by tannin extract supplementation when analysed over the whole experimental
period. In Experiment 1 the supplementation of chestnut extract on day 190 resulted in a reduced
methane release. In both experiments, on day 1 a numeric reduction in methane release for the tannin
treatments was observed, with a greater reduction recorded for the higher dosage used in Experiment
2. This trend disappeared by day 57. In the third balance period of Experiment 1, digestibility of dry
and organic matter was reduced by tannin supplementation. The digestibility of crude protein was
reduced in both experiments, whereas the digestibility of fibre fractions was not influenced. In both
experiments a long-lasting shift in nitrogen excretion from urine to faeces was observed, which
occurred to a greater extent in Experiment 2. The urinary excretion of purine derivatives was not
significantly affected by tannin supplementation, indicating that the microbial protein synthesis was
not altered in either experiment. The in vitro methane production was reduced for concentrates
containing tannin extracts, but it was not significantly affected when concentrates were incubated with
hay.
It is concluded that monensin added to different silages caused a decrease in methane production
without affecting total gas production but with an increased microbial protein synthesis. Nine of the
ten considered tannin extracts and two tannin monomers decreased methane production without
affecting total gas production. The Rusitec study confirmed the great potential of chestnut and valonea
extract to reduce methane production without negative effects on microbial protein synthesis.
However, neither chestnut nor valonea extract reduced the methane release in sheep when fed over a
longer period of time. It is assumed, that rumen microbes adapted to the tannin dosages in terms of
methane release but not nitrogen metabolism, as there were long-lasting effects on nitrogen excretion.
The shift in nitrogen excretion can have a positive effect on the environment due to the reduced
potential of ammonia emission from the urine. Both in vitro systems used in the present studies
showed effects of tannin extracts that were considerably different from those observed in sheep. The
monomers investigated in the present study are the basic units of condensed tannins, whereas the
tannin extracts selected in vitro only contain hydrolysable tannins. It is possible that monomers of
chestnut and valonea extract may reduce methane production, whereas higher dosages of these tannin
extracts cause negative effects on feed intake, digestibility and microbial protein synthesis. Further
investigations should focus systematically on the transfer of in vitro studies to estimate in vivo
responses. Therefore, a parallel implementation of different in vitro and respiration studies would be
of great value.


Chapter 8 Zusammenfassung
125
8. ZUSAMMENFASSUNG
Wiederkäuer stehen vermehrt im Fokus der Öffentlichkeit, was primär auf ihren Methanausstoß und
dem damit verbundenen Beitrag zur Emission von klimarelevanten Gasen zurückzuführen ist. Eine
mögliche Strategie, die mikrobielle Fermentation im Pansen mit Blick auf einen verringerten
Methanausstoß zu beeinflussen, stellt der Einsatz von Futterzusatzstoffen wie Monensin und
Tanninextrakten dar. Darüber hinaus können auch andere Fermentationsparameter neben der
mikrobiellen Proteinsynthese beeinflusst werden. Das Ziel der vorliegenden Studien war es, die
Effekte von Monensin und Tanninextrakten auf die Pansenfermentation umfassend zu bewerten.
Das Ionophor Monensin ist bekannt dafür, dass es die Futterverwertung von Wiederkäuern verbessern
kann. Obwohl der Einsatz von Silagen in der Wiederkäuerfütterung weit verbreitet ist, sind die Effekte
von Monensin auf die Pansenfermentation von Silagen und mikrobielle Proteinsynthese unbekannt.
Für Monensin wurden indirekte Effekte auf die Methanproduktion berichtet, was im Wesentlichen
durch Effekte auf Futteraufnahme, Protozoen und Gram-positive Bakterien erklärt wird. Darüber
hinaus gibt es kaum Untersuchungen dazu, ob Monensin in der Lage ist, die Methanproduktion zu
verringern ohne negative Effekte auf andere Fermentationsparameter zu haben. Ein Ziel dieser Arbeit
war es daher, die Wirkung unterschiedlicher Monensinzulagen zu verschiedenen Silagen auf die
Methanproduktion und mikrobielle Proteinsynthese in zwei in vitro Systemen zu untersuchen
(Studie 1). In Experiment 1 von Studie 1 wurden 15 g Grassilage (ofengetrocknet) allein oder
kombiniert mit Kraftfutter in einer Pansensimulation (Rusitec) über einen Zeitraum von 13 Tagen
inkubiert um die Effekte von Monensinzulagen (2 bzw. 4 mg/d, n = 4) auf die Gesamtgas- und
Methanproduktion, die Produktion kurzkettiger Fettsäuren (VFA), den Abbau der Nährstoffe sowie
die mikrobielle Proteinsynthese zu untersuchen. In Experiment 2 von Studie 1 wurden verschiedene
Monensinzulagen (0,5, 1, 2, 6 und 10 µg) zu Glaskolben mit 120 mg von Grassilage, Grassilage und
Kraftfutter oder Maissilage zugesetzt. Nach einer 24-stündigen Inkubation wurden die Effekte von
Monensin auf die Gesamtgas- und Methanproduktion sowie auf die Produktion von VFA bestimmt. In
Experiment 1 führte die Monensinzulage zu Grassilage und Grassilage kombiniert mit Kraftfutter zu
einer reduzierten Gesamtgas-, Methan- und Azetatproduktion, während die Propionatproduktion
gesteigert wurde. Einhergehend mit einem reduzierten Rohproteinabbau wurde auch die
Ammoniakkonzentration reduziert. Während die mikrobielle Proteinsynthese von Mikroben der festen
Phase durch die Monensinzulage reduziert wurde, wurde die von Mikroben aus der flüssigen Phase
gesteigert, was letztendlich zu einer gesteigerten Syntheseleistung mikrobiellen Proteins führte. In
Experiment 2 wurden verschiedene Monensinzulagen herausgearbeitet, welche die Methanproduktion
basierend auf Grassilage (17%) oder kombiniert mit Kraftfutter (10%) sowie für Maissilage (13%)
reduzierten, ohne nachteilige Effekte auf die Gesamtgasproduktion gehabt zu haben. Basierend auf
diesen beiden in vitro Experimenten konnte geschlussfolgert werden, dass Monensin in der Lage ist
die Methanproduktion zu verringern, ohne gleichzeitig die Gesamtgasproduktion, die Produktion von
Chapter 8 Zusammenfassung
126
VFA und den Abbau organischer Substanz zu reduzieren. Obwohl die Mikrobenfraktionen
unterschiedlich beeinflusst wurden, war die mikrobielle Proteinsynthese durch die Monensinzulage
erhöht.
Tannine, sekundäre Pflanzeninhaltsstoffe, sind bekannt dafür, dass sie Komplexe mit Futter- und
Mikrobenprotein eingehen. Verschiedene Vertreter dieser heterogenen Gruppe bewiesen bereits ein
großes Potenzial die Pansenfermentation in vivo und wesentlich öfter in vitro zu beeinflussen, oftmals
einhergehend mit negativen Effekten auf Verdaulichkeit, Futteraufnahme und mikrobielle
Proteinsynthese. In Studie 2 der vorliegenden Arbeit wurden zehn Tanninextrakte (Kastanien-,
Mimosa-, Myrabolan-, Quebracho-, Sumach-, Tara-, Valonea-, Eichen-, Kakao- und
Traubenkernextrakt) und vier Monomere des Rapstannins (Pelargonidin, Catechin, Cyanidin und
Sinapinsäure) unter Verwendung des Hohenheimer Futterwerttests auf Basis einer Grassilage in
aufeinanderfolgenden Durchgängen untersucht. Das Ziel war es, die optimale Dosierung eines jeden
Tanninextraktes zu finden, in der die Methanproduktion maximal reduziert wird, ohne jedoch die
Gesamtgasproduktion zu beeinflussen. Während die Zulagen von Pelargonidin und Cyanidin zu
120 mg Grassilage die Methanproduktion nicht verringerten, reduzierten Catechin und Sinapinsäure
die Methanproduktion ohne die Gesamtgasproduktion zu beeinflussen. Abgesehen von Taraextrakt,
reduzierten alle Tanninextrakte die Methanproduktion von 8 bis 28% ohne Auswirkungen auf die
Gesamtgasproduktion. Aufbauend auf diesen Ergebnissen wurden Kastanien-, Traubenkern-,
Myrabolan-, Sumach- und Valoneaextrakt in einem zweiten Schritt im Rusitec hinsichtlich ihrer
Effekte auf den Abbau der Nährstoffe und die Produktion von VFA und Ammonium und insbesondere
auf die mikrobielle Proteinsynthese untersucht. In diesem Ansatz wurden alle Tanninextrakte in
gleichen Dosierungen von 1,5 g zu 15 g Grassilage zugesetzt. Die Zulage von Kastanienextrakt führte
zur größten Reduktion in der Methanproduktion (63%), gefolgt von Valonea- (35%), Traubenkern-
(23%), Sumach- (18%), und Myrabolanextrakt (7%, nicht signifikant verschieden von der Kontrolle).
Während Kastanienextrakt die Azetatproduktion um 19% verringerte, führte die Zulage von
Traubenkern- und Myrabolanextrakt zu einer erhöhten Azetatproduktion; indessen war der Abbau der
Faserfraktionen in allen Tanninbehandlungen reduziert. Der Abbau der Trockenmasse und der
organischen Substanz war in allen Tanninbehandlungen reduziert, jedoch ohne Unterschiede zwischen
den einzelnen Tanninbehandlungen. Auch der Rohproteinabbau und die Ammoniumproduktion waren
durch die Tanninzulage reduziert. Die mikrobielle Proteinsynthese und die Effizienz der mikrobiellen
Proteinsynthese wurden durch die Tanninzulage nicht beeinflusst. Damit wurde deutlich, dass eine
Reduktion der Methanproduktion durch den Einsatz von Tanninen möglich ist, ohne die mikrobielle
Proteinsynthese zu beeinflussen.
Kastanien- und Valoneaextrakt zeigten das größte Potenzial die Methanproduktion zu reduzieren ohne
negative Effekte auf die Pansenfermentation von Grassilage und die mikrobielle Proteinsynthese zu
haben. Daher wurden diese Tanninextrakte hinsichtlich ihrer Langzeiteffekte an Schafen untersucht

Chapter 8 Zusammenfassung
127
(Studie 3). In Experiment 1 von Studie 3 erhielten die Schafe der Kontroll-, Kastanien- und
Valoneabehandlung (jeweils n = 4) jeweils 842 g/d Heu. Die Tiere der Kontrollbehandlung erhielten
zudem 464 g/d Kraftfutter. Die Tiere der Tanninbehandlungen erhielten die gleiche Menge an
Kraftfutter, jedoch zusätzlich 20 g des jeweiligen Tanninextraktes. Nach dem Beginn der
Tanninfütterung wurde der Methanausstoß der Schafe über einen Zeitraum von 23,5 Stunden an den
Tagen 1, 8, 15, 29, 57, 85, 113, 148 und 190 in Respirationskammer gemessen. In drei Bilanzperioden
wurden zudem Kot und Harn über 6 bzw. 3 Tage gesammelt, um etwaige Effekte auf die
Verdaulichkeit der Nährstoffe, den Stickstoff- und Energiestoffwechsel sowie auf die mikrobielle
Proteinsynthese - geschätzt durch die Ausscheidung von Purinderivaten im Harn - zu untersuchen.
Basierend auf den Ergebnissen von Experiment 1 wurde vier Monate nach dessen Beginn ein zweites
Experiment initiiert. In Experiment 2 wurden das gleiche Versuchsdesign zugrunde gelegt und die
gleichen Messungen durchgeführt, mit dem Unterschied, dass die Tanninzulage nahezu verdoppelt
wurde (0,9 vs. 1,7 g Tanninextrakt/kg Lebendmasse) und der Versuchszeitraum (85 Tage) verkürzt
wurde. Zusätzlich wurden das Heu und die Kraftfutter der drei Behandlungen aus beiden
Experimenten im Hohenheimer Futterwerttest hinsichtlich ihrer Effekte auf die Gesamtgas- und
Methanproduktion untersucht. In beiden Experimenten wurde der Methanausstoß - über den gesamten
Versuchszeitraum ausgewertet - nicht signifikant durch die Tanninzulage reduziert. In Experiment 1
führte die Zulage von Kastanienextrakt am Tag 190 zu einem reduzierten Methanausstoß. In beiden
Experimenten war von Tag 1 an eine numerische Verringerung des Methanausstoßes zu beobachten,
zu einem größeren Ausmaß in Experiment 2. Dieser Trend verschwand jedoch am Tag 57. In der
dritten Bilanz von Experiment 1 war die Verdaulichkeit der Trockenmasse und der organischen
Substanz durch die Tanninzulage verringert. Die Rohproteinverdaulichkeit war in beiden
Experimenten reduziert, während die Verdaulichkeit der Faserfraktionen unbeeinflusst blieb. In beiden
Experimenten konnte zudem eine langanhaltende Verschiebung in der Stickstoffausscheidung vom
Harn zum Kot beobachtet werden, im größeren Umfang in Experiment 2. Die Ausscheidung an
Purinderivaten über den Harn war hingegen nicht durch die Tanninzulagen beeinflusst, was indiziert,
dass auch die mikrobielle Proteinsynthese unbeeinflusst war. Die Methanproduktion in vitro war für
alle Kraftfutter mit Tanninextrakten reduziert, jedoch war die Methanproduktion nicht beeinflusst
wenn die Kraftfutter mit dem Heu kombiniert wurden.
Abschließend konnte geschlussfolgert werden, dass Monensin zugelegt zu verschiedenen Silagen, in
der Lage ist die in vitro Methanproduktion zu verringern, ohne negative Auswirkungen auf die
Gesamtgasproduktion und die mikrobielle Proteinsynthese zu haben. Neun der zehn untersuchten
Tanninextrakte und zwei Tanninmonomere waren ebenfalls in der Lage die Methanproduktion zu
reduzieren, ohne die Gesamtgasproduktion zu hemmen. Die Rusitec-Studie bestätigte das große
Methanreduktionspotenzial von Kastanien- und Valoneaextrakt bei einer unveränderten mikrobiellen
Proteinsynthese. Allerdings war weder Kastanien- noch Valoneaextrakt in der Lage den
Methanausstoß von Schafen über einen längeren Zeitraum zu reduzieren. Es wird vermutet, dass die
Chapter 8 Zusammenfassung
128
Pansenmikroben sich mit Blick auf den Methanausstoß an die Tanninextrakte angepasst haben, jedoch
nicht in Bezug auf den Stickstoffmetabolismus unter Berücksichtigung der langanhaltenden
Verschiebung in der Stickstoffausscheidung. Es ist denkbar, dass bedingt durch diese Verschiebung,
eine geringere Ammoniakfreisetzung aus dem Harn einen positiven Effekt auf die Umwelt haben
kann. Die beiden in vitro Systeme, die in dieser Studie zur Anwendung kamen, zeigten Tannineffekte,
die massiv von denen abwichen, die nicht oder nur teilweise an Schafen beobachtet werden konnten.
Die untersuchten Monomere stellen die Grundbausteine kondensierter Tannine dar, während die
Tanninextrakte, die in vitro herausgearbeitet wurden, zu den hydrolisierbaren Tanninen zählen. Es ist
möglich, dass Monomere des Kastanien- und Valoneaextraktes die Methanproduktion reduzieren
können, da bei höheren Dosierungen dieser Extrakte mit negativen Auswirkungen auf die
Futteraufnahme, Verdaulichkeit und mikrobielle Proteinsynthese zu rechnen ist. Weitere
Untersuchungen sollten darauf abzielen die Übertragbarkeit von in vitro Untersuchungen auf in vivo
Verhältnisse systematisch zu überprüfen. Daher wäre eine parallele Durchführung verschiedener in
vitro und Respirationsversuche von großem Wert.

LEBENSLAUF
Persönliche Daten
Name: Gerald Wischer
Geburtsdatum: 12.04.1983
Geburtsort: Haldensleben
Familienstand: verheiratet, 3 Kinder
Schulbildung
09/1989 – 07/1993 Grundschule „Am Weinhof“ Magdeburg
09/1993 – 07/2002 Heinrich-Heine-Gymnasium Haldensleben; Abschluss: Abitur
Werdegang
07/2002 – 04/2003 Zivildienst in der Lebenshilfe Ostfalen gGmbH in der WfB in Hundisburg
05/2003 – 09/2003 Mitarbeiter im Gruppendienst in der Lebenshilfe Ostfalen gGmbH in der WfB in Seehausen/ Börde
10/2003 – 09/2008 Studium der Agrarwissenschaften an der Martin Luther-Universität Halle-Wittenberg; Fachrichtung Nutztierwissenschaften; Abschluss: Diplomagraringenieur
10/2005 – 07/2006 Praktikum mit erfolgreicher Praktikantenprüfung im Beruf Landwirt in der Agrargenossenschaft Börde eG, Rottmersleben
02/2007 – 02/2008 Studentische Hilfskraft an der Professur für Tierernährung des Institutes für Agrar- und Ernährungswissenschaften der Martin Luther-Universität Halle-Wittenberg
10/2008 – 03/2012 Doktorand am Institut für Tierernährung der Universität Hohenheim
Gau-Odernheim, den 14.09.2012
Gerald Wischer

EIDESSTATTLICHE ERKLÄRUNG
Hiermit erkläre ich, dass ich die vorliegende Dissertation selbständig und nur unter der
Verwendung der angegebenen Literatur und Hilfsmittel angefertigt habe. Die Arbeit lag bisher in
gleicher oder ähnlicher Form keiner Prüfungsbehörde vor.
Gau-Odernheim, den 14.09.2012
Gerald Wischer
DANKSAGUNG
An dieser Stelle möchte ich allen Personen danken, die mich und meine Familie in der Zeit während
der Promotion unterstützt haben und so zum Gelingen dieser Arbeit beigetragen haben.
Mein ganz besonderer Dank gilt Prof. Dr. Markus Rodehutscord für die Überlassung dieses Themas,
seine professionelle Anleitung - auch nach meiner Zeit am Institut - und die vielen intensiven
Diskussionsrunden zusammen mit seinen Assistenten. Darüber hinaus möchte ich mich bei ihm für das
Engagement bedanken, welches ich und damit auch meine Familie seit dem Hauptstudium genossen
haben. Ohne das wäre dieser weitere Ausbildungsschritt kaum möglich gewesen.
Mein besonderer Dank gilt Dr. Jeannette Boguhn für die intensive Betreuung gerade in der ersten
Hälfte der Promotion. Ihre zuverlässige Unterstützung bei den Tier- aber vor allem bei den in vitro
Experimenten hat diese umfangreiche Studie erst ermöglicht.
Dr. Herbert Steingaß danke ich ganz herzlich für die stets offene Tür und seine Gesprächs- und
Diskussionsbereitschaft. Die freundschaftliche und inspirative Hilfestellung im Rahmen der
methodischen Weiterentwicklung des Rusitec und bei der Einarbeitung in die Respirationstechnik
habe ich sehr genossen. Seine skeptische Mimik und das „awa“ gegenüber gewagten Behauptungen
werden mir fehlen.
Des Weiteren bedanke ich mich ganz herzlich bei Dr. Margit Schollenberger und ihrem Team für die
hochprofessionelle Herangehensweise bei analytischen Fragen und Weiterentwicklungen vor allem im
Rahmen der Gassammlung und der Analyse der Tanninextrakte.
Die hohe wissenschaftliche Kompetenz dieser vier Personen habe ich sowohl in der experimentellen
Zeit als auch in der Zeit des Schreibens sehr geschätzt.
Für die Unterstützung bei der Analyse der Gasproben und Tanninextrakte möchte ich mich bei Helga
Terry Jara und Sibylle Rupp bedanken. Alex M. Greiling, Anita Specht, Susanne Stabenow und
Vincenzo Fanelli möchte ich für die unermüdliche und tapfere Hilfe bei den Tierversuchen danken,
insbesondere für das Einwiegen der abertausend Heu-Tüten. Dr. Karin Hartung gilt mein Dank für die
vertiefte Einführung in die Statistik und der Beantwortung der vielen Fragen. Des Weiteren möchte
ich mich bei Prof. Liam Sinclair für das Lektorat der Kapitel 1 und 5 - 7 bedanken.
Außerdem möchte ich mich bei allen Mitarbeitern und Doktoranden des Instituts für Tierernährung für
das freundschaftliche Arbeitsklima und die stetige Kooperations- und Hilfsbereitschaft bei den
Experimenten und der Laboranalyse bedanken. Ein herzlicher Dank geht an Bastian, Achim, Eugen,
Birgit, Silke, Nadja, Franzi, Tobias, Patricia und viele andere mehr für die schöne gemeinsame Zeit
am Institut.
Zu guter Letzt danke ich meiner Familie - meiner Frau Stefanie, meinen Kindern, meinen Eltern und
meinem Schwiegervater - für das hohe Maß an Geduld, Unterstützung und Flexibilität während meiner
gesamten Hochschulzeit. Meinem Opa Paul danke ich dafür, dass er bei mir recht frühzeitig das
Interesse an der Landwirtschaft geweckt hat. Ihnen sei diese Dissertation gewidmet.